146 31 graphing_calculators_part_2
34
MATH& 146 Lesson 31 Graphing Calculators Part 2 1
Transcript of 146 31 graphing_calculators_part_2
MATH& 146
Lesson 31
Graphing Calculators Part 2
1

Tests and Intervals on the
Graphing Calculator
Parameter Hypothesis Test
Confidence
Interval
p 1-PropZTest 1-PropZInt
p1 – p2 2-PropZTest 2-PropZInt
μ (mu) TTest TInterval
μd TTest TInterval
μ1 – μ2 2-SampleTTest 2-SampleTInt
2
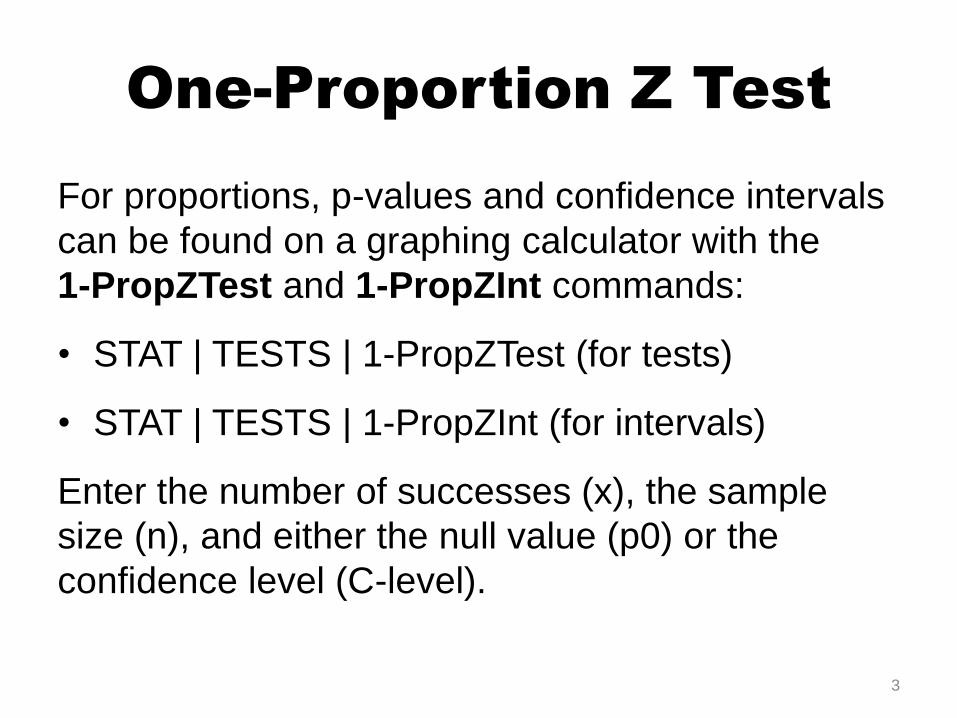
One-Proportion Z Test
For proportions, p-values and confidence intervals
can be found on a graphing calculator with the
1-PropZTest and 1-PropZInt commands:
• STAT | TESTS | 1-PropZTest (for tests)
• STAT | TESTS | 1-PropZInt (for intervals)
Enter the number of successes (x), the sample
size (n), and either the null value (p0) or the
confidence level (C-level).
3
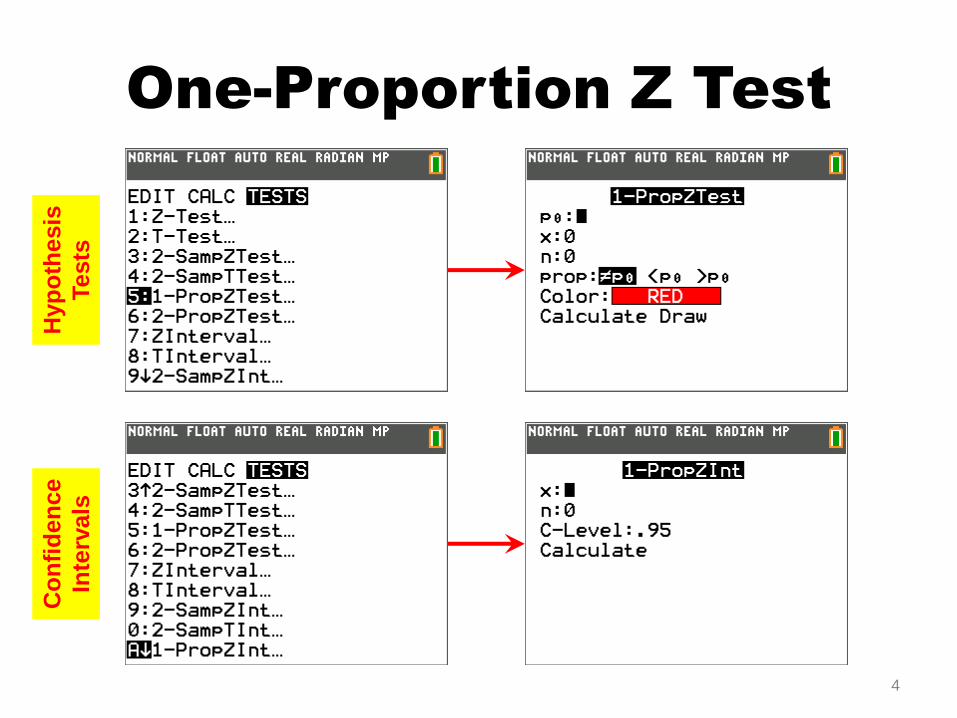
One-Proportion Z Test
4
Hyp
oth
esis
Tests
Co
nfi
den
ce
Inte
rvals
Example 1
Suppose a random sample of size 100 had 33
successes.
a) Test the hypotheses
Use a significance level of 0.10.
b) Find the 90% confidence interval to estimate p.
Where is the null value of 0.3 on this interval?
5
0 : 0.3, : 0.3.aH p H p
Example 2
For a class project, a political science student at a
large university wants to determine the percent of
students that are registered voters. He surveys
120 students and finds that 72 are registered
voters. Compute and interpret a 90% confidence
interval for the true percent of students that are
registered voters.
6
Example 3
Duck hunting in populated areas faces opposition
on the basis of safety and environmental issues.
In a survey to assess public opinion regarding
duck hunting on Morro Bay (located along the
central coast of California), a random sample of
750 local residents included 560 who strongly
opposed hunting on the bay. Does this sample
provide convincing evidence that a majority of local
residents oppose hunting on Morro Bay?
7
Two-Proportion Z Test
For the difference of proportions, p-values and
confidence intervals can be found with the
2-PropZTest and 2-PropZInt commands:
• STAT | TESTS | 2-PropZTest (for tests)
• STAT | TESTS | 2-PropZInt (for intervals)
Enter the numbers of successes (x) and sample
sizes (n) for each group, and, for intervals, the
confidence level (C-level).
8

Two-Proportion Z Test
9
Hyp
oth
esis
Tests
Co
nfi
den
ce
Inte
rvals

Example 4
The National Sleep Foundation asked a random
sample of 1010 U.S. adults questions about their
sleep habits. Split into two age categories, 26% of
the 184 people under 30 snored, compared with
39% of the 811 in the older group. Is this
difference in the proportion of snoring statistically
significant, or is it due only to natural fluctuations in
the sample we've chosen?
10
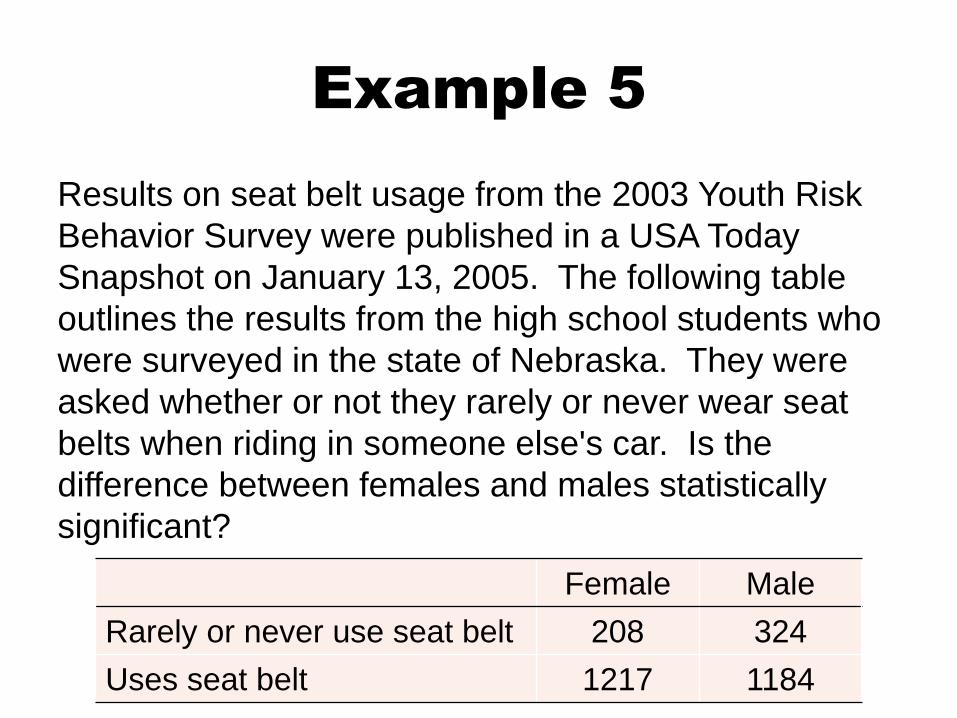
Example 5
Results on seat belt usage from the 2003 Youth Risk
Behavior Survey were published in a USA Today
Snapshot on January 13, 2005. The following table
outlines the results from the high school students who
were surveyed in the state of Nebraska. They were
asked whether or not they rarely or never wear seat
belts when riding in someone else's car. Is the
difference between females and males statistically
significant?
Female Male
Rarely or never use seat belt 208 324
Uses seat belt 1217 1184
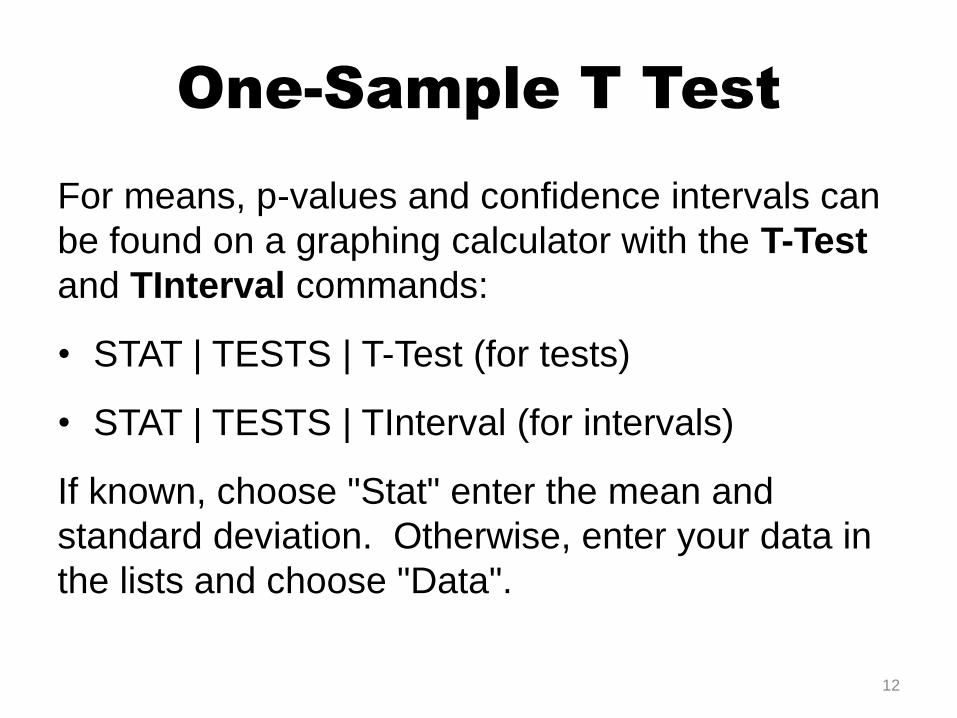
One-Sample T Test
For means, p-values and confidence intervals can
be found on a graphing calculator with the T-Test
and TInterval commands:
• STAT | TESTS | T-Test (for tests)
• STAT | TESTS | TInterval (for intervals)
If known, choose "Stat" enter the mean and
standard deviation. Otherwise, enter your data in
the lists and choose "Data".
12
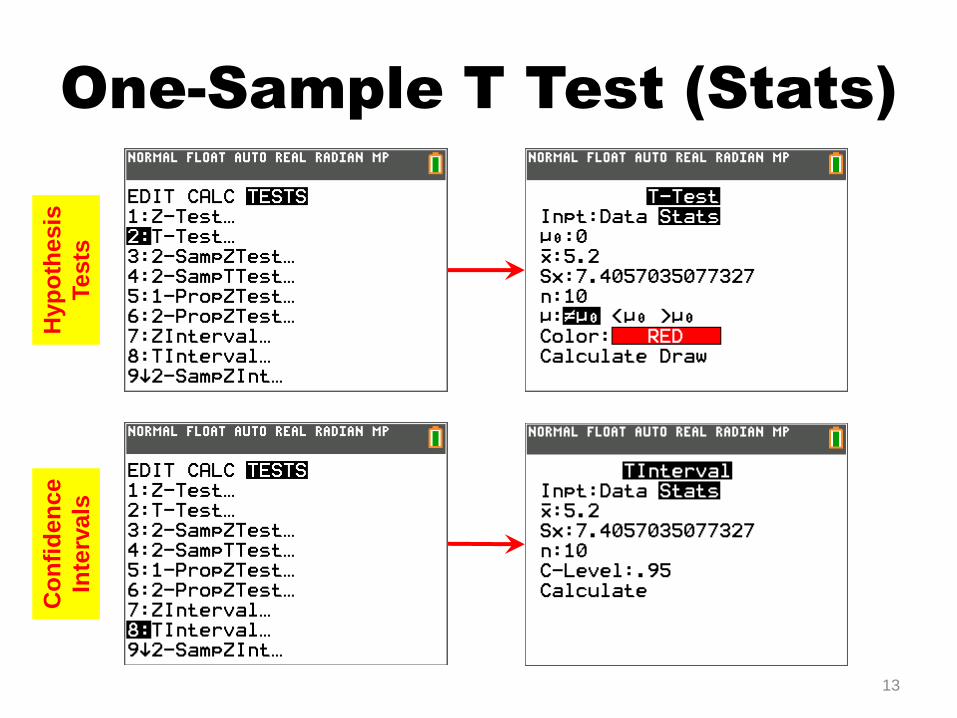
One-Sample T Test (Stats)
13
Hyp
oth
esis
Tests
Co
nfi
den
ce
Inte
rvals

One-Sample T Test (Data)
14
Hyp
oth
esis
Tests
Co
nfi
den
ce
Inte
rvals
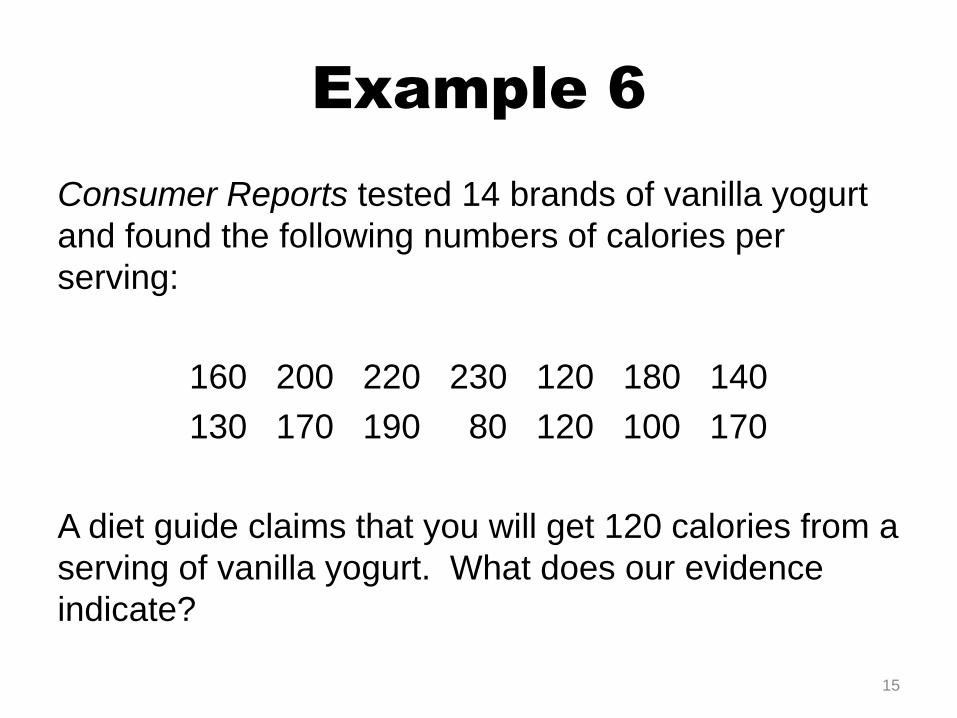
Example 6
Consumer Reports tested 14 brands of vanilla yogurt
and found the following numbers of calories per
serving:
160 200 220 230 120 180 140
130 170 190 80 120 100 170
A diet guide claims that you will get 120 calories from a
serving of vanilla yogurt. What does our evidence
indicate?
15
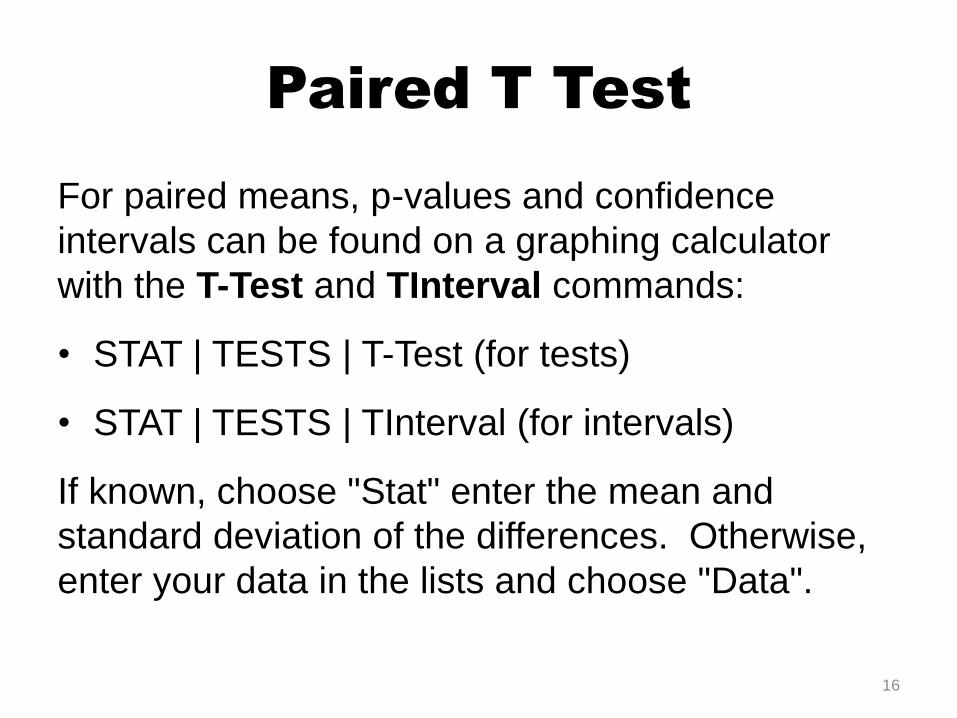
Paired T Test
For paired means, p-values and confidence
intervals can be found on a graphing calculator
with the T-Test and TInterval commands:
• STAT | TESTS | T-Test (for tests)
• STAT | TESTS | TInterval (for intervals)
If known, choose "Stat" enter the mean and
standard deviation of the differences. Otherwise,
enter your data in the lists and choose "Data".
16
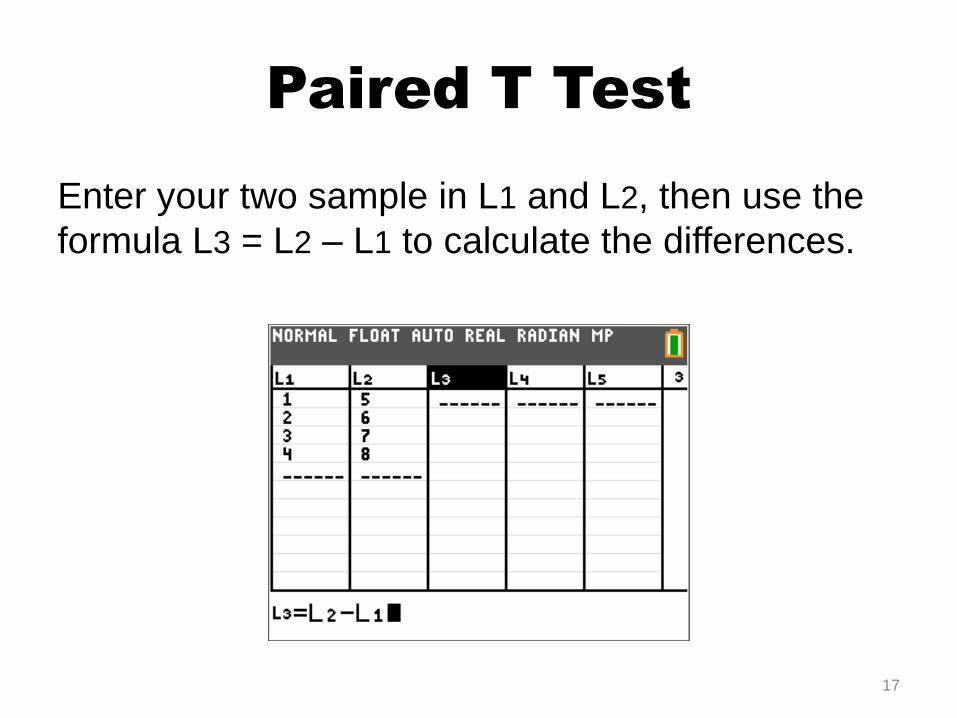
Paired T Test
Enter your two sample in L1 and L2, then use the
formula L3 = L2 – L1 to calculate the differences.
17
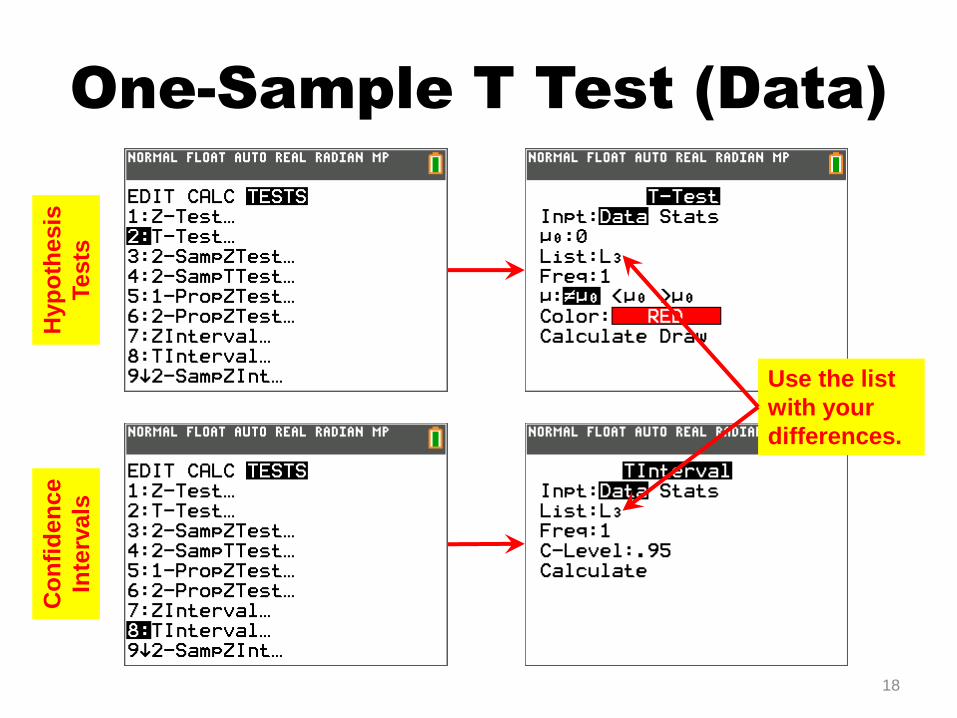
One-Sample T Test (Data)
18
Hyp
oth
esis
Tests
Co
nfi
den
ce
Inte
rvals
Use the list
with your
differences.
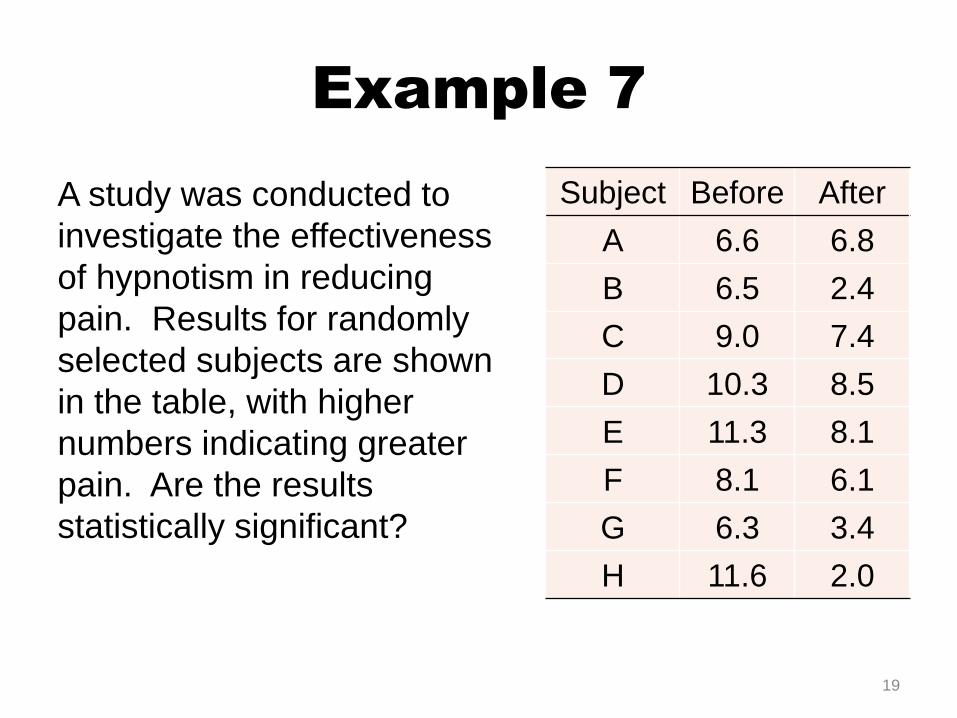
Example 7
A study was conducted to
investigate the effectiveness
of hypnotism in reducing
pain. Results for randomly
selected subjects are shown
in the table, with higher
numbers indicating greater
pain. Are the results
statistically significant?
19
Subject Before After
A 6.6 6.8
B 6.5 2.4
C 9.0 7.4
D 10.3 8.5
E 11.3 8.1
F 8.1 6.1
G 6.3 3.4
H 11.6 2.0

Two-Sample T Test
For difference of means, p-values and confidence
intervals can be found on a graphing calculator
with the 2SampTTest and 2SampTInt commands:
• STAT | TESTS | 2SampTTest (for tests)
• STAT | TESTS | 2SampTInt (for intervals)
If known, choose "Stat" enter the mean and
standard deviation for the two groups. Otherwise,
enter your data in the lists and choose "Data".
20
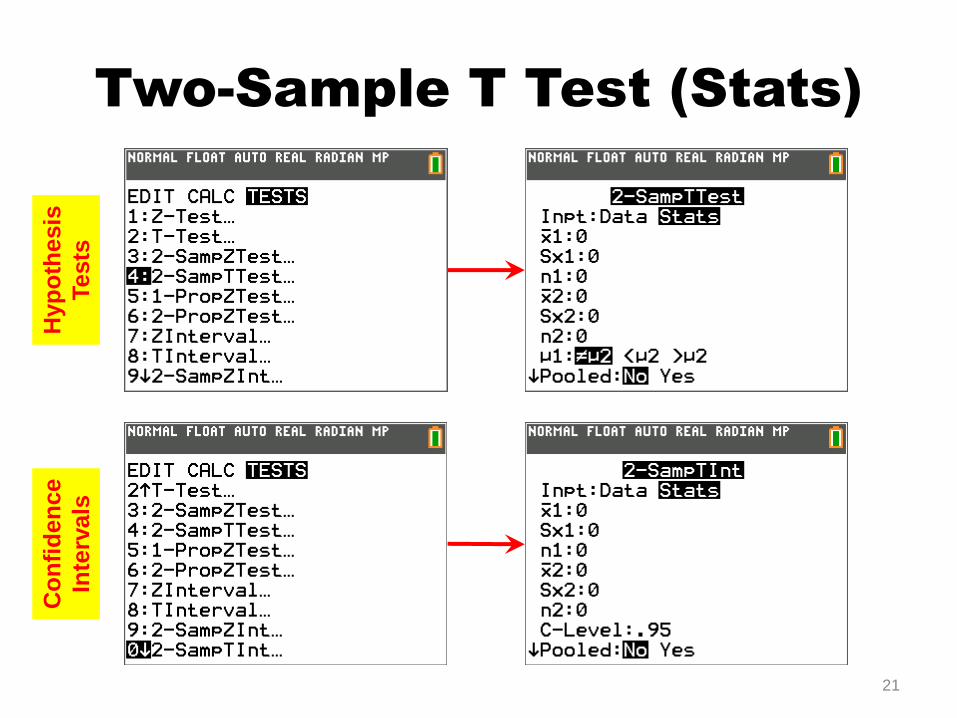
Two-Sample T Test (Stats)
21
Hyp
oth
esis
Tests
Co
nfi
den
ce
Inte
rvals
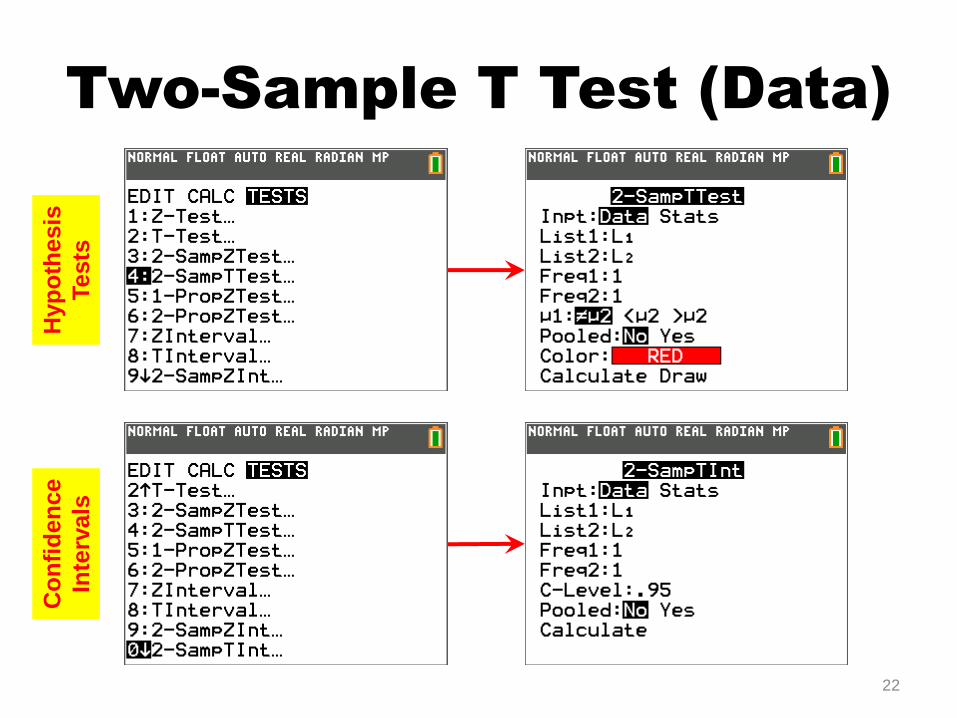
Two-Sample T Test (Data)
22
Hyp
oth
esis
Tests
Co
nfi
den
ce
Inte
rvals
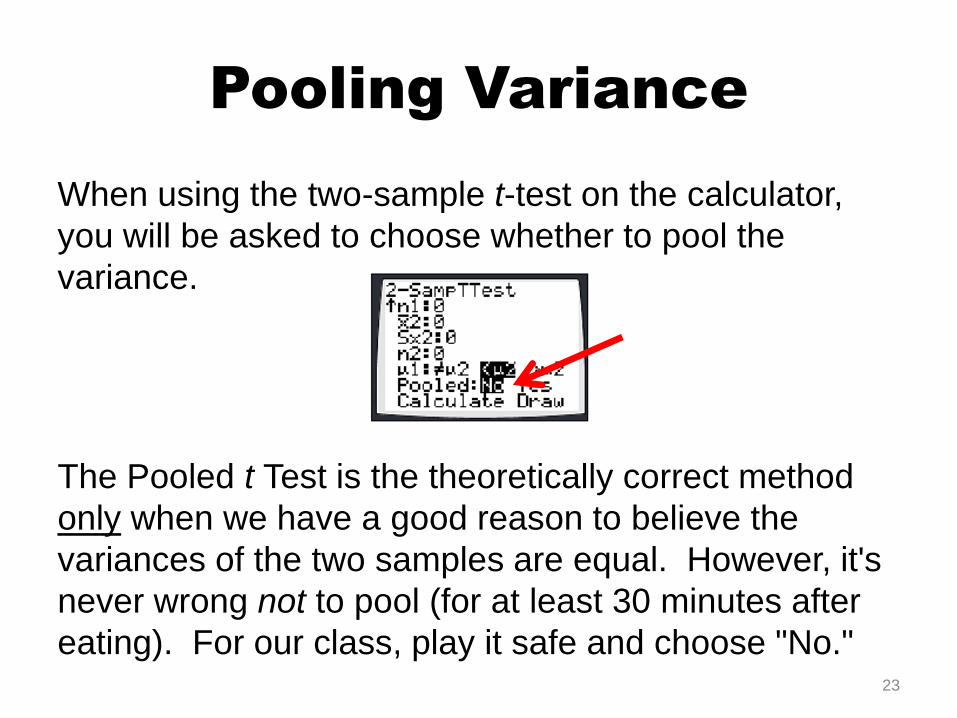
Pooling Variance
When using the two-sample t-test on the calculator,
you will be asked to choose whether to pool the
variance.
The Pooled t Test is the theoretically correct method
only when we have a good reason to believe the
variances of the two samples are equal. However, it's
never wrong not to pool (for at least 30 minutes after
eating). For our class, play it safe and choose "No."23
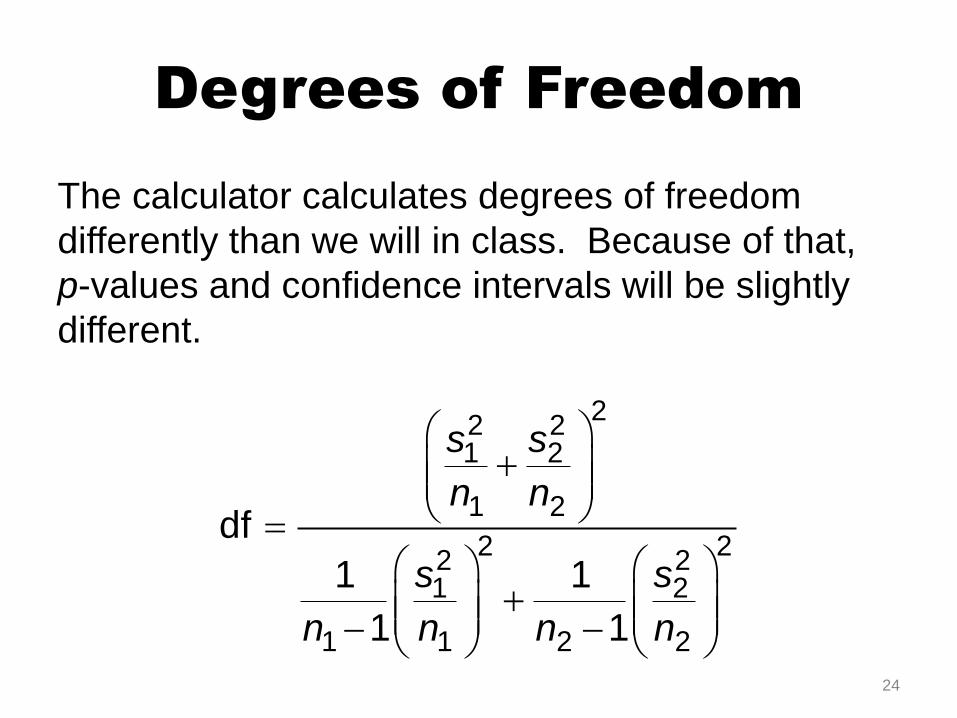
Degrees of Freedom
The calculator calculates degrees of freedom
differently than we will in class. Because of that,
p-values and confidence intervals will be slightly
different.
22 21 2
1 2
2 22 21 2
1 1 2 2
df
1 1
1 1
s s
n n
s s
n n n n
24
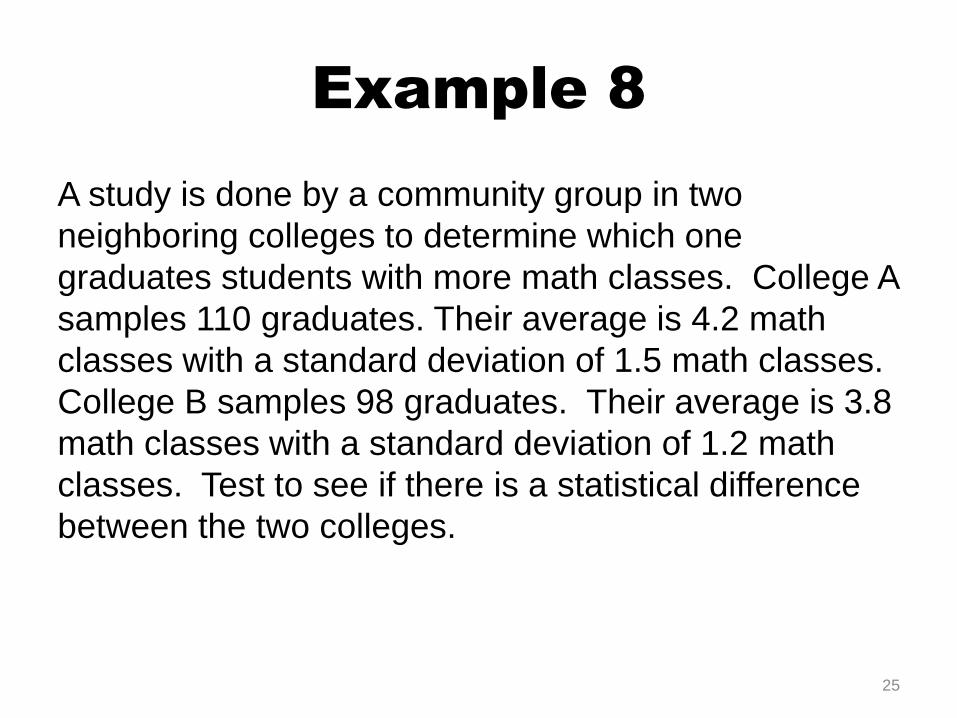
Example 8
A study is done by a community group in two
neighboring colleges to determine which one
graduates students with more math classes. College A
samples 110 graduates. Their average is 4.2 math
classes with a standard deviation of 1.5 math classes.
College B samples 98 graduates. Their average is 3.8
math classes with a standard deviation of 1.2 math
classes. Test to see if there is a statistical difference
between the two colleges.
25
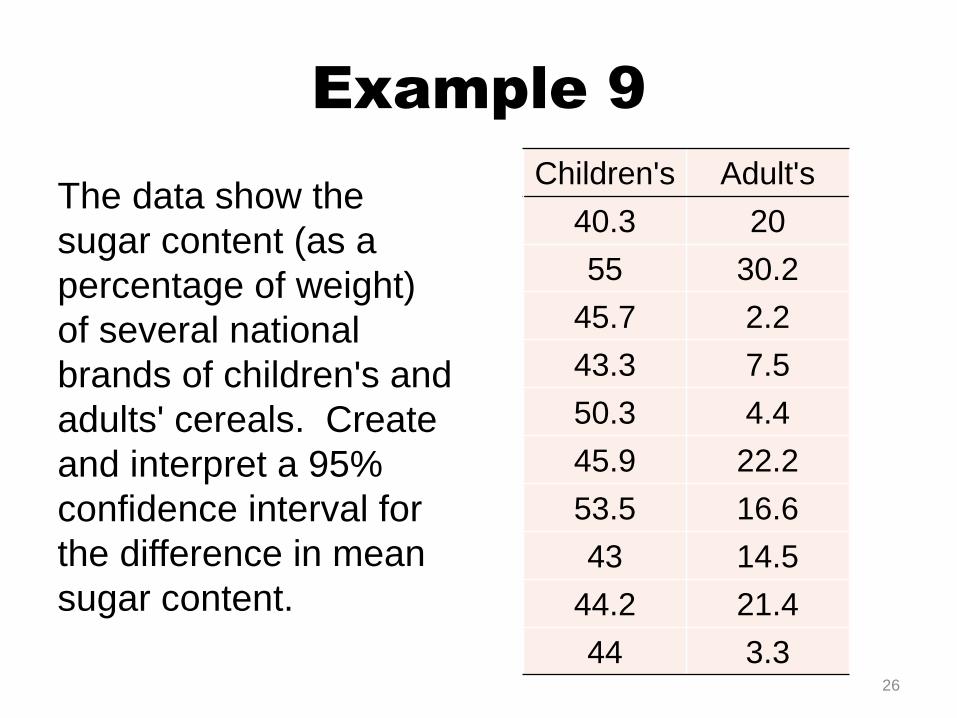
Example 9
The data show the
sugar content (as a
percentage of weight)
of several national
brands of children's and
adults' cereals. Create
and interpret a 95%
confidence interval for
the difference in mean
sugar content.
26
Children's Adult's
40.3 20
55 30.2
45.7 2.2
43.3 7.5
50.3 4.4
45.9 22.2
53.5 16.6
43 14.5
44.2 21.4
44 3.3
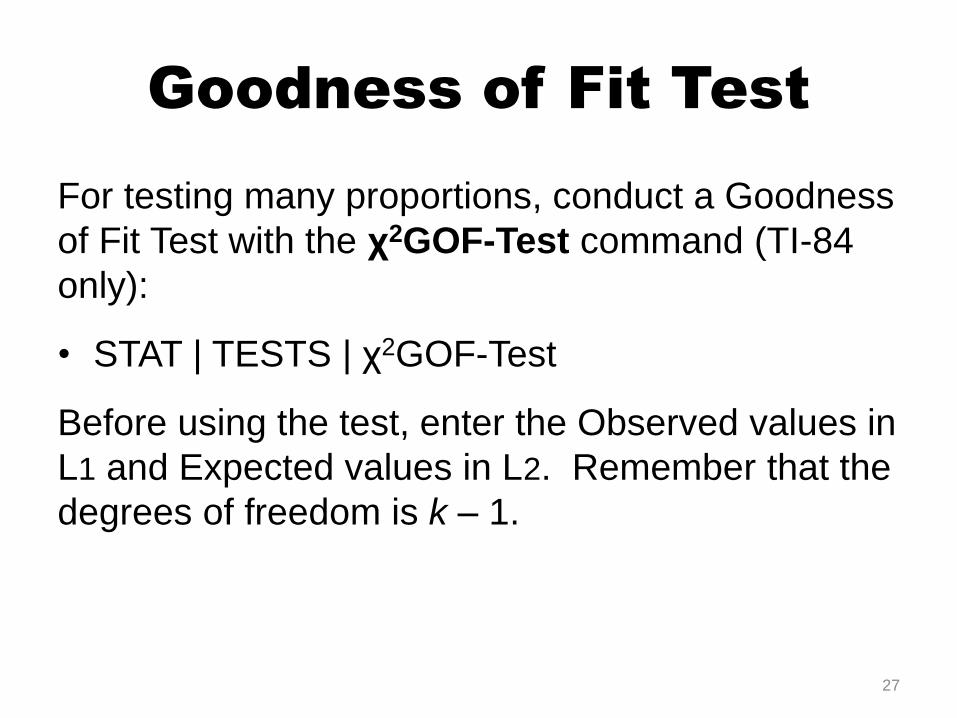
Goodness of Fit Test
For testing many proportions, conduct a Goodness
of Fit Test with the χ2GOF-Test command (TI-84
only):
• STAT | TESTS | χ2GOF-Test
Before using the test, enter the Observed values in
L1 and Expected values in L2. Remember that the
degrees of freedom is k – 1.
27
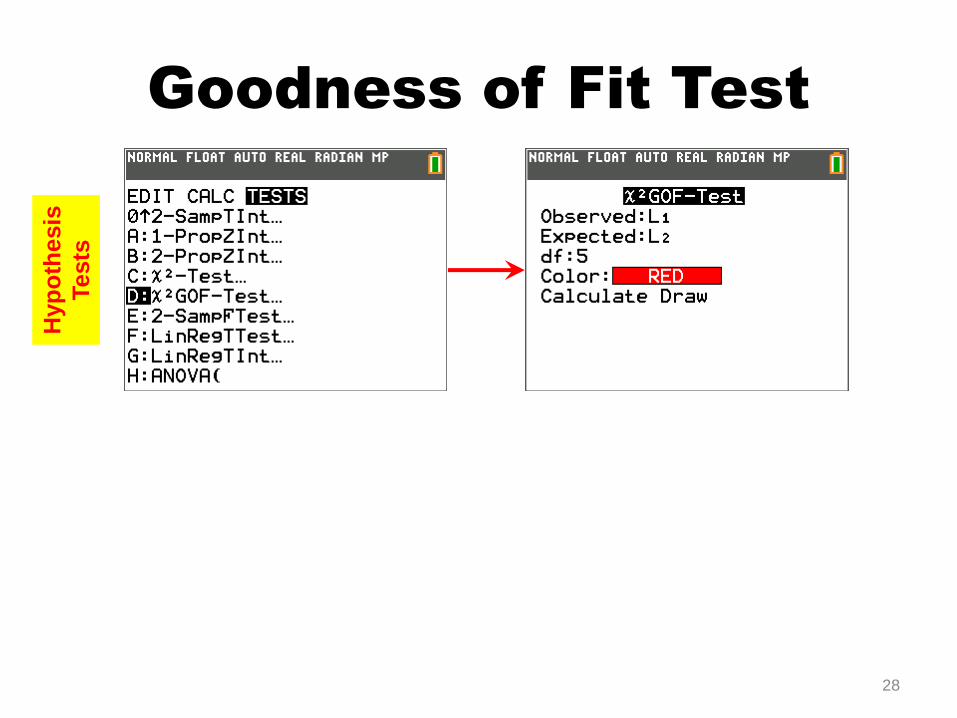
Goodness of Fit Test
28
Hyp
oth
esis
Tests
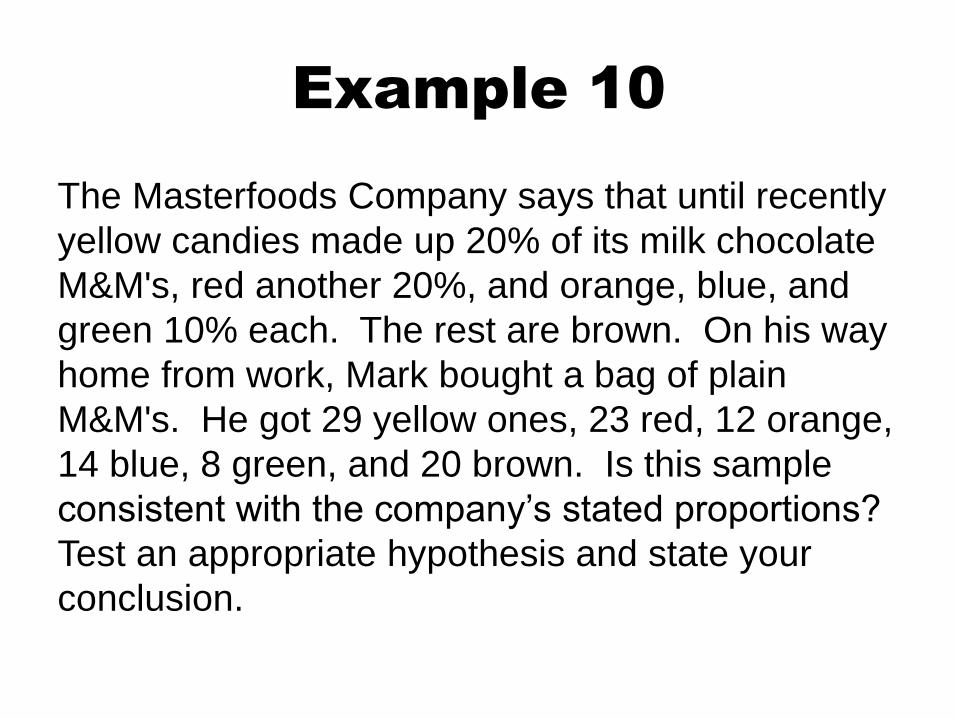
Example 10
The Masterfoods Company says that until recently
yellow candies made up 20% of its milk chocolate
M&M's, red another 20%, and orange, blue, and
green 10% each. The rest are brown. On his way
home from work, Mark bought a bag of plain
M&M's. He got 29 yellow ones, 23 red, 12 orange,
14 blue, 8 green, and 20 brown. Is this sample
consistent with the company’s stated proportions?
Test an appropriate hypothesis and state your
conclusion.

Test for Independence
For testing many proportions, conduct a Goodness
of Fit Test with the χ2GOF-Test command (TI-84
only):
• STAT | TESTS | χ2GOF-Test
Before using the test, enter the Observed values in
L1 and Expected values in L2. Remember that the
degrees of freedom is k – 1.
30

Creating a Matrix
For this test, you must first enter your contingency
table in Matrix [A], then create a matrix of the
same size in Matrix [B].
2ND MATRIX
EDIT 1: [A], then enter your contingency table
EDIT 2: [B], have dimensions match [A], but you
don't need to enter any expected values.

Test for Independence
32
En
ter
Data
Hyp
oth
esis
Test
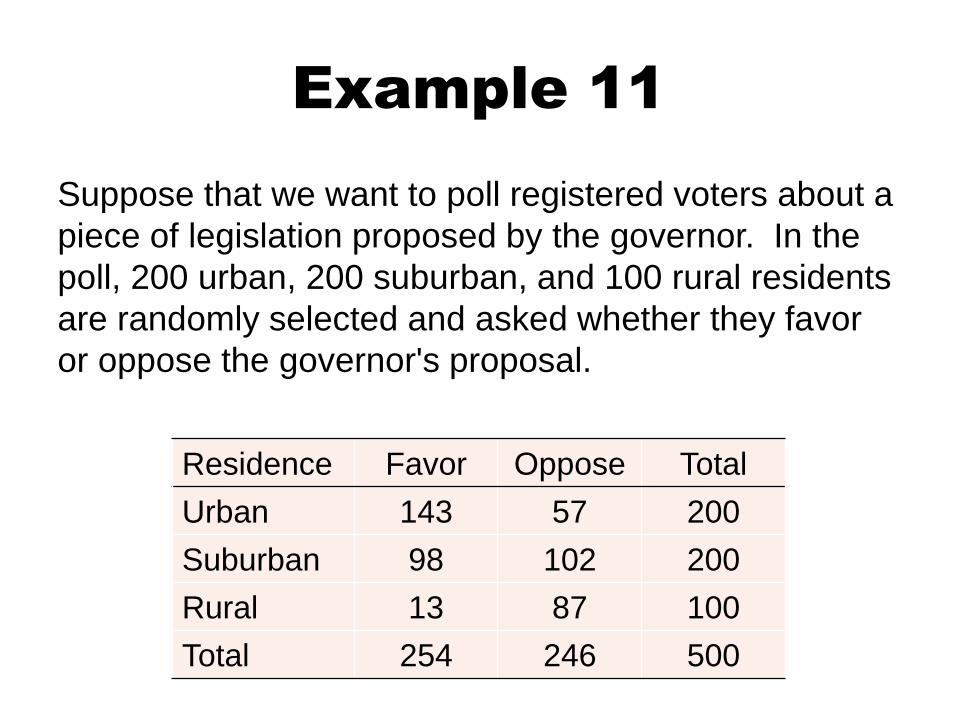
Example 11
Suppose that we want to poll registered voters about a
piece of legislation proposed by the governor. In the
poll, 200 urban, 200 suburban, and 100 rural residents
are randomly selected and asked whether they favor
or oppose the governor's proposal.
Residence Favor Oppose Total
Urban 143 57 200
Suburban 98 102 200
Rural 13 87 100
Total 254 246 500

Example 11 continued
That is, a simple random sample is taken for each of
these three groups. Is there sufficient evidence to
reject the hypothesis that the proportion of those who
favor the proposal is the same for all three groups?
Residence Favor Oppose Total
Urban 143 57 200
Suburban 98 102 200
Rural 13 87 100
Total 254 246 500