0DWHULDO (6, IRU&KHP&RPP 7KLV - rsc.org filesubstrates listed in Figure 2 (main text). A) Synthesis...
81
S1 Supporting Information For Beta-ketoacyl-ACP substrate mimics for 3-oxoacyl-ACP utilizing AHL synthases Contents Scheme for synthesis of β-ketoacyl-ACP mimics……………………………………….S2 General information……………………………………………………………………...S3 Experimental procedures…………………………………………………..………..S4-S20 NMR characterization of compounds ( 1 H and 13 C NMR spectra)……………..…..S21-S38 HRMS spectra for 4-Succ – 14-Succ…………………………………………..…..S38-S43 HRMS spectra for 4-CoA – 15-CoA………………………………………………S44-S49 HRMS spectra for 1-ACP – 15-ACP…………………………………………..….S50-S57 EsaI wild-type and T140A mutant growth, expression, and purification………………..S58 Apo-ACP growth, expression, and purification……………………………………S59-S60 Sfp growth, expression, and purification…………………………………………..S60-S61 YspI growth, expression, and purification…………………………………………S61-S62 HPLC assay………………………………………………………………………..S62-S65 Substrate velocity curves…………………………………………………………..S66-S74 Tables for kinetic constants………………………………………………………..S75-S77 References…………………………………………………………………………..…..S78 Electronic Supplementary Material (ESI) for ChemComm. This journal is © The Royal Society of Chemistry 2018
Transcript of 0DWHULDO (6, IRU&KHP&RPP 7KLV - rsc.org filesubstrates listed in Figure 2 (main text). A) Synthesis...
S1
Supporting Information
For
Beta-ketoacyl-ACP substrate mimics for 3-oxoacyl-ACP utilizing AHL synthases Contents Scheme for synthesis of β-ketoacyl-ACP mimics……………………………………….S2
General information……………………………………………………………………...S3
Experimental procedures…………………………………………………..………..S4-S20
NMR characterization of compounds (1H and 13C NMR spectra)……………..…..S21-S38
HRMS spectra for 4-Succ – 14-Succ…………………………………………..…..S38-S43
HRMS spectra for 4-CoA – 15-CoA………………………………………………S44-S49
HRMS spectra for 1-ACP – 15-ACP…………………………………………..….S50-S57
EsaI wild-type and T140A mutant growth, expression, and purification………………..S58
Apo-ACP growth, expression, and purification……………………………………S59-S60
Sfp growth, expression, and purification…………………………………………..S60-S61
YspI growth, expression, and purification…………………………………………S61-S62
HPLC assay………………………………………………………………………..S62-S65
Substrate velocity curves…………………………………………………………..S66-S74
Tables for kinetic constants………………………………………………………..S75-S77
References…………………………………………………………………………..…..S78
Electronic Supplementary Material (ESI) for ChemComm.This journal is © The Royal Society of Chemistry 2018
S2
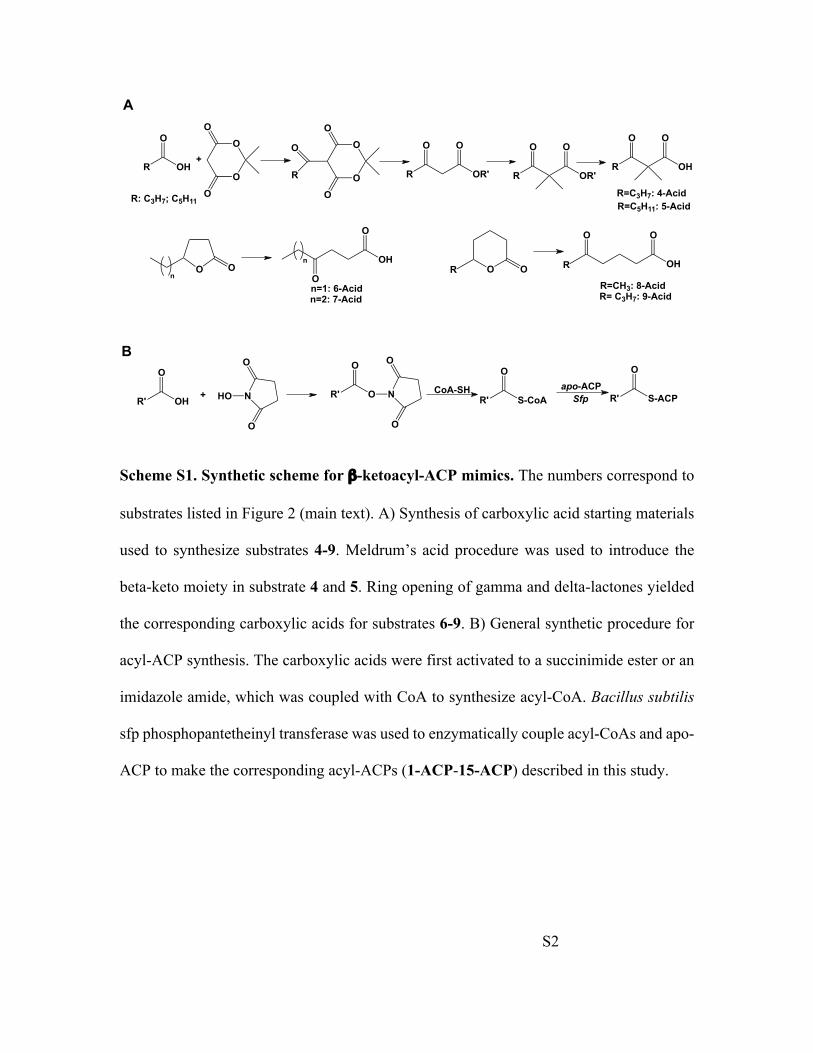
Scheme S1. Synthetic scheme for β-ketoacyl-ACP mimics. The numbers correspond to
substrates listed in Figure 2 (main text). A) Synthesis of carboxylic acid starting materials
used to synthesize substrates 4-9. Meldrum’s acid procedure was used to introduce the
beta-keto moiety in substrate 4 and 5. Ring opening of gamma and delta-lactones yielded
the corresponding carboxylic acids for substrates 6-9. B) General synthetic procedure for
acyl-ACP synthesis. The carboxylic acids were first activated to a succinimide ester or an
imidazole amide, which was coupled with CoA to synthesize acyl-CoA. Bacillus subtilis
sfp phosphopantetheinyl transferase was used to enzymatically couple acyl-CoAs and apo-
ACP to make the corresponding acyl-ACPs (1-ACP-15-ACP) described in this study.
R OH
O O
O
O
O
O
O
O
O
O
R+
O OOH
O
O
O O OH
OO
R' OH
O
N
O
O
HO+ N
O
O
OR'
O
CoA-SHR' S-CoA
Oapo-ACP
R' S-ACP
O
R
O
OR'
O
R
O
OH
O
Sfp
n
nR R
n=1: 6-Acidn=2: 7-Acid
R=CH3: 8-AcidR= C3H7: 9-Acid
R: C3H7; C5H11R=C3H7: 4-AcidR=C5H11: 5-Acid
R
O
OR'
O
A
B
S3
General Information
All chemical reagents and solvents were purchased from commercial sources and used
without further purification, except where indicated. The acyl-CoA compounds (1-CoA,
2-CoA and 3-CoA) were commercially available from Sigma-Aldrich. Ethyl-3-
oxohexanoate was purchased from Acros Organics and used to make 4-DM-Ester. Methyl
3-oxooctanoate was prepared according to the procedure described by D’Oca et al.[1] Ni+-
NTA resin was purchased from Qiagen. Silica gel 230-400 mesh from Fisher was used in
flash column chromatography. A Thermo Scientific Evolution 260 Bio UV-Vis
spectrophotometer was used to measure the concentration of analytes. HPLC data was
analyzed by Chromeleon 7.2 software on a Thermo Scientific Dionex UltiMate-3000
HPLC system. Thermo Scientific Hypersil Gold C18 reverse-phase analytical UHPLC
column (25002-054630) and preparative HPLC column (25005-159070) were used in acyl-
ACP and acyl-CoA syntheses, respectively. Deuterated chloroform and methanol solvent
were obtained commercially through Cambridge Isotope Laboratories, Inc. NMR spectra
were recorded at 298 K using BRUKER AVANCE III 300 MHz and 600 MHz
spectrometers. Chemical shifts were expressed in parts per million (ppm) and referenced
to residual solvent as the internal reference for 1H (CDCl3: δ = 7.24 ppm or CD3OD: δ =
3.31 ppm) and 13C (CDCl3: δ = 77.16 ppm and CD3OD: δ = 49.00 ppm). We are grateful
to the following PI’s for providing plasmids for the following proteins: Pantoea Stewartii
EsaI (Prof. Mair Churchill, University of Colorado-Denver), Bacillus subtilis Sfp (Prof.
Michael D. Burkart, University of California-San Diego), Yersinia pestis YspI (Prof. E. P.
Greenberg, University of Washington-Seattle) and Escherichia coli ACPg (Prof. John
Cronan, University of Illinois-Urbana Champaign).
S4
Experimental Procedures
General procedure for the preparation of 2,2-dimethyl β-ketoesters (4-DM-Ester and
5-DM-Ester). To a dry THF solution (60 mL) containing a suspension of NaH (1 equiv,
60% wt. dispersion in mineral oil) under a nitrogen atmosphere, was added the appropriate
β-ketoester (1 equiv). The solution was stirred at room temperature until hydrogen gas
evolution stopped (~30 minutes), then methyl iodide (1 equiv) was added and the solution
heated to reflux for 12 h. After cooling to room temperature, additional NaH (1 equiv, 60%
wt. dispersion in mineral oil) and methyl iodide (1 equiv) were added, and the solution
refluxed for another 12 h. The completion of the reaction was checked using TLC (5%
ethyl acetate: 95% hexane). To this solution, was added a saturated solution of ammonium
chloride until all the white precipitate dissolved, which was extracted with
dichloromethane (3 x 70 mL). The organic layer was separated, dried with anhydrous
sodium sulfate, filtered and the solvent removed under reduced pressure. The products
were purified by column chromatography on silica gel (99:1 hexanes/EtOAc).
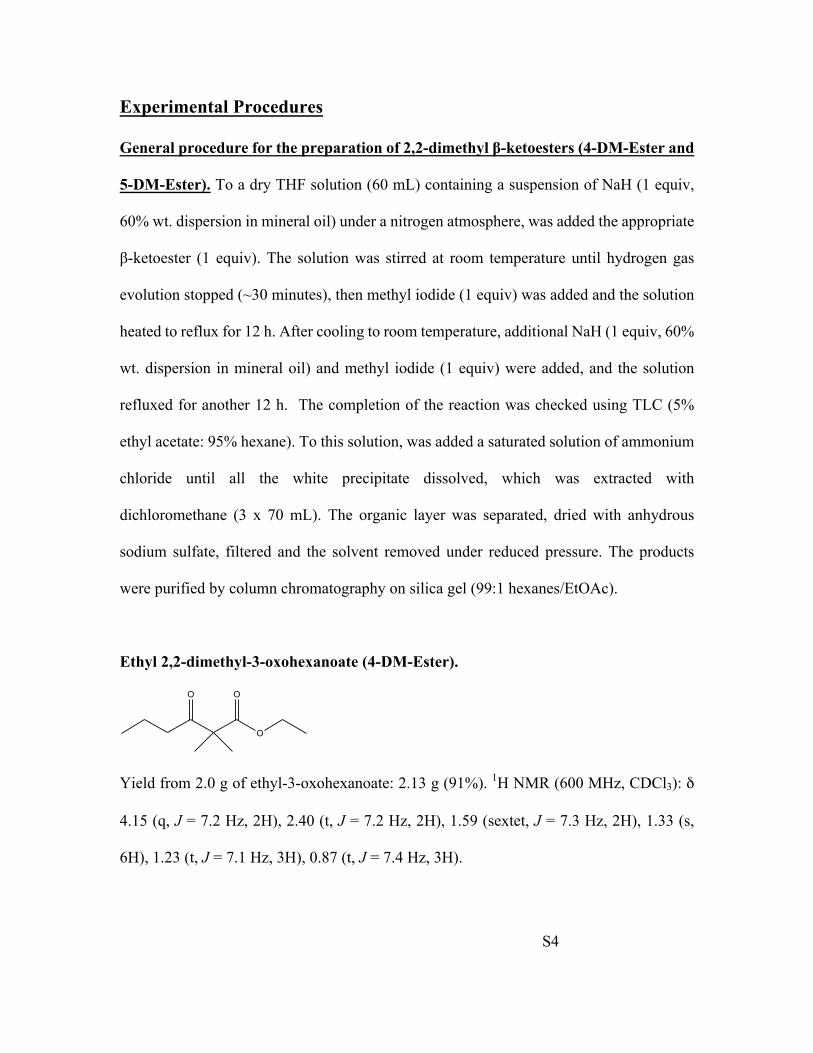
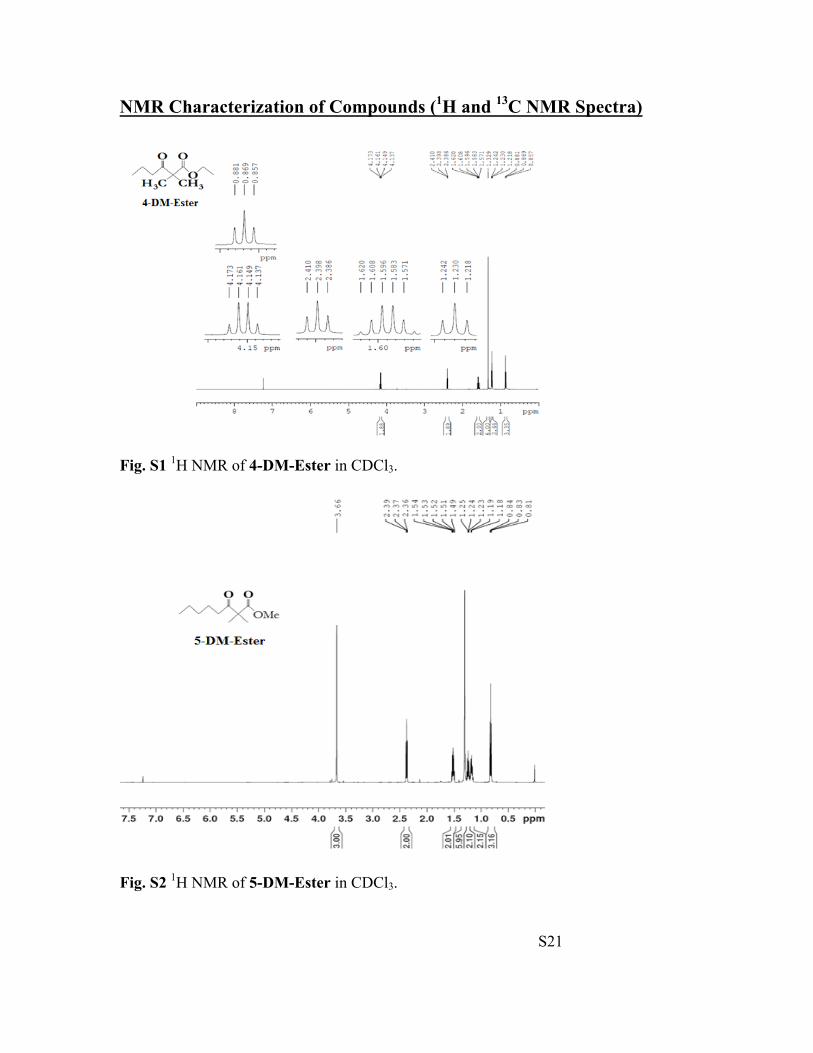
Ethyl 2,2-dimethyl-3-oxohexanoate (4-DM-Ester).
O
O O
Yield from 2.0 g of ethyl-3-oxohexanoate: 2.13 g (91%). 1H NMR (600 MHz, CDCl3): δ
4.15 (q, J = 7.2 Hz, 2H), 2.40 (t, J = 7.2 Hz, 2H), 1.59 (sextet, J = 7.3 Hz, 2H), 1.33 (s,
6H), 1.23 (t, J = 7.1 Hz, 3H), 0.87 (t, J = 7.4 Hz, 3H).
S5
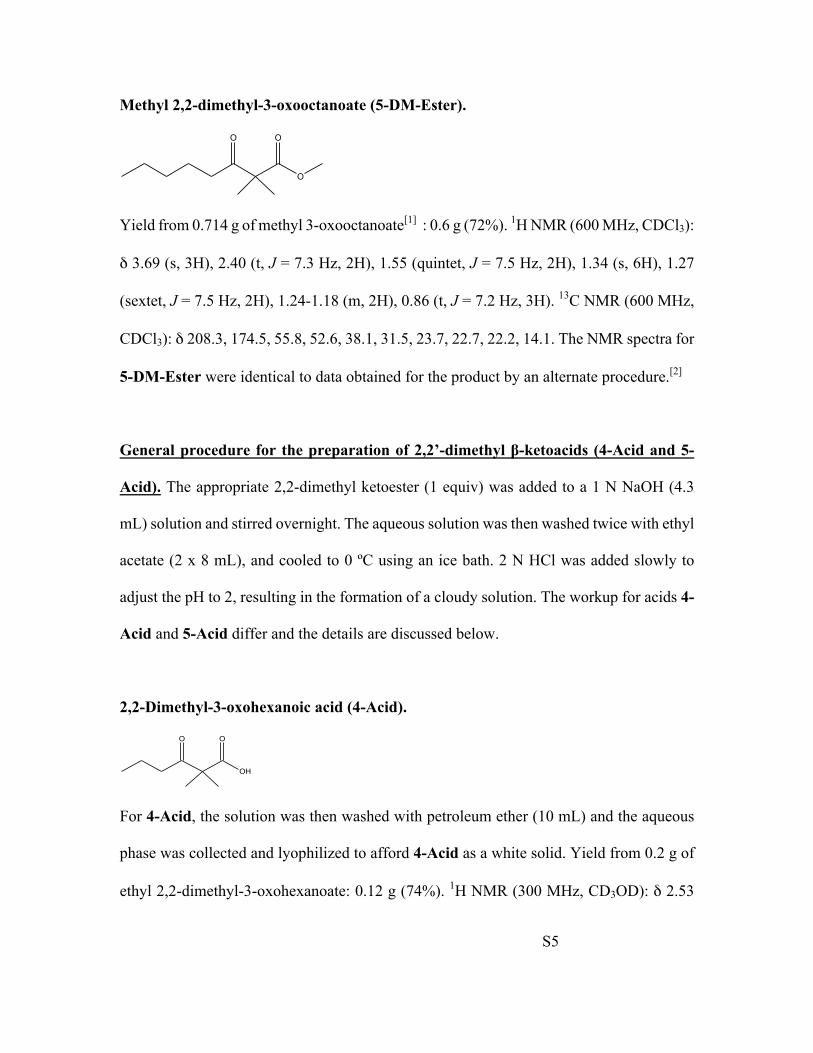
Methyl 2,2-dimethyl-3-oxooctanoate (5-DM-Ester).
O
O O
Yield from 0.714 g of methyl 3-oxooctanoate[1] : 0.6 g (72%). 1H NMR (600 MHz, CDCl3):
δ 3.69 (s, 3H), 2.40 (t, J = 7.3 Hz, 2H), 1.55 (quintet, J = 7.5 Hz, 2H), 1.34 (s, 6H), 1.27
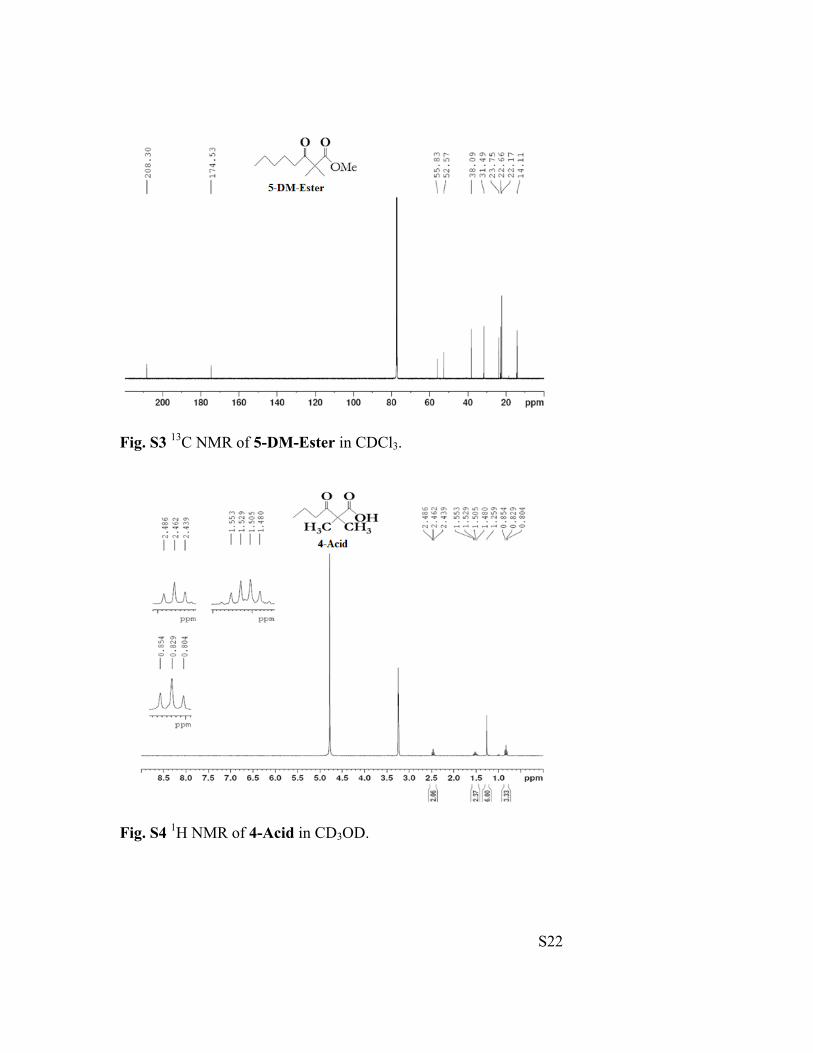
(sextet, J = 7.5 Hz, 2H), 1.24-1.18 (m, 2H), 0.86 (t, J = 7.2 Hz, 3H). 13C NMR (600 MHz,
CDCl3): δ 208.3, 174.5, 55.8, 52.6, 38.1, 31.5, 23.7, 22.7, 22.2, 14.1. The NMR spectra for
5-DM-Ester were identical to data obtained for the product by an alternate procedure.[2]
General procedure for the preparation of 2,2’-dimethyl β-ketoacids (4-Acid and 5-
Acid). The appropriate 2,2-dimethyl ketoester (1 equiv) was added to a 1 N NaOH (4.3
mL) solution and stirred overnight. The aqueous solution was then washed twice with ethyl
acetate (2 x 8 mL), and cooled to 0 ºC using an ice bath. 2 N HCl was added slowly to
adjust the pH to 2, resulting in the formation of a cloudy solution. The workup for acids 4-
Acid and 5-Acid differ and the details are discussed below.
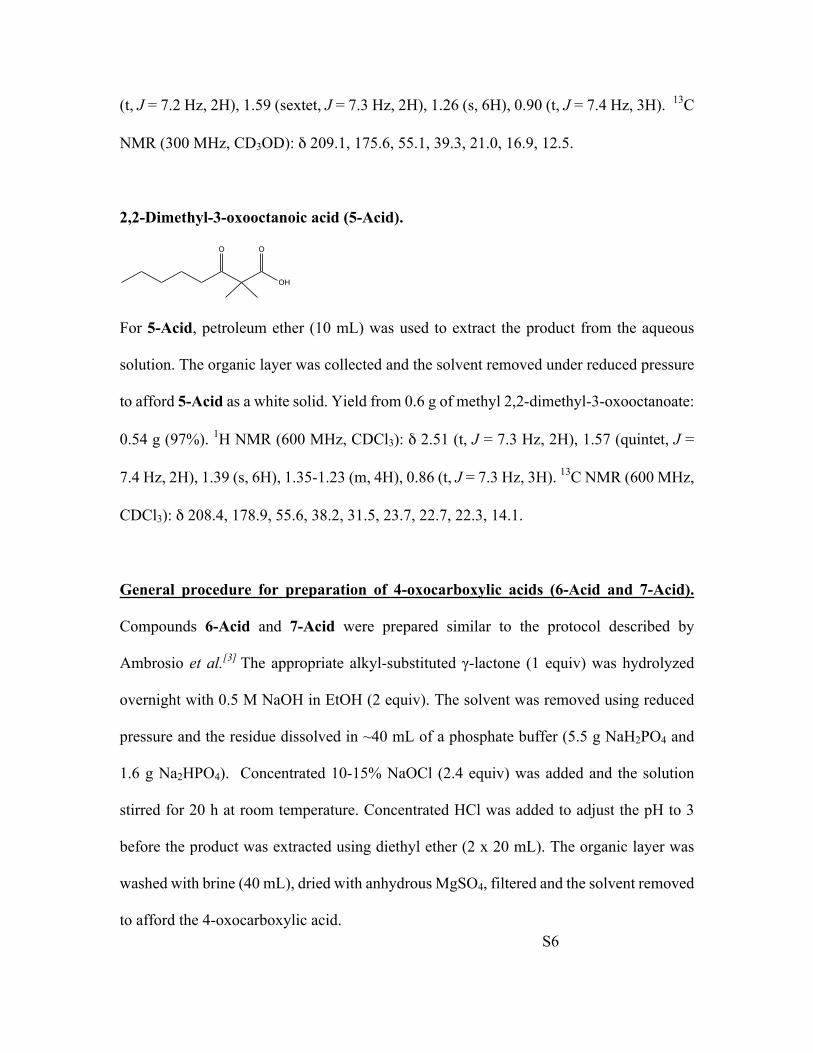
2,2-Dimethyl-3-oxohexanoic acid (4-Acid).
OH
O O
For 4-Acid, the solution was then washed with petroleum ether (10 mL) and the aqueous
phase was collected and lyophilized to afford 4-Acid as a white solid. Yield from 0.2 g of
ethyl 2,2-dimethyl-3-oxohexanoate: 0.12 g (74%). 1H NMR (300 MHz, CD3OD): δ 2.53
S6
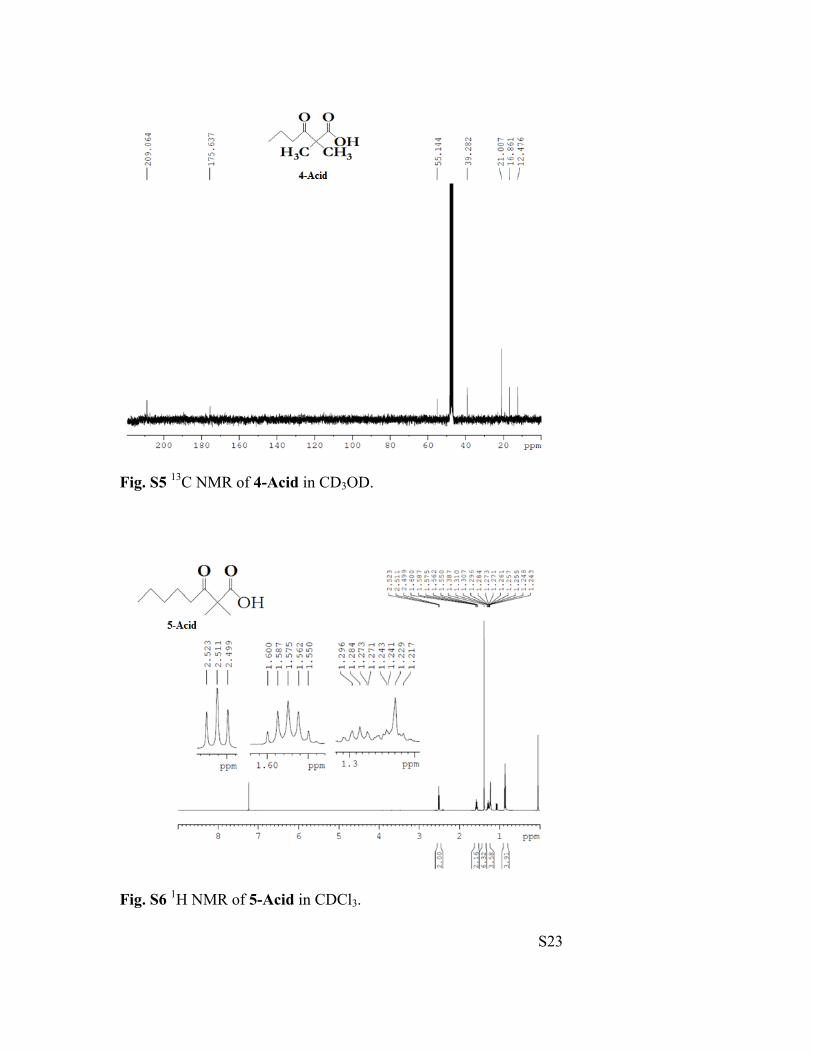
(t, J = 7.2 Hz, 2H), 1.59 (sextet, J = 7.3 Hz, 2H), 1.26 (s, 6H), 0.90 (t, J = 7.4 Hz, 3H). 13C
NMR (300 MHz, CD3OD): δ 209.1, 175.6, 55.1, 39.3, 21.0, 16.9, 12.5.
2,2-Dimethyl-3-oxooctanoic acid (5-Acid).
OH
O O
For 5-Acid, petroleum ether (10 mL) was used to extract the product from the aqueous
solution. The organic layer was collected and the solvent removed under reduced pressure
to afford 5-Acid as a white solid. Yield from 0.6 g of methyl 2,2-dimethyl-3-oxooctanoate:
0.54 g (97%). 1H NMR (600 MHz, CDCl3): δ 2.51 (t, J = 7.3 Hz, 2H), 1.57 (quintet, J =
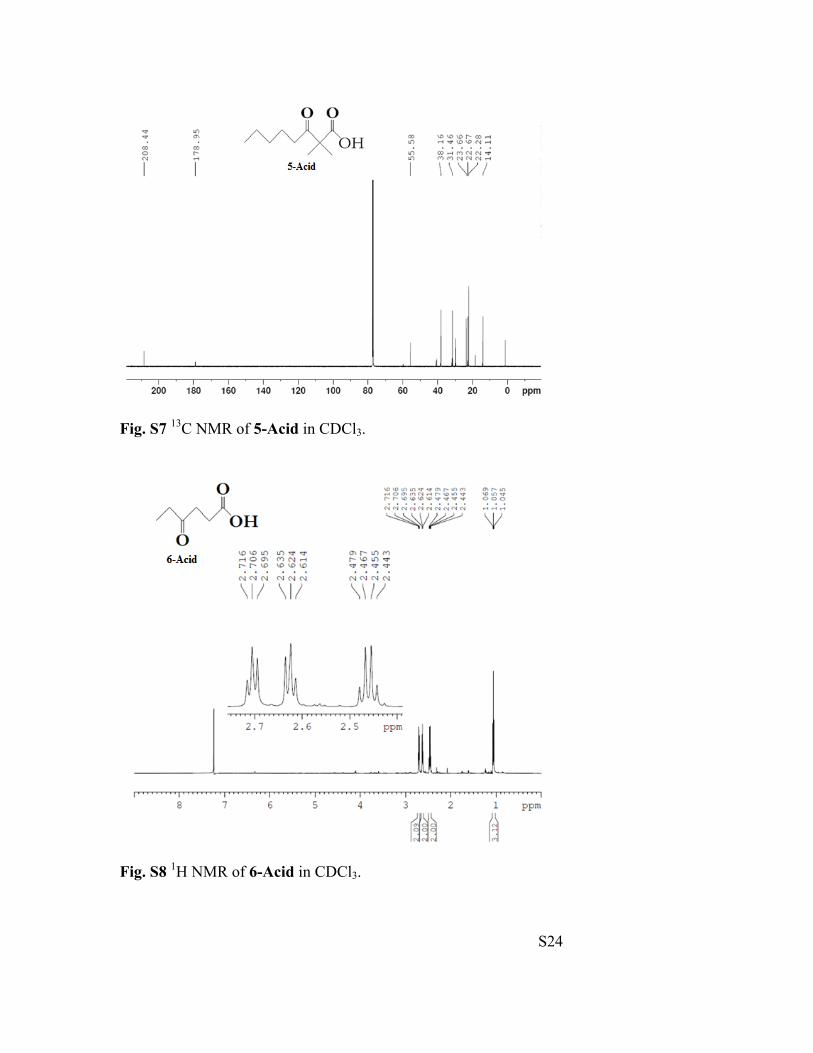
7.4 Hz, 2H), 1.39 (s, 6H), 1.35-1.23 (m, 4H), 0.86 (t, J = 7.3 Hz, 3H). 13C NMR (600 MHz,
CDCl3): δ 208.4, 178.9, 55.6, 38.2, 31.5, 23.7, 22.7, 22.3, 14.1.
General procedure for preparation of 4-oxocarboxylic acids (6-Acid and 7-Acid).
Compounds 6-Acid and 7-Acid were prepared similar to the protocol described by
Ambrosio et al.[3] The appropriate alkyl-substituted γ-lactone (1 equiv) was hydrolyzed
overnight with 0.5 M NaOH in EtOH (2 equiv). The solvent was removed using reduced
pressure and the residue dissolved in ~40 mL of a phosphate buffer (5.5 g NaH2PO4 and
1.6 g Na2HPO4). Concentrated 10-15% NaOCl (2.4 equiv) was added and the solution
stirred for 20 h at room temperature. Concentrated HCl was added to adjust the pH to 3
before the product was extracted using diethyl ether (2 x 20 mL). The organic layer was
washed with brine (40 mL), dried with anhydrous MgSO4, filtered and the solvent removed
to afford the 4-oxocarboxylic acid.
S7
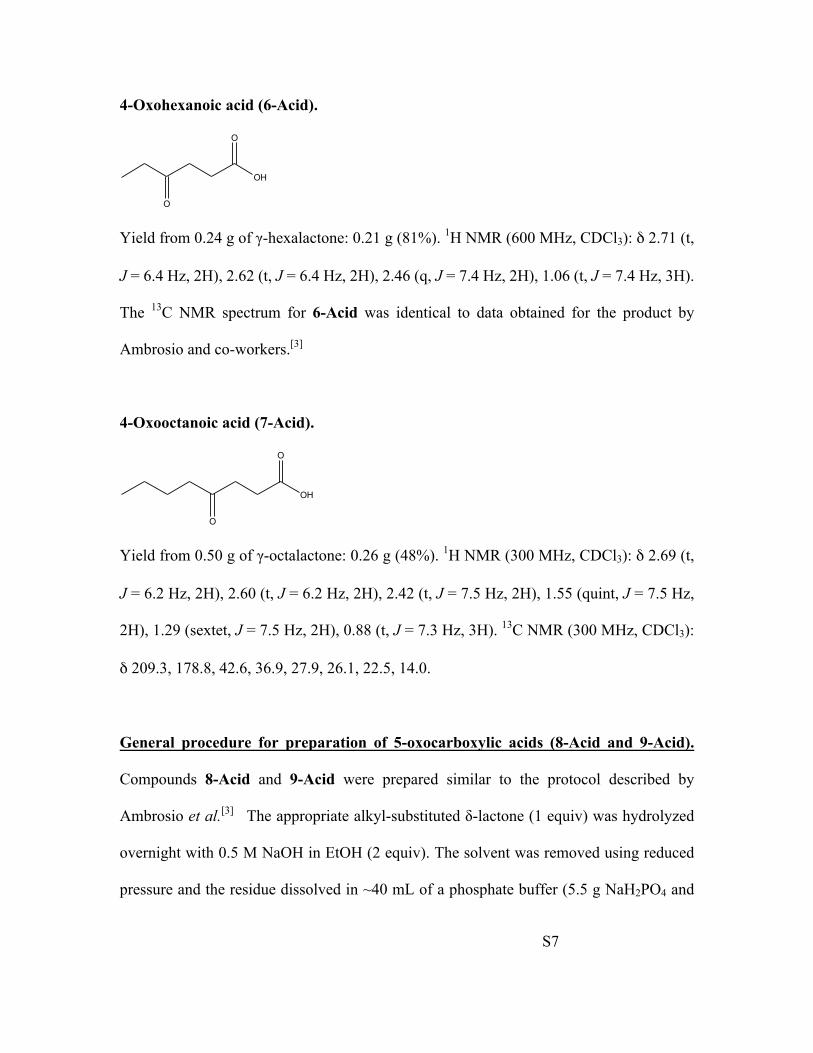
4-Oxohexanoic acid (6-Acid).
OH
O
O
Yield from 0.24 g of γ-hexalactone: 0.21 g (81%). 1H NMR (600 MHz, CDCl3): δ 2.71 (t,
J = 6.4 Hz, 2H), 2.62 (t, J = 6.4 Hz, 2H), 2.46 (q, J = 7.4 Hz, 2H), 1.06 (t, J = 7.4 Hz, 3H).
The 13C NMR spectrum for 6-Acid was identical to data obtained for the product by
Ambrosio and co-workers.[3]
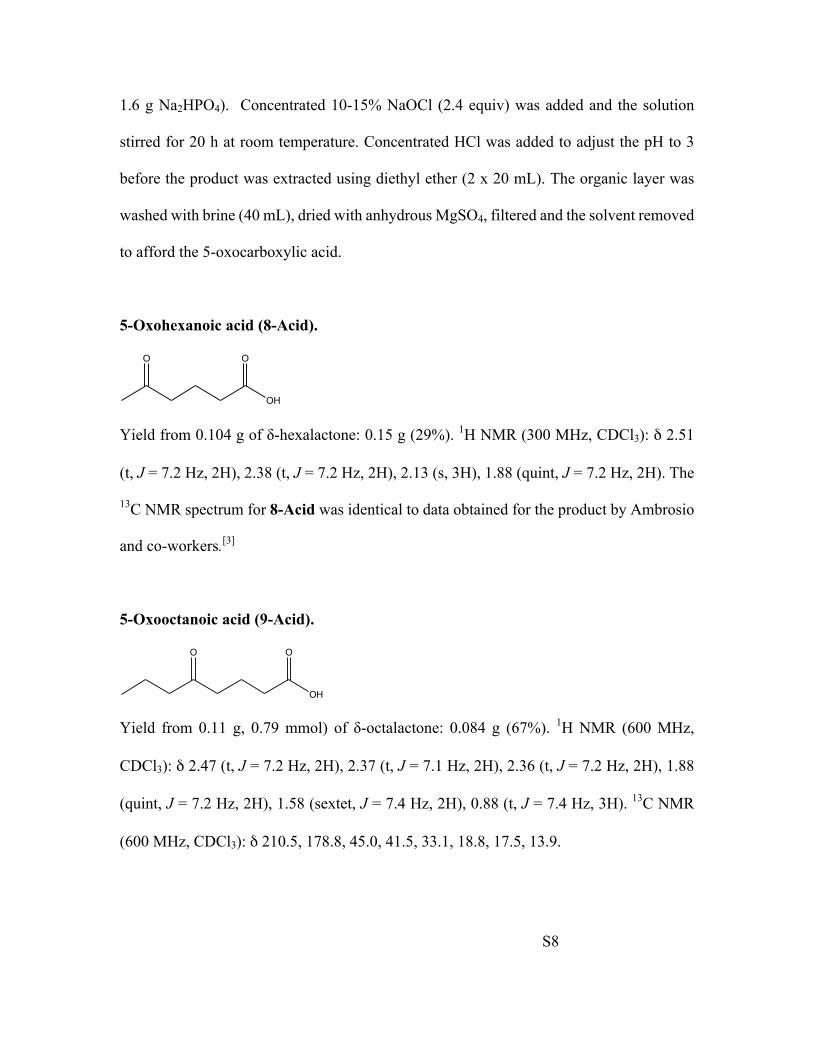
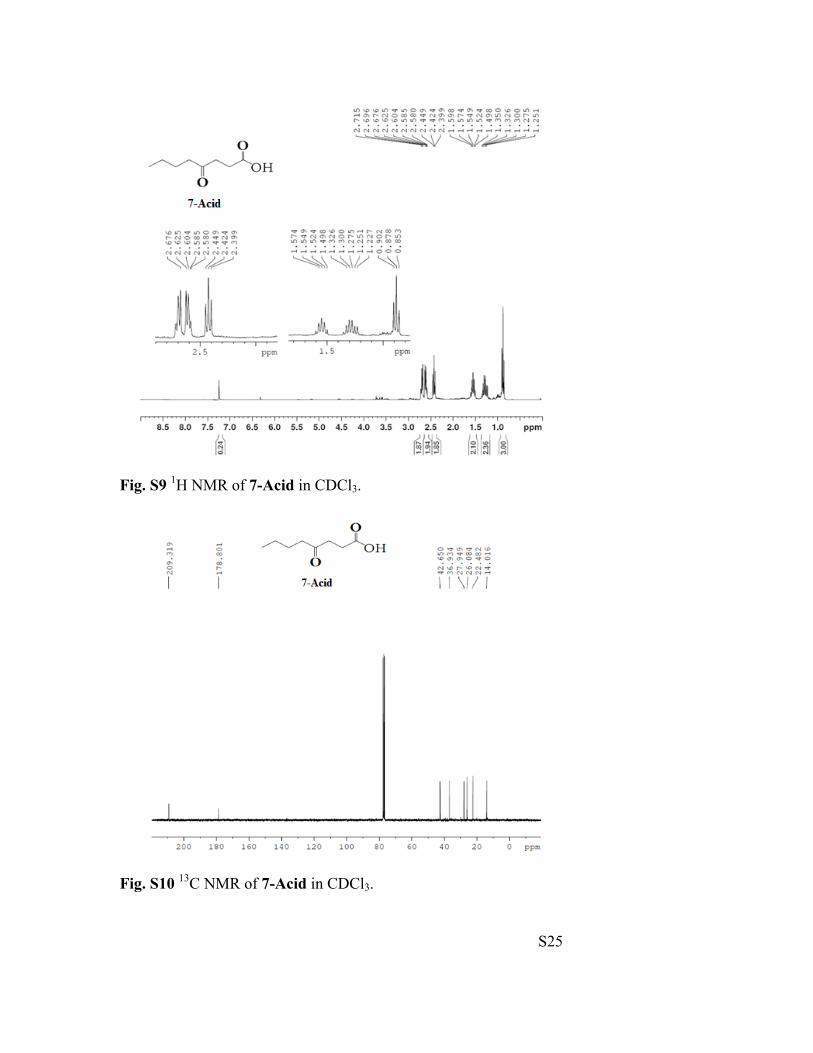
4-Oxooctanoic acid (7-Acid).
OH
O
O
Yield from 0.50 g of γ-octalactone: 0.26 g (48%). 1H NMR (300 MHz, CDCl3): δ 2.69 (t,
J = 6.2 Hz, 2H), 2.60 (t, J = 6.2 Hz, 2H), 2.42 (t, J = 7.5 Hz, 2H), 1.55 (quint, J = 7.5 Hz,
2H), 1.29 (sextet, J = 7.5 Hz, 2H), 0.88 (t, J = 7.3 Hz, 3H). 13C NMR (300 MHz, CDCl3):
δ 209.3, 178.8, 42.6, 36.9, 27.9, 26.1, 22.5, 14.0.
General procedure for preparation of 5-oxocarboxylic acids (8-Acid and 9-Acid).
Compounds 8-Acid and 9-Acid were prepared similar to the protocol described by
Ambrosio et al.[3] The appropriate alkyl-substituted δ-lactone (1 equiv) was hydrolyzed
overnight with 0.5 M NaOH in EtOH (2 equiv). The solvent was removed using reduced
pressure and the residue dissolved in ~40 mL of a phosphate buffer (5.5 g NaH2PO4 and
S8
1.6 g Na2HPO4). Concentrated 10-15% NaOCl (2.4 equiv) was added and the solution
stirred for 20 h at room temperature. Concentrated HCl was added to adjust the pH to 3
before the product was extracted using diethyl ether (2 x 20 mL). The organic layer was
washed with brine (40 mL), dried with anhydrous MgSO4, filtered and the solvent removed
to afford the 5-oxocarboxylic acid.
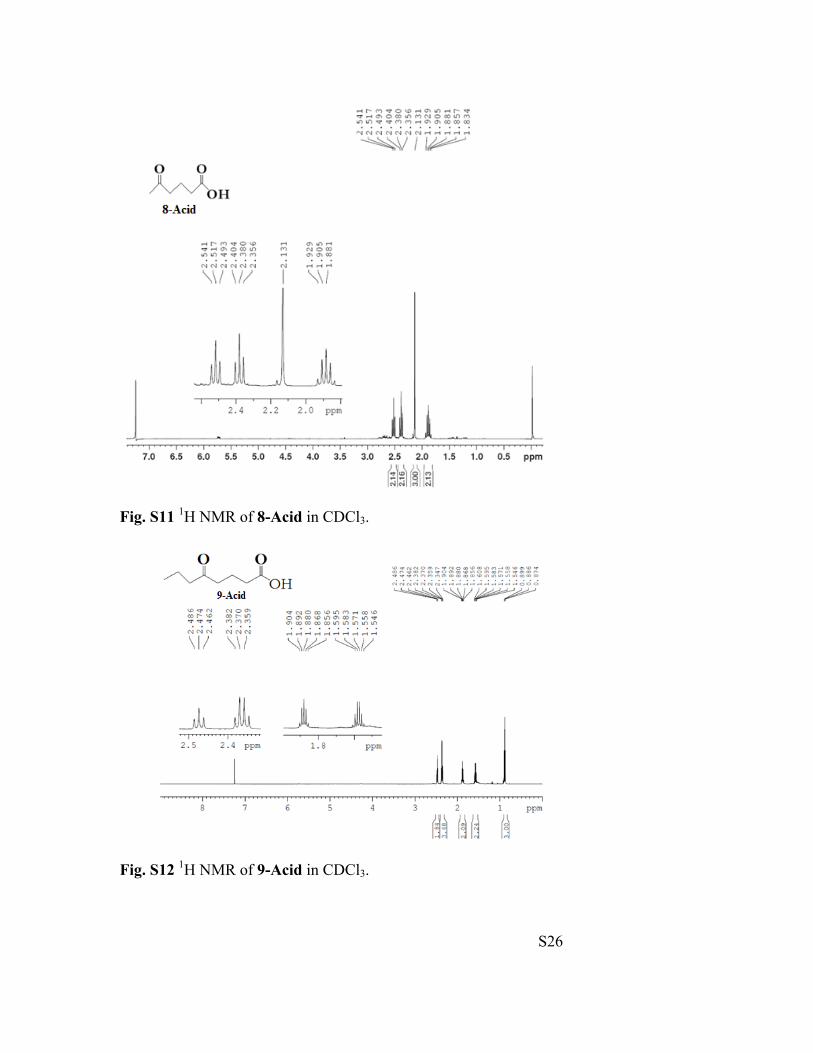
5-Oxohexanoic acid (8-Acid).
OH
OO
Yield from 0.104 g of δ-hexalactone: 0.15 g (29%). 1H NMR (300 MHz, CDCl3): δ 2.51
(t, J = 7.2 Hz, 2H), 2.38 (t, J = 7.2 Hz, 2H), 2.13 (s, 3H), 1.88 (quint, J = 7.2 Hz, 2H). The
13C NMR spectrum for 8-Acid was identical to data obtained for the product by Ambrosio
and co-workers.[3]
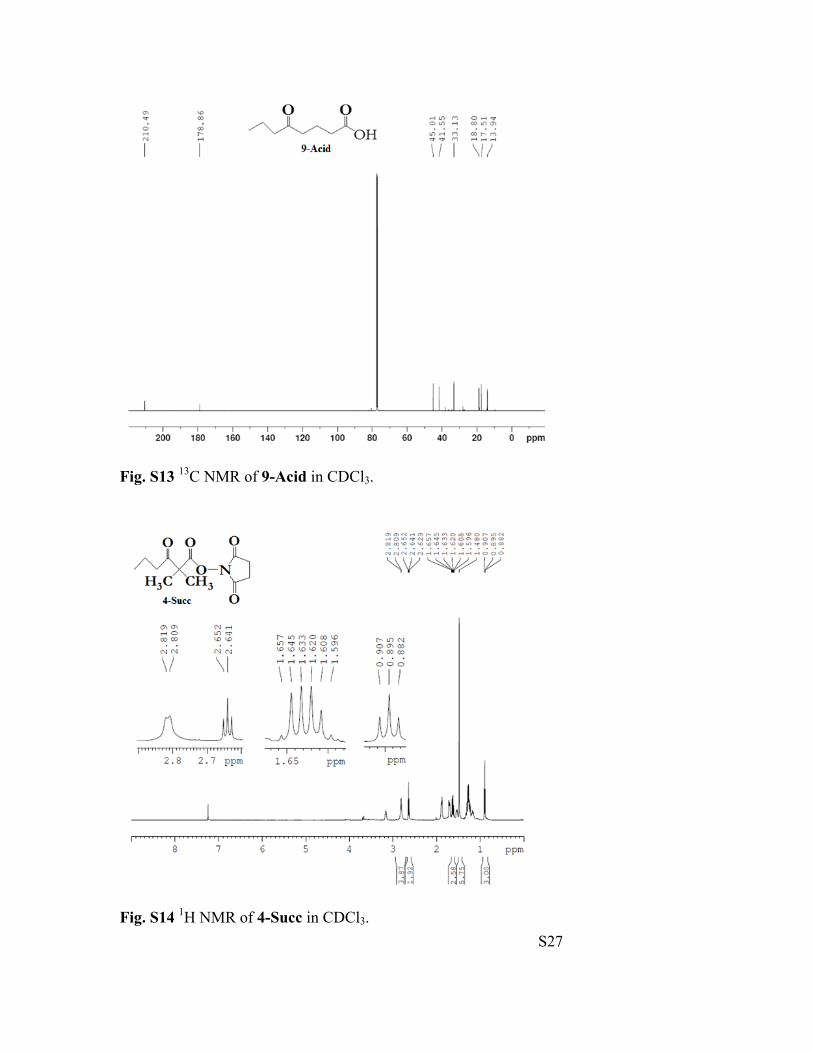
5-Oxooctanoic acid (9-Acid).
OH
OO
Yield from 0.11 g, 0.79 mmol) of δ-octalactone: 0.084 g (67%). 1H NMR (600 MHz,
CDCl3): δ 2.47 (t, J = 7.2 Hz, 2H), 2.37 (t, J = 7.1 Hz, 2H), 2.36 (t, J = 7.2 Hz, 2H), 1.88
(quint, J = 7.2 Hz, 2H), 1.58 (sextet, J = 7.4 Hz, 2H), 0.88 (t, J = 7.4 Hz, 3H). 13C NMR
(600 MHz, CDCl3): δ 210.5, 178.8, 45.0, 41.5, 33.1, 18.8, 17.5, 13.9.
S9
General Procedure for the preparation of N-hydroxysuccinimide esters (4-Succ – 15-
Succ). To a 1,4-dioxane (3 mL) solution of the appropriate carboxylic acid (1 equiv), N-
hydroxysuccinimide (1 equiv) and N,N ʹ-dicyclohexylcarbodiimide (1 equiv) were added
and stirred for 24 hours. Diethyl ether (2 mL) was added to the reaction mixture and the
white cloudy solution was filtered through Celite and the solvent removed under reduced
pressure. Warm methanol (2 mL) was used to dissolve the residue and, upon precipitation
of the urea by-product upon cooling to room temperature, the solution was filtered through
Celite and the solvent removed. The residue was then titurated with 1,4-dioxane (3 mL),
filtered with Celite and the filtrate collected and the solvent removed under reduced
pressure to give the product.
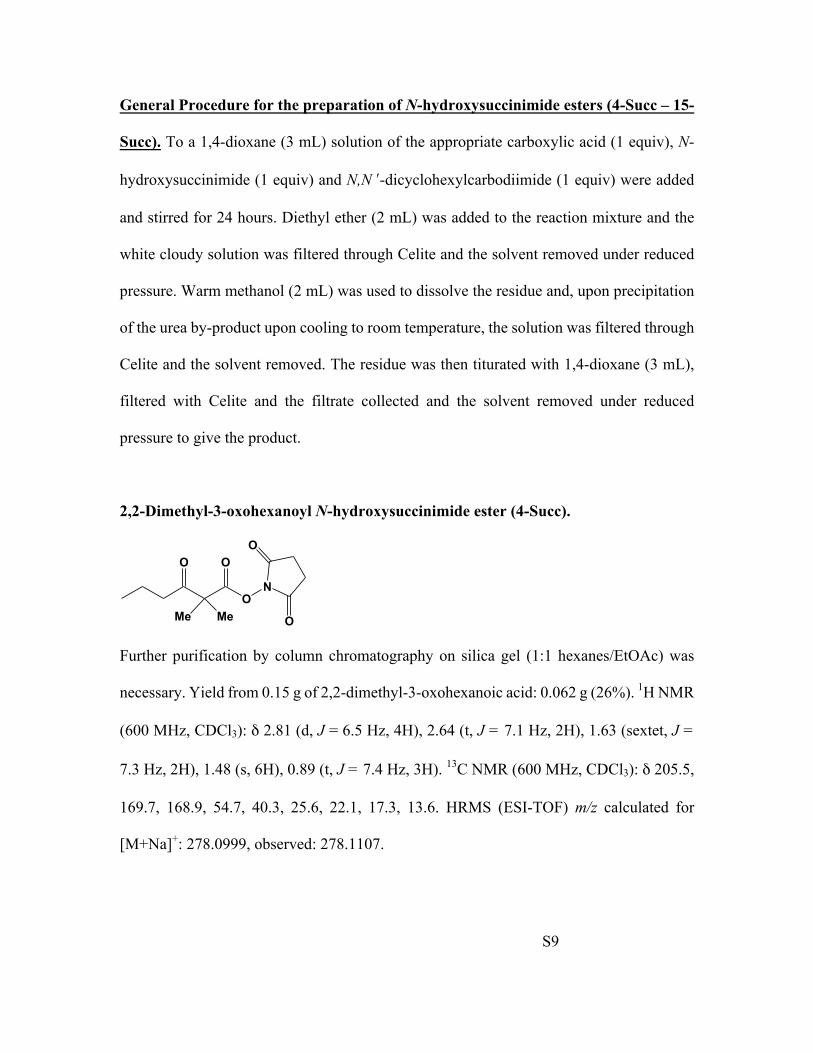
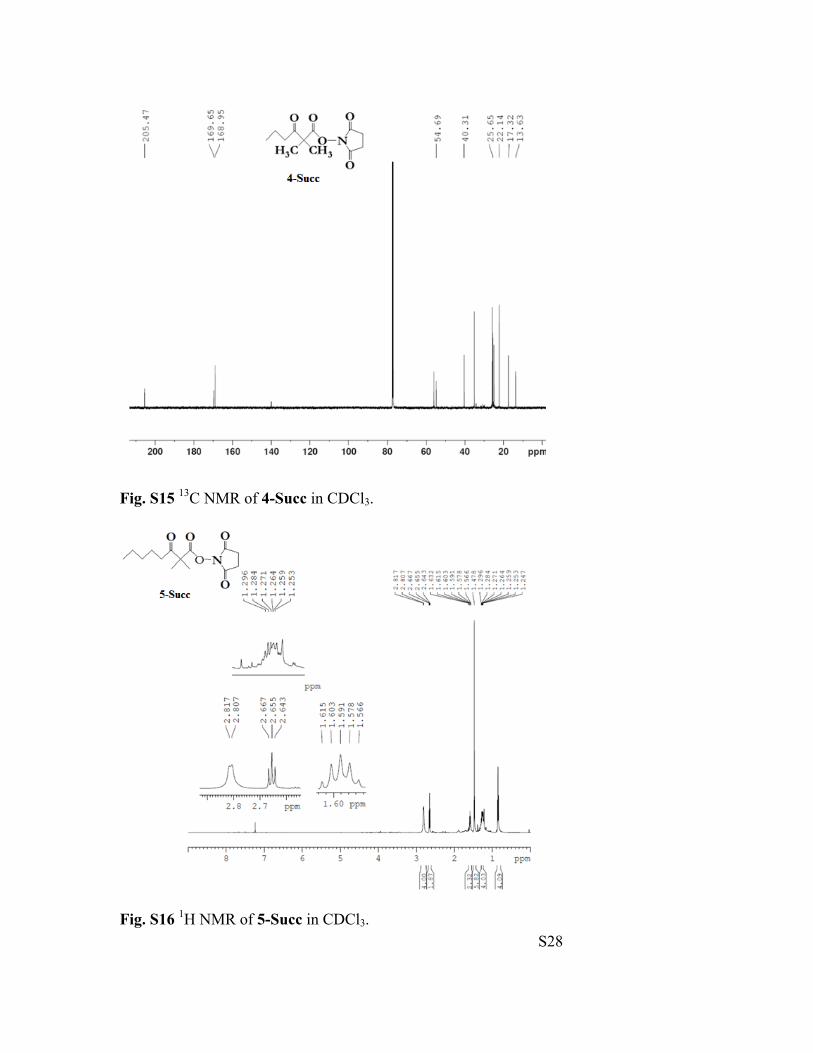
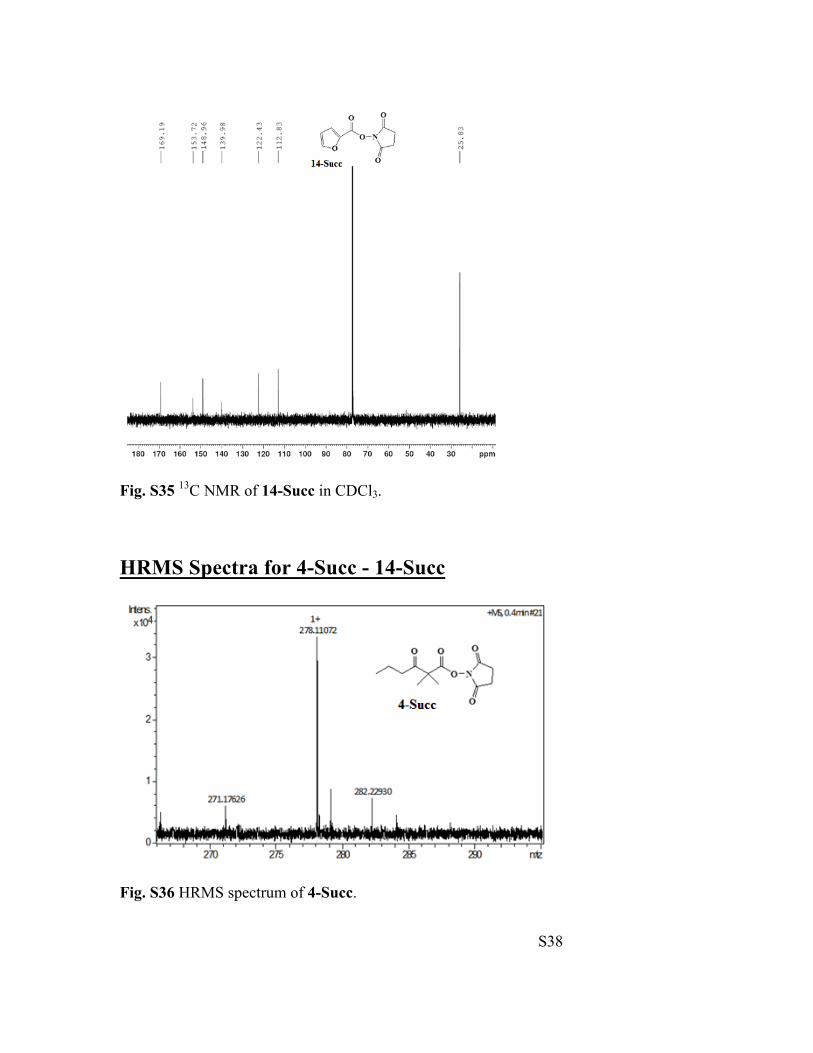
2,2-Dimethyl-3-oxohexanoyl N-hydroxysuccinimide ester (4-Succ).
O
O
O
Me Me
N
O
O
Further purification by column chromatography on silica gel (1:1 hexanes/EtOAc) was
necessary. Yield from 0.15 g of 2,2-dimethyl-3-oxohexanoic acid: 0.062 g (26%). 1H NMR
(600 MHz, CDCl3): δ 2.81 (d, J = 6.5 Hz, 4H), 2.64 (t, J = 7.1 Hz, 2H), 1.63 (sextet, J =
7.3 Hz, 2H), 1.48 (s, 6H), 0.89 (t, J = 7.4 Hz, 3H). 13C NMR (600 MHz, CDCl3): δ 205.5,
169.7, 168.9, 54.7, 40.3, 25.6, 22.1, 17.3, 13.6. HRMS (ESI-TOF) m/z calculated for
[M+Na]+: 278.0999, observed: 278.1107.
S10
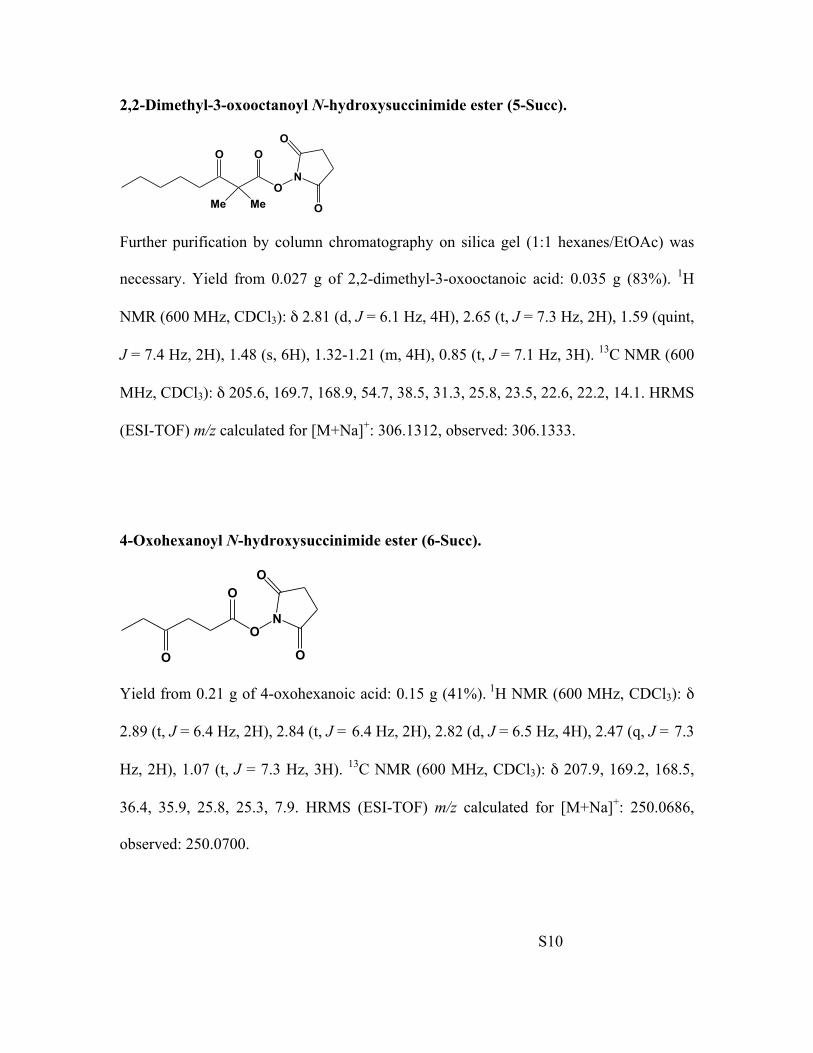
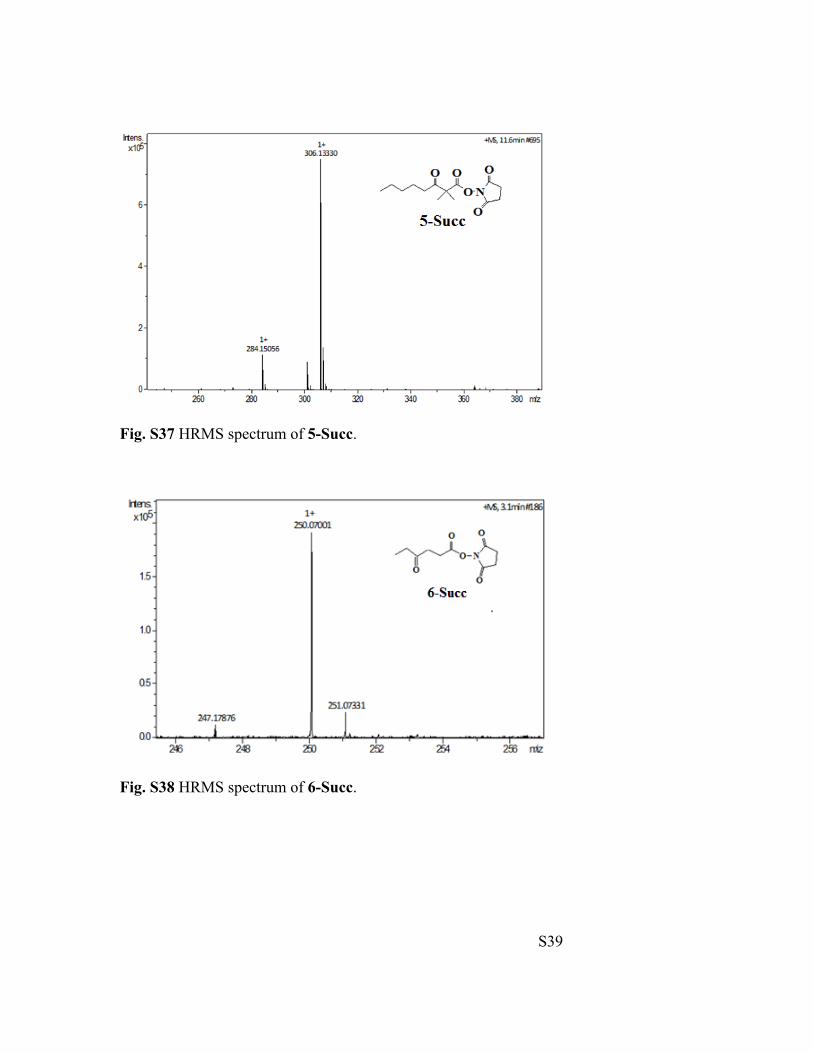
2,2-Dimethyl-3-oxooctanoyl N-hydroxysuccinimide ester (5-Succ).
O
O
O
Me Me
N
O
O
Further purification by column chromatography on silica gel (1:1 hexanes/EtOAc) was
necessary. Yield from 0.027 g of 2,2-dimethyl-3-oxooctanoic acid: 0.035 g (83%). 1H
NMR (600 MHz, CDCl3): δ 2.81 (d, J = 6.1 Hz, 4H), 2.65 (t, J = 7.3 Hz, 2H), 1.59 (quint,
J = 7.4 Hz, 2H), 1.48 (s, 6H), 1.32-1.21 (m, 4H), 0.85 (t, J = 7.1 Hz, 3H). 13C NMR (600
MHz, CDCl3): δ 205.6, 169.7, 168.9, 54.7, 38.5, 31.3, 25.8, 23.5, 22.6, 22.2, 14.1. HRMS
(ESI-TOF) m/z calculated for [M+Na]+: 306.1312, observed: 306.1333.
4-Oxohexanoyl N-hydroxysuccinimide ester (6-Succ).
O
O
O
N
O
O
Yield from 0.21 g of 4-oxohexanoic acid: 0.15 g (41%). 1H NMR (600 MHz, CDCl3): δ
2.89 (t, J = 6.4 Hz, 2H), 2.84 (t, J = 6.4 Hz, 2H), 2.82 (d, J = 6.5 Hz, 4H), 2.47 (q, J = 7.3
Hz, 2H), 1.07 (t, J = 7.3 Hz, 3H). 13C NMR (600 MHz, CDCl3): δ 207.9, 169.2, 168.5,
36.4, 35.9, 25.8, 25.3, 7.9. HRMS (ESI-TOF) m/z calculated for [M+Na]+: 250.0686,
observed: 250.0700.
S11
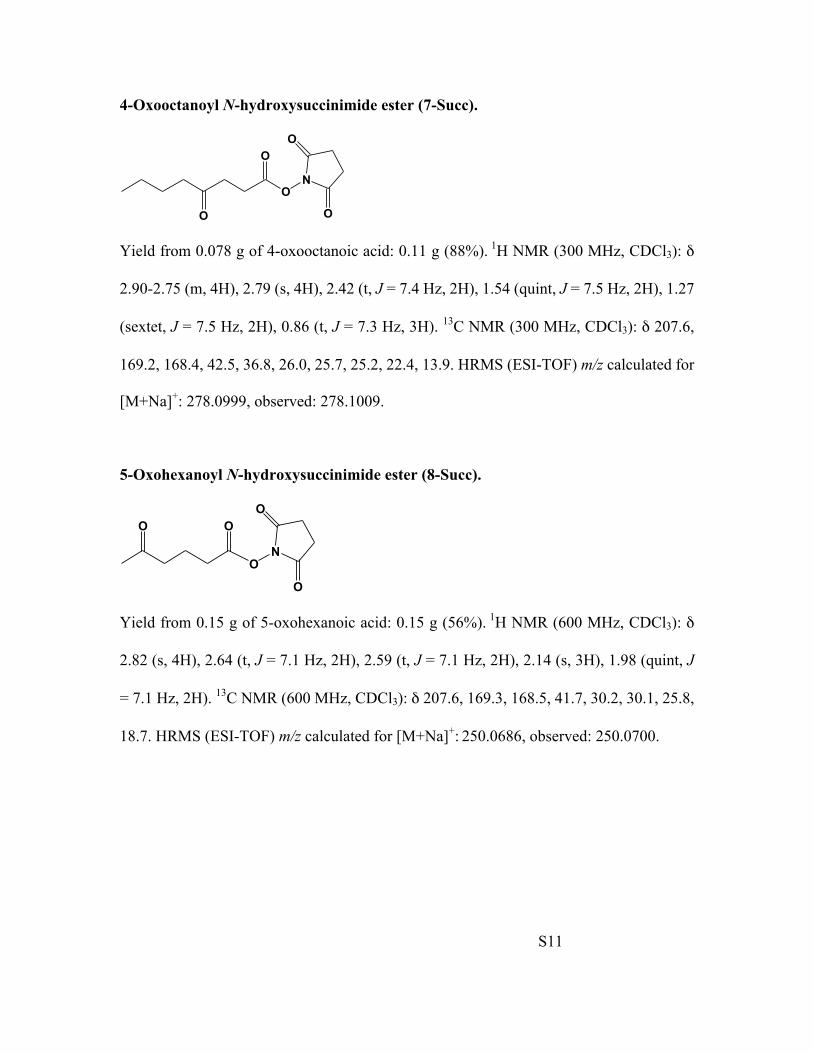
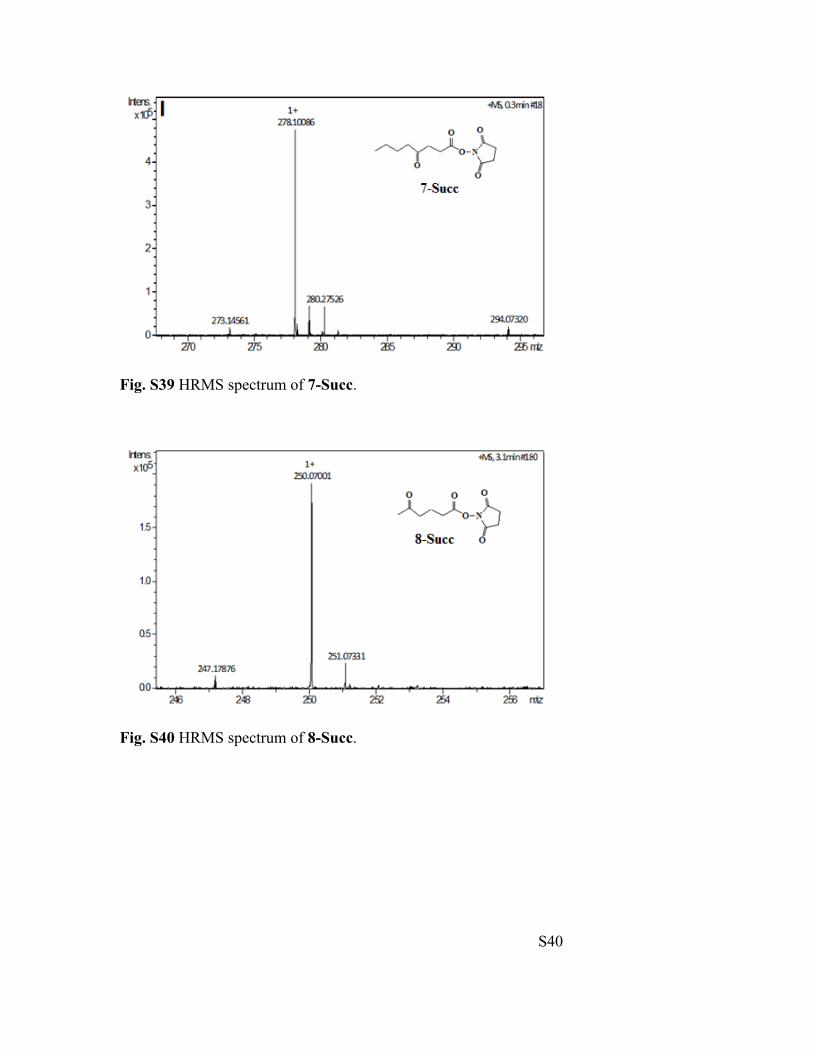
4-Oxooctanoyl N-hydroxysuccinimide ester (7-Succ).
O
O
O
N
O
O
Yield from 0.078 g of 4-oxooctanoic acid: 0.11 g (88%). 1H NMR (300 MHz, CDCl3): δ
2.90-2.75 (m, 4H), 2.79 (s, 4H), 2.42 (t, J = 7.4 Hz, 2H), 1.54 (quint, J = 7.5 Hz, 2H), 1.27
(sextet, J = 7.5 Hz, 2H), 0.86 (t, J = 7.3 Hz, 3H). 13C NMR (300 MHz, CDCl3): δ 207.6,
169.2, 168.4, 42.5, 36.8, 26.0, 25.7, 25.2, 22.4, 13.9. HRMS (ESI-TOF) m/z calculated for
[M+Na]+: 278.0999, observed: 278.1009.
5-Oxohexanoyl N-hydroxysuccinimide ester (8-Succ).
OO
ON
O
O
Yield from 0.15 g of 5-oxohexanoic acid: 0.15 g (56%). 1H NMR (600 MHz, CDCl3): δ
2.82 (s, 4H), 2.64 (t, J = 7.1 Hz, 2H), 2.59 (t, J = 7.1 Hz, 2H), 2.14 (s, 3H), 1.98 (quint, J
= 7.1 Hz, 2H). 13C NMR (600 MHz, CDCl3): δ 207.6, 169.3, 168.5, 41.7, 30.2, 30.1, 25.8,
18.7. HRMS (ESI-TOF) m/z calculated for [M+Na]+: 250.0686, observed: 250.0700.
S12
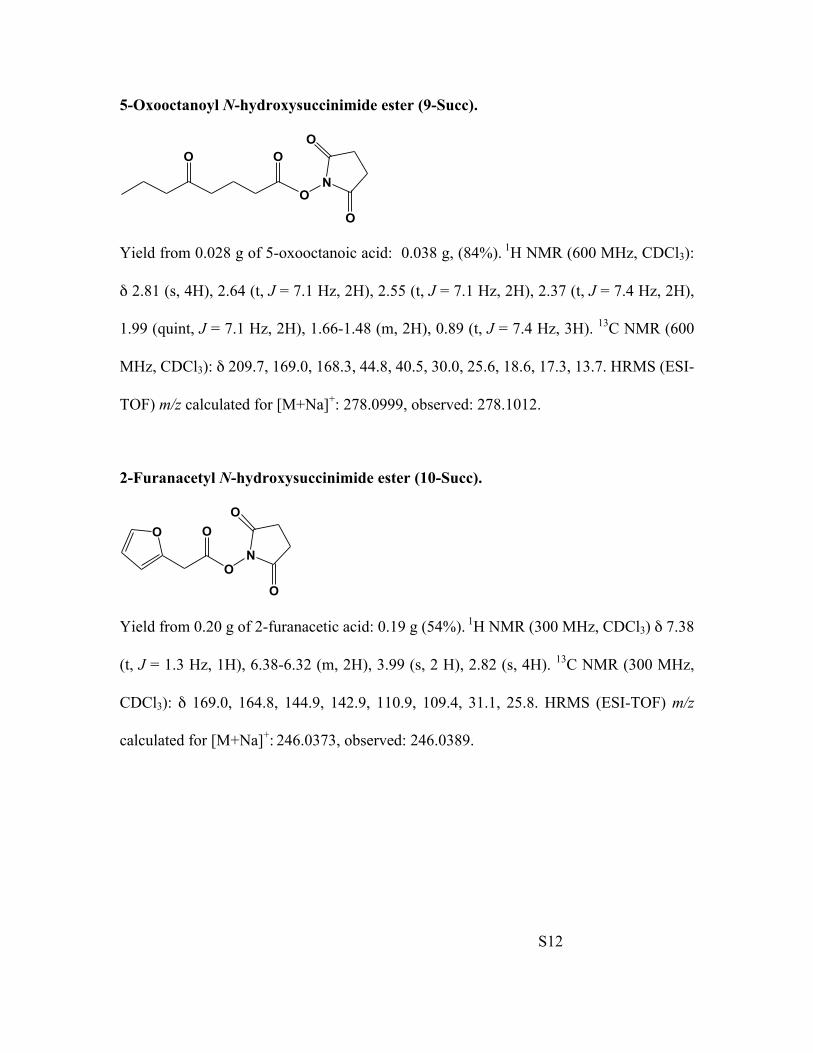
5-Oxooctanoyl N-hydroxysuccinimide ester (9-Succ).
OO
ON
O
O
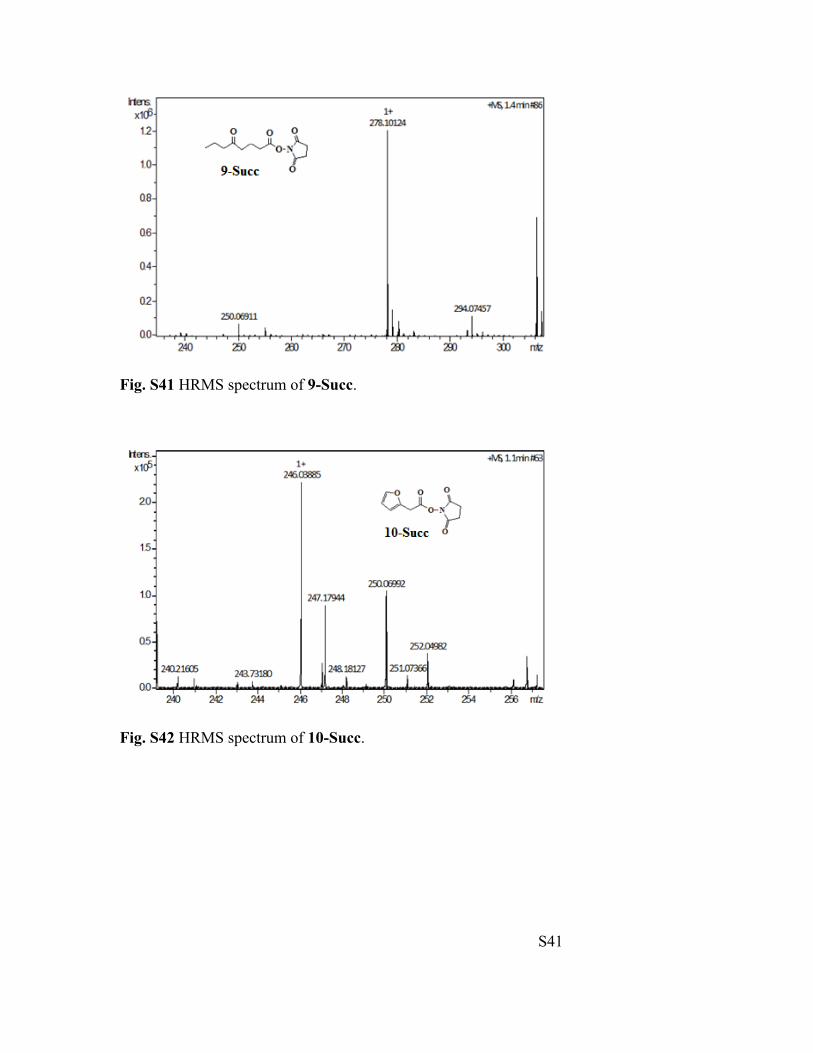
Yield from 0.028 g of 5-oxooctanoic acid: 0.038 g, (84%). 1H NMR (600 MHz, CDCl3):
δ 2.81 (s, 4H), 2.64 (t, J = 7.1 Hz, 2H), 2.55 (t, J = 7.1 Hz, 2H), 2.37 (t, J = 7.4 Hz, 2H),
1.99 (quint, J = 7.1 Hz, 2H), 1.66-1.48 (m, 2H), 0.89 (t, J = 7.4 Hz, 3H). 13C NMR (600
MHz, CDCl3): δ 209.7, 169.0, 168.3, 44.8, 40.5, 30.0, 25.6, 18.6, 17.3, 13.7. HRMS (ESI-
TOF) m/z calculated for [M+Na]+: 278.0999, observed: 278.1012.
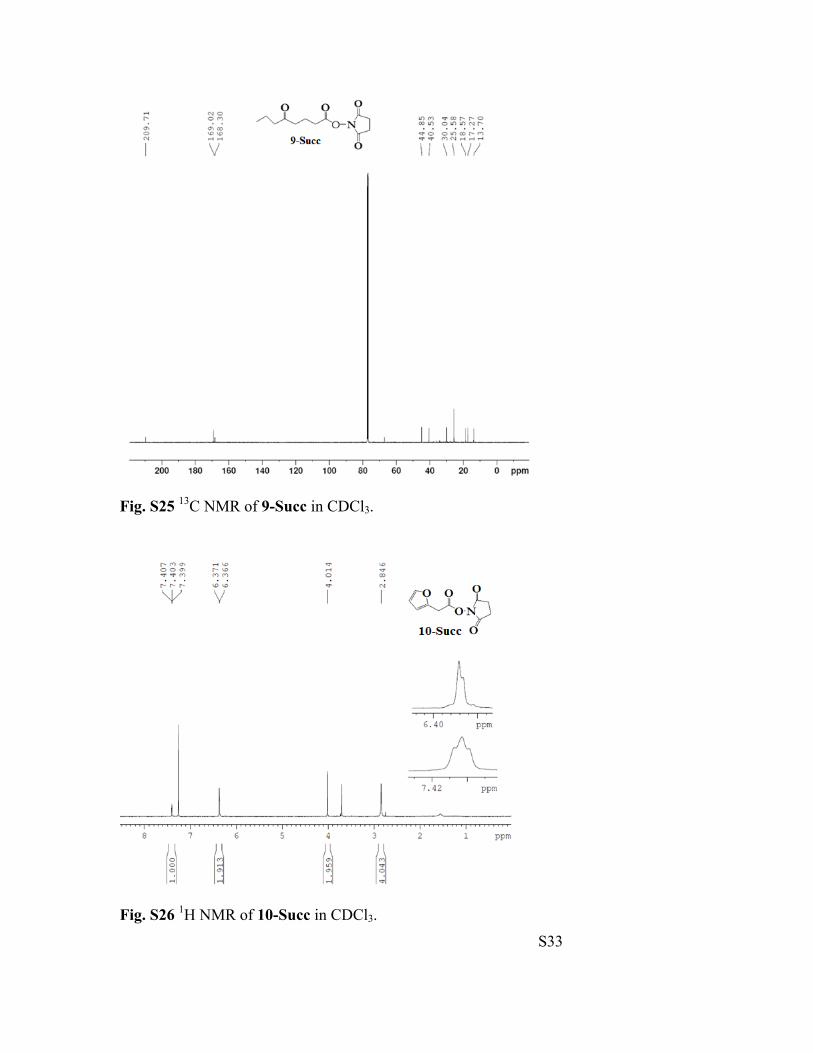
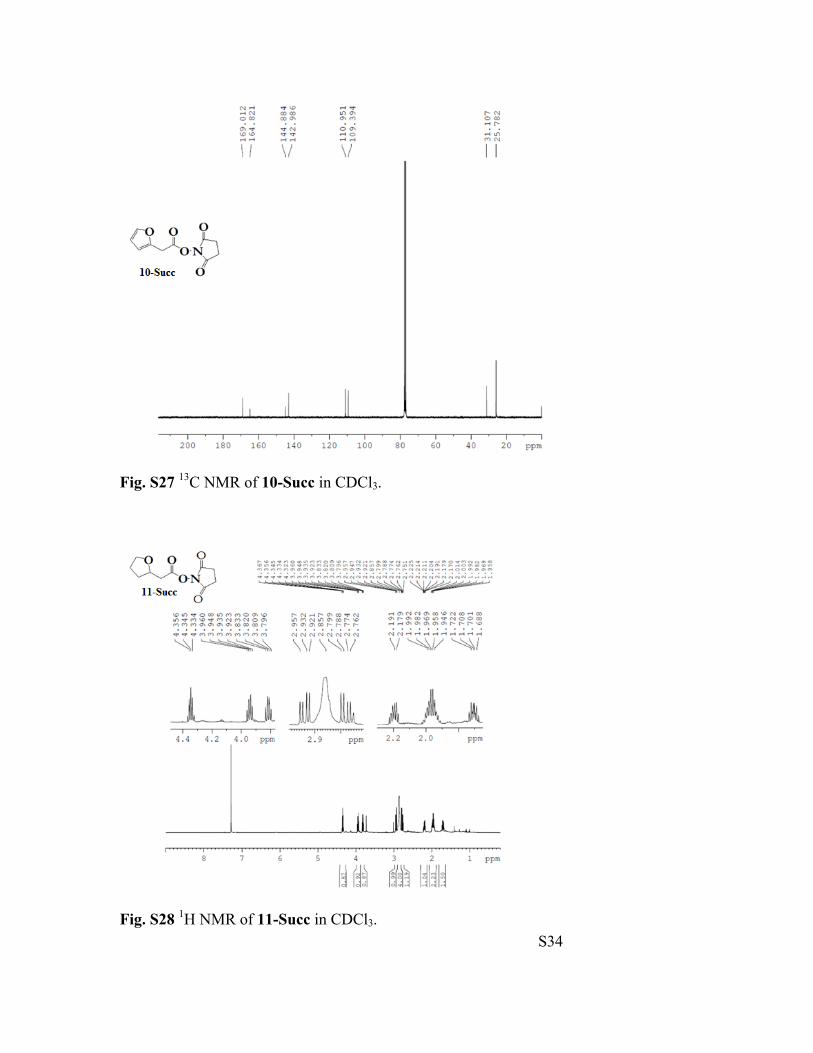
2-Furanacetyl N-hydroxysuccinimide ester (10-Succ).
O O
ON
O
O
Yield from 0.20 g of 2-furanacetic acid: 0.19 g (54%). 1H NMR (300 MHz, CDCl3) δ 7.38
(t, J = 1.3 Hz, 1H), 6.38-6.32 (m, 2H), 3.99 (s, 2 H), 2.82 (s, 4H). 13C NMR (300 MHz,
CDCl3): δ 169.0, 164.8, 144.9, 142.9, 110.9, 109.4, 31.1, 25.8. HRMS (ESI-TOF) m/z
calculated for [M+Na]+: 246.0373, observed: 246.0389.
S13
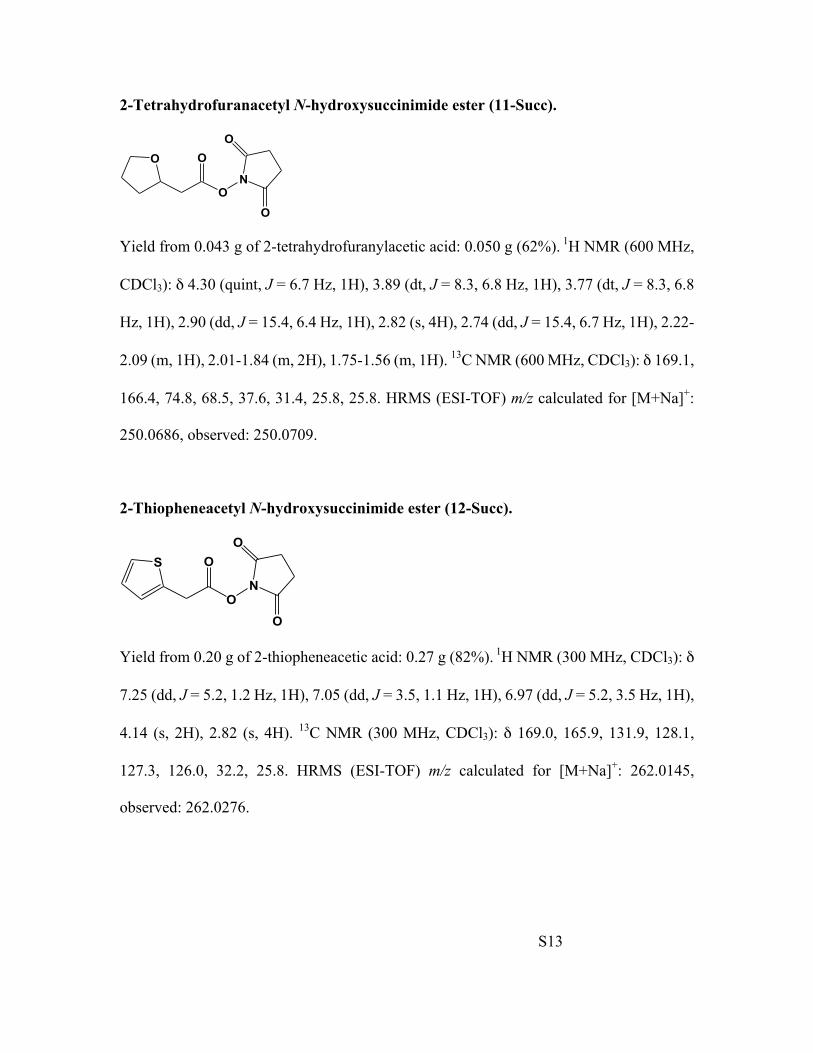
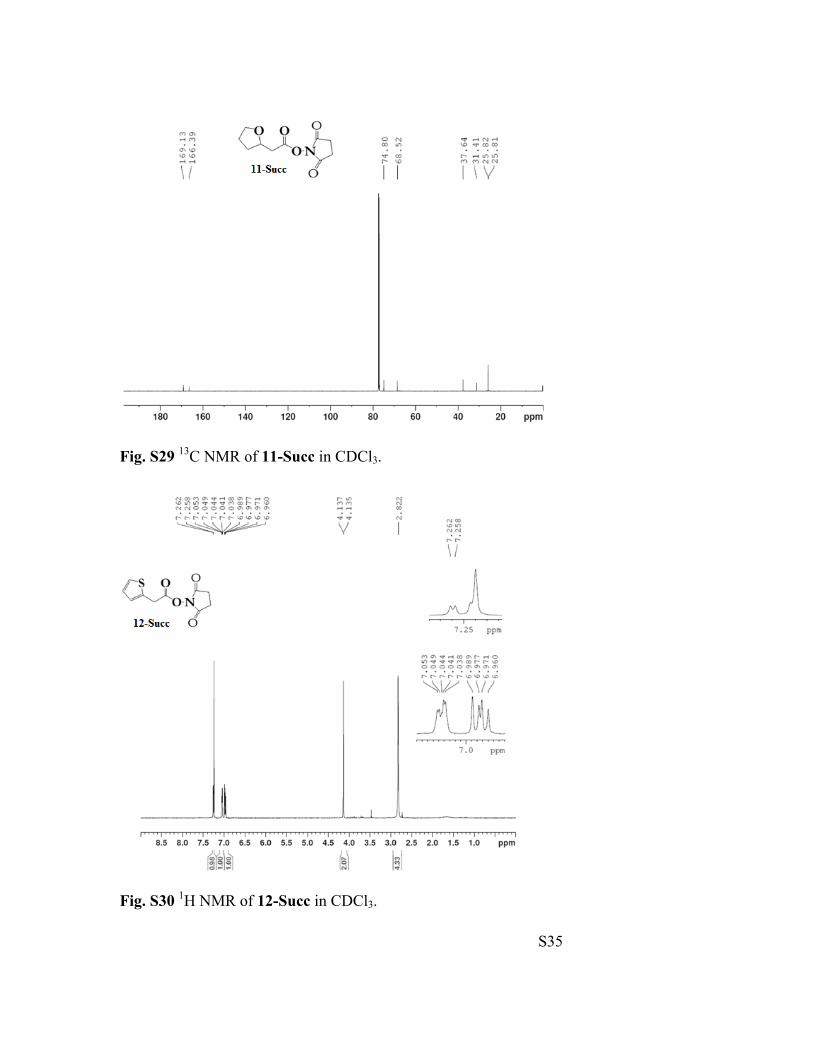
2-Tetrahydrofuranacetyl N-hydroxysuccinimide ester (11-Succ).
O O
ON
O
O
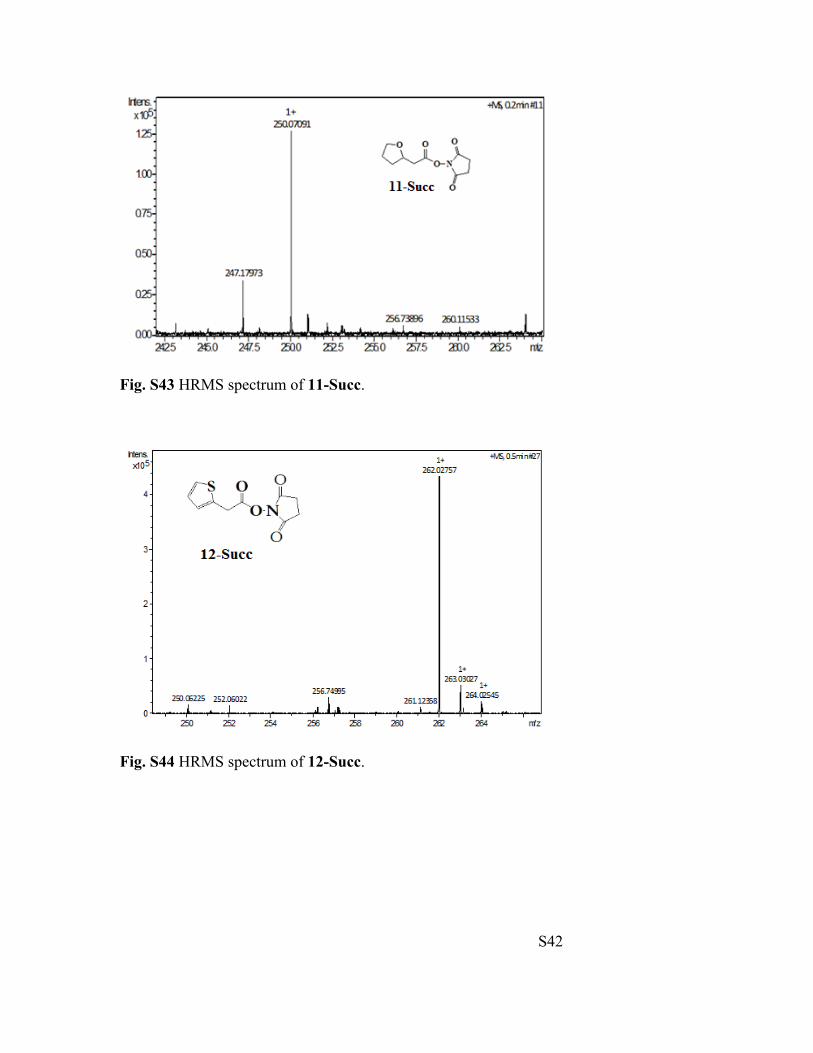
Yield from 0.043 g of 2-tetrahydrofuranylacetic acid: 0.050 g (62%). 1H NMR (600 MHz,
CDCl3): δ 4.30 (quint, J = 6.7 Hz, 1H), 3.89 (dt, J = 8.3, 6.8 Hz, 1H), 3.77 (dt, J = 8.3, 6.8
Hz, 1H), 2.90 (dd, J = 15.4, 6.4 Hz, 1H), 2.82 (s, 4H), 2.74 (dd, J = 15.4, 6.7 Hz, 1H), 2.22-
2.09 (m, 1H), 2.01-1.84 (m, 2H), 1.75-1.56 (m, 1H). 13C NMR (600 MHz, CDCl3): δ 169.1,
166.4, 74.8, 68.5, 37.6, 31.4, 25.8, 25.8. HRMS (ESI-TOF) m/z calculated for [M+Na]+:
250.0686, observed: 250.0709.
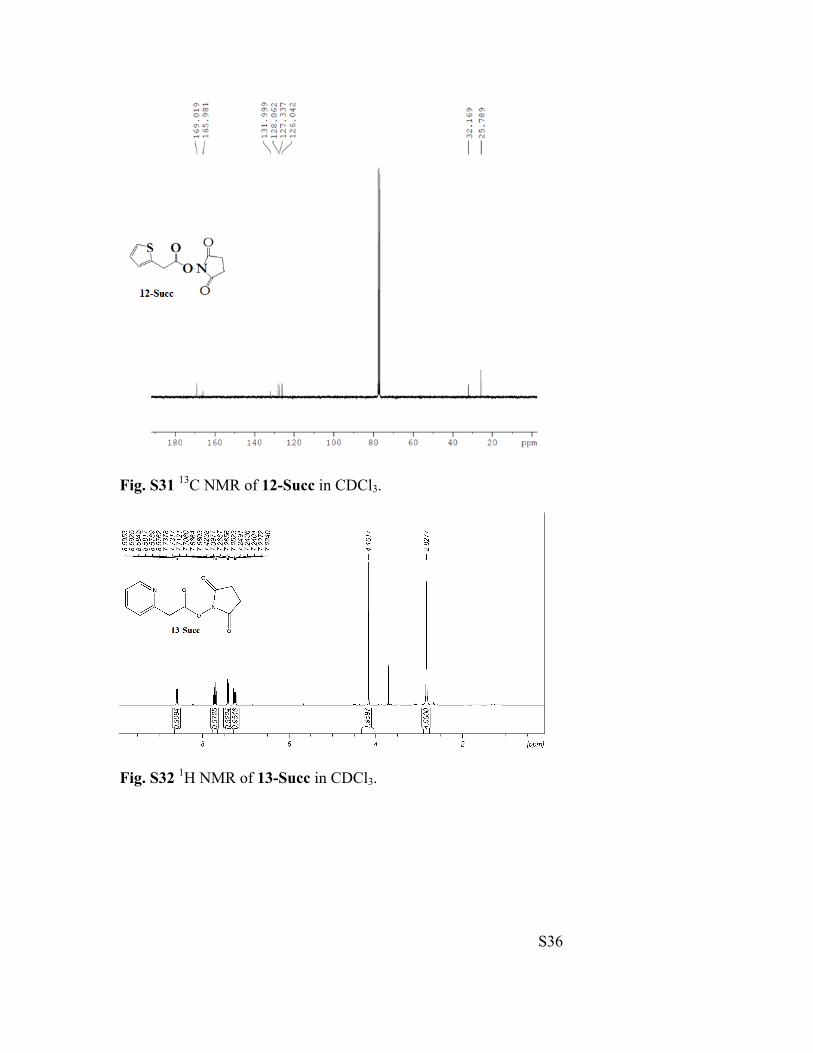
2-Thiopheneacetyl N-hydroxysuccinimide ester (12-Succ).
S O
ON
O
O
Yield from 0.20 g of 2-thiopheneacetic acid: 0.27 g (82%). 1H NMR (300 MHz, CDCl3): δ
7.25 (dd, J = 5.2, 1.2 Hz, 1H), 7.05 (dd, J = 3.5, 1.1 Hz, 1H), 6.97 (dd, J = 5.2, 3.5 Hz, 1H),
4.14 (s, 2H), 2.82 (s, 4H). 13C NMR (300 MHz, CDCl3): δ 169.0, 165.9, 131.9, 128.1,
127.3, 126.0, 32.2, 25.8. HRMS (ESI-TOF) m/z calculated for [M+Na]+: 262.0145,
observed: 262.0276.
S14
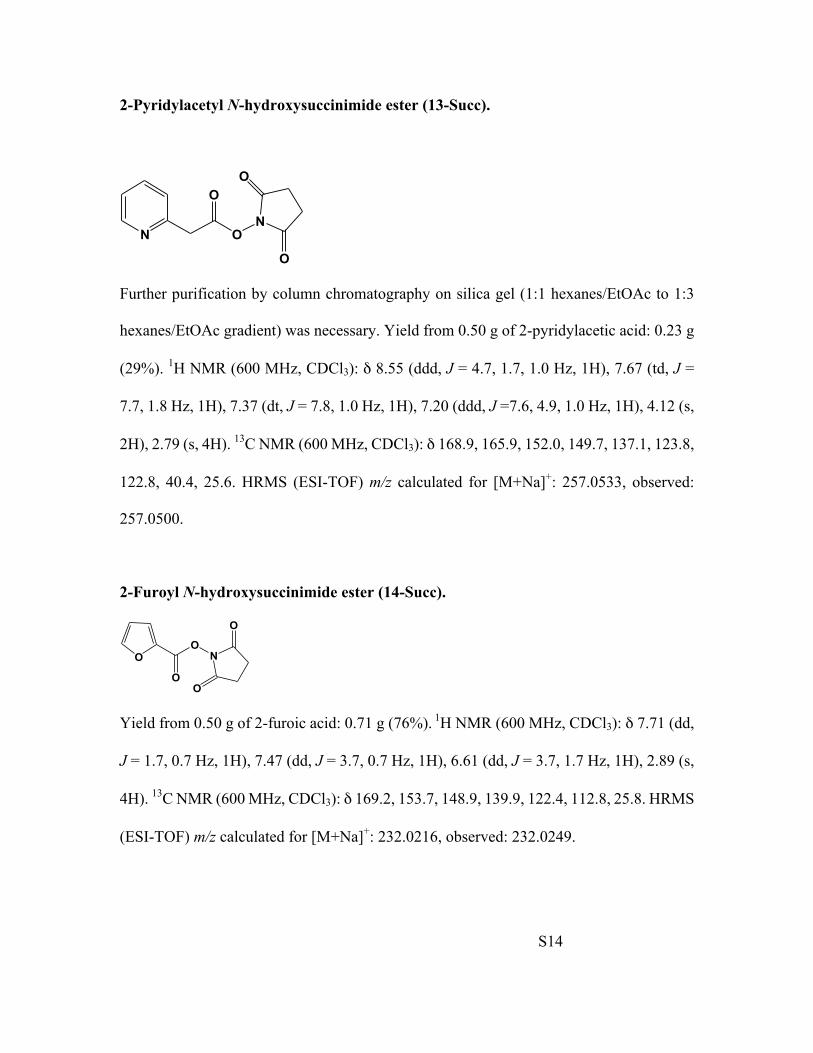
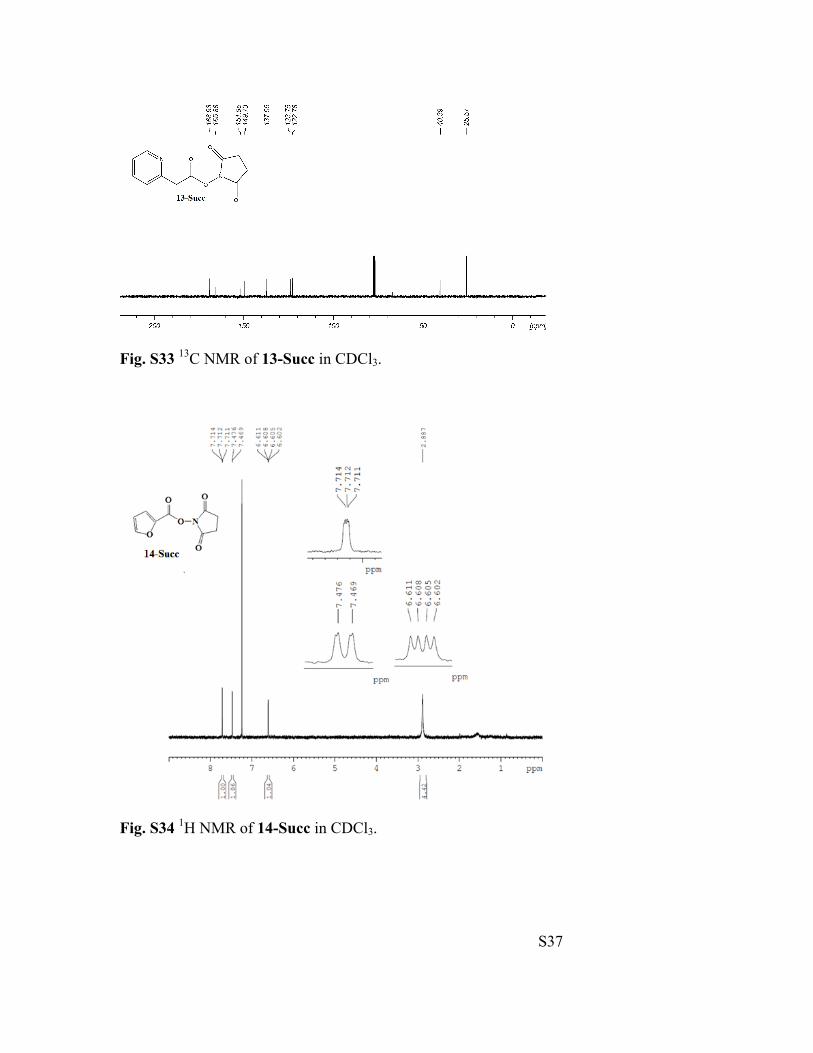
2-Pyridylacetyl N-hydroxysuccinimide ester (13-Succ).
N
O
ON
O
O
Further purification by column chromatography on silica gel (1:1 hexanes/EtOAc to 1:3
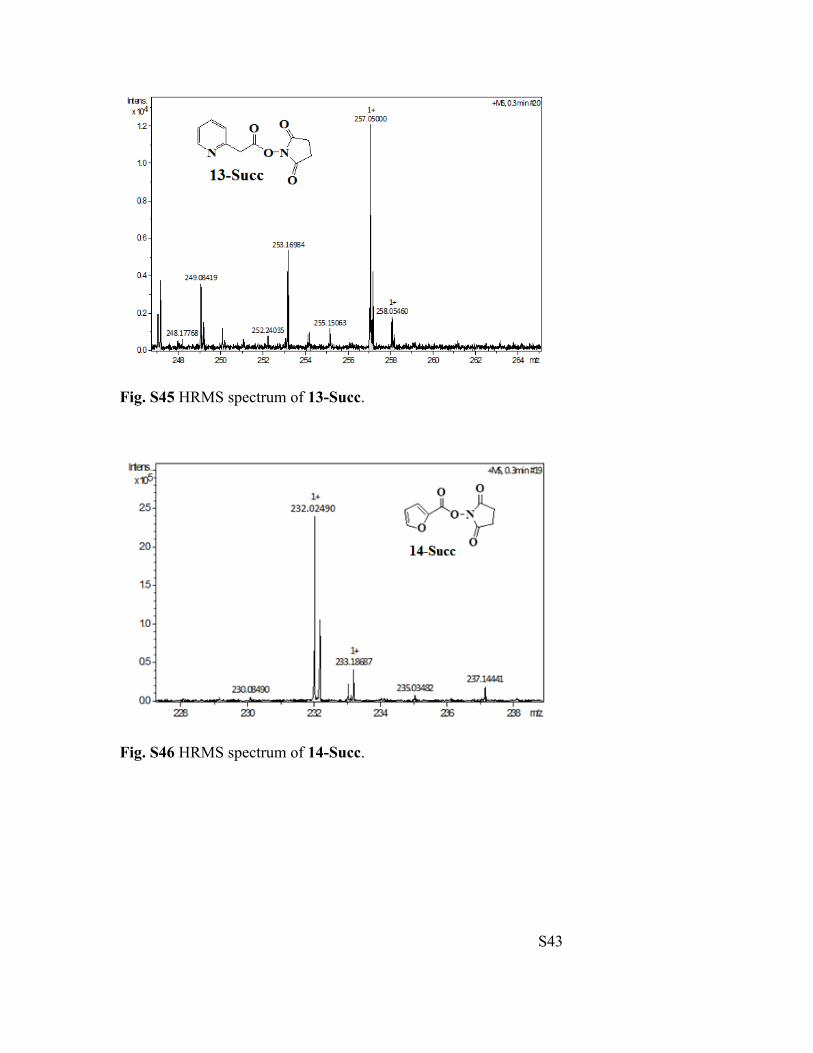
hexanes/EtOAc gradient) was necessary. Yield from 0.50 g of 2-pyridylacetic acid: 0.23 g
(29%). 1H NMR (600 MHz, CDCl3): δ 8.55 (ddd, J = 4.7, 1.7, 1.0 Hz, 1H), 7.67 (td, J =
7.7, 1.8 Hz, 1H), 7.37 (dt, J = 7.8, 1.0 Hz, 1H), 7.20 (ddd, J =7.6, 4.9, 1.0 Hz, 1H), 4.12 (s,
2H), 2.79 (s, 4H). 13C NMR (600 MHz, CDCl3): δ 168.9, 165.9, 152.0, 149.7, 137.1, 123.8,
122.8, 40.4, 25.6. HRMS (ESI-TOF) m/z calculated for [M+Na]+: 257.0533, observed:
257.0500.
2-Furoyl N-hydroxysuccinimide ester (14-Succ).
OO
O
N
O
O
Yield from 0.50 g of 2-furoic acid: 0.71 g (76%). 1H NMR (600 MHz, CDCl3): δ 7.71 (dd,
J = 1.7, 0.7 Hz, 1H), 7.47 (dd, J = 3.7, 0.7 Hz, 1H), 6.61 (dd, J = 3.7, 1.7 Hz, 1H), 2.89 (s,
4H). 13C NMR (600 MHz, CDCl3): δ 169.2, 153.7, 148.9, 139.9, 122.4, 112.8, 25.8. HRMS
(ESI-TOF) m/z calculated for [M+Na]+: 232.0216, observed: 232.0249.
S15
General preparation of acyl-CoA compounds (1-CoA – 14-CoA). Under inert
conditions, the appropriate acyl-N-hydroxysuccinimide ester (0.2 mmol, 2 equiv) was
dissolved in a mixture consisting of water/dimethylformamide (1:1, 3 mL). K2CO3 was
added to adjust the pH of the solution to 8-9. To this reaction mixture, free CoA (0.1 mmol,
1 equiv) was added with gentle mixing. The reaction was stirred at room temperature
overnight under a nitrogen atmosphere. The reaction mixture was washed twice with
diethyl ether (2 x 3 mL) to remove any organic contaminants. The aqueous layer was
collected and filtered through a 0.22 µm centrifugal spin filter. Acyl-CoA was purified by
a preparative C-18 reverse-phase HPLC with gradient beginning at 95% buffer B (25 mM
ammonium acetate, pH 5) and ending at 95% solvent D (acetonitrile + 0.1% TFA) at a flow
rate of 3 mL/min over a period of 25 minutes.
Mass determination of acyl-CoA compounds (4-CoA – 14-CoA). Acyl-CoA compounds
4-CoA – 14-CoA were characterized on an ultra-high resolution Bruker maXis Quadrupole
Time of Flight (QTOF) instrument using direct injection to the MS. The ESI source was
operated under the following conditions: positive ion mode, nebulizer pressure: 0.4 Bar;
flow rate of drying gas (N2): 4L/min; drying gas temperature: 200 ºC; voltage between HV
capillary and HV end-plate offset: 3000 V to -500 V; and the quadrupole ion energy was
4.0 eV. Sodium formate was used to calibrate the system in the mass range. All MS data
was analyzed using the Compass Data Analysis software package (Bruker Corporation,
Billerica, Massachusetts).
S16
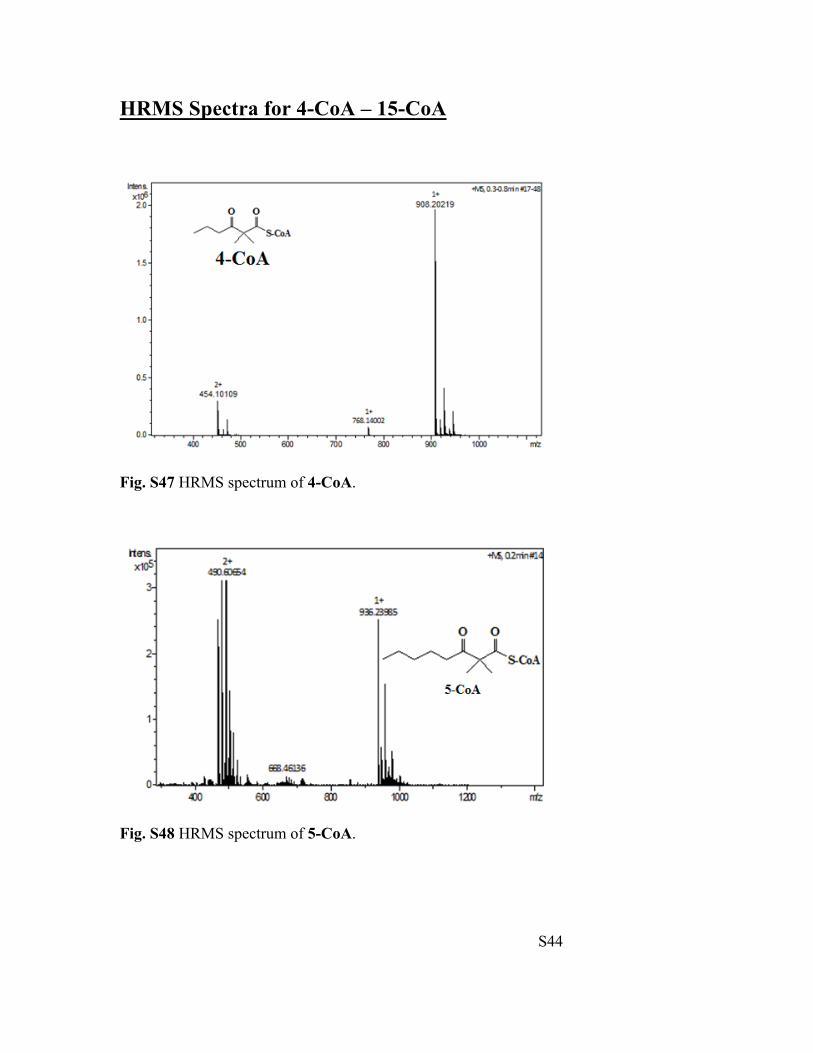
2,2-Dimethyl-3-oxohexanoyl-CoA (4-CoA): HRMS (ESI-TOF) m/z calculated for
[M+H]+: 908.2062, observed: 908.2022.
2,2-Dimethyl-3-oxooctanoyl-CoA (5-CoA): HRMS (ESI-TOF) m/z calculated for
[M+H]+: 936.2375, observed: 936.2399.
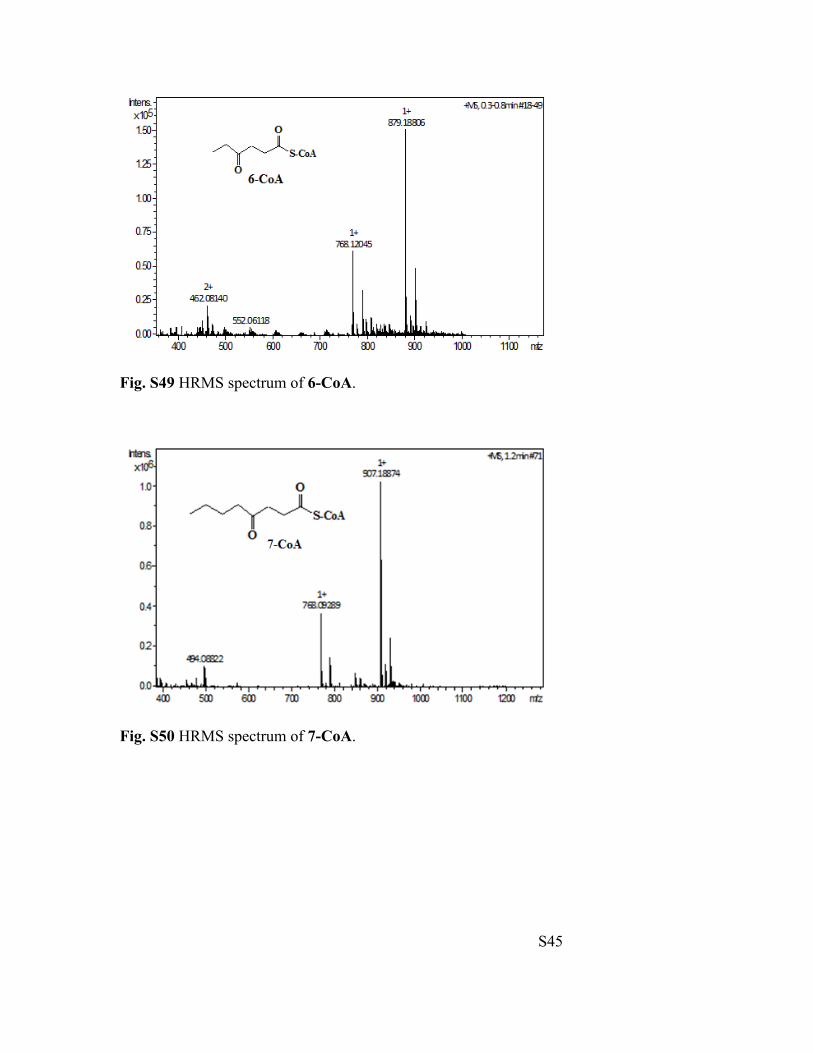
4-Oxohexanoyl-CoA (6-CoA): HRMS (ESI-TOF) m/z calculated for [M+H]+: 879.1671,
observed: 879.1881.
4-Oxooctanoyl-CoA (7-CoA): HRMS (ESI-TOF) m/z calculated for [M+H]+: 907.1984,
observed: 907.1887.
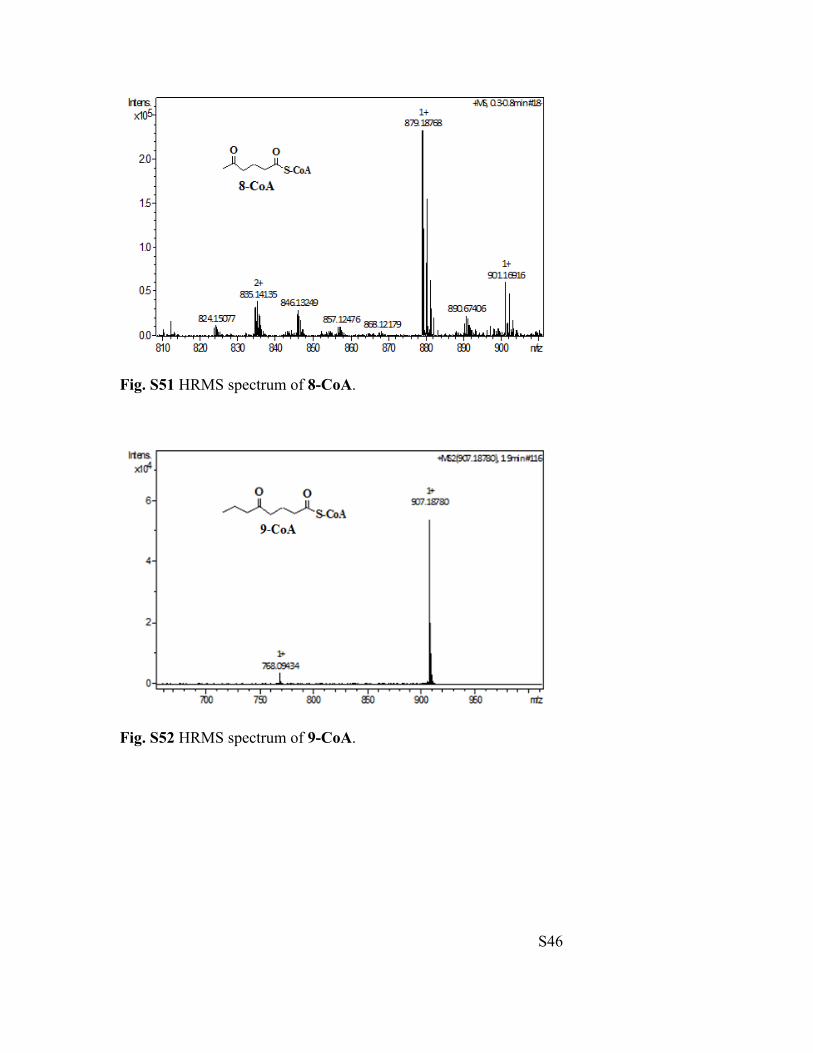
5-Oxohexanoyl-CoA (8-CoA): HRMS (ESI-TOF) m/z calculated for [M+H]+: 879.1671,
observed: 879.1877.
5-Oxooctanoyl-CoA (9-CoA): HRMS (ESI-TOF) m/z calculated for [M+H]+: 907.1984,
observed: 907.1878.
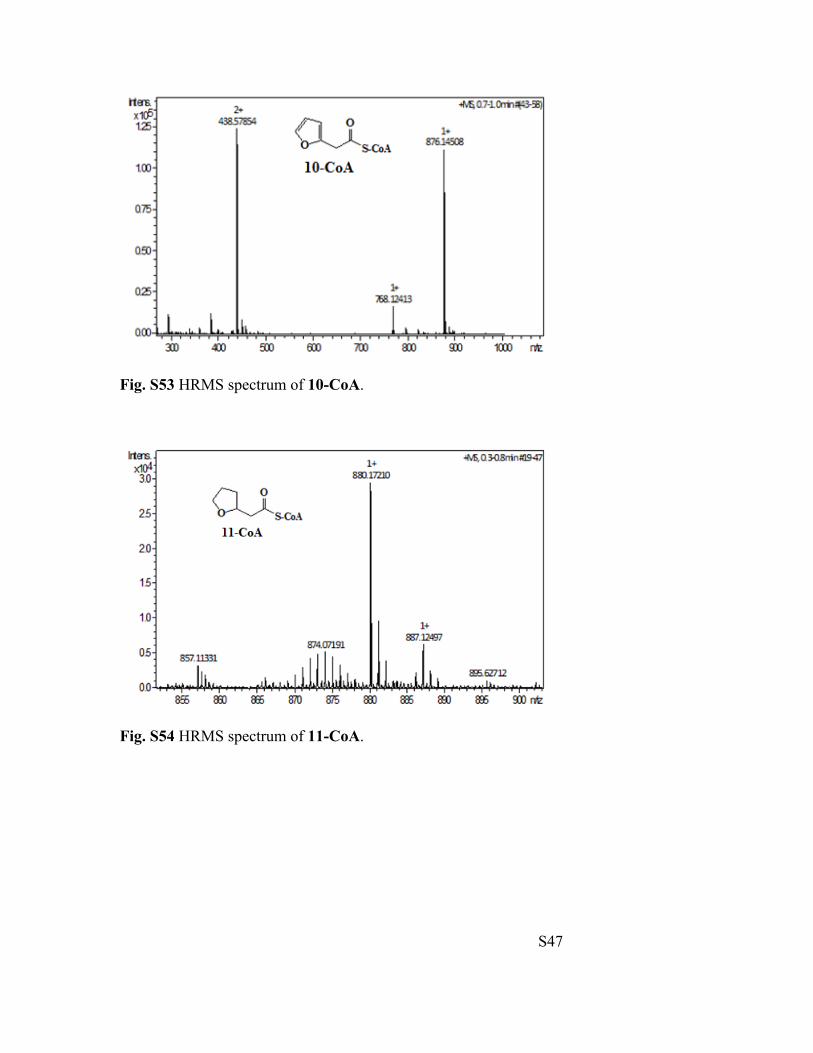
2-Furanacetyl-CoA (10-CoA): HRMS (ESI-TOF) m/z calculated for [M+H]+: 876.1436,
observed: 876.1451.
2-Tetrahydrofuranacetyl-CoA (11-CoA): HRMS (ESI-TOF) m/z calculated for [M+H]+:
880.1749, observed: 880.1721.
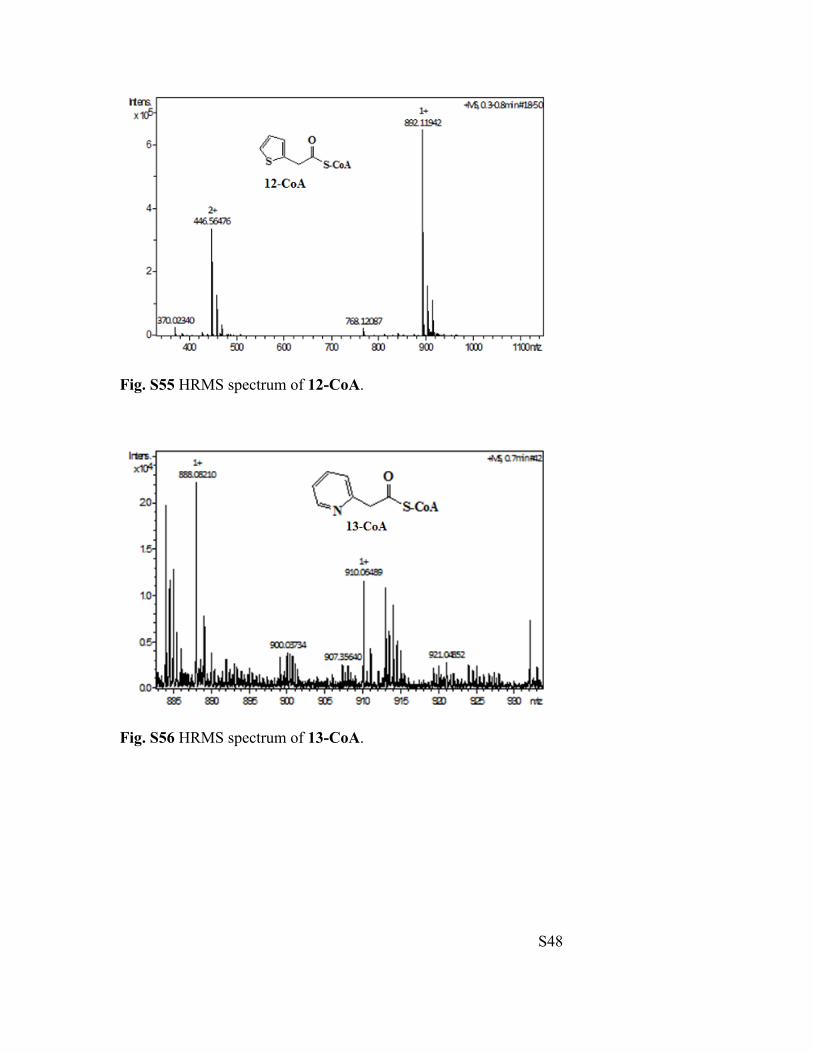
2-Thiopheneacetyl-CoA (12-CoA): HRMS (ESI-TOF) m/z calculated for [M+H]+:
892.1208, observed: 892.1194.
2-Pyridylacetyl-CoA (13-CoA): HRMS (ESI-TOF) m/z calculated for [M+H]+: 887.1596,
observed: 888.0821.
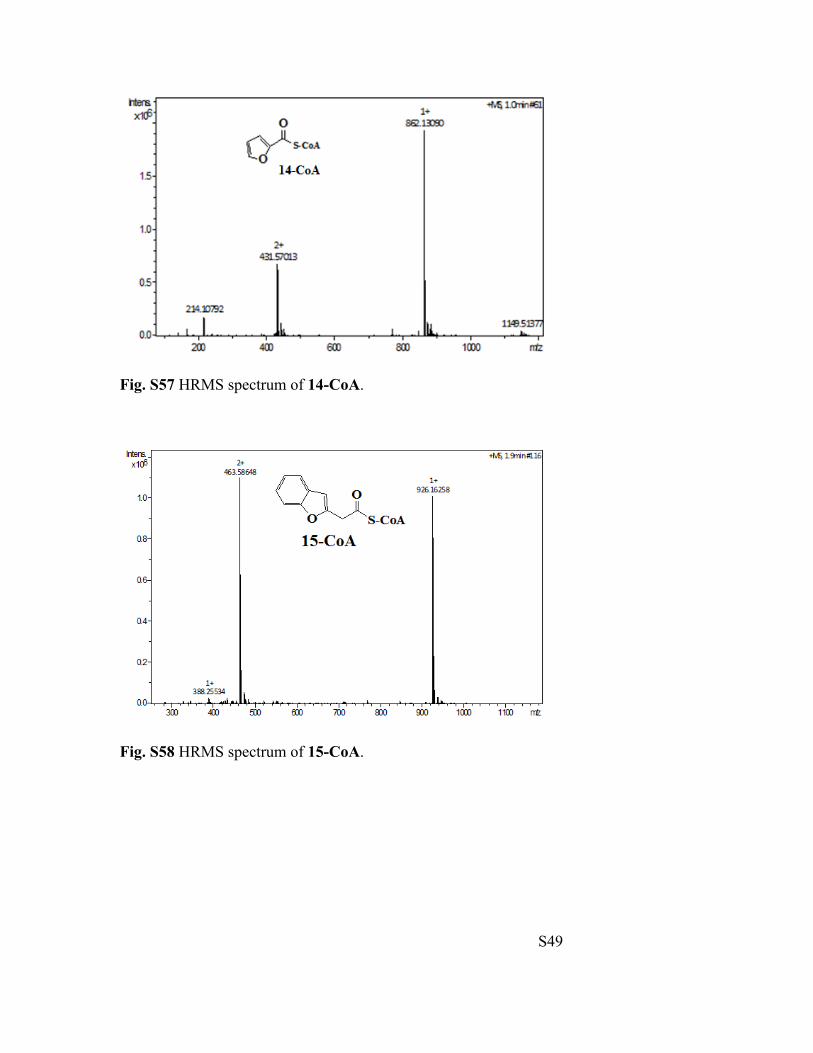
2-Furoyl-CoA (14-CoA): HRMS (ESI-TOF) m/z calculated for [M+H]+: 862.1280,
observed: 862.1309.
S17
Preparation of 2-Benzofuranacetyl-CoA (15-CoA). To a solution of acetonitrile (3 mL)
at -5 ºC, 2-benzofuranacetic acid (10 mg, 0.057 mmol) and 1,1ʹ-carbonyldiimidazole (12
mg, 0.073 mmol) were added. The reaction mixture was stirred at below 0 ºC for 1.5 hours.
In a separate flask containing a 1:1 acetonitrile:water solution (2 mL), free CoA (22 mg,
0.037 mmol) was dissolved under a nitrogen atmosphere. The reaction mixture containing
the 2-benzofuranacetic acid and 1,1ʹ-carbonyldiimidazole was transferred into the free
CoA solution and continued to stir under nitrogen for another 3-5 hours at 0 ºC. The crude
product was collected and filtered through a 0.22 µm centrifugal spin filter.
Benzofuranacetyl-CoA was purified by a preparative C-18 reverse-phase HPLC with
gradient beginning at 95% buffer B (25 mM ammonium acetate, pH 5) and ending at 95%
solvent D (acetonitrile + 0.1% TFA) at flow rate of 3 mL/min over a period of 25 minutes.
HRMS (ESI-TOF) m/z calculated for [M+H]+: 926.1593, observed: 926.1626.
S18
General preparation of acyl-ACP compounds (1-ACP – 15-ACP). Acyl-ACP
compounds 1-ACP – 15-ACP can be synthesized by enzymatic modification of apo-ACP
with acyl-CoA analogs 1-CoA – 15-CoA using phosphopantheinyl transferase, B. subtilis
Sfp. The reaction mixture contained nanopure water, 50 mM Tris-HCl, pH 6.8, 10 mM
MgCl2, apo-ACP (1 equiv), acyl-CoA (1.25 equiv), and 3 µM Sfp. The appropriate acyl-
CoA was added in three portions over 15 minute intervals. The reaction was incubated at
37 °C and the reaction monitored by removing and adding 10 µL aliquots to 90 µL
nanopure water and monitoring the reaction progress using analytical C-18 reverse-phase
UHPLC. Acyl-ACP separation using UHPLC began with 75% solvent A (99.9% H2O +
0.1% TFA) and 25% solvent D (99.9% acetonitrile + 0.1% TFA), and ended with 25%
solvent A and 75% solvent D over a period of 10 minutes at flow rate of 600 µL/min. The
reaction time varied from 1 hour to 4 hours. Once the reaction went to completion,
ammonium sulfate was added to the reaction mixture to 75% saturation to precipitate out
Sfp. After at least 1 hour of stirring at 4 °C, the reaction solution was centrifuged to pellet
out Sfp at 13,000 xg for 15 minutes. The clear supernatant containing acyl-ACP solution
was desalted and concentrated by multiple washes with nanopure water and then 10 mM
MES, pH 6 + 20% glycerol buffer using a 3 kD molecular cutoff spin filter column.
Concentration of acyl-ACP was determined using UV-Vis (ε280 = 1490 M-1 cm-1).
S19
Mass determination of Acyl-ACP proteins. Molecular mass of ACP and its derivatives
were determined by high performance liquid chromatography mass spectrometry (HPLC-
MS) using an ultra-high resolution Quadrupole Time of Flight (QTOF) instrument (Bruker
maXis, Bruker Corporation, Billerica, Massachusetts). The electrospray ionization (ESI)
source was operated under the following conditions: positive ion mode; nebulizer pressure:
1.2 Bar; flow rate of drying gas (N2): 8 L/min; drying gas temperature: 200 °C; voltage
between HV capillary and HV end-plate offset: 3000 V to −500 V; and the quadrupole ion
energy was 4.0 eV. Low concentration ESI tuning mix (Agilent Technologies, Santa Clara,
California) was used to calibrate the system in the mass range. HPLC separation was
achieved using a Dionex UltiMate® 3000 uHPLC system (Dionex Corporation,
Sunnyvale, California). Ten microliter of samples were injected onto a Phenomenex
Kinetex XB-C18 column (100 x 2.1 mm, 2.6µm) (Phenomenex Corporation, Torrance,
California) at a flow rate of 0.3 mL/min followed by a simple linear gradient for sample
desalting and separation. The initial eluent was 98% mobile phase A (99.9% water, 0.1%
formic acid) and 2% B (99.9% acetonitrile, 0.1% formic acid) for 5 min and then mobile
phase B was increased to 50% in 25 min. LC eluent was diverted to the waste during the
first five minutes of the gradient to eliminate salts in the sample buffer. The obtained mass
spectra were deconvoluted using Bruker Data Analysis 4.0 software to determine the
charge state (N) of the protein ions. To calculate the molecular mass of ACP and its
derivatives, the measured m/z values were multiplied by the corresponding charge state (N)
of the protein ions and subtracted by the mass of N protons (N x 1.0079).
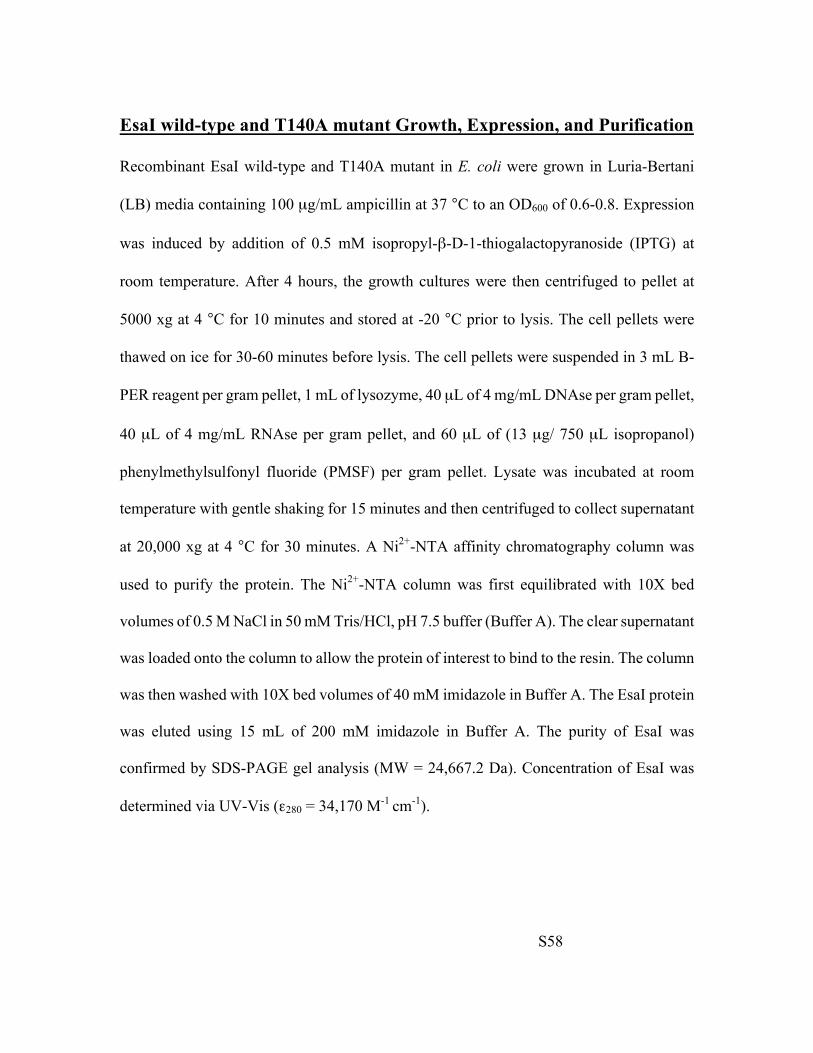
Apo-ACP: calculated mass: 8508.1636 Da, observed: 8508.2138 Da.
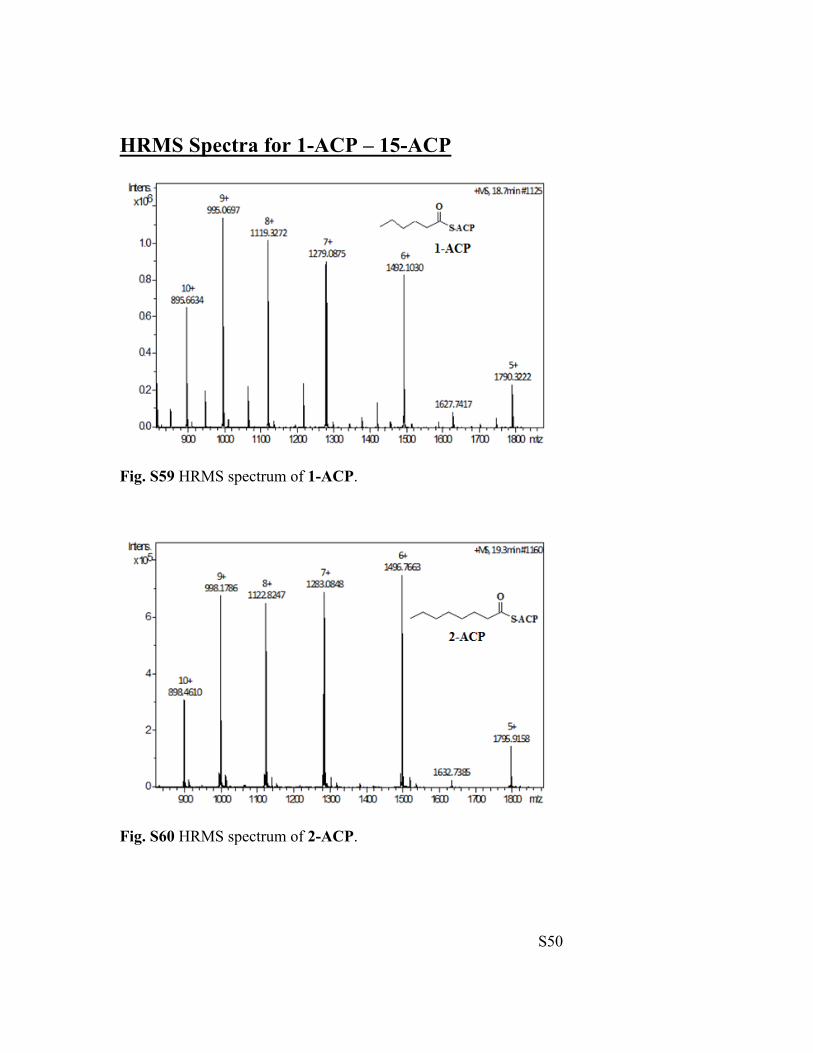
Hexanoyl-ACP (1-ACP): calculated mass: 8946.8127 Da, observed: 8946.5601 Da.
S20
Octanoyl-ACP (2-ACP): calculated mass: 8974.8667 Da, observed: 8974.5376 Da.
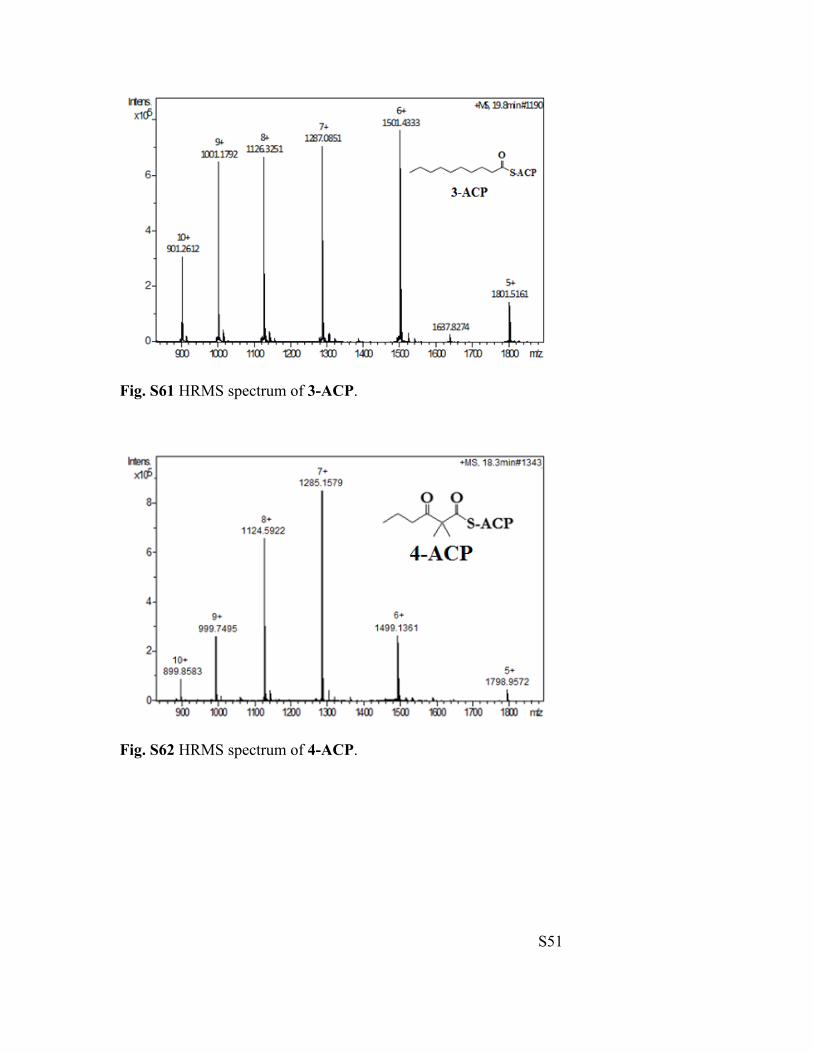
Decanoyl-ACP (3-ACP): calculated mass: 9002.3857 Da, observed mass: 9002.3736 Da.
2,2-Dimethyl-3-oxohexanoyl-ACP (4-ACP): calculated mass: 8988.6773 Da, observed:
8988.9023 Da.
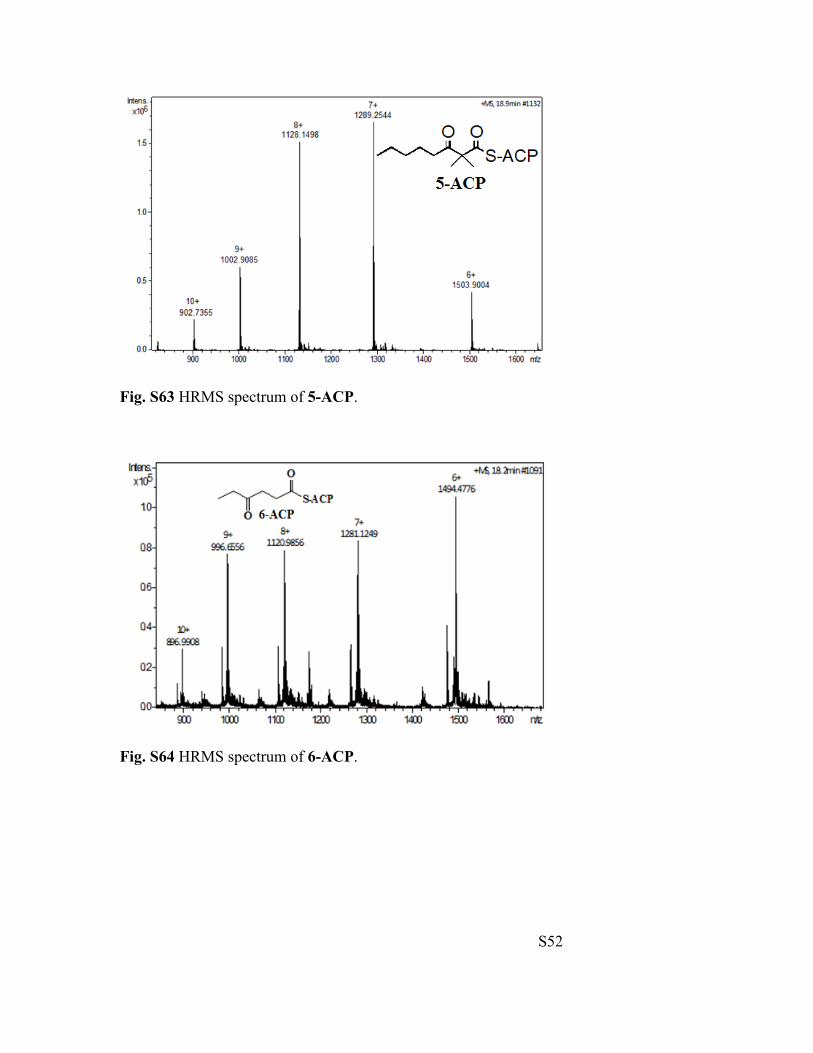
2,2-Dimethyl-3-oxooctanoyl-ACP (5-ACP): calculated mass: 9017.3746 Da, observed:
9017.3185 Da.
4-Oxohexanoyl-ACP (6-ACP): calculated mass: 8960.3228 Da, observed: 8960.4226 Da.
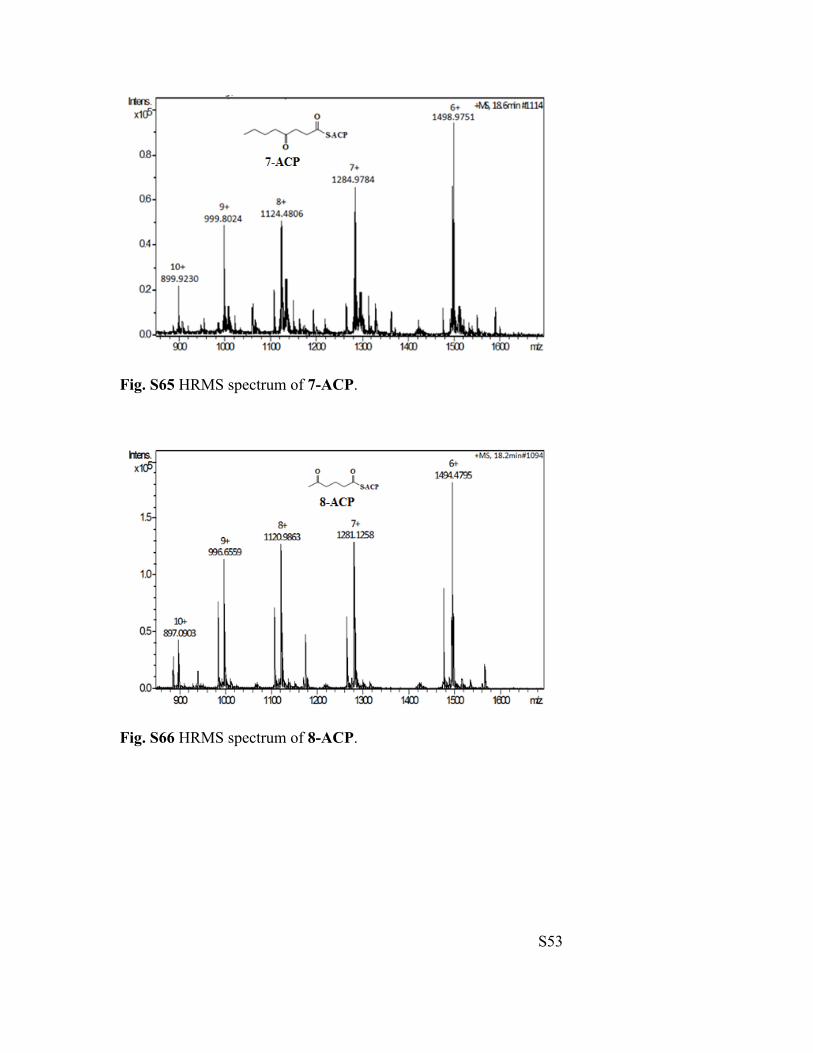
4-Oxooctanoyl-ACP (7-ACP): calculated mass: 8988.3234 Da, observed: 8988.3352 Da.
5-Oxohexanoyl-ACP (8-ACP): calculated mass: 8961.3224 Da, observed: 8960.6268 Da.
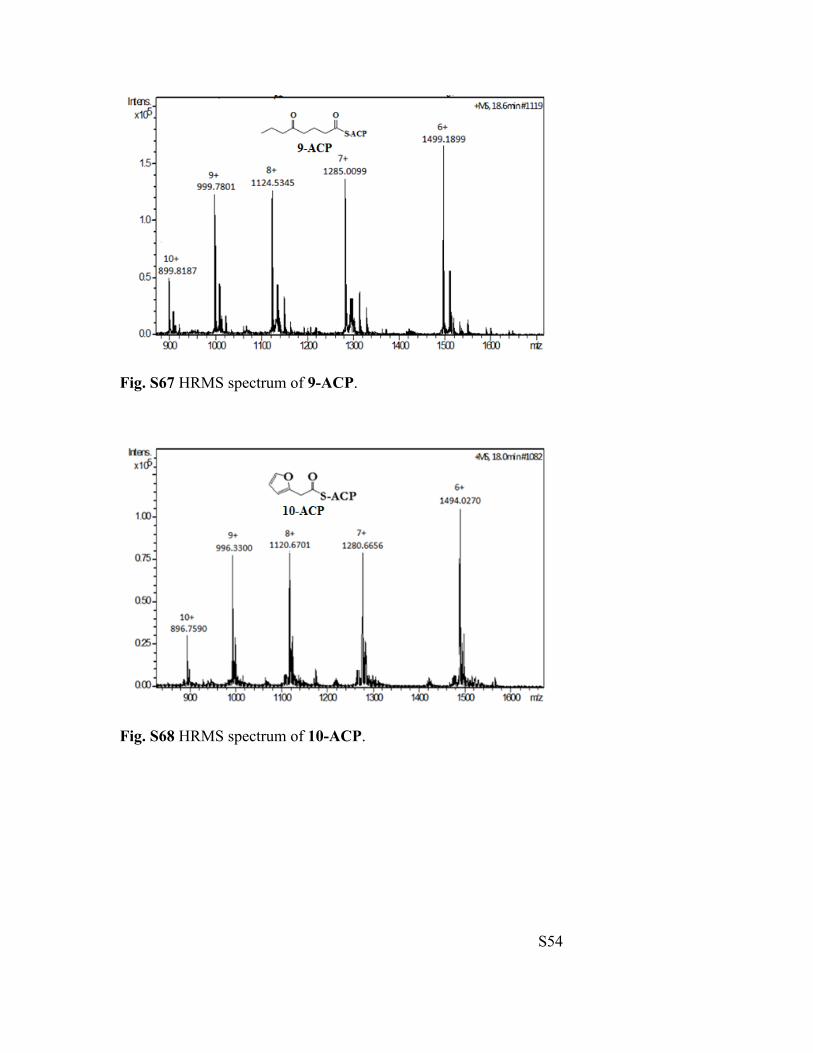
5-Oxooctanoyl-ACP (9-ACP): calculated mass: 8988.3225 Da, observed: 8988.4745 Da.
2-Furanacetyl-ACP (10-ACP): calculated mass: 8957.2798 Da, observed: 8957.6844 Da.
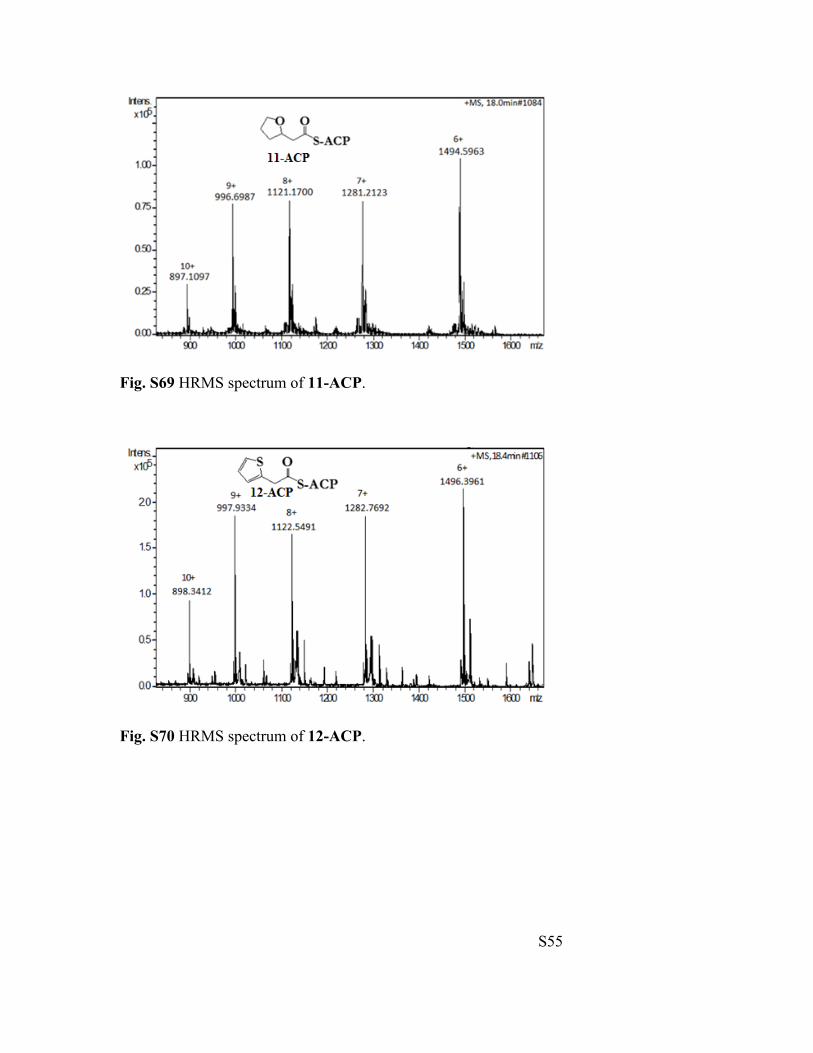
2-Tetrahydrofuranacetyl-ACP (11-ACP): calculated mass: 8961.3068 Da, observed:
8961.2978 Da.
2-Thiopheneacetyl-ACP (12-ACP): calculated mass: 8972.5905 Da, observed:
8972.5293 Da.
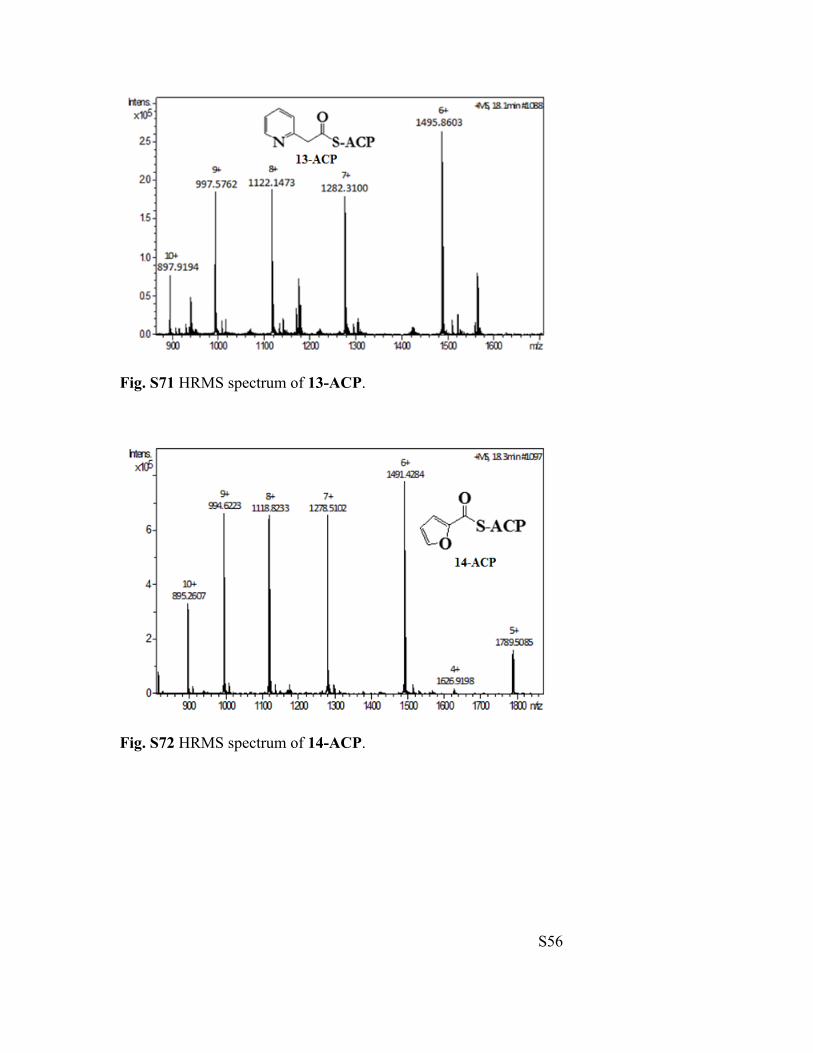
2-Pyridylacetyl-ACP (13-ACP): calculated mass: 8969.2168 Da, observed: 8969.1140
Da.
2-Furoyl-ACP (14-ACP): calculated mass: 8942.6020 Da, observed: 8942.5198 Da.
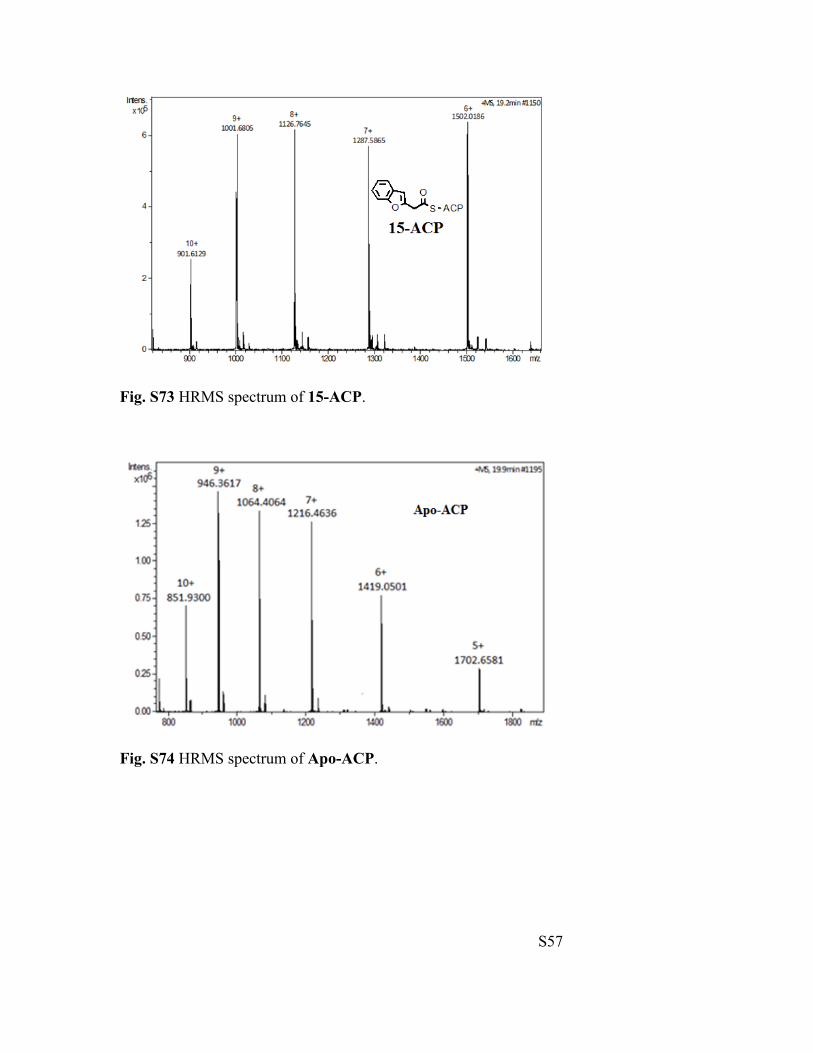
2-Benzofuranacetyl-ACP (15-ACP): calculated mass: 9006.2867 Da, observed mass:
9006.0533 Da.
S21
NMR Characterization of Compounds (1H and 13C NMR Spectra)
Fig. S1 1H NMR of 4-DM-Ester in CDCl3.
Fig. S2 1H NMR of 5-DM-Ester in CDCl3.
S22
Fig. S3 13C NMR of 5-DM-Ester in CDCl3.
Fig. S4 1H NMR of 4-Acid in CD3OD.
S23
Fig. S5 13C NMR of 4-Acid in CD3OD.
Fig. S6 1H NMR of 5-Acid in CDCl3.
S24
Fig. S7 13C NMR of 5-Acid in CDCl3.
Fig. S8 1H NMR of 6-Acid in CDCl3.
S25
Fig. S9 1H NMR of 7-Acid in CDCl3.
Fig. S10 13C NMR of 7-Acid in CDCl3.
S26
Fig. S11 1H NMR of 8-Acid in CDCl3.
Fig. S12 1H NMR of 9-Acid in CDCl3.
S27
Fig. S13 13C NMR of 9-Acid in CDCl3.
Fig. S14 1H NMR of 4-Succ in CDCl3.
S28
Fig. S15 13C NMR of 4-Succ in CDCl3.
Fig. S16 1H NMR of 5-Succ in CDCl3.
S29
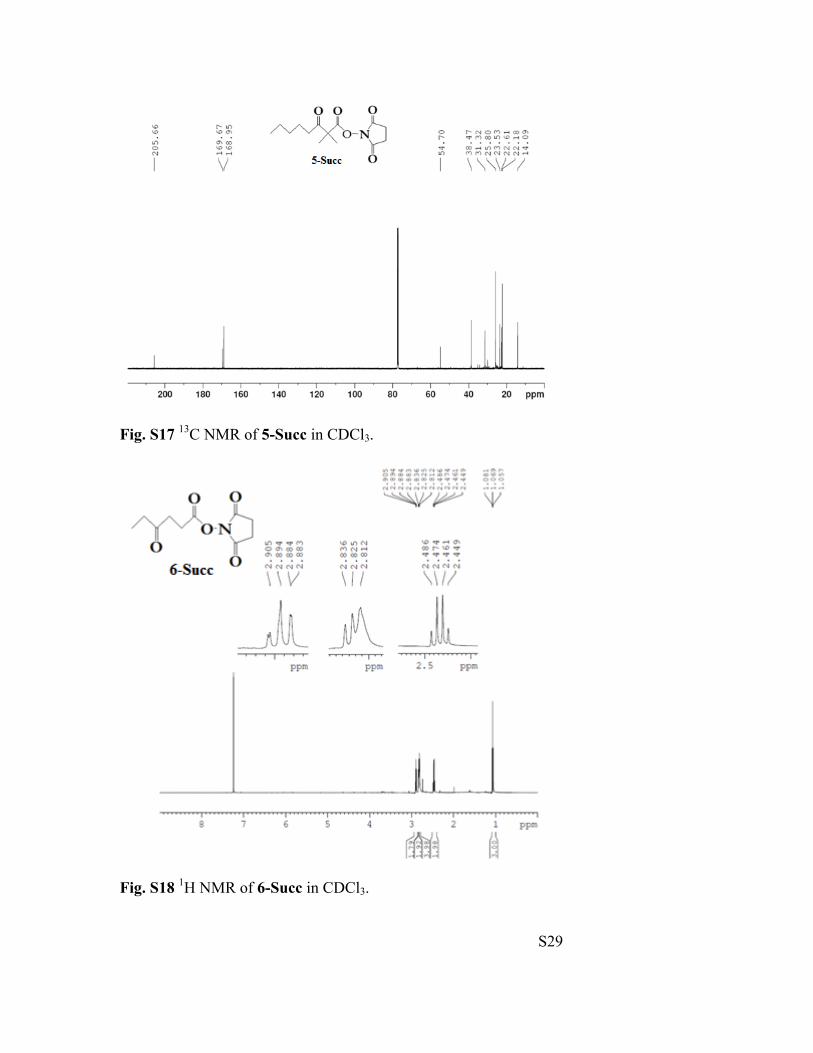
Fig. S17 13C NMR of 5-Succ in CDCl3.
Fig. S18 1H NMR of 6-Succ in CDCl3.
S30
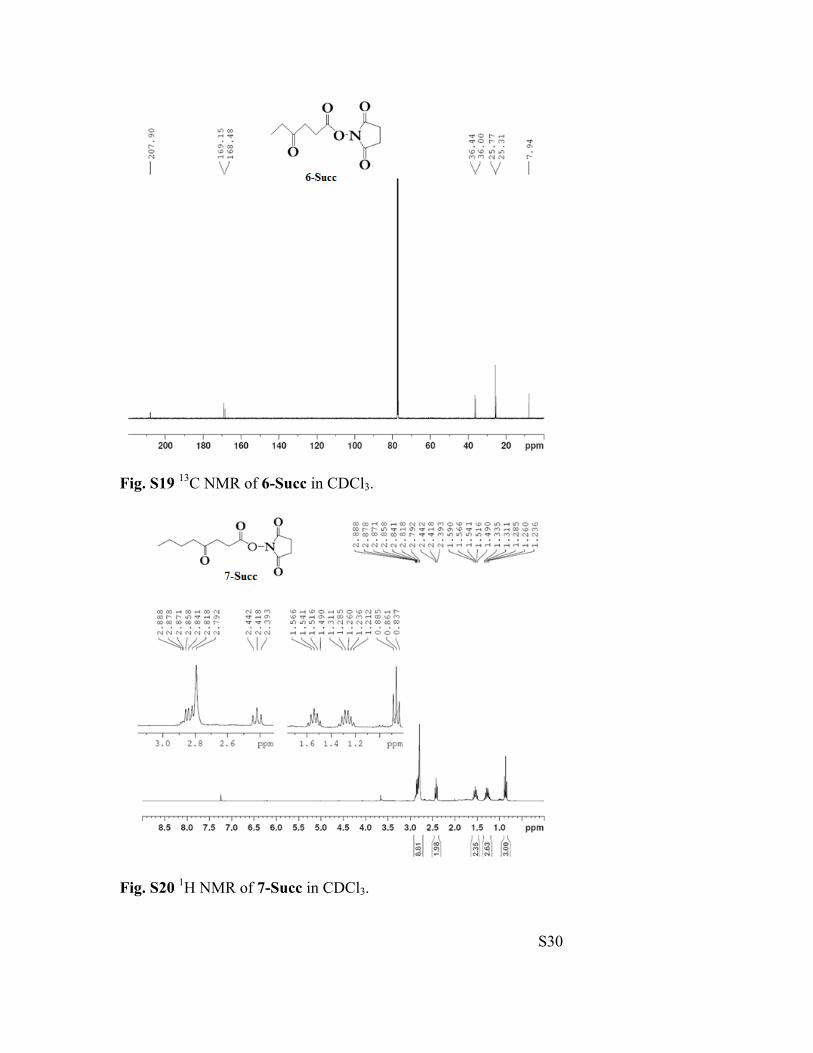
Fig. S19 13C NMR of 6-Succ in CDCl3.
Fig. S20 1H NMR of 7-Succ in CDCl3.
S31
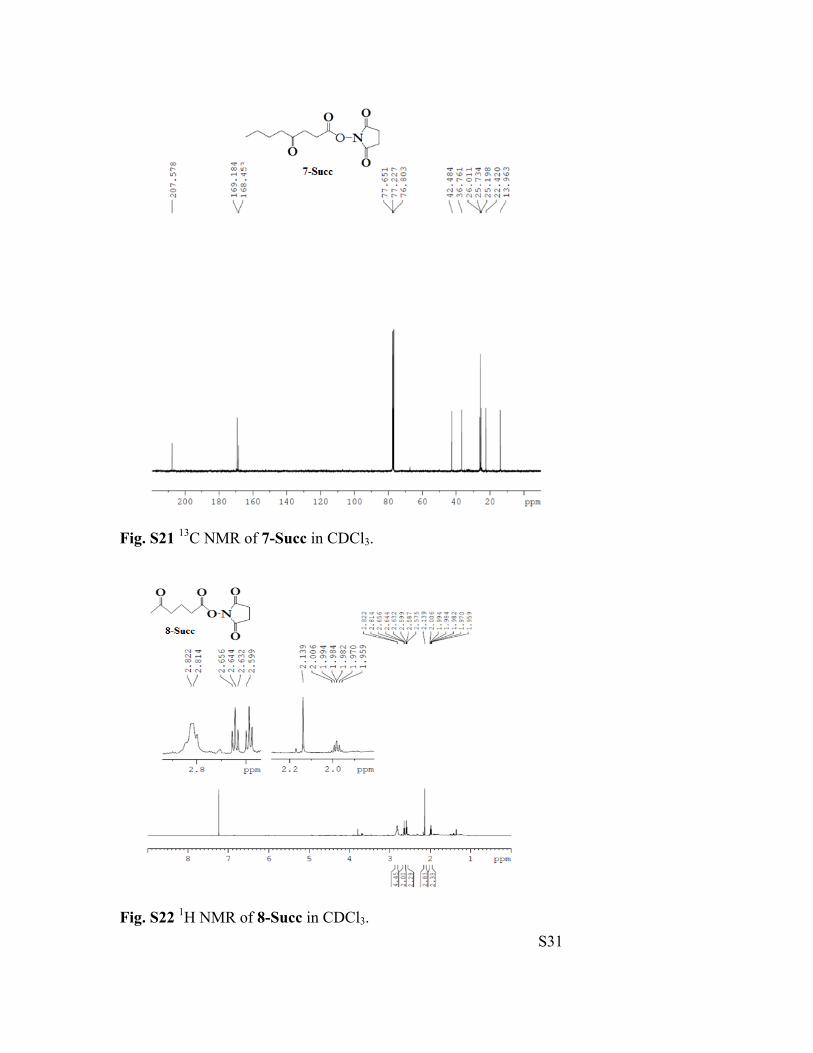
Fig. S21 13C NMR of 7-Succ in CDCl3.
Fig. S22 1H NMR of 8-Succ in CDCl3.
S32
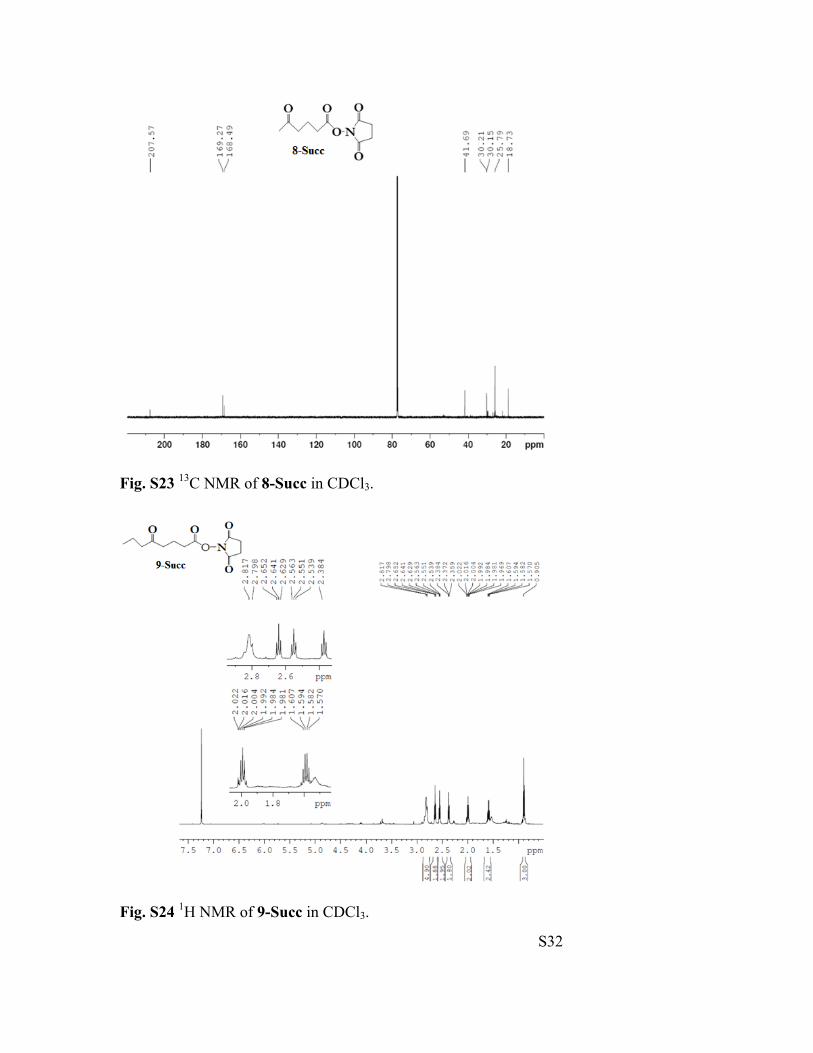
Fig. S23 13C NMR of 8-Succ in CDCl3.
Fig. S24 1H NMR of 9-Succ in CDCl3.
S33
Fig. S25 13C NMR of 9-Succ in CDCl3.
Fig. S26 1H NMR of 10-Succ in CDCl3.
S34
Fig. S27 13C NMR of 10-Succ in CDCl3.
Fig. S28 1H NMR of 11-Succ in CDCl3.
S35
Fig. S29 13C NMR of 11-Succ in CDCl3.
Fig. S30 1H NMR of 12-Succ in CDCl3.
S36
Fig. S31 13C NMR of 12-Succ in CDCl3.
Fig. S32 1H NMR of 13-Succ in CDCl3.
S37
Fig. S33 13C NMR of 13-Succ in CDCl3.
Fig. S34 1H NMR of 14-Succ in CDCl3.
S38
Fig. S35 13C NMR of 14-Succ in CDCl3.
HRMS Spectra for 4-Succ - 14-Succ
Fig. S36 HRMS spectrum of 4-Succ.
S39
Fig. S37 HRMS spectrum of 5-Succ.
Fig. S38 HRMS spectrum of 6-Succ.
S40
Fig. S39 HRMS spectrum of 7-Succ.
Fig. S40 HRMS spectrum of 8-Succ.
S41
Fig. S41 HRMS spectrum of 9-Succ.
Fig. S42 HRMS spectrum of 10-Succ.
S42
Fig. S43 HRMS spectrum of 11-Succ.
Fig. S44 HRMS spectrum of 12-Succ.
S43
Fig. S45 HRMS spectrum of 13-Succ.
Fig. S46 HRMS spectrum of 14-Succ.
S44
HRMS Spectra for 4-CoA – 15-CoA
Fig. S47 HRMS spectrum of 4-CoA.
Fig. S48 HRMS spectrum of 5-CoA.
S45
Fig. S49 HRMS spectrum of 6-CoA.
Fig. S50 HRMS spectrum of 7-CoA.
S46
Fig. S51 HRMS spectrum of 8-CoA.
Fig. S52 HRMS spectrum of 9-CoA.
S47
Fig. S53 HRMS spectrum of 10-CoA.
Fig. S54 HRMS spectrum of 11-CoA.
S48
Fig. S55 HRMS spectrum of 12-CoA.
Fig. S56 HRMS spectrum of 13-CoA.
S49
Fig. S57 HRMS spectrum of 14-CoA.
Fig. S58 HRMS spectrum of 15-CoA.
S50
HRMS Spectra for 1-ACP – 15-ACP
Fig. S59 HRMS spectrum of 1-ACP.
Fig. S60 HRMS spectrum of 2-ACP.
S51
Fig. S61 HRMS spectrum of 3-ACP.
Fig. S62 HRMS spectrum of 4-ACP.
S52
Fig. S63 HRMS spectrum of 5-ACP.
Fig. S64 HRMS spectrum of 6-ACP.
S53
Fig. S65 HRMS spectrum of 7-ACP.
Fig. S66 HRMS spectrum of 8-ACP.
S54
Fig. S67 HRMS spectrum of 9-ACP.
Fig. S68 HRMS spectrum of 10-ACP.
S55
Fig. S69 HRMS spectrum of 11-ACP.
Fig. S70 HRMS spectrum of 12-ACP.
S56
Fig. S71 HRMS spectrum of 13-ACP.
Fig. S72 HRMS spectrum of 14-ACP.
S57
Fig. S73 HRMS spectrum of 15-ACP.
Fig. S74 HRMS spectrum of Apo-ACP.
S58
EsaI wild-type and T140A mutant Growth, Expression, and Purification
Recombinant EsaI wild-type and T140A mutant in E. coli were grown in Luria-Bertani
(LB) media containing 100 µg/mL ampicillin at 37 °C to an OD600 of 0.6-0.8. Expression
was induced by addition of 0.5 mM isopropyl-β-D-1-thiogalactopyranoside (IPTG) at
room temperature. After 4 hours, the growth cultures were then centrifuged to pellet at
5000 xg at 4 °C for 10 minutes and stored at -20 °C prior to lysis. The cell pellets were
thawed on ice for 30-60 minutes before lysis. The cell pellets were suspended in 3 mL B-
PER reagent per gram pellet, 1 mL of lysozyme, 40 µL of 4 mg/mL DNAse per gram pellet,
40 µL of 4 mg/mL RNAse per gram pellet, and 60 µL of (13 µg/ 750 µL isopropanol)
phenylmethylsulfonyl fluoride (PMSF) per gram pellet. Lysate was incubated at room
temperature with gentle shaking for 15 minutes and then centrifuged to collect supernatant
at 20,000 xg at 4 °C for 30 minutes. A Ni2+-NTA affinity chromatography column was
used to purify the protein. The Ni2+-NTA column was first equilibrated with 10X bed
volumes of 0.5 M NaCl in 50 mM Tris/HCl, pH 7.5 buffer (Buffer A). The clear supernatant
was loaded onto the column to allow the protein of interest to bind to the resin. The column
was then washed with 10X bed volumes of 40 mM imidazole in Buffer A. The EsaI protein
was eluted using 15 mL of 200 mM imidazole in Buffer A. The purity of EsaI was
confirmed by SDS-PAGE gel analysis (MW = 24,667.2 Da). Concentration of EsaI was
determined via UV-Vis (ε280 = 34,170 M-1 cm-1).
S59
Apo-ACP Growth, Expression, and Purification
Purification of apo-ACP was accomplished by minor modification of a previously
published protocol.[4] Apo-ACP in BL21 E. coli competent cell was grown in LB broth
containing 25 µg/mL kanamycin, 50 µg/mL streptomycin, 50 µg/mL spectinomycin, and
25 µg/mL chloramphenicol at 37 °C to an OD600 of 0.6-0.8. An addition of 0.1 mM IPTG
was added to induce expression. The growth culture was incubated for another 3 hours and
then centrifuged to pellets at 5000 xg at 4 °C for 10 minutes. The cell pellets were
suspended in 3 mL B-PER reagent per gram pellet, 1 mL of lysozyme, 40 µL of 4 mg/mL
DNAse per gram pellet, 40 µL of 4 mg/mL RNAse per gram pellet, and 60 µL of (13 µg/
750 µL isopropanol) PMSF per gram pellet. The lysate was incubated at room temperature
with gentle shaking for 20 minutes and then centrifuged to collect a clear supernatant at
20,000 xg at 4 °C for 60 minutes. Then MnSO4 (1.2 mM) and MgCl2 (25 mM) were added
to the clear supernatant and the mixture was incubated at 37 °C for 4 hours to convert all
holo-ACP to the apo-ACP form. Cellular protein was precipitated by adding isopropanol
slowly to 50% volume with gentle shaking on ice for 1 hour. The precipitated protein was
removed by centrifugation at 20,000 xg for 45 minutes. The clear supernatant was then
stirred with DEAE-sepharose resin overnight at 4 °C. The media was packed into a column
and washed with 10X bed volumes of 0.25 mM LiCl in 10 mM lithium 4-
morpholineethane-sulfonate (MES), pH 6.1 buffer. The protein of interest was eluted with
10X bed volumes of 0.5 M LiCl in 10 mM MES, pH 6.1 buffer. Using SDS-PAGE analysis,
fractions containing pure protein (MW = 9573.4 Da) were pooled and precipitated using
0.02% (0.2 mg/mL) sodium deoxycholate and 5% (50 mg/mL) trichloroacetate (w/v). The
S60
mixture was incubated for 60 minutes with gentle shaking at 37 °C and centrifuged to pellet
at 20,000 xg for 30 minutes. The apo-ACP pellet was resuspended in 0.5 M Tris-HCl, pH
8.0 buffer and concentrated using 3 kD molecular weight cutoff spin filter column.
Concentration of apo-ACP was determined using UV-Vis (ε280 = 1490 M-1cm-1).
Sfp Growth, Expression, and Purification
Bacillus subtilis Sfp was expressed in BL21 E. coli competent cells. Sfp was grown in LB
media containing 100 µg/mL kanamycin at 37 °C to an OD600 of 0.6-0.8. Expression was
induced by addition of 0.5 mM IPTG and continued at 37 °C for another 3 hours. The
growth cultures were then centrifuged to pellet at 5000 xg at 4 °C for 10 minutes and stored
at -20 °C prior to lysis. The cell pellets were thawed on ice for 30-60 minutes before lysis.
The cell pellets were suspended in 3 mL B-PER reagent per gram pellet, 1 mL of lysozyme,
40 µL of 4 mg/mL DNAse per gram pellet, 40 µL of 4 mg/mL RNAse per gram pellet, and
60 µL of (13 µg/ 750 µL isopropanol) PMSF per gram pellet. Lysate was incubated at room
temperature with gentle shaking for 15 minutes and then centrifuged to collect the
supernatant at 20,000 xg at 4 °C for 30 minutes. Ni2+-NTA affinity chromatography column
was used to purify the protein. The Ni2+-NTA column was first equilibrated with 10X bed
volumes of 0.5 M NaCl in 50 mM Tris/HCl, pH 7.5 buffer (Buffer A). The clear supernatant
was loaded onto the column to allow the protein of interest to bind to the resin. The column
was then washed with 10X bed volumes of 10 mM imidazole in Buffer A. The Sfp protein
was eluted using 15 mL of 200 mM imidazole in Buffer A. The purity of Sfp was confirmed

S61
by SDS-PAGE gel analysis (MW = 26,990.5 Da). Concentration of Sfp was determined
using UV-Vis (ε280 = 29,130 M-1cm-1).
YspI Growth, Expression, and Purification
YspI strain was expressed in E. coli strain BL21 (DE3) competent cells. The recombinant
YspI was grown in LB media containing 50 µg/mL streptomycin and 50 µg/mL
spectinomycin at 37 °C to an OD600 of 0.6-0.8. Expression was induced by addition of 0.5
mM isopropyl-β-D-1-thiogalactopyranoside (IPTG) at room temperature. After overnight,
the growth cultures were centrifuged to pellet at 5000 xg at 4 °C for 10 minutes and stored
at -20 °C prior to lysis. The cell pellets were thawed on ice for 30-60 minutes before lysis.
The cell pellets were suspended in chilled lysis buffer, containing 50 mM Tris-HCl pH 7.5,
200 mM NaCl, 5 mM DTT, and 1 mM PMSF, with ratio of cell wet weight to buffer volume
of 1:1. The cell suspension was cooled on ice for 10 minutes and then sonicated with 10
short bursts of 10 seconds followed by intervals of 30 seconds for cooling. Cell debris was
then removed by centrifugation at 4 °C for 30 minutes at 20,000 xg. Amylose affinity
chromatography column was used to purify the protein. The amylose column was first
equilibrated with 10X bed volumes of YspI Buffer A (50 mM Tris-HCl pH 7.5, 0.2 M
NaCl, 0.1 mM EDTA, 0.1 mM PMSF, 0.1 mM tosyl-L-lysinechloromethyl ketone
hydrochloride, 0.4 M sucrose, and 2.5% (v/v) glycerol). The clear supernatant was loaded
onto the equilibrated column to allow the protein of interest to bind to the resin. The column
was then washed with 10X bed volumes of YspI Buffer A. The YspI protein was eluted
using 35 mL of YspI Buffer A containing 10 mM maltose. The purity of YspI with maltose
S62
binding protein (MBP) was confirmed by SDS-PAGE gel analysis (MW = 67.99 kDa).
Concentration of YspI was determined via UV-Vis (ε280 = 103,710 M-1cm-1).
HPLC assay
Two chemical steps, lactonization and acylation, could be resolved independently using
analytical C-18 reverse-phase UHPLC. MTA peak from SAM lactonization was monitored
using a gradient beginning at 100% A (99.9% water, 0.1% formic acid): 0% B (99.9%
acetonitrile, 0.1% formic acid) and ending at 70% A: 30% B over a period of 10 minutes
at flow rate of 500 µL/min. Holo-ACP from acylation half-reaction was monitored using a
gradient beginning at 75% A: 25% B and ending at 25% A: 75% B over a period of 10
minutes at flow rate of 600 µL/min. Standard calibration curves for MTA and holo-ACP
were generated by serial dilution of known analyte concentrations in buffer with quench
solution, 6 M HCl (lactonization) or 4 M acetate buffer, pH 3.7 (acylation). Peak areas at
each MTA and holo-ACP concentration were determined from HPLC chromatograms at
260 nm (SAM and MTA) or 220 nm (acyl-ACP and holo-ACP). A typical enzyme-
catalyzed reaction (100 µL) contained nanopure water, 100 mM HEPES pH 7.3 buffer,
fixed SAM concentration at 500 µM, varied acyl-ACP concentrations. The mixture was
split into two equal portions for background and reaction. After incubation at room
temperature for 5 minutes, the reaction and background aliquots were initiated,
respectively, with 1 µM EsaI enzyme (2 µM EsaI for 2-benzofuranacetyl-ACP, 4-oxo-C8-
ACP, 5-oxo-C8-ACP, and C8-ACP) and nanopure water. The reaction and background
aliquots in YspI kinetic assays were initiated, respectively, with 1 µM YspI (1.5 µM for 2-
S63
pyridylacetyl-ACP; 2 µM for C6-ACP, C8-ACP, C10-ACP and 2-furanacetyl-ACP) and
nanopure water. Since the progress curves for several enzyme-substrate pairs used in this
study were linear, at least until 6 minutes, we therefore decided to follow a single time
point quench at 4 min. Both aliquots were quenched after 4 minutes of initiation using 6 M
HCl (lactonization) or 4 M acetate buffer pH 3.7 (acylation) with final concentrations of
0.4 M HCl or 0.4 M acetate buffer, respectively. Peak areas of MTA and holo-ACP at each
acyl-ACP concentration were determined from HPLC chromatograms. The initial rates
were determined by dividing analyte concentration over time (4 minutes). The difference
between background and reaction in peak area per minute was converted to an initial
reaction rate in µM/min using standard calibration curves. The MTA standard curve had a
linear fit equation of y = 0.198x; the holo-ACP standard curve had a linear fit equation of
y = 0.4058x, where y = peak area of analyte, and x = known concentration of analyte. The
initial rate was fitted to the Michaelis-Menten equation (Equation 1) or substrate inhibition
equation (Equation 2) using GraphPad Prism 7.00. All experiments were repeated in
duplicate to check for reproducibility and to estimate errors.
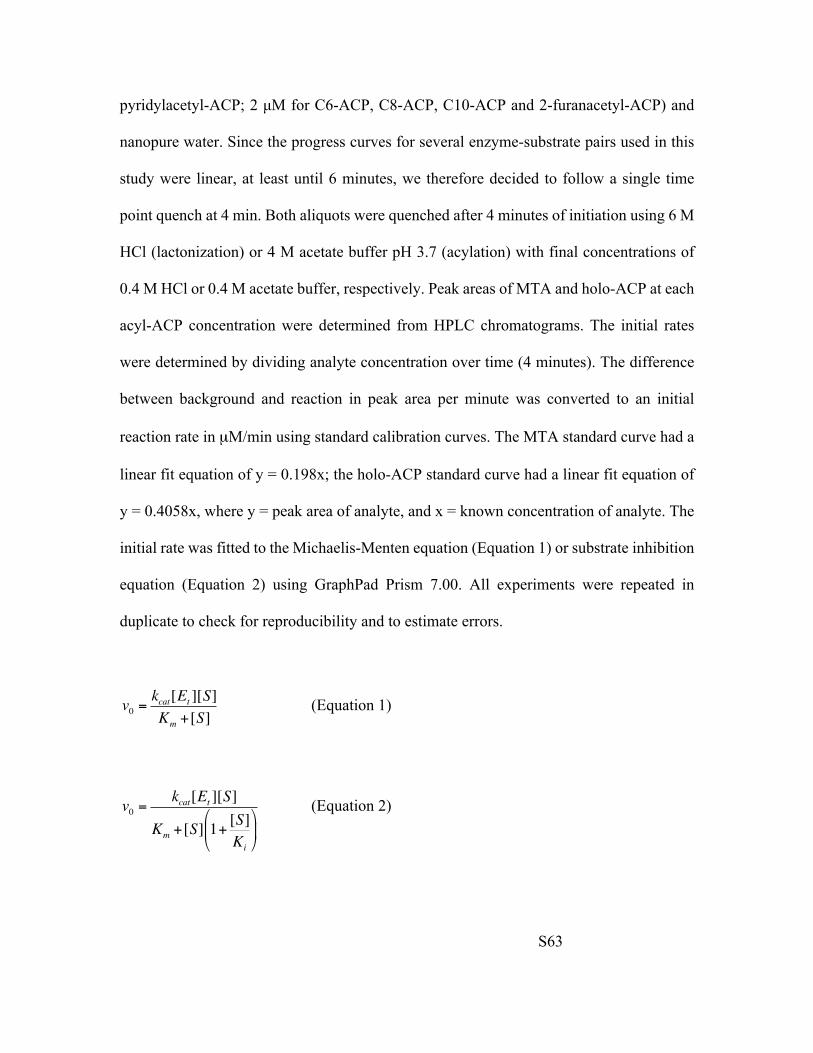
(Equation 1)
(Equation 2)
v0 =kcat[Et ][S]Km +[S]
v0 =kcat[Et ][S]
Km +[S] 1+[S]Ki
!
"#
$
%&
S64
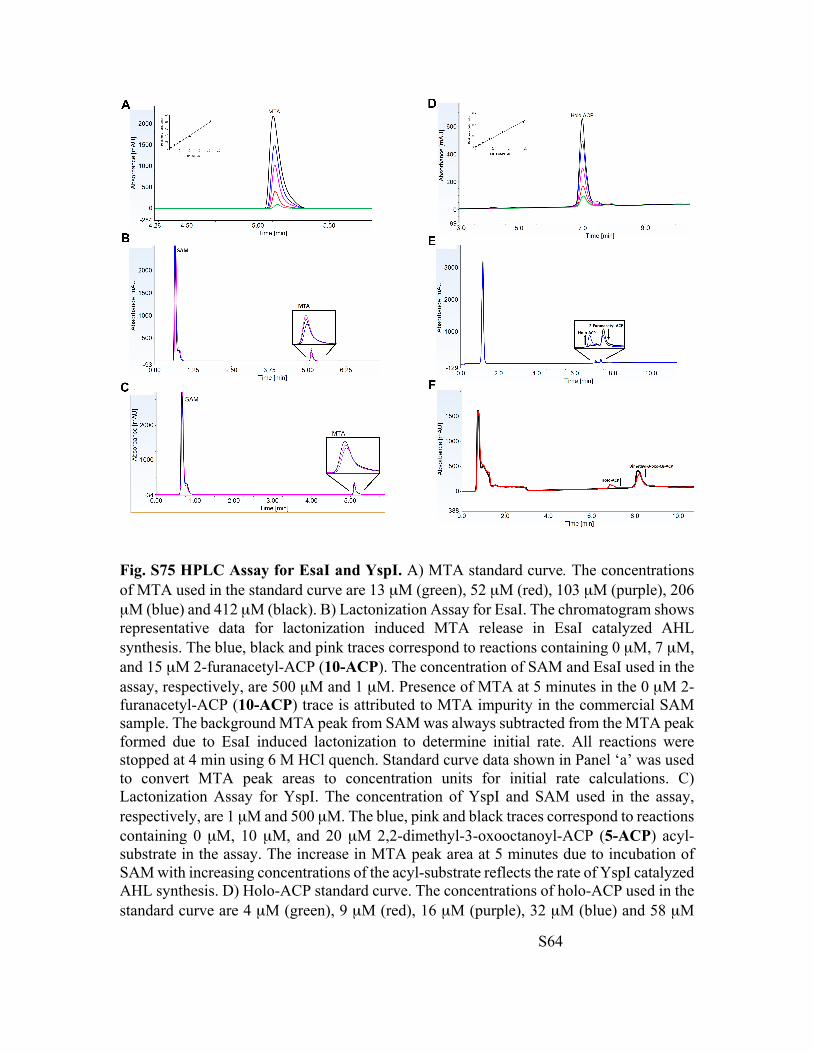
Fig. S75 HPLC Assay for EsaI and YspI. A) MTA standard curve. The concentrations of MTA used in the standard curve are 13 µM (green), 52 µM (red), 103 µM (purple), 206 µM (blue) and 412 µM (black). B) Lactonization Assay for EsaI. The chromatogram shows representative data for lactonization induced MTA release in EsaI catalyzed AHL synthesis. The blue, black and pink traces correspond to reactions containing 0 µM, 7 µM, and 15 µM 2-furanacetyl-ACP (10-ACP). The concentration of SAM and EsaI used in the assay, respectively, are 500 µM and 1 µM. Presence of MTA at 5 minutes in the 0 µM 2-furanacetyl-ACP (10-ACP) trace is attributed to MTA impurity in the commercial SAM sample. The background MTA peak from SAM was always subtracted from the MTA peak formed due to EsaI induced lactonization to determine initial rate. All reactions were stopped at 4 min using 6 M HCl quench. Standard curve data shown in Panel ‘a’ was used to convert MTA peak areas to concentration units for initial rate calculations. C) Lactonization Assay for YspI. The concentration of YspI and SAM used in the assay, respectively, are 1 µM and 500 µM. The blue, pink and black traces correspond to reactions containing 0 µM, 10 µM, and 20 µM 2,2-dimethyl-3-oxooctanoyl-ACP (5-ACP) acyl-substrate in the assay. The increase in MTA peak area at 5 minutes due to incubation of SAM with increasing concentrations of the acyl-substrate reflects the rate of YspI catalyzed AHL synthesis. D) Holo-ACP standard curve. The concentrations of holo-ACP used in the standard curve are 4 µM (green), 9 µM (red), 16 µM (purple), 32 µM (blue) and 58 µM
S65
(black). E) Acylation Assay for EsaI. Holo-ACP and 2-furanacetyl-ACP (10-ACP) elutes at 6.8 minutes and 7.4 minutes, respectively. Black and blue traces, respectively, represent reaction products from incubation of 80 µM 2-furanacetyl-ACP (10-ACP) and 500 µM SAM with nanopure water and 1 µM EsaI. For the background (black trace), nanopure water is used in lieu of enzyme. Both reactions are quenched at 4 min using 4M acetate buffer at pH 3.6. F) Acylation Assay for YspI. Representative acylation chromatograms for 1 µM YspI catalyzed AHL synthesis. The black and red traces represent background and enzymatic reaction for the reaction of 70 µM 2,2-dimethyl-3-oxooctanoyl-ACP (5-ACP) and 500 µM SAM, as mentioned in ‘e’. The substrate elutes at 8 minutes. Reaction mixtures were quenched at 4 min with 4M acetate buffer at pH 3.6.
S66
Substrate-Velocity Curves
S67
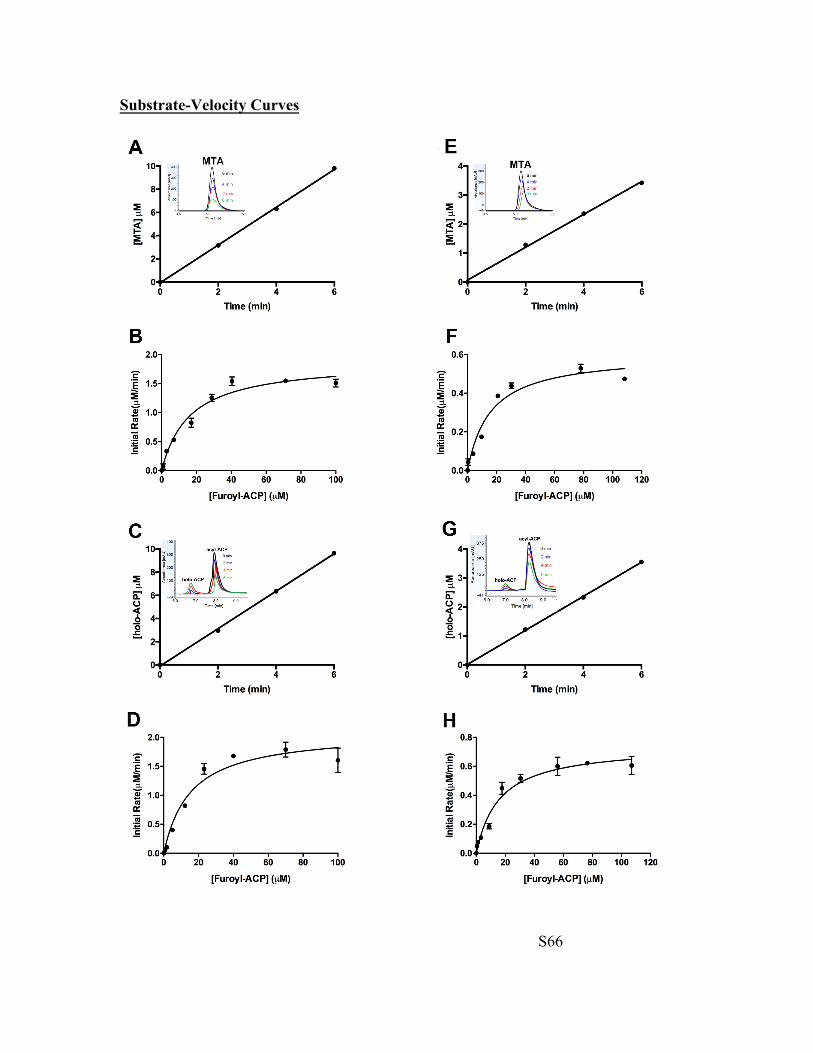
Fig. S76 Substrate-velocity curves for EsaI and YspI. A) EsaI Lactonization Progress Curve. The concentrations of 2-furoyl-ACP (14-ACP), SAM and EsaI, respectively, were 112 µM, 500 µM and 1.3 µM. The progress curve was linear at least until 6 minutes. The peak at 0 min is due to MTA contamination in commercial SAM sample. This peak was subtracted from the peak at 2, 4 and 6 min to determine the amount of MTA released from enzyme-catalyzed SAM lactonization. B) EsaI Lactonization Rate Curve. Initial rate was plotted as a function of substrate concentration for 1.3 µM EsaI catalyzed MTA release in 500 µM SAM chloride (fixed) and varying 2-furoyl-ACP (14-ACP). The standard curve shown in Figure S75, panel ‘A’, was used to convert MTA peak area to concentration units. Initial rate data as a function of substrate concentration was fitted to Michaelis-Menten equation (Equation 1; Page S63) using Graphpad Prism 7.0 to determine kinetic constants. C) EsaI Acylation Progress Curve. The concentrations of 2-furoyl-ACP (14-ACP), SAM and EsaI were identical to substrate and enzyme concentrations used for the progress curve shown in Panel ‘A’. D) EsaI Acylation Rate Curve. Holo-ACP peak areas were converted to concentration units using standard curve shown in Panel ‘D’ (Figure S75). Initial rate was plotted as a function of substrate concentration for 1.3 µM EsaI catalyzed holo-ACP release in 500 µM SAM chloride (fixed) and varying 2-furoyl-ACP (14-ACP). Initial rate data as a function of substrate concentration was fitted to Michaelis-Menten equation (Equation 1; Page S63) using Graphpad Prism 7.0 to determine kinetic constants. E) YspI Lactonization Progress Curve. The concentrations of 2-furoyl-ACP (14-ACP), SAM and YspI, respectively, were 112 µM, 500 µM and 1.3 µM. The peak at 0 min is due to MTA contamination in the commercial SAM sample. This peak was subtracted from the peak at 2, 4 and 6 min to determine the amount of MTA released from enzyme-catalyzed SAM lactonization. F) YspI Lactonization Rate Curve. Initial rate was plotted as a function of substrate concentration for 1.3 µM YspI induced lactonization in 500 µM SAM chloride (fixed) and varying 2-furoyl-ACP (14-ACP). Initial rate data as a function of substrate concentration was fitted to Michaelis-Menten equation (Equation 1; Page S63) using Graphpad Prism 7.0 to determine kinetic constants. G) YspI Acylation Progress Curve. The substrate and enzyme concentrations in the progress curve were identical to conditions stated in panel ‘E’. H) YspI Acylation Rate Curve. Initial rate was plotted as a function of substrate concentration for 1.3 µM YspI induced acylation in 500 µM SAM chloride (fixed) and varying 2-furoyl-ACP (14-ACP). Initial rate data as a function of substrate concentration was fitted to Michaelis-Menten equation (Equation 1; Page S63) using Graphpad Prism 7.0 to determine kinetic constants.

S68
S69
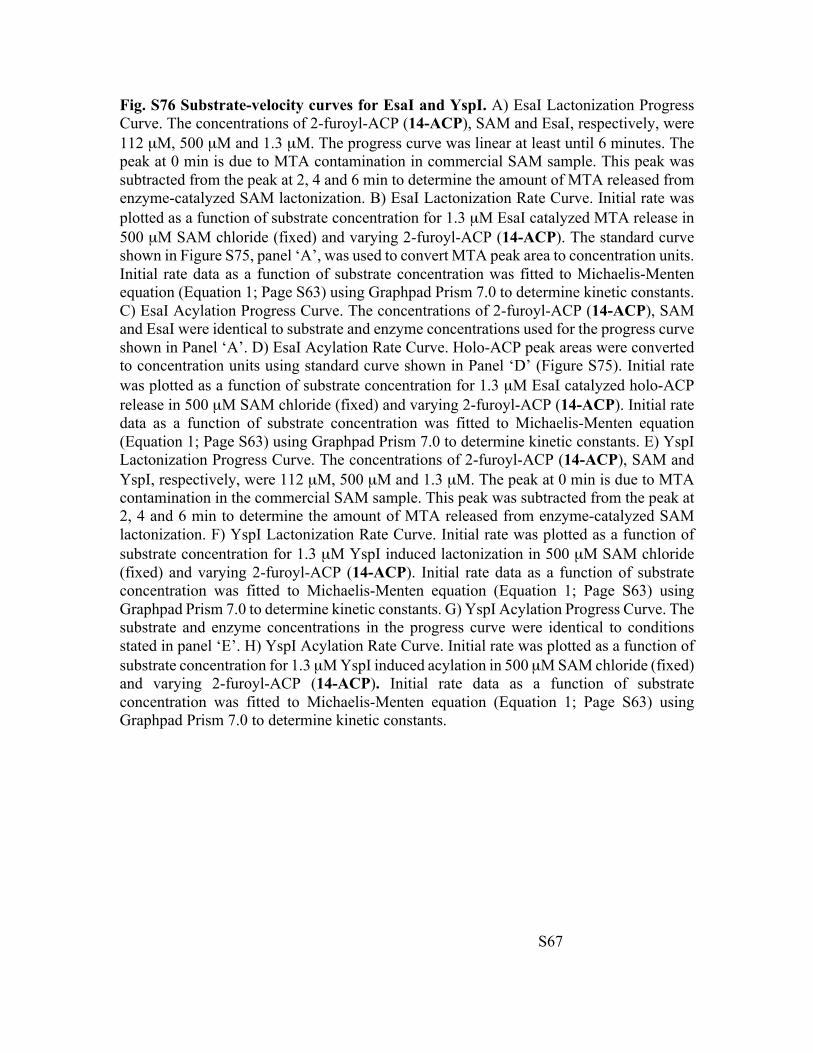
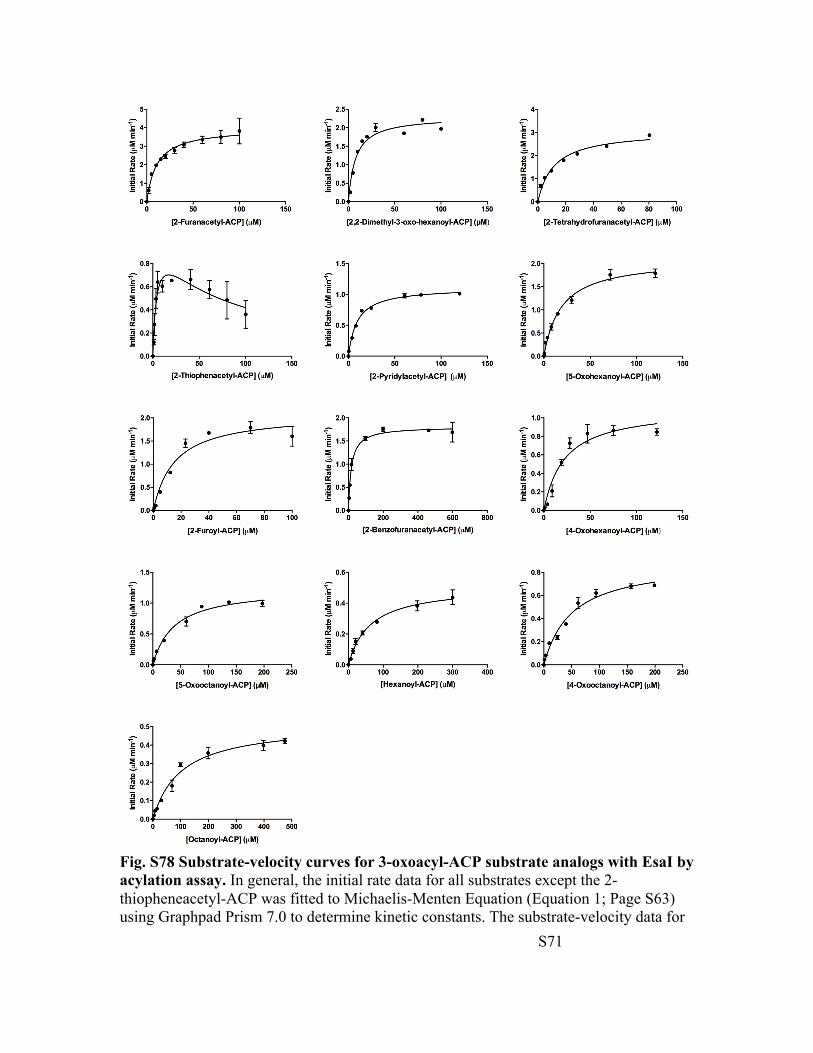
Fig. S77 Substrate-velocity curves for 3-oxoacyl-ACP substrate analogs with EsaI by lactonization assay. In general, the initial rate data for all substrates except the 2-thiopheneacetyl-ACP was fitted to Michaelis-Menten Equation (Equation 1; Page S63) using Graphpad Prism 7.0 to determine kinetic constants. The substrate-velocity data for
S70
2-thiopheneacetyl-ACP was fitted to substrate inhibition equation (Equation 2; Page S63). The substrate inhibition constant for 2-thiopheneacetyl-ACP is 100 ± 50 µM. Substrate inhibition observed for 2-thiopheneacetyl-ACP could arise due to a combination of one or more of the following possibilities: a) two acyl-ACP substrate molecules binding to the enzyme to form an ES2 complex, b) the free enzyme form E exists in a slow equilibrium with Eʹ where the affinities and reactivities of the acyl-substrate towards the two enzyme forms are noticeably different, and c) random addition of acyl-ACP and SAM to the enzyme where one addition pathway is kinetically preferred over the other (also called preferred random order addition mechanism).[4a],[5] A comprehensive investigation using structural (NMR) and enzymological tools to distinguish between these mechanistic possibilities is currently underway.
S71
Fig. S78 Substrate-velocity curves for 3-oxoacyl-ACP substrate analogs with EsaI by acylation assay. In general, the initial rate data for all substrates except the 2-thiopheneacetyl-ACP was fitted to Michaelis-Menten Equation (Equation 1; Page S63) using Graphpad Prism 7.0 to determine kinetic constants. The substrate-velocity data for
S72
2-thiopheneacetyl-ACP was fitted to substrate inhibition equation (Equation 2; Page S63). The substrate inhibition constant for 2-thiopheneacetyl-ACP is 68 ± 25 µM.
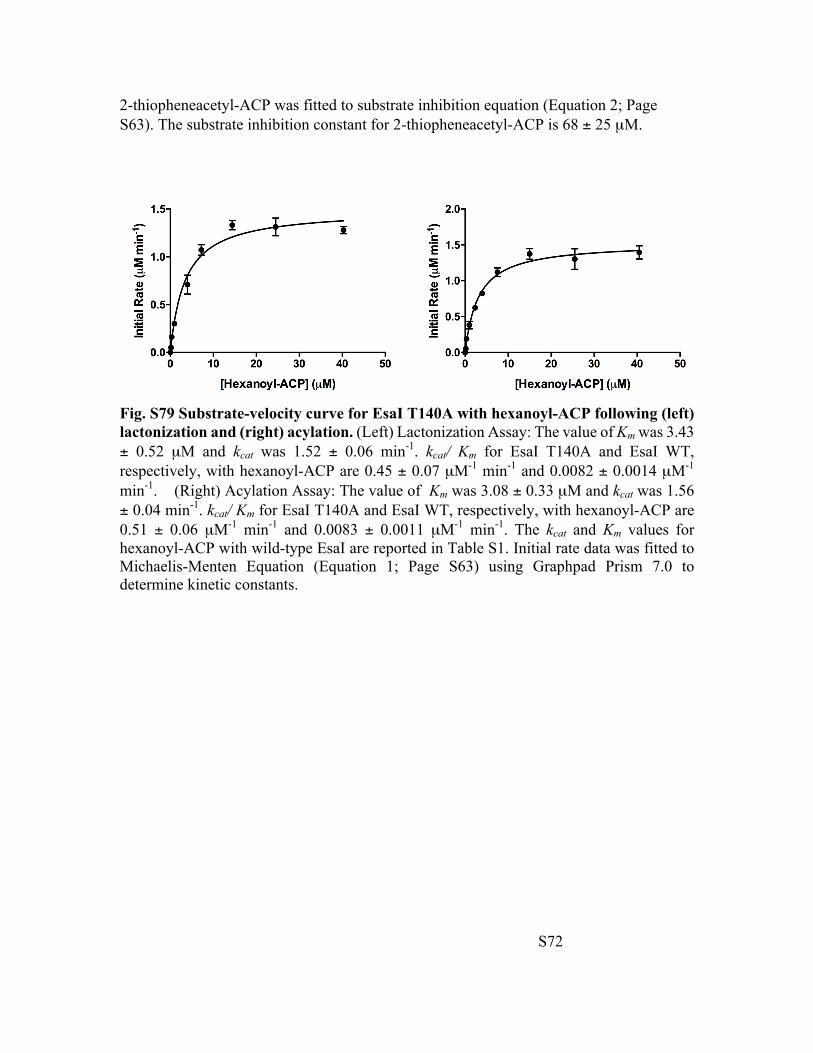
Fig. S79 Substrate-velocity curve for EsaI T140A with hexanoyl-ACP following (left) lactonization and (right) acylation. (Left) Lactonization Assay: The value of Km was 3.43 ± 0.52 µM and kcat was 1.52 ± 0.06 min-1. kcat/ Km for EsaI T140A and EsaI WT, respectively, with hexanoyl-ACP are 0.45 ± 0.07 µM-1 min-1 and 0.0082 ± 0.0014 µM-1 min-1. (Right) Acylation Assay: The value of Km was 3.08 ± 0.33 µM and kcat was 1.56 ± 0.04 min-1. kcat/ Km for EsaI T140A and EsaI WT, respectively, with hexanoyl-ACP are 0.51 ± 0.06 µM-1 min-1 and 0.0083 ± 0.0011 µM-1 min-1. The kcat and Km values for hexanoyl-ACP with wild-type EsaI are reported in Table S1. Initial rate data was fitted to Michaelis-Menten Equation (Equation 1; Page S63) using Graphpad Prism 7.0 to determine kinetic constants.
S73
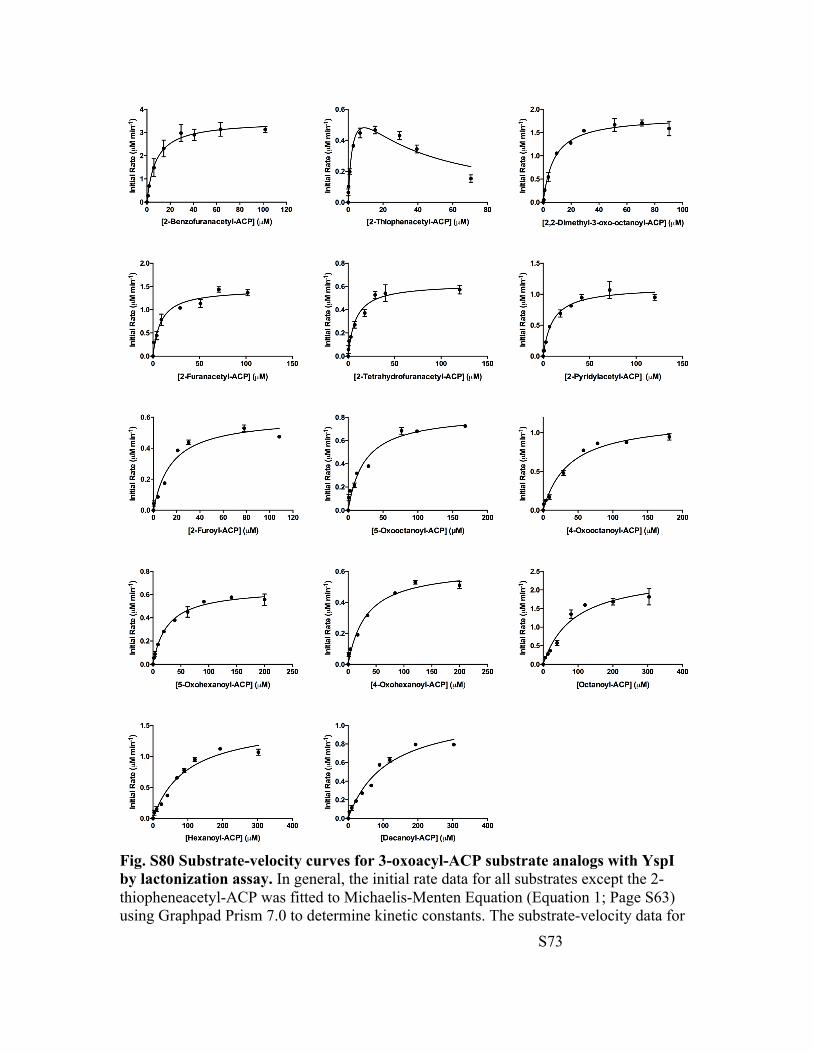
Fig. S80 Substrate-velocity curves for 3-oxoacyl-ACP substrate analogs with YspI by lactonization assay. In general, the initial rate data for all substrates except the 2-thiopheneacetyl-ACP was fitted to Michaelis-Menten Equation (Equation 1; Page S63) using Graphpad Prism 7.0 to determine kinetic constants. The substrate-velocity data for
S74
2-thiopheneacetyl-ACP was fitted to substrate inhibition equation (Equation 2; Page S63). The substrate inhibition constant for 2-thiopheneacetyl-ACP is 30 ± 9 µM.

S75
Fig. S81 Substrate-velocity curves for 3-oxoacyl-ACP substrate analogs with YspI by acylation assay. In general, for all of the substrates except the 2-thiopheneacetyl-ACP, initial rate data was fitted to Michaelis-Menten Equation (Equation 1; Page S63) using Graphpad Prism 7.0 to determine kinetic constants. The substrate-velocity data for
S76
2-thiopheneacetyl-ACP was fitted to substrate inhibition equation (Equation 2; Page S63).
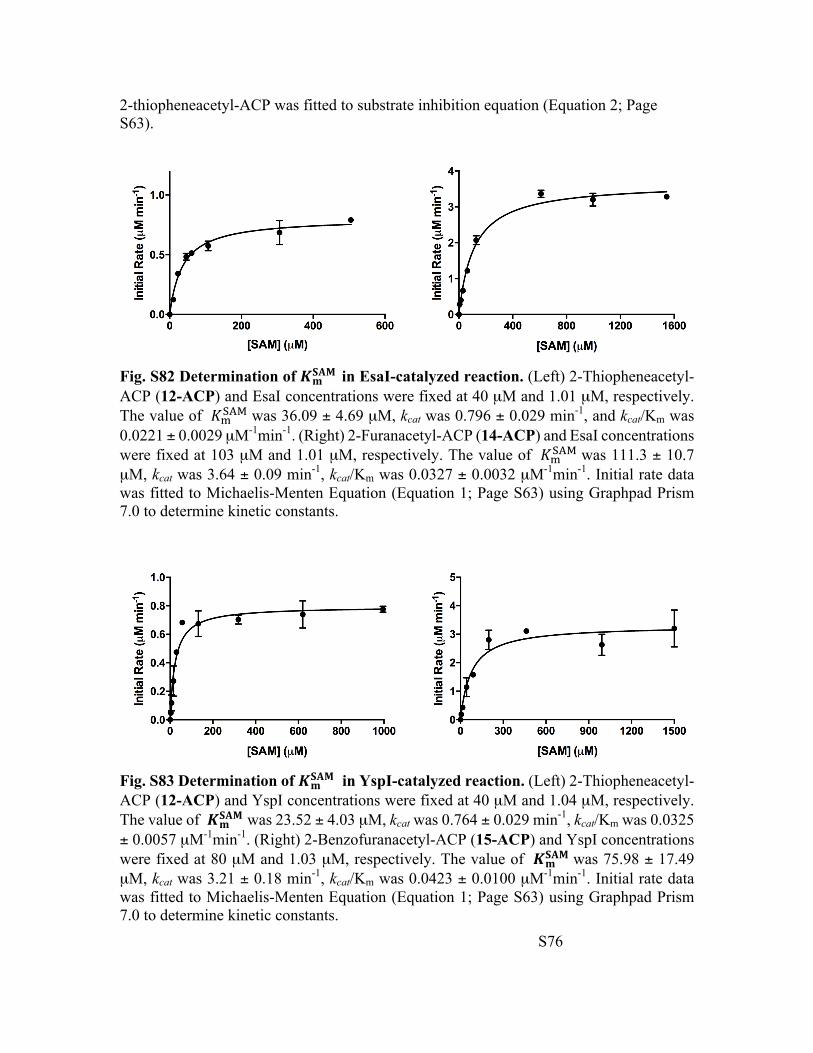
Fig. S82 Determination of !"#$% in EsaI-catalyzed reaction. (Left) 2-Thiopheneacetyl-ACP (12-ACP) and EsaI concentrations were fixed at 40 µM and 1.01 µM, respectively. The value of &'()* was 36.09 ± 4.69 µM, kcat was 0.796 ± 0.029 min-1, and kcat/Km was 0.0221 ± 0.0029 µM-1min-1. (Right) 2-Furanacetyl-ACP (14-ACP) and EsaI concentrations were fixed at 103 µM and 1.01 µM, respectively. The value of &'()* was 111.3 ± 10.7 µM, kcat was 3.64 ± 0.09 min-1, kcat/Km was 0.0327 ± 0.0032 µM-1min-1. Initial rate data was fitted to Michaelis-Menten Equation (Equation 1; Page S63) using Graphpad Prism 7.0 to determine kinetic constants.
Fig. S83 Determination of !"#$% in YspI-catalyzed reaction. (Left) 2-Thiopheneacetyl-ACP (12-ACP) and YspI concentrations were fixed at 40 µM and 1.04 µM, respectively. The value of !"#$% was 23.52 ± 4.03 µM, kcat was 0.764 ± 0.029 min-1, kcat/Km was 0.0325 ± 0.0057 µM-1min-1. (Right) 2-Benzofuranacetyl-ACP (15-ACP) and YspI concentrations were fixed at 80 µM and 1.03 µM, respectively. The value of !"#$% was 75.98 ± 17.49 µM, kcat was 3.21 ± 0.18 min-1, kcat/Km was 0.0423 ± 0.0100 µM-1min-1. Initial rate data was fitted to Michaelis-Menten Equation (Equation 1; Page S63) using Graphpad Prism 7.0 to determine kinetic constants.
S77
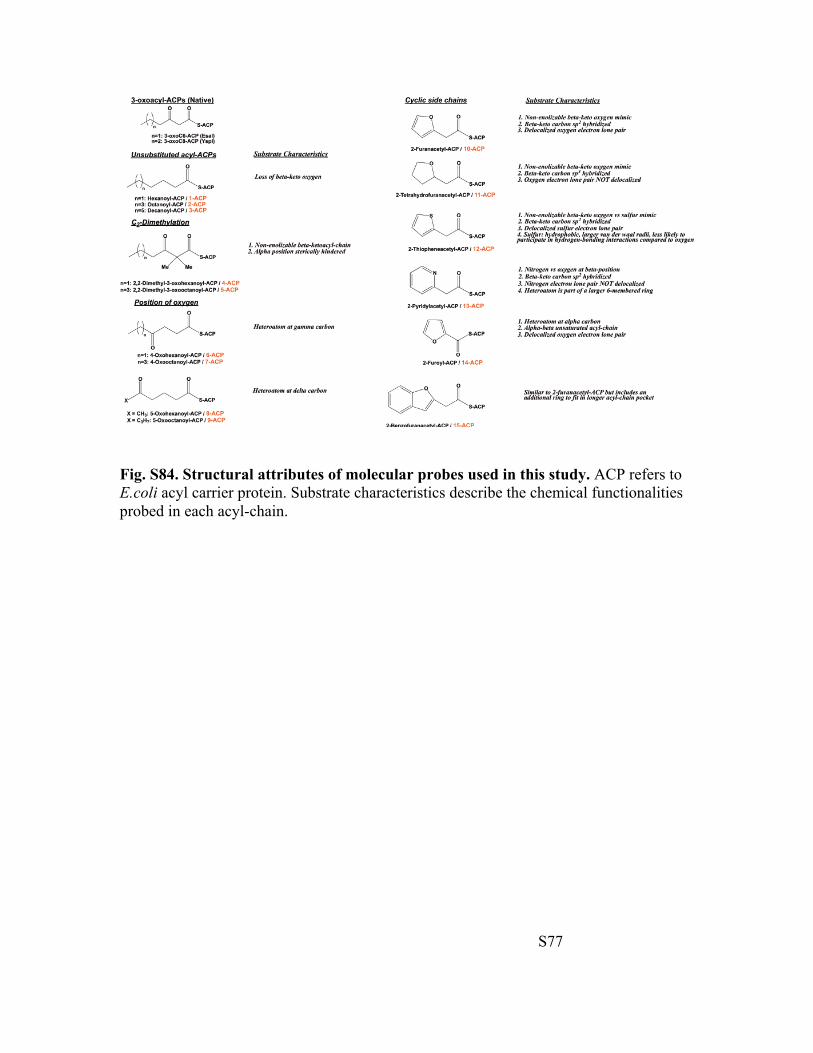
Fig. S84. Structural attributes of molecular probes used in this study. ACP refers to E.coli acyl carrier protein. Substrate characteristics describe the chemical functionalities probed in each acyl-chain.
S78
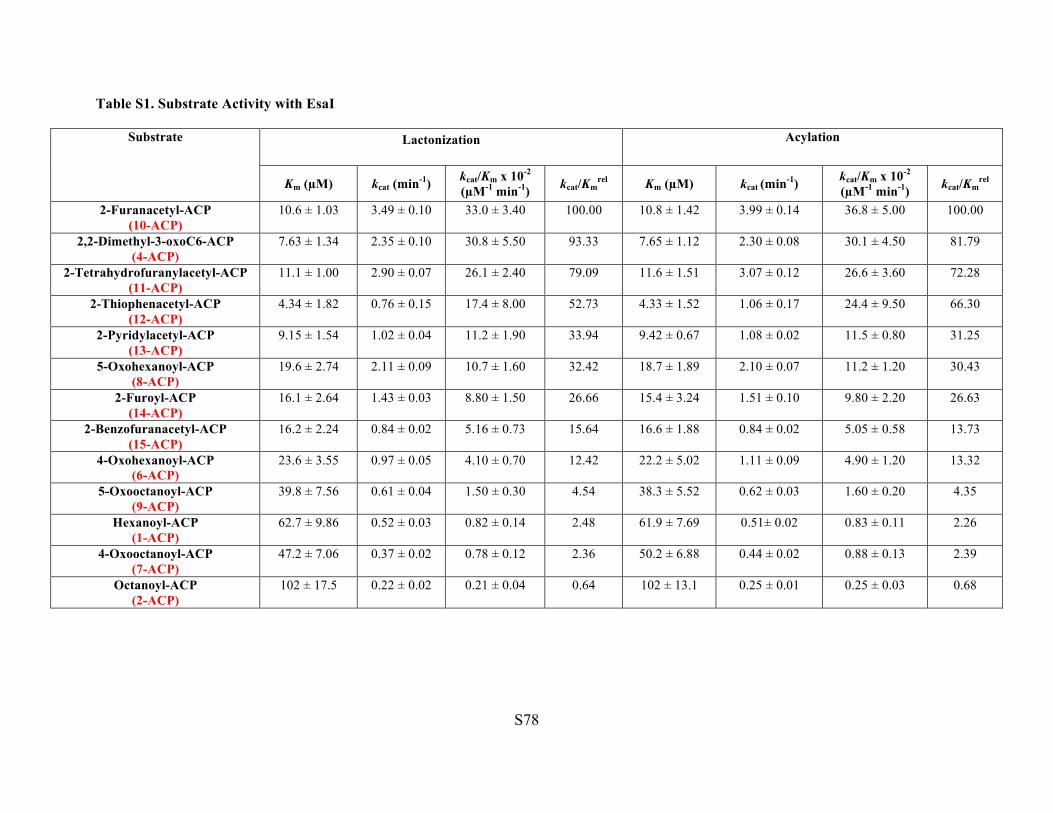
Table S1. Substrate Activity with EsaI
Substrate Lactonization Acylation
Km (µM) kcat (min-1) kcat/Km x 10-2 (µM-1 min-1) kcat/Km
rel Km (µM) kcat (min-1) kcat/Km x 10-2 (µM-1 min-1) kcat/Km
rel
2-Furanacetyl-ACP (10-ACP)
10.6 ± 1.03 3.49 ± 0.10 33.0 ± 3.40 100.00 10.8 ± 1.42 3.99 ± 0.14 36.8 ± 5.00 100.00
2,2-Dimethyl-3-oxoC6-ACP (4-ACP)
7.63 ± 1.34 2.35 ± 0.10 30.8 ± 5.50 93.33 7.65 ± 1.12 2.30 ± 0.08 30.1 ± 4.50 81.79
2-Tetrahydrofuranylacetyl-ACP (11-ACP)
11.1 ± 1.00 2.90 ± 0.07 26.1 ± 2.40 79.09 11.6 ± 1.51 3.07 ± 0.12 26.6 ± 3.60 72.28
2-Thiophenacetyl-ACP (12-ACP)
4.34 ± 1.82 0.76 ± 0.15 17.4 ± 8.00 52.73 4.33 ± 1.52 1.06 ± 0.17 24.4 ± 9.50 66.30
2-Pyridylacetyl-ACP (13-ACP)
9.15 ± 1.54 1.02 ± 0.04 11.2 ± 1.90 33.94 9.42 ± 0.67 1.08 ± 0.02 11.5 ± 0.80 31.25
5-Oxohexanoyl-ACP (8-ACP)
19.6 ± 2.74 2.11 ± 0.09 10.7 ± 1.60 32.42 18.7 ± 1.89 2.10 ± 0.07 11.2 ± 1.20 30.43
2-Furoyl-ACP (14-ACP)
16.1 ± 2.64 1.43 ± 0.03 8.80 ± 1.50 26.66 15.4 ± 3.24 1.51 ± 0.10 9.80 ± 2.20 26.63
2-Benzofuranacetyl-ACP (15-ACP)
16.2 ± 2.24 0.84 ± 0.02 5.16 ± 0.73 15.64 16.6 ± 1.88 0.84 ± 0.02 5.05 ± 0.58 13.73
4-Oxohexanoyl-ACP (6-ACP)
23.6 ± 3.55 0.97 ± 0.05 4.10 ± 0.70 12.42 22.2 ± 5.02 1.11 ± 0.09 4.90 ± 1.20 13.32
5-Oxooctanoyl-ACP (9-ACP)
39.8 ± 7.56 0.61 ± 0.04 1.50 ± 0.30 4.54 38.3 ± 5.52 0.62 ± 0.03 1.60 ± 0.20 4.35
Hexanoyl-ACP (1-ACP)
62.7 ± 9.86 0.52 ± 0.03 0.82 ± 0.14 2.48 61.9 ± 7.69 0.51± 0.02 0.83 ± 0.11 2.26
4-Oxooctanoyl-ACP (7-ACP)
47.2 ± 7.06 0.37 ± 0.02 0.78 ± 0.12 2.36 50.2 ± 6.88 0.44 ± 0.02 0.88 ± 0.13 2.39
Octanoyl-ACP (2-ACP)
102 ± 17.5 0.22 ± 0.02 0.21 ± 0.04 0.64 102 ± 13.1 0.25 ± 0.01 0.25 ± 0.03 0.68
S79
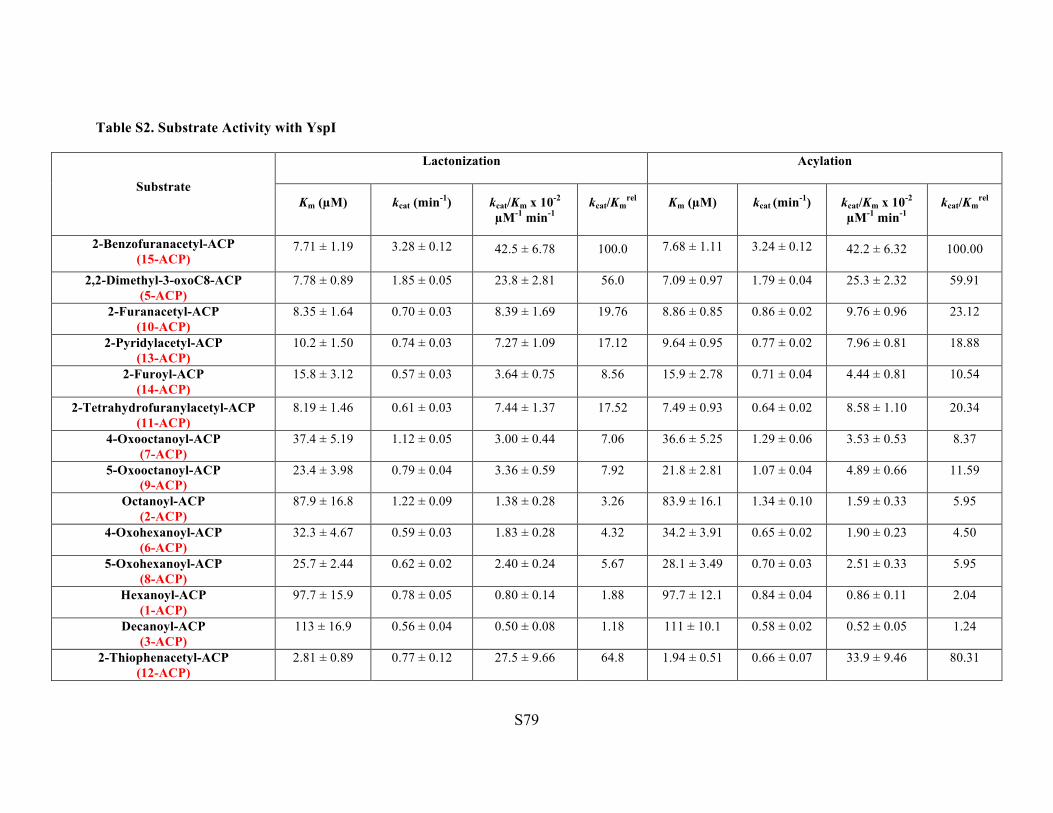
Table S2. Substrate Activity with YspI
Substrate
Lactonization Acylation
Km (µM) kcat (min-1) kcat/Km x 10-2 µM-1 min-1
kcat/Kmrel Km (µM) kcat (min-1) kcat/Km x 10-2
µM-1 min-1 kcat/Km
rel
2-Benzofuranacetyl-ACP (15-ACP)
7.71 ± 1.19 3.28 ± 0.12 42.5 ± 6.78 100.0 7.68 ± 1.11 3.24 ± 0.12 42.2 ± 6.32 100.00
2,2-Dimethyl-3-oxoC8-ACP (5-ACP)
7.78 ± 0.89 1.85 ± 0.05 23.8 ± 2.81 56.0 7.09 ± 0.97 1.79 ± 0.04 25.3 ± 2.32 59.91
2-Furanacetyl-ACP (10-ACP)
8.35 ± 1.64 0.70 ± 0.03 8.39 ± 1.69 19.76 8.86 ± 0.85 0.86 ± 0.02 9.76 ± 0.96 23.12
2-Pyridylacetyl-ACP (13-ACP)
10.2 ± 1.50 0.74 ± 0.03 7.27 ± 1.09 17.12 9.64 ± 0.95 0.77 ± 0.02 7.96 ± 0.81 18.88
2-Furoyl-ACP (14-ACP)
15.8 ± 3.12 0.57 ± 0.03 3.64 ± 0.75 8.56 15.9 ± 2.78 0.71 ± 0.04 4.44 ± 0.81 10.54
2-Tetrahydrofuranylacetyl-ACP (11-ACP)
8.19 ± 1.46 0.61 ± 0.03 7.44 ± 1.37 17.52 7.49 ± 0.93 0.64 ± 0.02 8.58 ± 1.10 20.34
4-Oxooctanoyl-ACP (7-ACP)
37.4 ± 5.19 1.12 ± 0.05 3.00 ± 0.44 7.06 36.6 ± 5.25 1.29 ± 0.06 3.53 ± 0.53 8.37
5-Oxooctanoyl-ACP (9-ACP)
23.4 ± 3.98 0.79 ± 0.04 3.36 ± 0.59 7.92 21.8 ± 2.81 1.07 ± 0.04 4.89 ± 0.66 11.59
Octanoyl-ACP (2-ACP)
87.9 ± 16.8 1.22 ± 0.09 1.38 ± 0.28 3.26 83.9 ± 16.1 1.34 ± 0.10 1.59 ± 0.33 5.95
4-Oxohexanoyl-ACP (6-ACP)
32.3 ± 4.67 0.59 ± 0.03 1.83 ± 0.28 4.32 34.2 ± 3.91 0.65 ± 0.02 1.90 ± 0.23 4.50
5-Oxohexanoyl-ACP (8-ACP)
25.7 ± 2.44 0.62 ± 0.02 2.40 ± 0.24 5.67 28.1 ± 3.49 0.70 ± 0.03 2.51 ± 0.33 5.95
Hexanoyl-ACP (1-ACP)
97.7 ± 15.9 0.78 ± 0.05 0.80 ± 0.14 1.88 97.7 ± 12.1 0.84 ± 0.04 0.86 ± 0.11 2.04
Decanoyl-ACP (3-ACP)
113 ± 16.9 0.56 ± 0.04 0.50 ± 0.08 1.18 111 ± 10.1 0.58 ± 0.02 0.52 ± 0.05 1.24
2-Thiophenacetyl-ACP (12-ACP)
2.81 ± 0.89 0.77 ± 0.12 27.5 ± 9.66 64.8 1.94 ± 0.51 0.66 ± 0.07 33.9 ± 9.46 80.31
S80
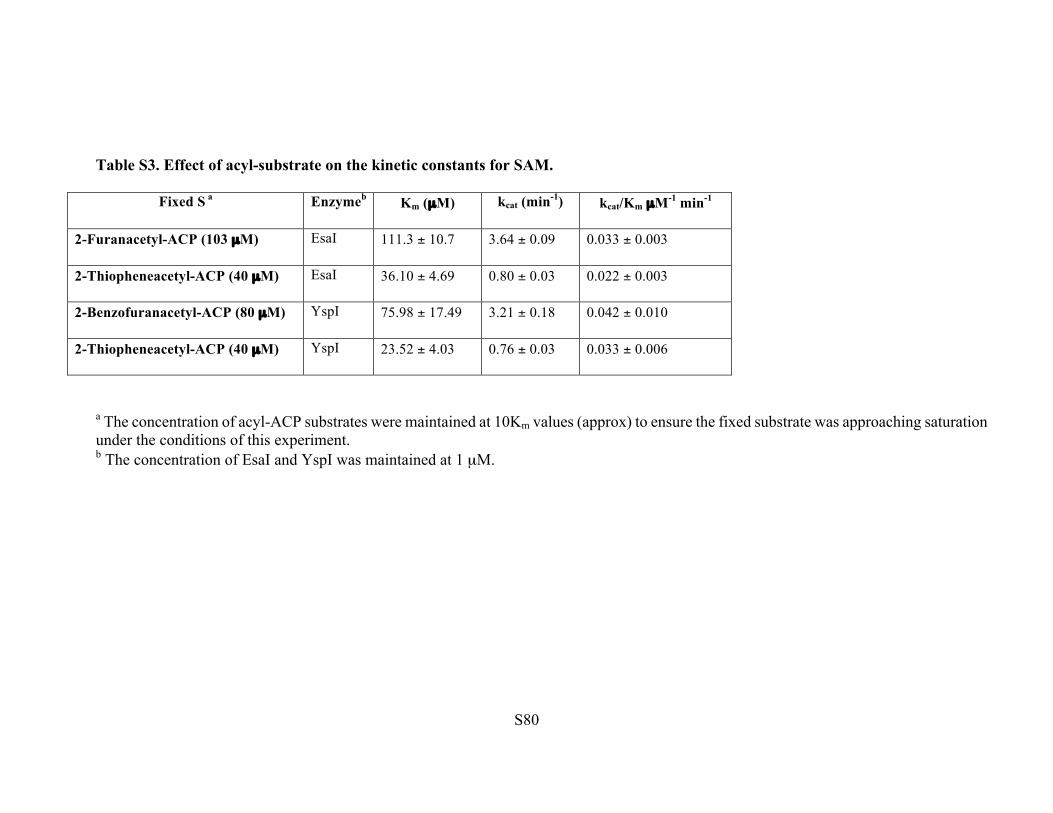
Table S3. Effect of acyl-substrate on the kinetic constants for SAM.
Fixed S a Enzymeb Km (µM) kcat (min-1) kcat/Km µM-1 min-1
2-Furanacetyl-ACP (103 µM) EsaI 111.3 ± 10.7 3.64 ± 0.09 0.033 ± 0.003
2-Thiopheneacetyl-ACP (40 µM) EsaI 36.10 ± 4.69 0.80 ± 0.03 0.022 ± 0.003
2-Benzofuranacetyl-ACP (80 µM) YspI 75.98 ± 17.49 3.21 ± 0.18 0.042 ± 0.010
2-Thiopheneacetyl-ACP (40 µM) YspI 23.52 ± 4.03 0.76 ± 0.03 0.033 ± 0.006
a The concentration of acyl-ACP substrates were maintained at 10Km values (approx) to ensure the fixed substrate was approaching saturation under the conditions of this experiment. b The concentration of EsaI and YspI was maintained at 1 µM.
S81
References [1] R. C. Brinkerhoff, H. F. Tarazona, P. M. de Oliveira, D. C. Flores, C. R. M. D’Oca, D. Russowsky, M.G.M. D’Oca, RSC Adv. 2014, 4, 49556. [2] Y. Nishimoto, A. Okita, M. Yasuda, A. Baba, Angew. Chem. Int. Ed. 2011, 50, 8623. [3] M. D’Ambrosio, A. Guerriero, J. Chem. Research 2002, 12, 631. [4] a) A. N. Montebello, R. M. Brecht, R. D. Turner, M. Ghali, X. Pu, R. Nagarajan, Biochemistry 2014, 53, 6231; b) Q. H. Christensen, T. L. Grove, S. J. Booker, E. P. Greenberg, PNAS 2013, 110, 13815. [5] a) P. M. Kaiser, Journal of Molecular Catalysis 1980, 8, 431; b) C. M. Porter, B. G. Miller, Bioorganic Chemistry 2012, 43, 44.