ΔΙΕΥΘΥΝΣΗ [email protected] ΣΥΓΓΡΑΦΕΑ...
12
ΔΙΕΥΘΥΝΣΗ [email protected] ΣΥΓΓΡΑΦΕΑ ΕΠΙΚΟΙΝΩΝΙΑΣ Patras, 17-Mar-10 Dear colleague, We have the pleasure to inform you that, after the reviewing process, your paper entitled: Seismic Sources and Main Seismic Faults in the Aegean and Surrounding Area has been accepted for presentation in the 12 th International Congress of the Geological Society of Greece. Therefore you are kindly requested to send us back the manuscript with the appropriate corrections according to the comments of the reviewers’ and/or remarks on the text, keeping in mind the guidelines of the pre-formatted article as it appears in the Congress web site www.synedra.gr, until the 28 th of February 2010. Thank you for your co-operation and we are looking forward to see you at the congress. With best regards For the Organizing Committee, G. Koukis P.S. Please kindly inform us if you wish to make an oral or poster presentation of your paper.
Transcript of ΔΙΕΥΘΥΝΣΗ [email protected] ΣΥΓΓΡΑΦΕΑ...
ΔΙΕΥΘΥΝΣΗ [email protected] ΣΥΓΓΡΑΦΕΑ ΕΠΙΚΟΙΝΩΝΙΑΣ
Patras, 17-Mar-10 Dear colleague, We have the pleasure to inform you that, after the reviewing process, your paper entitled: Seismic Sources and Main Seismic Faults in the Aegean and Surrounding Area has been accepted for presentation in the 12th International Congress of the Geological Society of Greece.
Therefore you are kindly requested to send us back the manuscript with the appropriate corrections according to the comments of the reviewers’ and/or remarks on the text, keeping in mind the guidelines of the pre-formatted article as it appears in the Congress web site www.synedra.gr, until the 28th of February 2010. Thank you for your co-operation and we are looking forward to see you at the congress.
With best regards
For the Organizing Committee,
G. Koukis
P.S. Please kindly inform us if you wish to make an oral or poster presentation of your paper.
1
Δελτίο της Ελληνικής Γεωλογικής Εταιρίας, 2010 Πρακτικά 12ου Διεθνούς Συνεδρίου, Πάτρα, Μάιος 2010
Bulletin of the Geological Society of Greece, 2010 Proceedings of the 12th International Congress, Patras, May, 2010
Seismic Sources and Main Seismic Faults in the Aegean and Surrounding Area
G.F. Karakaisis, C.B. Papazachos, and E.M. Scordilis
Department of Geophysics, School of Geology, Faculty of Science, Aristotle University, GR54124,
Thessaloniki, GREECE, [email protected], [email protected], [email protected]
Abstract A seismic source is defined, in the present work, as the part of the seismogenic layer of the earth’s crust with a circular horizontal dimension (E, R), where E is the epicenter of the largest earthquake (mainshock) ever occurred in this seismic source and radius equal to the half fault length of this largest earthquake (R=L/2). In addition to foreshocks and aftershocks other smaller mainshocks occur in other smaller faults of this source or in parts of the main fault. All available historical and instrumental data concerning strong (M≥6.0) shallow (h≤60 km) and intermediate depth (60km<h≤100km) shocks which occurred in the Aegean area between 464 B.C. and 2008 are used in the present work in an attempt to identify the seismic sources in this area, as well as to determine the basic parameters of the largest fault in each source. A particular procedure is followed to identify 155 seismic sources in this area and determine the basic parameters of the largest fault in each source. Declustering has been also performed to define mainshocks in the Aegean area and the completeness of this mainshock catalogue has been determined. Results are summarized in table (1).
1. Introduction It is well known that the generation of strong earthquakes is a result of seismic slip on large seismic faults and that the seismic energy (and seismic moment) released by an earthquake is proportional to the dimensions of the ruptured fault and to the slip on this fault (Aki, 1966). It is also known that fault rupture is due to the relative movement of huge crustal blocks (Reid, 1911).
The largest earthquake in a region (characteristic earthquake) is due to the break of the largest (main) fault of this region and this break is repeated at relatively long time intervals (Schwartz and Coppersmith, 1984). Smaller earthquakes occur more frequently by rupture of parts (segments) of the main fault or of smaller faults in the nearby region (vicinity of the main fault). The region which includes the main (largest) fault as well as the nearby smaller faults and has a (linear) dimension equal to the length of the main fault is called focal region in the present work.
Much work has been done to locate and study seismic faults in the Aegean area by using seismological and geological data. Thus, Papazachos and his colleagues (2001) combined seismological and geological data to determine properties of 159 seismic faults where 567 strong shallow earthquakes occurred in the Aegean area since antiquity.
The purpose of the present paper is to use seismological data (location of earthquakes, fault plane solutions) to define focal regions and the corresponding main faults where all known strong (M≥6.0) earthquakes with depth h≤100km occurred since 464 BC in the Aegean area (34oN-43oN, 18oE-30oE).
2. The Data The data used in the present study are instrumental, which concern earthquakes that occurred in the Aegean area since 1911 when the first seismograph was installed in Athens (a two-horizontal component Mainka type mechanical seismograph), and historical, which concern strong earthquakes
2
(M≥6.0) that occurred in the same region since 464 BC. The parameters (origin time, epicenter coordinates and magnitude) for the instrumental period (1911-2008) are based mainly on seismographic records and partly on macroseismic information (Papazachos et al., 2009) while these parameters for historical earthquakes are entirely based on macroseismic information (Papazachos and Papazachou, 2003).
The data required for the present study must be accurate to a reasonable degree and homogeneous in respect to the magnitude of earthquakes. These data must also be complete, that is, the data sample used must include all earthquakes which occurred in a certain region during a certain time interval and have magnitudes larger than a certain value. Accuracy concerns location of earthquake focus and earthquake magnitude. The present study deals with shallow (h≤60km) and intermediate-depth (60km<h≤100km) earthquakes. The error in the epicenter coordinates is about 20 km. The error in the magnitude is 0.3 or less. All magnitudes are in the moment magnitude scale. Completeness of the instrumental data is as follows:
M≥5.2, 1911-2008 (1)
That is, the data samples include all earthquakes which have moment magnitude equal to or larger than 5.2 and occurred in the Aegean area between 1.1.1911 and 31.12.2008. The completeness for the historical data (464BC-1910) is examined in section (7). The earthquake catalogues used in the present study can be found at the site http://geophysics.geo.auth.gr/ss/station_index_en.html/.
3. Determination of Focal Regions in the Aegean The focal region of a shallow mainshock is defined, in the present work, as the part of the seismogenic layer which cuts the earth’s surface in a circle with center, E, the epicenter of the mainshock and radius equal to the half of the length of the fault ruptured during the generation of the mainshock (the focal region, actually, is a cylindrical part of the crust with height equal to the thickness of the seismogenic layer). In a first approximation the length, L (in km), of the faults in the Aegean area is given by the relation:
logL = 0.51·M – 1.85 (2)
where M is the moment magnitude of the earthquake (Papazachos and Papazachou, 2003). Relation (2) is used to calculate the fault length, Lmax, of the largest earthquake ever occurred in the focal region and the radius of this focal region is R=Lmax/2. Smaller mainshocks also occur in the focal region by rupturing of other smaller faults or parts of the main fault. Thus, to determine E and R for each focal region of the Aegean area the following procedure has been applied by using the earthquake catalogue (M≥6.0 since 464BC, M≥5.2 since 1911) described in section (2).
First, the epicenter of the largest earthquake of the catalogue is considered as the center, E, of the largest focal region in the Aegean and its magnitude is used to calculate L by relation (2) and the radius R (=L/2) of this region. All earthquakes with epicenters within this region are excluded from the original catalogue and the same procedure is applied in the remaining part of the catalogue to determine the second largest focal region in the Aegean area. This procedure is repeated for the third, fourth, etc. largest focal region of the Aegean till all earthquakes with M≥6.0 are excluded from the catalogue. In cases when more than one earthquakes of equal magnitude are the largest in the remaining catalogue, they are sorted by decreasing origin time and the corresponding focal regions are defined in this order, i.e. the most recent largest earthquake is firstly considered, then the second most recent largest earthquake, etc. For the mainshocks of the catalogue with M<6.5 the radius of the focal region based on relation (2) is within the error range of the epicenter location. For this reason, in such cases this radius is taken equal to 15 km. It must be also noted that the well documented earthquakes in the Aegean area have moment magnitudes M≤7.6. For this region the maximum radius of the focal regions in the Aegean area was considered equal to 53 km. There are, however, two earthquakes in the catalogue (365 A.D., 1303) for which larger magnitudes have been estimated, but such big earthquakes have a very large return period (~1000 yrs) and only parts of their faults usually break. Magnitudes equal to 7.7 have been assigned for both these earthquakes for the purpose of the present paper.
After the application of the procedure described above 218 shallow circular focal regions have been identified in the Aegean and its surrounding area. A mapping of these regions revealed that in many cases there is overlap of adjoining focal regions.
3
In addition to the shallow (h≤60km) focal regions defined in the present work, there have been also defined in the southern part of the Aegean area four (4) focal regions of intermediate focal depth (60km<h≤100km) where very strong destructive earthquakes have occurred (D1, D2, D3, D4 in fig. 6.6 of Papazachos and Papazachou, 2003). Available information for these four focal regions is given in table (1) with code numbers 152, 153, 154 and 155 whereas data completeness is given by relations (1) and (13).
4. Orientations of the Largest Faults and Their Slip Vectors The orientation of a seismic fault is defined by its strike, ξ (the angle between the intersection of the fault and horizontal plane with the north direction), and by its dip, δ (the angle between the intersection of the fault plane and the normal to the fault strike vertical plane and the horizontal projection of this intersection). The slip vector, which shows the slip direction of the hanging wall of the fault, is determined by the rake, λ (the angle between the slip vector and the strike direction of the fault) and defines the kind of faulting (normal, thrust, strike-slip dextral or strike-slip sinistral).
To define the strike, ξ, the dip, δ, and the rake, λ, for the main fault of a focal region, i.e. the fault where the largest earthquake in this region has occurred, all reliable fault plane solutions which are available for earthquakes located in the corresponding focal region have been used to determine a typical solution by a method proposed by Papazachos and Kiratzi (1992). This typical fault plane solution is adopted as the fault plane solution for the corresponding main fault.
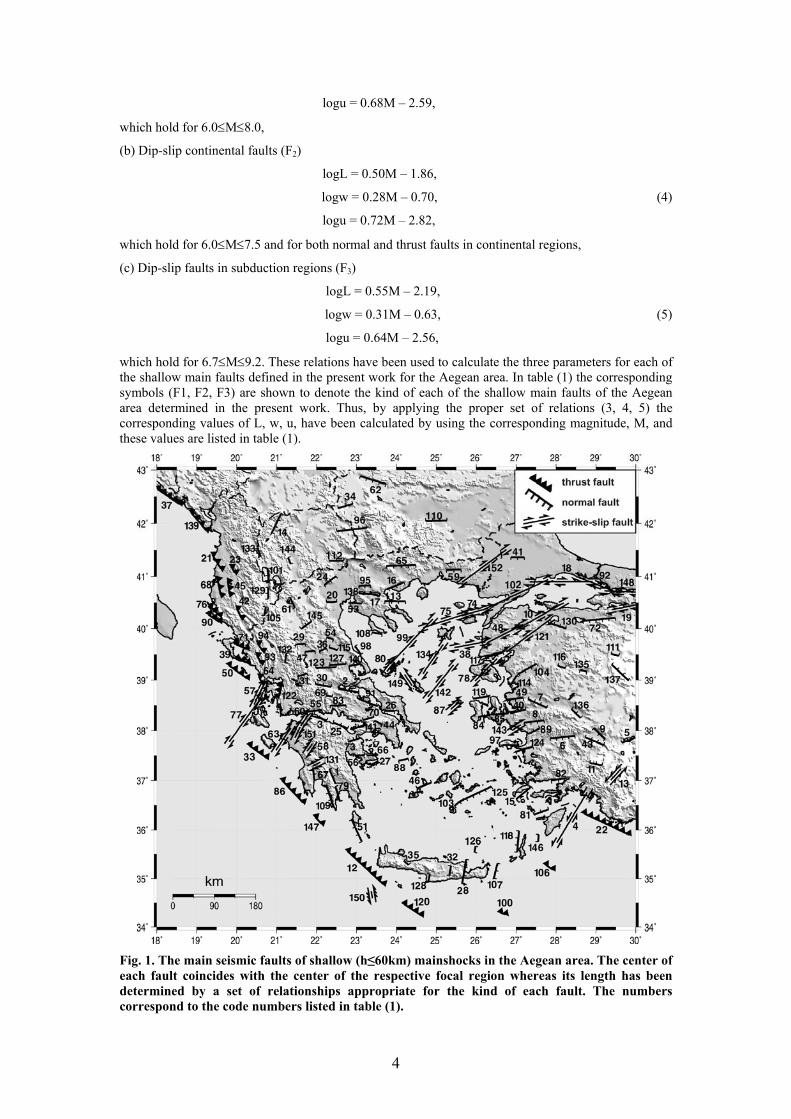
In many cases we encountered the following situation: the typical fault plane solution for a certain focal region, (B), was of the same type with the solution determined earlier for an adjoining focal region, (A), where the magnitude of the largest earthquake was larger than the magnitude of the largest earthquake in region (B). Taking this fact into account we incorporated all data (earthquakes and fault plane solutions) of the region (B) in the region (A) in the cases of significant overlap of both regions. This resulted in 151 typical fault plane solutions. We then compared the values of strike, dip and rake of these solutions with the corresponding values determined for the major faults in the Aegean and surrounding area (Papazachos et al., 2001). We found that the values of the attributes (strike, dip, rake) of the majority of these 151 typical fault plane solutions were close to those of Papazachos et al. (2001) which were based on a large amount of well documented seismological and geological data. For this reason, the information on the strike, ξ, dip, δ, and rake, λ, listed in table (1) for almost all typical fault plane solutions comes from the work of Papazachos et al. (2001). In the same table corresponding symbols are used to denote thrust faults in the subduction area (TS), thrust faults in the continental area (TC), normal faults (N), strike-slip dextral faults (SD) and strike-slip sinistral faults (SS). Figure (1) shows on a map of the Aegean area these 151 main faults denoted with the corresponding symbols. The length of the symbols used to denote these faults is proportional to the length calculated according to the relations presented in the next section whereas the center of each fault coincides with the center of the respective focal region.
5. Length, Width and Slip of Main Faults Several empirical relations between the basic fault parameters (fault length, width, fault slip) and the magnitude of the corresponding earthquake have been proposed (Kanamori and Anderson 1975, Bonilla et al. 1984, Wesnousky 1986, Wells and Coppersmith 1994, Smith and Stock 2004, Papazachos and Papazachou 2003, among others). There are, however, differences among these relations which stem from uncertainties of the data used. Papazachos et al. (2004) used a considerable number of published reliable global data which are homogeneous (fault parameters estimated by the same method, earthquake magnitudes in the same scale), fairly accurate (accurate fault parameters, magnitudes) to relate the fault length, L (in km) and the fault width, w (in km) of the fault as well as the mean slip (displacement) of a fault, u (in cm) with the moment magnitude, M for three kinds of faults (strike-slip faults, dip-slip continental faults and dip-slip faults in subduction regions). These relations are as follows:
(a) Strike-slip faults (F1)
logL = 0.59M – 2.30,
logw = 0.23M – 0.49, (3)
4
logu = 0.68M – 2.59,
which hold for 6.0≤M≤8.0,
(b) Dip-slip continental faults (F2)
logL = 0.50M – 1.86,
logw = 0.28M – 0.70, (4)
logu = 0.72M – 2.82,
which hold for 6.0≤M≤7.5 and for both normal and thrust faults in continental regions,
(c) Dip-slip faults in subduction regions (F3)
logL = 0.55M – 2.19,
logw = 0.31M – 0.63, (5)
logu = 0.64M – 2.56,
which hold for 6.7≤M≤9.2. These relations have been used to calculate the three parameters for each of the shallow main faults defined in the present work for the Aegean area. In table (1) the corresponding symbols (F1, F2, F3) are shown to denote the kind of each of the shallow main faults of the Aegean area determined in the present work. Thus, by applying the proper set of relations (3, 4, 5) the corresponding values of L, w, u, have been calculated by using the corresponding magnitude, M, and these values are listed in table (1).
Fig. 1. The main seismic faults of shallow (h≤60km) mainshocks in the Aegean area. The center of each fault coincides with the center of the respective focal region whereas its length has been determined by a set of relationships appropriate for the kind of each fault. The numbers correspond to the code numbers listed in table (1).
5
6. Declustering of Data Declustering of data means the use of the original catalogue described in section (2) to create a catalogue that includes mainshocks only. Earthquakes of the original catalogue included in a focal region are spatially and temporally clustered and a procedure must be applied to make a temporal declustering of these earthquakes by excluding associated shocks. Such shocks are the ones preceding (preshocks) or following (postshocks) each mainshock in the focal region. Such declustering is performed in the present work by assuming that the preshock period is equal to the postshock period and independent of the mainshock magnitude. As a measure of clustering the ratio, Cv=σ/Τ, is used where T is the mean repeat time of the earthquakes of the cluster and σ is its standard deviation (Kagan and Jackson, 1991). Cv takes a value: equal to 1 for Poissonian distribution, larger than 1 for clustered shocks, equal to zero for periodic generation of shocks and an intermediate value (e.g. Cv=0.5) for quasi-periodic behavior as are the earthquakes which follow the time predictable model. Thus, the optimum time duration of associated shocks (preshocks, postshocks) for which a proper declustering is obtained is that one for which Cv takes its smallest value. To define this optimum time duration the following procedure was followed:
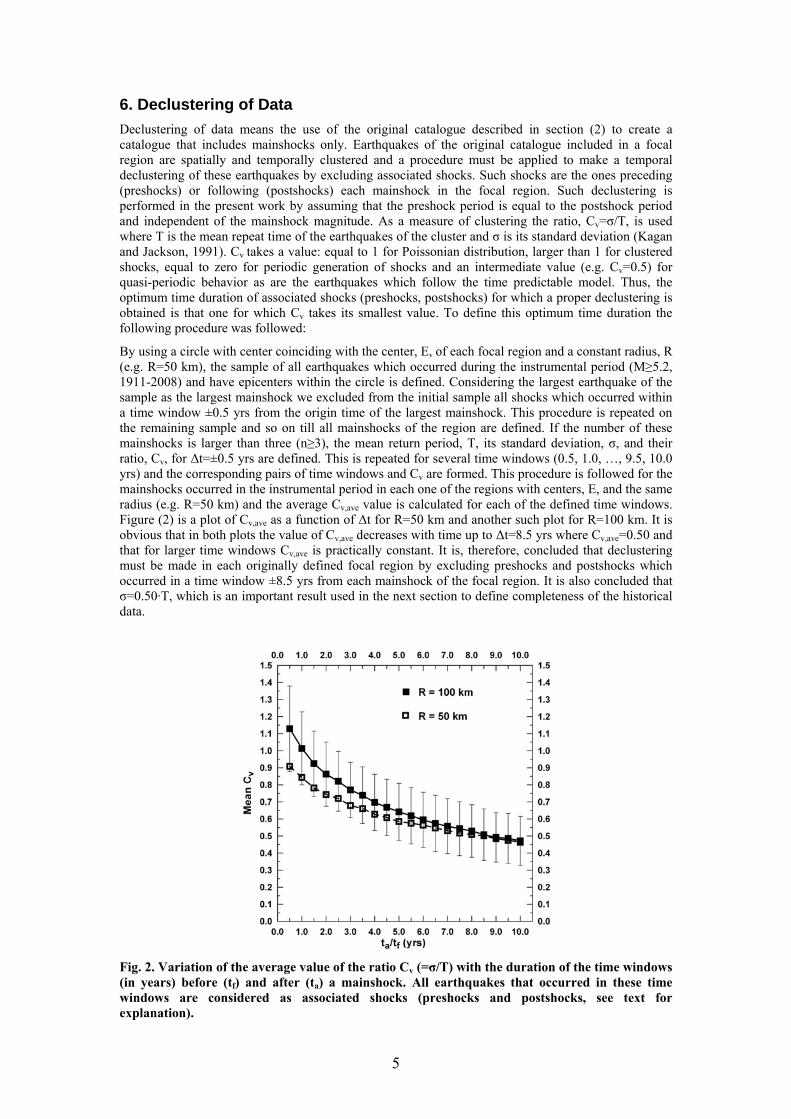
By using a circle with center coinciding with the center, E, of each focal region and a constant radius, R (e.g. R=50 km), the sample of all earthquakes which occurred during the instrumental period (M≥5.2, 1911-2008) and have epicenters within the circle is defined. Considering the largest earthquake of the sample as the largest mainshock we excluded from the initial sample all shocks which occurred within a time window ±0.5 yrs from the origin time of the largest mainshock. This procedure is repeated on the remaining sample and so on till all mainshocks of the region are defined. If the number of these mainshocks is larger than three (n≥3), the mean return period, T, its standard deviation, σ, and their ratio, Cv, for Δt=±0.5 yrs are defined. This is repeated for several time windows (0.5, 1.0, …, 9.5, 10.0 yrs) and the corresponding pairs of time windows and Cv are formed. This procedure is followed for the mainshocks occurred in the instrumental period in each one of the regions with centers, E, and the same radius (e.g. R=50 km) and the average Cv,ave value is calculated for each of the defined time windows. Figure (2) is a plot of Cv,ave as a function of Δt for R=50 km and another such plot for R=100 km. It is obvious that in both plots the value of Cv,ave decreases with time up to Δt=8.5 yrs where Cv,ave=0.50 and that for larger time windows Cv,ave is practically constant. It is, therefore, concluded that declustering must be made in each originally defined focal region by excluding preshocks and postshocks which occurred in a time window ±8.5 yrs from each mainshock of the focal region. It is also concluded that σ=0.50·Τ, which is an important result used in the next section to define completeness of the historical data.
Fig. 2. Variation of the average value of the ratio Cv (=σ/T) with the duration of the time windows (in years) before (tf) and after (ta) a mainshock. All earthquakes that occurred in these time windows are considered as associated shocks (preshocks and postshocks, see text for explanation).
6
To decluster the initial sample of earthquakes included in each focal region and define the mainshocks of this region, the following procedure is applied: The largest earthquake of the focal region is considered as mainshock and all shocks of the region which occurred within a time window ± 8.5 yrs from the origin time of the largest mainshock are excluded. The same procedure is applied on the remaining sample to determine the second largest mainshock, etc. till all mainshocks of the focal region are defined. Thus, the mainshocks of all focal regions form the catalogue of mainshocks of the whole Aegean area.
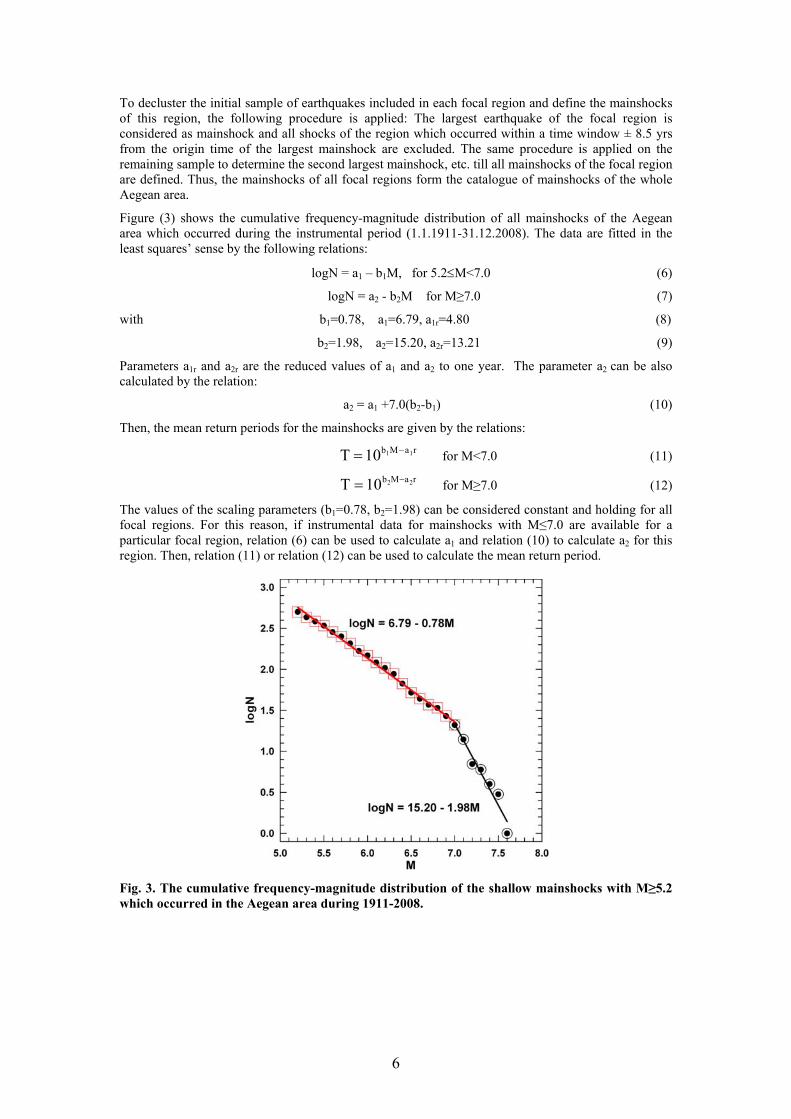
Figure (3) shows the cumulative frequency-magnitude distribution of all mainshocks of the Aegean area which occurred during the instrumental period (1.1.1911-31.12.2008). The data are fitted in the least squares’ sense by the following relations:
logN = a1 – b1M, for 5.2≤M<7.0 (6)
logN = a2 - b2M for M≥7.0 (7)
with b1=0.78, a1=6.79, a1r=4.80 (8)
b2=1.98, a2=15.20, a2r=13.21 (9)
Parameters a1r and a2r are the reduced values of a1 and a2 to one year. The parameter a2 can be also calculated by the relation:
a2 = a1 +7.0(b2-b1) (10)
Then, the mean return periods for the mainshocks are given by the relations: raMb 1110T −= for M<7.0 (11)
raMb 2210T −= for M≥7.0 (12)
The values of the scaling parameters (b1=0.78, b2=1.98) can be considered constant and holding for all focal regions. For this reason, if instrumental data for mainshocks with M≤7.0 are available for a particular focal region, relation (6) can be used to calculate a1 and relation (10) to calculate a2 for this region. Then, relation (11) or relation (12) can be used to calculate the mean return period.
Fig. 3. The cumulative frequency-magnitude distribution of the shallow mainshocks with M≥5.2 which occurred in the Aegean area during 1911-2008.
7
7. Completeness of Historical Mainshocks Another basic requirement of any historical earthquake catalogue, in addition to the homogeneity in the magnitude determination, is the assessment of its completeness, i.e. the assessment of the minimum magnitude above which the catalogue is considered to be fully reported. Traditional methods of estimating completeness of an earthquake catalogue are the frequency-magnitude and the time-magnitude distributions. Both these procedures led to the conclusion that earthquakes in the whole Aegean area investigated in the present work (34oN-43oN, 18oE-30oE) are complete for the period and magnitude range defined by relation (1) and by the relation:
M≥6.5, 1845-2008 (13)
Furthermore, completeness is defined for historical mainshocks with M≥6.5 in each circular region (E, R=100km) where E are the centers of the 151 shallow focal regions. For this purpose we used the information for the mainshocks that occurred during the instrumental period (1911-2008) and are located within the circle (E, R=100km) to determine the value a1 by the relation (6) assuming b1=0.78. Then, we used these two values and b2=1.98 to calculate a2 by the relation (10). After reducing a1 and a2 to one year (a1r, a2r) we can use the relations (11, 12) to calculate mean return periods for any historical earthquake. For example, we considered all mainshocks which are located within the circle (E, R=100km) and for each of them we calculated its mean return period, T, by applying relation (11) or (12) according to its magnitude. Then, the time period T*=T+2·σ (with σ=Cv·T=0.50·T) is calculated and subtracted from the origin time, te, of the earliest strong (M≥6.0) mainshock of the instrumental period to define a time t=te-T*. If the mainshock occurred after this time, t, it is included in the complete data, otherwise it is not. In this way each circular region (E, R=100km) includes epicenters of mainshocks which occurred during the instrumental and historical times and form complete samples of mainshocks. Information on the completeness of mainshocks in each focal region is given in table (1).
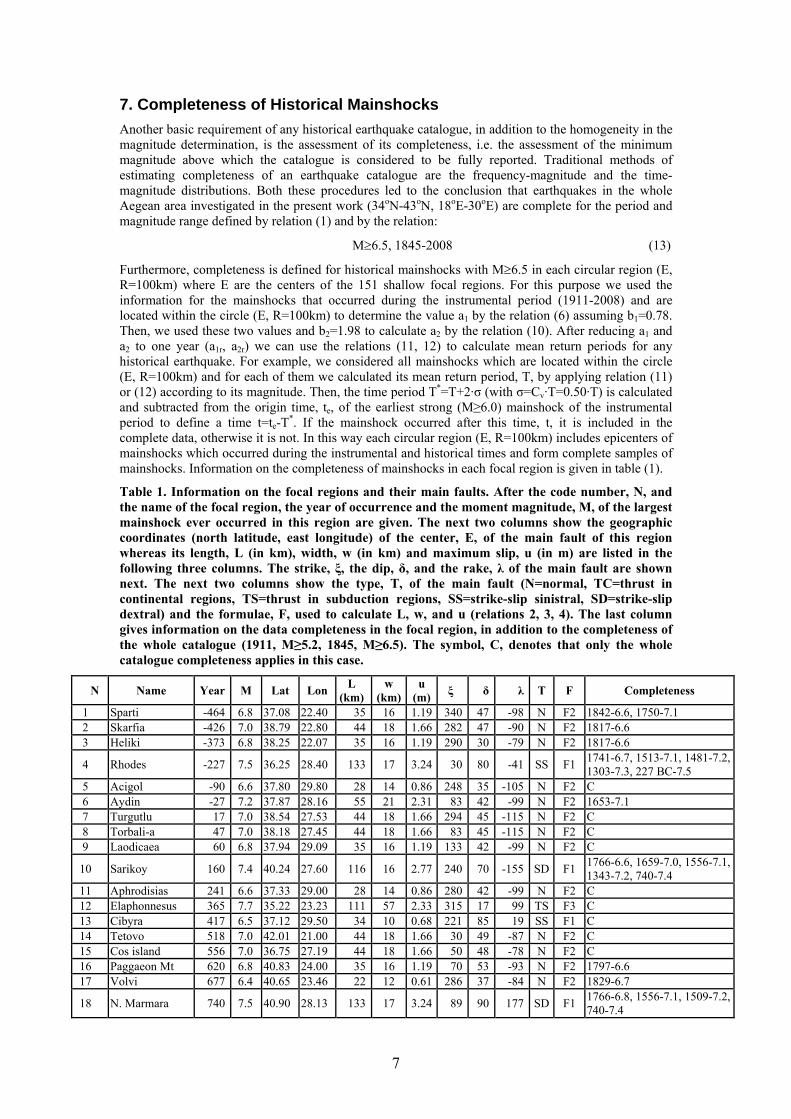
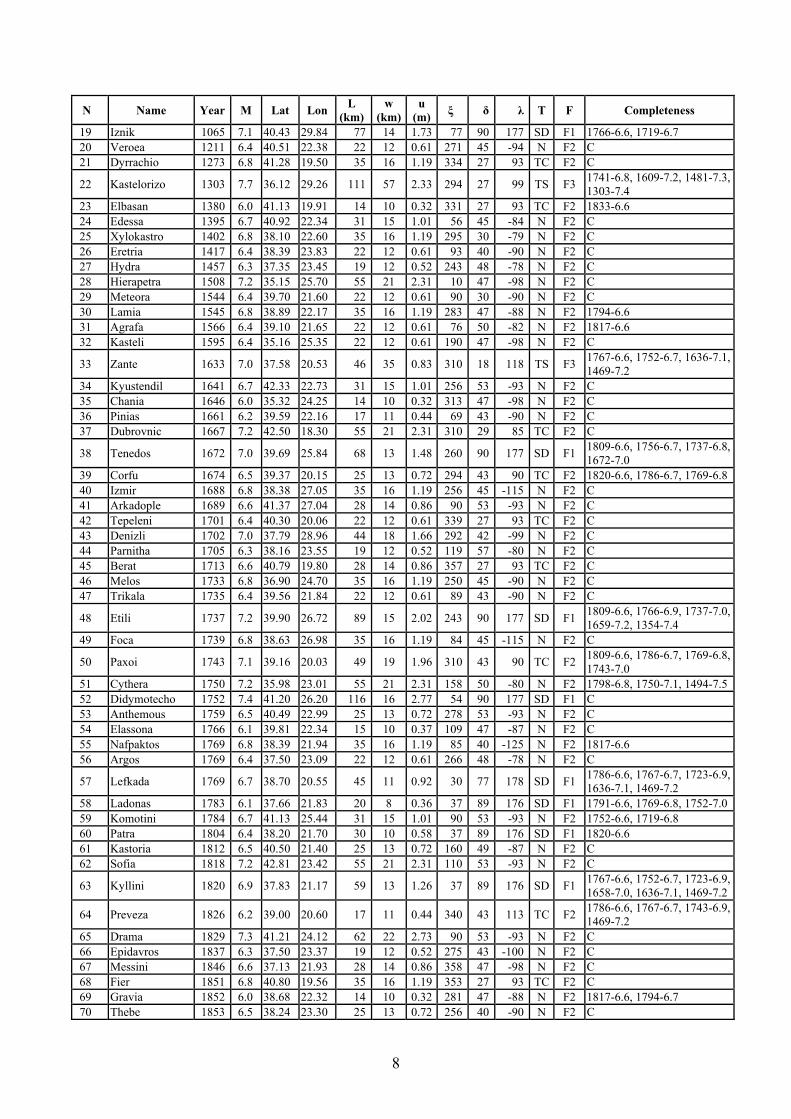
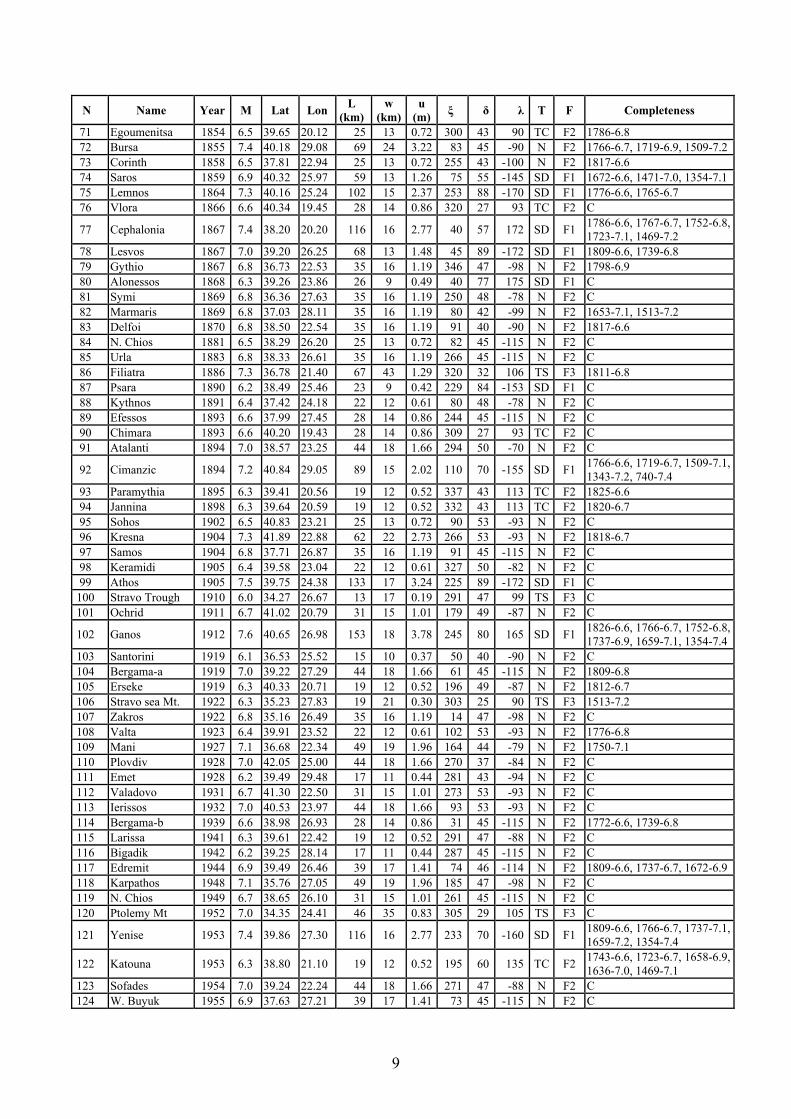
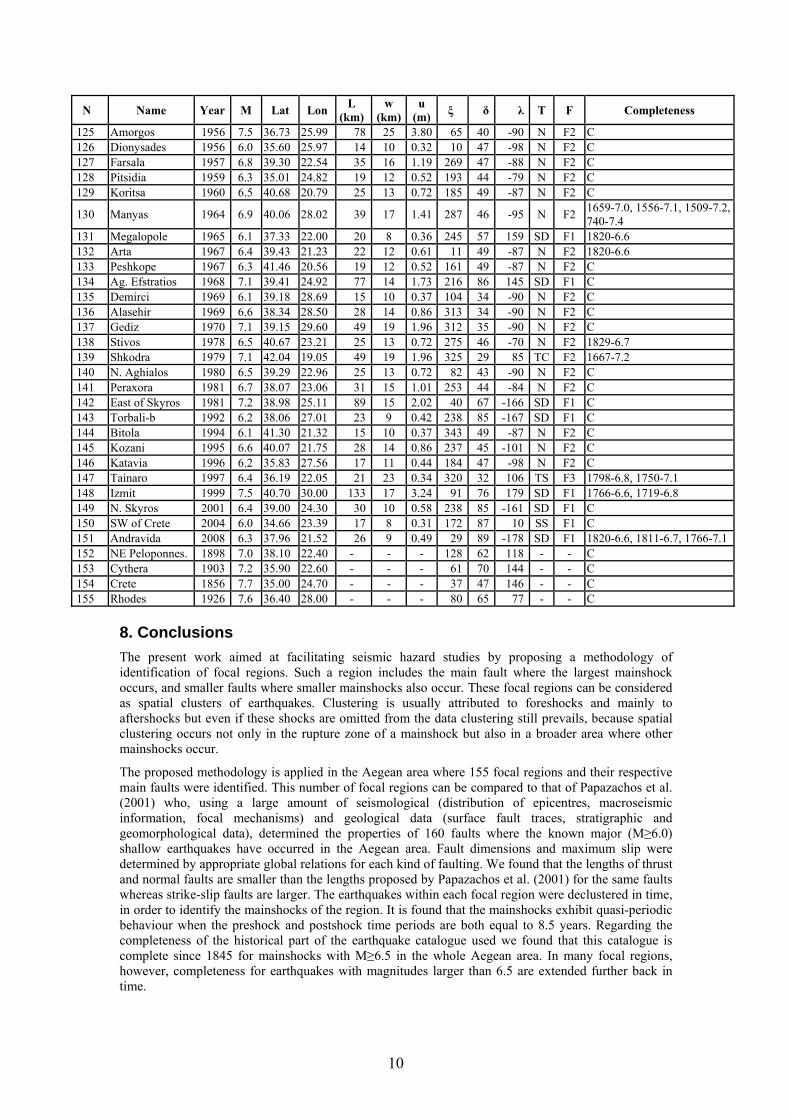
Table 1. Information on the focal regions and their main faults. After the code number, N, and the name of the focal region, the year of occurrence and the moment magnitude, M, of the largest mainshock ever occurred in this region are given. The next two columns show the geographic coordinates (north latitude, east longitude) of the center, E, of the main fault of this region whereas its length, L (in km), width, w (in km) and maximum slip, u (in m) are listed in the following three columns. The strike, ξ, the dip, δ, and the rake, λ of the main fault are shown next. The next two columns show the type, T, of the main fault (N=normal, TC=thrust in continental regions, TS=thrust in subduction regions, SS=strike-slip sinistral, SD=strike-slip dextral) and the formulae, F, used to calculate L, w, and u (relations 2, 3, 4). The last column gives information on the data completeness in the focal region, in addition to the completeness of the whole catalogue (1911, M≥5.2, 1845, M≥6.5). The symbol, C, denotes that only the whole catalogue completeness applies in this case.
N Name Year M Lat Lon L (km)
w (km)
u (m) ξ δ λ T F Completeness
1 Sparti -464 6.8 37.08 22.40 35 16 1.19 340 47 -98 N F2 1842-6.6, 1750-7.1 2 Skarfia -426 7.0 38.79 22.80 44 18 1.66 282 47 -90 N F2 1817-6.6 3 Heliki -373 6.8 38.25 22.07 35 16 1.19 290 30 -79 N F2 1817-6.6
4 Rhodes -227 7.5 36.25 28.40 133 17 3.24 30 80 -41 SS F1 1741-6.7, 1513-7.1, 1481-7.2, 1303-7.3, 227 BC-7.5
5 Acigol -90 6.6 37.80 29.80 28 14 0.86 248 35 -105 N F2 C 6 Aydin -27 7.2 37.87 28.16 55 21 2.31 83 42 -99 N F2 1653-7.1 7 Turgutlu 17 7.0 38.54 27.53 44 18 1.66 294 45 -115 N F2 C 8 Torbali-a 47 7.0 38.18 27.45 44 18 1.66 83 45 -115 N F2 C 9 Laodicaea 60 6.8 37.94 29.09 35 16 1.19 133 42 -99 N F2 C
10 Sarikoy 160 7.4 40.24 27.60 116 16 2.77 240 70 -155 SD F1 1766-6.6, 1659-7.0, 1556-7.1, 1343-7.2, 740-7.4
11 Aphrodisias 241 6.6 37.33 29.00 28 14 0.86 280 42 -99 N F2 C 12 Elaphonnesus 365 7.7 35.22 23.23 111 57 2.33 315 17 99 TS F3 C 13 Cibyra 417 6.5 37.12 29.50 34 10 0.68 221 85 19 SS F1 C 14 Tetovo 518 7.0 42.01 21.00 44 18 1.66 30 49 -87 N F2 C 15 Cos island 556 7.0 36.75 27.19 44 18 1.66 50 48 -78 N F2 C 16 Paggaeon Mt 620 6.8 40.83 24.00 35 16 1.19 70 53 -93 N F2 1797-6.6 17 Volvi 677 6.4 40.65 23.46 22 12 0.61 286 37 -84 N F2 1829-6.7
18 N. Marmara 740 7.5 40.90 28.13 133 17 3.24 89 90 177 SD F1 1766-6.8, 1556-7.1, 1509-7.2, 740-7.4
8
N Name Year M Lat Lon L (km)
w (km)
u (m) ξ δ λ T F Completeness
19 Iznik 1065 7.1 40.43 29.84 77 14 1.73 77 90 177 SD F1 1766-6.6, 1719-6.7 20 Veroea 1211 6.4 40.51 22.38 22 12 0.61 271 45 -94 N F2 C 21 Dyrrachio 1273 6.8 41.28 19.50 35 16 1.19 334 27 93 TC F2 C
22 Kastelorizo 1303 7.7 36.12 29.26 111 57 2.33 294 27 99 TS F3 1741-6.8, 1609-7.2, 1481-7.3, 1303-7.4
23 Elbasan 1380 6.0 41.13 19.91 14 10 0.32 331 27 93 TC F2 1833-6.6 24 Edessa 1395 6.7 40.92 22.34 31 15 1.01 56 45 -84 N F2 C 25 Xylokastro 1402 6.8 38.10 22.60 35 16 1.19 295 30 -79 N F2 C 26 Eretria 1417 6.4 38.39 23.83 22 12 0.61 93 40 -90 N F2 C 27 Hydra 1457 6.3 37.35 23.45 19 12 0.52 243 48 -78 N F2 C 28 Hierapetra 1508 7.2 35.15 25.70 55 21 2.31 10 47 -98 N F2 C 29 Meteora 1544 6.4 39.70 21.60 22 12 0.61 90 30 -90 N F2 C 30 Lamia 1545 6.8 38.89 22.17 35 16 1.19 283 47 -88 N F2 1794-6.6 31 Agrafa 1566 6.4 39.10 21.65 22 12 0.61 76 50 -82 N F2 1817-6.6 32 Kasteli 1595 6.4 35.16 25.35 22 12 0.61 190 47 -98 N F2 C
33 Zante 1633 7.0 37.58 20.53 46 35 0.83 310 18 118 TS F3 1767-6.6, 1752-6.7, 1636-7.1, 1469-7.2
34 Kyustendil 1641 6.7 42.33 22.73 31 15 1.01 256 53 -93 N F2 C 35 Chania 1646 6.0 35.32 24.25 14 10 0.32 313 47 -98 N F2 C 36 Pinias 1661 6.2 39.59 22.16 17 11 0.44 69 43 -90 N F2 C 37 Dubrovnic 1667 7.2 42.50 18.30 55 21 2.31 310 29 85 TC F2 C
38 Tenedos 1672 7.0 39.69 25.84 68 13 1.48 260 90 177 SD F1 1809-6.6, 1756-6.7, 1737-6.8, 1672-7.0
39 Corfu 1674 6.5 39.37 20.15 25 13 0.72 294 43 90 TC F2 1820-6.6, 1786-6.7, 1769-6.8 40 Izmir 1688 6.8 38.38 27.05 35 16 1.19 256 45 -115 N F2 C 41 Arkadople 1689 6.6 41.37 27.04 28 14 0.86 90 53 -93 N F2 C 42 Tepeleni 1701 6.4 40.30 20.06 22 12 0.61 339 27 93 TC F2 C 43 Denizli 1702 7.0 37.79 28.96 44 18 1.66 292 42 -99 N F2 C 44 Parnitha 1705 6.3 38.16 23.55 19 12 0.52 119 57 -80 N F2 C 45 Berat 1713 6.6 40.79 19.80 28 14 0.86 357 27 93 TC F2 C 46 Melos 1733 6.8 36.90 24.70 35 16 1.19 250 45 -90 N F2 C 47 Trikala 1735 6.4 39.56 21.84 22 12 0.61 89 43 -90 N F2 C
48 Etili 1737 7.2 39.90 26.72 89 15 2.02 243 90 177 SD F1 1809-6.6, 1766-6.9, 1737-7.0, 1659-7.2, 1354-7.4
49 Foca 1739 6.8 38.63 26.98 35 16 1.19 84 45 -115 N F2 C
50 Paxoi 1743 7.1 39.16 20.03 49 19 1.96 310 43 90 TC F2 1809-6.6, 1786-6.7, 1769-6.8, 1743-7.0
51 Cythera 1750 7.2 35.98 23.01 55 21 2.31 158 50 -80 N F2 1798-6.8, 1750-7.1, 1494-7.5 52 Didymotecho 1752 7.4 41.20 26.20 116 16 2.77 54 90 177 SD F1 C 53 Anthemous 1759 6.5 40.49 22.99 25 13 0.72 278 53 -93 N F2 C 54 Elassona 1766 6.1 39.81 22.34 15 10 0.37 109 47 -87 N F2 C 55 Nafpaktos 1769 6.8 38.39 21.94 35 16 1.19 85 40 -125 N F2 1817-6.6 56 Argos 1769 6.4 37.50 23.09 22 12 0.61 266 48 -78 N F2 C
57 Lefkada 1769 6.7 38.70 20.55 45 11 0.92 30 77 178 SD F1 1786-6.6, 1767-6.7, 1723-6.9, 1636-7.1, 1469-7.2
58 Ladonas 1783 6.1 37.66 21.83 20 8 0.36 37 89 176 SD F1 1791-6.6, 1769-6.8, 1752-7.0 59 Komotini 1784 6.7 41.13 25.44 31 15 1.01 90 53 -93 N F2 1752-6.6, 1719-6.8 60 Patra 1804 6.4 38.20 21.70 30 10 0.58 37 89 176 SD F1 1820-6.6 61 Kastoria 1812 6.5 40.50 21.40 25 13 0.72 160 49 -87 N F2 C 62 Sofia 1818 7.2 42.81 23.42 55 21 2.31 110 53 -93 N F2 C
63 Kyllini 1820 6.9 37.83 21.17 59 13 1.26 37 89 176 SD F1 1767-6.6, 1752-6.7, 1723-6.9, 1658-7.0, 1636-7.1, 1469-7.2
64 Preveza 1826 6.2 39.00 20.60 17 11 0.44 340 43 113 TC F2 1786-6.6, 1767-6.7, 1743-6.9, 1469-7.2
65 Drama 1829 7.3 41.21 24.12 62 22 2.73 90 53 -93 N F2 C 66 Epidavros 1837 6.3 37.50 23.37 19 12 0.52 275 43 -100 N F2 C 67 Messini 1846 6.6 37.13 21.93 28 14 0.86 358 47 -98 N F2 C 68 Fier 1851 6.8 40.80 19.56 35 16 1.19 353 27 93 TC F2 C 69 Gravia 1852 6.0 38.68 22.32 14 10 0.32 281 47 -88 N F2 1817-6.6, 1794-6.7 70 Thebe 1853 6.5 38.24 23.30 25 13 0.72 256 40 -90 N F2 C
9
N Name Year M Lat Lon L (km)
w (km)
u (m) ξ δ λ T F Completeness
71 Egoumenitsa 1854 6.5 39.65 20.12 25 13 0.72 300 43 90 TC F2 1786-6.8 72 Bursa 1855 7.4 40.18 29.08 69 24 3.22 83 45 -90 N F2 1766-6.7, 1719-6.9, 1509-7.2 73 Corinth 1858 6.5 37.81 22.94 25 13 0.72 255 43 -100 N F2 1817-6.6 74 Saros 1859 6.9 40.32 25.97 59 13 1.26 75 55 -145 SD F1 1672-6.6, 1471-7.0, 1354-7.1 75 Lemnos 1864 7.3 40.16 25.24 102 15 2.37 253 88 -170 SD F1 1776-6.6, 1765-6.7 76 Vlora 1866 6.6 40.34 19.45 28 14 0.86 320 27 93 TC F2 C
77 Cephalonia 1867 7.4 38.20 20.20 116 16 2.77 40 57 172 SD F1 1786-6.6, 1767-6.7, 1752-6.8, 1723-7.1, 1469-7.2
78 Lesvos 1867 7.0 39.20 26.25 68 13 1.48 45 89 -172 SD F1 1809-6.6, 1739-6.8 79 Gythio 1867 6.8 36.73 22.53 35 16 1.19 346 47 -98 N F2 1798-6.9 80 Alonessos 1868 6.3 39.26 23.86 26 9 0.49 40 77 175 SD F1 C 81 Symi 1869 6.8 36.36 27.63 35 16 1.19 250 48 -78 N F2 C 82 Marmaris 1869 6.8 37.03 28.11 35 16 1.19 80 42 -99 N F2 1653-7.1, 1513-7.2 83 Delfoi 1870 6.8 38.50 22.54 35 16 1.19 91 40 -90 N F2 1817-6.6 84 N. Chios 1881 6.5 38.29 26.20 25 13 0.72 82 45 -115 N F2 C 85 Urla 1883 6.8 38.33 26.61 35 16 1.19 266 45 -115 N F2 C 86 Filiatra 1886 7.3 36.78 21.40 67 43 1.29 320 32 106 TS F3 1811-6.8 87 Psara 1890 6.2 38.49 25.46 23 9 0.42 229 84 -153 SD F1 C 88 Kythnos 1891 6.4 37.42 24.18 22 12 0.61 80 48 -78 N F2 C 89 Efessos 1893 6.6 37.99 27.45 28 14 0.86 244 45 -115 N F2 C 90 Chimara 1893 6.6 40.20 19.43 28 14 0.86 309 27 93 TC F2 C 91 Atalanti 1894 7.0 38.57 23.25 44 18 1.66 294 50 -70 N F2 C
92 Cimanzic 1894 7.2 40.84 29.05 89 15 2.02 110 70 -155 SD F1 1766-6.6, 1719-6.7, 1509-7.1, 1343-7.2, 740-7.4
93 Paramythia 1895 6.3 39.41 20.56 19 12 0.52 337 43 113 TC F2 1825-6.6 94 Jannina 1898 6.3 39.64 20.59 19 12 0.52 332 43 113 TC F2 1820-6.7 95 Sohos 1902 6.5 40.83 23.21 25 13 0.72 90 53 -93 N F2 C 96 Kresna 1904 7.3 41.89 22.88 62 22 2.73 266 53 -93 N F2 1818-6.7 97 Samos 1904 6.8 37.71 26.87 35 16 1.19 91 45 -115 N F2 C 98 Keramidi 1905 6.4 39.58 23.04 22 12 0.61 327 50 -82 N F2 C 99 Athos 1905 7.5 39.75 24.38 133 17 3.24 225 89 -172 SD F1 C 100 Stravo Trough 1910 6.0 34.27 26.67 13 17 0.19 291 47 99 TS F3 C 101 Ochrid 1911 6.7 41.02 20.79 31 15 1.01 179 49 -87 N F2 C
102 Ganos 1912 7.6 40.65 26.98 153 18 3.78 245 80 165 SD F1 1826-6.6, 1766-6.7, 1752-6.8, 1737-6.9, 1659-7.1, 1354-7.4
103 Santorini 1919 6.1 36.53 25.52 15 10 0.37 50 40 -90 N F2 C 104 Bergama-a 1919 7.0 39.22 27.29 44 18 1.66 61 45 -115 N F2 1809-6.8 105 Erseke 1919 6.3 40.33 20.71 19 12 0.52 196 49 -87 N F2 1812-6.7 106 Stravo sea Mt. 1922 6.3 35.23 27.83 19 21 0.30 303 25 90 TS F3 1513-7.2 107 Zakros 1922 6.8 35.16 26.49 35 16 1.19 14 47 -98 N F2 C 108 Valta 1923 6.4 39.91 23.52 22 12 0.61 102 53 -93 N F2 1776-6.8 109 Mani 1927 7.1 36.68 22.34 49 19 1.96 164 44 -79 N F2 1750-7.1 110 Plovdiv 1928 7.0 42.05 25.00 44 18 1.66 270 37 -84 N F2 C 111 Emet 1928 6.2 39.49 29.48 17 11 0.44 281 43 -94 N F2 C 112 Valadovo 1931 6.7 41.30 22.50 31 15 1.01 273 53 -93 N F2 C 113 Ierissos 1932 7.0 40.53 23.97 44 18 1.66 93 53 -93 N F2 C 114 Bergama-b 1939 6.6 38.98 26.93 28 14 0.86 31 45 -115 N F2 1772-6.6, 1739-6.8 115 Larissa 1941 6.3 39.61 22.42 19 12 0.52 291 47 -88 N F2 C 116 Bigadik 1942 6.2 39.25 28.14 17 11 0.44 287 45 -115 N F2 C 117 Edremit 1944 6.9 39.49 26.46 39 17 1.41 74 46 -114 N F2 1809-6.6, 1737-6.7, 1672-6.9 118 Karpathos 1948 7.1 35.76 27.05 49 19 1.96 185 47 -98 N F2 C 119 N. Chios 1949 6.7 38.65 26.10 31 15 1.01 261 45 -115 N F2 C 120 Ptolemy Mt 1952 7.0 34.35 24.41 46 35 0.83 305 29 105 TS F3 C
121 Yenise 1953 7.4 39.86 27.30 116 16 2.77 233 70 -160 SD F1 1809-6.6, 1766-6.7, 1737-7.1, 1659-7.2, 1354-7.4
122 Katouna 1953 6.3 38.80 21.10 19 12 0.52 195 60 135 TC F2 1743-6.6, 1723-6.7, 1658-6.9, 1636-7.0, 1469-7.1
123 Sofades 1954 7.0 39.24 22.24 44 18 1.66 271 47 -88 N F2 C 124 W. Buyuk 1955 6.9 37.63 27.21 39 17 1.41 73 45 -115 N F2 C
10
N Name Year M Lat Lon L (km)
w (km)
u (m) ξ δ λ T F Completeness
125 Amorgos 1956 7.5 36.73 25.99 78 25 3.80 65 40 -90 N F2 C 126 Dionysades 1956 6.0 35.60 25.97 14 10 0.32 10 47 -98 N F2 C 127 Farsala 1957 6.8 39.30 22.54 35 16 1.19 269 47 -88 N F2 C 128 Pitsidia 1959 6.3 35.01 24.82 19 12 0.52 193 44 -79 N F2 C 129 Koritsa 1960 6.5 40.68 20.79 25 13 0.72 185 49 -87 N F2 C
130 Manyas 1964 6.9 40.06 28.02 39 17 1.41 287 46 -95 N F2 1659-7.0, 1556-7.1, 1509-7.2, 740-7.4
131 Megalopole 1965 6.1 37.33 22.00 20 8 0.36 245 57 159 SD F1 1820-6.6 132 Arta 1967 6.4 39.43 21.23 22 12 0.61 11 49 -87 N F2 1820-6.6 133 Peshkope 1967 6.3 41.46 20.56 19 12 0.52 161 49 -87 N F2 C 134 Ag. Efstratios 1968 7.1 39.41 24.92 77 14 1.73 216 86 145 SD F1 C 135 Demirci 1969 6.1 39.18 28.69 15 10 0.37 104 34 -90 N F2 C 136 Alasehir 1969 6.6 38.34 28.50 28 14 0.86 313 34 -90 N F2 C 137 Gediz 1970 7.1 39.15 29.60 49 19 1.96 312 35 -90 N F2 C 138 Stivos 1978 6.5 40.67 23.21 25 13 0.72 275 46 -70 N F2 1829-6.7 139 Shkodra 1979 7.1 42.04 19.05 49 19 1.96 325 29 85 TC F2 1667-7.2 140 N. Aghialos 1980 6.5 39.29 22.96 25 13 0.72 82 43 -90 N F2 C 141 Peraxora 1981 6.7 38.07 23.06 31 15 1.01 253 44 -84 N F2 C 142 East of Skyros 1981 7.2 38.98 25.11 89 15 2.02 40 67 -166 SD F1 C 143 Torbali-b 1992 6.2 38.06 27.01 23 9 0.42 238 85 -167 SD F1 C 144 Bitola 1994 6.1 41.30 21.32 15 10 0.37 343 49 -87 N F2 C 145 Kozani 1995 6.6 40.07 21.75 28 14 0.86 237 45 -101 N F2 C 146 Katavia 1996 6.2 35.83 27.56 17 11 0.44 184 47 -98 N F2 C 147 Tainaro 1997 6.4 36.19 22.05 21 23 0.34 320 32 106 TS F3 1798-6.8, 1750-7.1 148 Izmit 1999 7.5 40.70 30.00 133 17 3.24 91 76 179 SD F1 1766-6.6, 1719-6.8 149 N. Skyros 2001 6.4 39.00 24.30 30 10 0.58 238 85 -161 SD F1 C 150 SW of Crete 2004 6.0 34.66 23.39 17 8 0.31 172 87 10 SS F1 C 151 Andravida 2008 6.3 37.96 21.52 26 9 0.49 29 89 -178 SD F1 1820-6.6, 1811-6.7, 1766-7.1 152 NE Peloponnes. 1898 7.0 38.10 22.40 - - - 128 62 118 - - C 153 Cythera 1903 7.2 35.90 22.60 - - - 61 70 144 - - C 154 Crete 1856 7.7 35.00 24.70 - - - 37 47 146 - - C 155 Rhodes 1926 7.6 36.40 28.00 - - - 80 65 77 - - C
8. Conclusions The present work aimed at facilitating seismic hazard studies by proposing a methodology of identification of focal regions. Such a region includes the main fault where the largest mainshock occurs, and smaller faults where smaller mainshocks also occur. These focal regions can be considered as spatial clusters of earthquakes. Clustering is usually attributed to foreshocks and mainly to aftershocks but even if these shocks are omitted from the data clustering still prevails, because spatial clustering occurs not only in the rupture zone of a mainshock but also in a broader area where other mainshocks occur.
The proposed methodology is applied in the Aegean area where 155 focal regions and their respective main faults were identified. This number of focal regions can be compared to that of Papazachos et al. (2001) who, using a large amount of seismological (distribution of epicentres, macroseismic information, focal mechanisms) and geological data (surface fault traces, stratigraphic and geomorphological data), determined the properties of 160 faults where the known major (M≥6.0) shallow earthquakes have occurred in the Aegean area. Fault dimensions and maximum slip were determined by appropriate global relations for each kind of faulting. We found that the lengths of thrust and normal faults are smaller than the lengths proposed by Papazachos et al. (2001) for the same faults whereas strike-slip faults are larger. The earthquakes within each focal region were declustered in time, in order to identify the mainshocks of the region. It is found that the mainshocks exhibit quasi-periodic behaviour when the preshock and postshock time periods are both equal to 8.5 years. Regarding the completeness of the historical part of the earthquake catalogue used we found that this catalogue is complete since 1845 for mainshocks with M≥6.5 in the whole Aegean area. In many focal regions, however, completeness for earthquakes with magnitudes larger than 6.5 are extended further back in time.
11
9. References Aki, K. (1966). Generation and propagation of G waves from the Niigata earthquake of June 16, 1964.
Bull. Earthq. Res. Inst. Tokyo Univ., 44, 23-88. Bonilla, M.G., Mark R.K. and Lienkaemper, J.J. (1984). Statistical relations among earthquake
magnitude, surface rupture length and surface fault displacement. Bull. Seismol. Soc. Am., 74, 2379–2411.
Kanamori H. and Anderson D.C. (1975). Theoretical basis of some empirical relations in seismology. Bull. Seism. Soc. Am., 65, 1073-1096.
Kagan, Y.Y. and Jackson, D.D. (1991). Long-term earthquake clustering. Geophys. J. Int., 104, 117-133.
Papazachos, B.C., Mountrakis, D.M., Papazachos, C.B., Tranos, M.D., Karakaisis, G.F. and Savvaidis, A.S., (2001). The faults which have caused the known major earthquakes in Greece and surrounding region between the 5th century BC and today. 2nd Greek Conference on Earthquake Engineering and Engineering Seismology, Thessaloniki, 28-30 September 2001, 1, 17-26.
Papazachos, B.C., Scordilis, E.M., Panagiotopoulos, D.G., Papazachos, C.B. and Karakaisis, G.F. (2004). Global relations between seismic fault parameters and moment magnitude of earthquakes. Bull. Geol. Soc. Greece, 36, 1482-1489.
Papazachos, B.C. and Papazachou, C.B., (2003). The earthquakes of Greece, “Ziti Publications, Thessaloniki”, 273pp.
Papazachos, B.C., Comninakis, P.E., Scordilis, E.M., Karakaisis, G.F. and Papazachos, C.B., (2009). A catalogue of earthquakes in Mediterranean and surrounding area for the period 1901-2008, Publ. Geoph. Laboratory, University of Thessaloniki.
Papazachos, C.B. and Kiratzi, A.A. (1992). A formulation for reliable estimation of active crustal deformation and an application to central Greece. Geophys. J. Int., 111, 424-432.
Reid, H.F. (1911). The elastic-rebound theory of earthquakes. Bull. Dep. Geol. Univ. Calif., 6, 412-444. Schwartz, D.P. and Coppersmith K.J. (1984). Fault behavior and characteristic earthquake: Examples
from the Wasatch and San Andreas fault zones. J. Geophys. Res., 89, 5681-5698. Smith G.C. and Stock Ch. (2000). Evidence for different scaling of earthquake source parameters for
large earthquakes depending on faulting mechanism. Geophys. J. Int., 143, 157-169. Wells D.L. and Coppersmith K.J. (1994). New empirical relationships among magnitude, rupture
length, rupture width, rupture area and surface displacement. Bull. Seism. Soc. Am., 84, 974-1002.
Wesnousky S.G. (1986). Earthquake, quaternary faults and seismic hazard in California. J. Geophys. Res., 91, 12587-12631.
Acknowledgements
Valuable and stimulating discussions with Emeritus Professor Basil. C. Papazachos are greatly acknowledged. Review by Dimitris Papanastassiou improved the manuscript.