π-Extended Thiadiazoles Fused with Thienopyrrole or Indole ...
44
SI 1 The Journal of Organic Chemistry Supporting Information π-Extended Thiadiazoles Fused with Thienopyrrole or Indole Moieties: Synthesis, Structures, and Properties Shin-ichiro Kato, [a] Takayuki Furuya, [a] Atsushi Kobayashi, [a] Masashi Nitani, [b] Yutaka Ie, [b,c] Yoshio Aso, [b] Toshitada Yoshihara, [a] Seiji Tobita, [a] and Yosuke Nakamura* [a] [a] Department of Chemistry and Chemical Biology, Graduate School of Engineering, Gunma University, 1-5-1, Tenjin-cho, Kiryu, Gunma 376-8515, Japan, [b] The Institute of Scientific and Industrial Research (ISIR), Osaka University, 8-1, Mihogaoka, Ibaraki, Osaka 567-0047, Japan, [c] PRESTO-JST, 4-1-8 Honcho, Kawaguchi, Saitama 333-0012, Japan E-mail: [email protected] Tel: +81-277-30-1310 Fax: +81-277-30-1314
Transcript of π-Extended Thiadiazoles Fused with Thienopyrrole or Indole ...
SI 1
The Journal of Organic Chemistry
Supporting Information
π-Extended Thiadiazoles Fused with Thienopyrrole or
Indole Moieties: Synthesis, Structures, and Properties
Shin-ichiro Kato,[a]
Takayuki Furuya,[a]
Atsushi Kobayashi,[a]
Masashi Nitani,[b]
Yutaka Ie,[b,c]
Yoshio Aso,[b]
Toshitada Yoshihara,[a]
Seiji Tobita,[a]
and Yosuke Nakamura*[a]
[a] Department of Chemistry and Chemical Biology, Graduate School of
Engineering, Gunma University, 1-5-1, Tenjin-cho, Kiryu, Gunma 376-8515,
Japan, [b]
The Institute of Scientific and Industrial Research (ISIR), Osaka
University, 8-1, Mihogaoka, Ibaraki, Osaka 567-0047, Japan, [c]
PRESTO-JST,
4-1-8 Honcho, Kawaguchi, Saitama 333-0012, Japan
E-mail: [email protected]
Tel: +81-277-30-1310
Fax: +81-277-30-1314
SI 2
Table of Contents
1. General Experimental Methods (SI 3)
2. X-ray Data for Compounds 1a, 1b, 2b, 4a, and 5b (SI 4–SI 6)
3. UV‒vis and Fluorescence Data (SI 6–SI 15)
4. CV Data (SI 16–SI 17)
5. Theoretical Calculations for 1b‒5b (SI 18–SI 27)
6. Thermal Gravimetric Analysis (SI 28)
7. Reported Synthesis of 1a, 3a, and 4a,
and Attempted Synthesis of Furopyrrole-Fused Derivative (SI 29)
8. NMR Data (SI 30–SI 42)
9. References (SI 43–SI 44)
SI 3
1. General Experimental Methods
THF was freshly distilled from sodium and benzophenone under argon atmosphere. Column
chromatography and plug filtrations were carried out with SiO2. Thin-layer chromatography
(TLC) was conducted on aluminum sheets coated with SiO2; visualization with a lamp (254 or 365
nm). Melting points (M.p.) are uncorrected. 1H NMR spectra were determined in CDCl3 at 298
K. Residual solvent signals in the 1H and
13C NMR spectra were used as an internal reference.
Chemical shifts (δ) are given as δ values. The coupling constants (J) are given in Hz. The
apparent resonance multiplicity is described as s (singlet), d (doublet), t (triplet), q (quartet), and m
(multiplet). FAB-MS spectra were recorded with m-nitrobenzyl alcohol (NBA) as a matrix.
MALDI-TOF-MS spectra were recorded with dithranol (Dith) as a matrix. The most important
signals are reported in m/z units with M as the molecular ion. UV‒vis spectra and fluorescence
spectra were measured in a cuvette of 1 cm at 298 K. The absorption maxima (λmax) are reported
in nm with the relative intensity or the molar absorptivity in brackets. Shoulders are indicated as
sh. Compounds 6,1 7,
2 and 9
3 were prepared according to the literature procedures. Cyclic
voltammetry was performed by using a cell equipped with a platinum as working electrode, a
platinum wire as counter electrodes, and Ag/AgNO3 as the referential electrode. All
electrochemical measurements were performed in o-DCB solution (ca. 5 × 10⁻⁴
M) containing 0.1
M n-Bu4NPF6 at 298 K. All potentials are referenced to the ferrocenium/ferrocene (Fc+/Fc) couple,
used as a standard. Theoretical calculations were performed using the Gaussian 03 program
package.3 Molecular properties in the electronic ground state were computed using the hybrid
B3LYP DFT method.4 Geometry optimization of 1b‒5b was performed with no symmetry
constrains at the 6-31G* basis set.5 Frequency calculations on these optimized geometries
revealed no imaginary frequencies. Further single-point calculations were performed at the
6-311G** basis set6 to obtain the molecular orbital energies with use of optimized structures at the
B3LYP/6-31G* level of theory. TD calculations for 1b‒5b were performed at the B3LYP/6-31G*
level of theory with use of optimized structures at the B3LYP/6-31G* level of theory. The
calculated UV/Vis transitions are vertical.
SI 4
2. X-ray Data for Compounds 1a, 1b, 2b, 4a, and 5b
The X-ray crystal structures were solved by direct methods (SIR-97)7 and refined by full-matrix
least-squares analysis (SHELXL-97),8 using an isotropic extinction correction. All non-hydrogen
atoms were refined anisotropically; hydrogen atoms were refined isotropically, whereby hydrogen
positions are based on stereochemical considerations. CCDC-879807 (1a), CCDC-879808 (1b),
CCDC-879809 (2b), CCDC-879810 (4a), and CCDC-879811 (5b) contain the supplementary
crystallographic data (excluding structure factors) for this paper. These data can be obtained free
of charge from The Cambridge Crystallographic Data Centre, 12 Union Road, Cambridge CB2 1EZ,
UK (fax: +44(1223)-336-033; e-mail: [email protected]), or via www.ccdc.cam.ac.
Uk/data _request/cif
X-ray crystal structure of 1a: Crystal data at 173 K for C14H6N4S3·H2O, Mr = 342.41, Monoclinic,
space group P21/n, Dcalcd = 1.665 g cm–3
, Z = 4, a = 7.744(8) Å, b = 17.07(2) Å, c = 10.665(11) Å, β
= 104.32(2)°, V = 1366(3) Å3; Mo-Kα radiation, λ = 0.71075, μ = 0.548 mm
–1. A yellow crystal
(linear dimensions ca. 0.08 × 0.05 × 0.01 mm) was obtained from acetone/hexane solution at
–15 °C. Numbers of measured and unique reflections were 10772 and 2380, respectively (Rint =
0.069). Final R(F) = 0.060, wR(F2) = 0.158 for 205 parameters and 2380 reflections with I > 2σ(I)
and 2.75 < θ < 24.71° (corresponding R values based are 0.075 and 0.184, respectively, for all data).
X-ray crystal structure of 1b: Crystal data at 123 K for C18H14N4S3, Mr = 382.51, Monoclinic,
space group C2/c, Dcalcd = 1.511 g cm–3
, Z = 4, a = 13.891(3) Å, b = 11.994(3) Å, c = 12.028(3) Å, β
= 122.982(2)°, V = 1680.9(7) Å3; Mo-Kα radiation, λ = 0.71070, μ = 0.450 mm
–1. A yellow
crystal (linear dimensions ca. 0.50 × 0.50 × 0.45 mm) was obtained from CH2Cl2/hexane solution at
–15 °C. Numbers of measured and unique reflections were 3684 and 1415, respectively (Rint =
0.022). Final R(F) = 0.038, wR(F2) = 0.100 for 115 parameters and 1415 reflections with I > 2σ(I)
and 5.41° < θ < 25.00° (corresponding R values based are 0.039 and 0.101, respectively, for all
data).
X-ray crystal structure of 2b: Crystal data at 150 K for C18H14N4S3, Mr = 382.51, Monoclinic,
SI 5
space group P21/n, Dcalcd = 1.508 g cm–3
, Z = 4, a = 7.961(3) Å, b = 9.065(4) Å, c = 23.363(8) Å, β
= 92.484(4)°, V = 1684.4(11) Å3; Mo-Kα radiation, λ = 0.71070, μ = 0.449 mm
–1. A yellow
crystal (linear dimensions ca. 0.20 × 0.20 × 0.15 mm) was obtained from CH2Cl2/hexane solution at
–15 °C. Numbers of measured and unique reflections were 7246 and 2868, respectively (Rint =
0.028). Final R(F) = 0.044, wR(F2) = 0.147 for 228 parameters and 2868 reflections with I > 2σ(I)
and 5.93 < θ < 25.00° (corresponding R values based are 0.047 and 0.152, respectively, for all data).
X-ray crystal structure of 4a: Crystal data at 123 K for C26H26N4S·H2O, Mr = 442.57,
Orthorhombic, space group Fdd2, Dcalcd = 1.282 g cm–3
, Z = 16, a = 19.399(3) Å, b = 73.053(6) Å, c
= 6.4702(7) Å, V = 9169.6(18) Å3; Mo-Kα radiation, λ = 0.71070, μ = 0.167 mm
–1. A pale green
crystal (linear dimensions ca. 0.40 × 0.35 × 0.30 mm) was obtained from acetone/hexane solution at
–15 °C. Numbers of measured and unique reflections were 7654 and 3687, respectively (Rint =
0.024). Final R(F) = 0.035, wR(F2) = 0.010 for 296 parameters and 3687 reflections with I > 2σ(I)
and 5.34 < θ < 24.99° (corresponding R values based are 0.035 and 0.104, respectively, for all data).
X-ray crystal structure of 5b: Crystal data at 173 K for C24H22N4O2S, Mr = 430.52, Orthorhombic,
space group Pna21, Dcalcd = 1.444 g cm–3
, Z = 4, a = 21.1724(11) Å, b = 13.2827(5) Å, c =
7.0396(2) Å, V = 1979.72(14) Å3; Mo-Kα radiation, λ = 0.71070, μ = 0.195 mm
–1. A pale
yellow crystal (linear dimensions ca. 0.40 × 0.30 × 0.10 mm) was obtained from CH2Cl2/hexane
solution at –15 °C. Numbers of measured and unique reflections were 9531 and 3230,
respectively (Rint = 0.012). Final R(F) = 0.026, wR(F2) = 0.071 for 284 parameters and 3230
reflections with I > 2σ(I) and 5.44 < θ < 24.99° (corresponding R values based are 0.026 and 0.071,
respectively, for all data).
SI 6
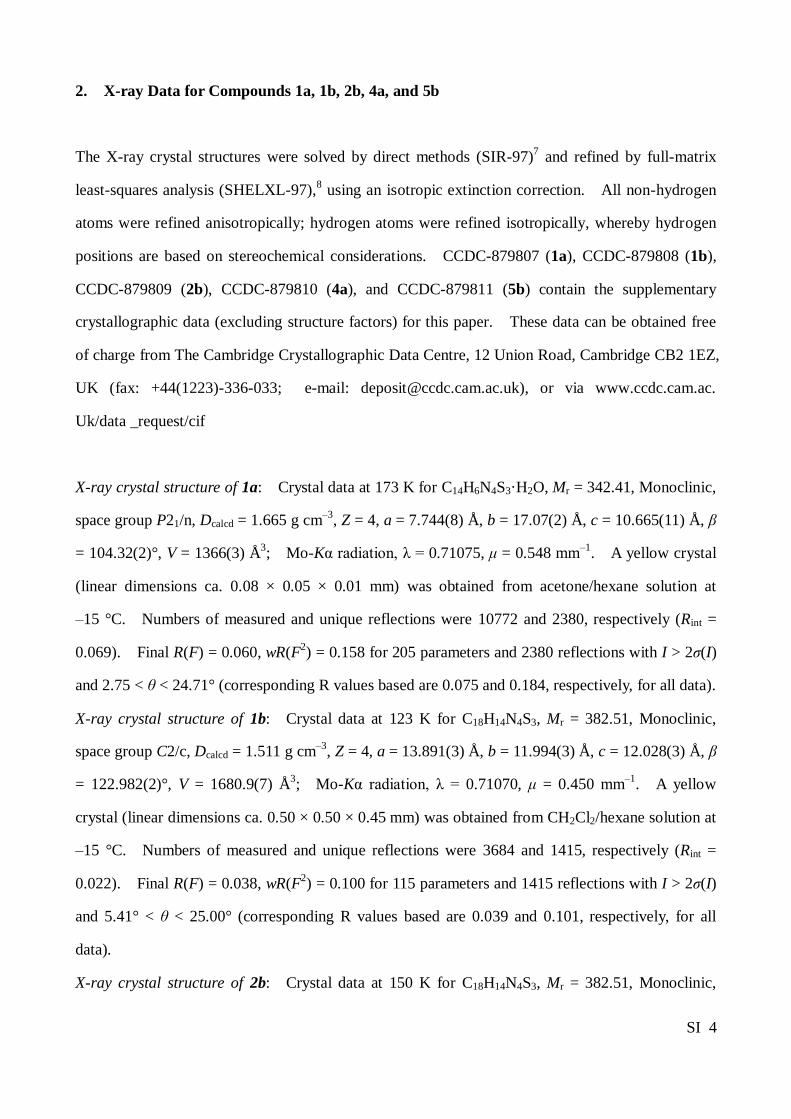
3.49 Å
Figure S1. Packing of 5b in the crystalline state. View perpendicular to the b,c plane. The
offset stacking leads to a brickwork motif.
3. UV‒vis and Fluorescence Data
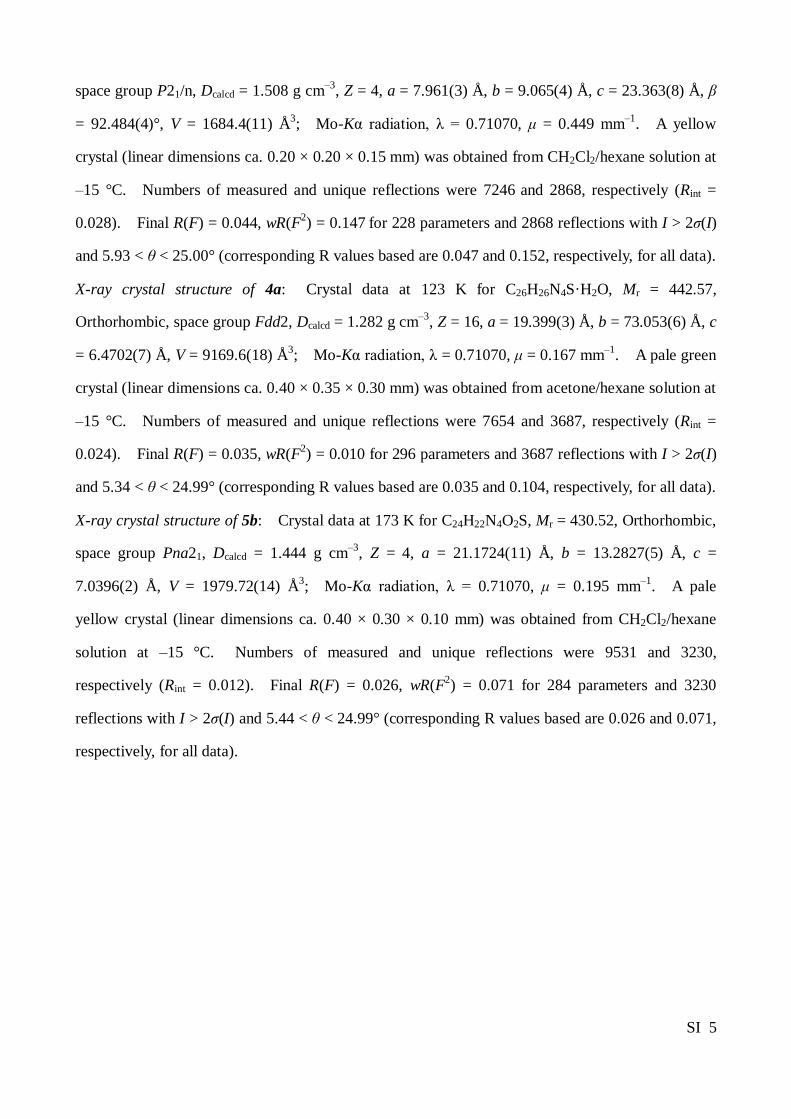
Table S1. Summary of Photophysical Data of 1a‒1c
solv. λmax
[nm (eV)]
λem
[nm]
τf
[ns][a]
Φf kr
[107 s
‒1]
[b]
knr
[107 s
‒1]
[c]
1a toluene 420 (2.95) 509 19.1 0.68 3.6 1.7
THF 424 (2.92) 525 22.6 0.50 2.2 2.2
EtOAc 421 (2.94) 523 23.0 0.51 2.2 2.1
CH2Cl2 423 (2.93) 549 14.4 0.25 1.7 5.2
DMF 432 (2.86) 563 18.9 0.30 1.6 3.7
1b toluene 432 (2.91) 523 19.4 0.73 3.8 1.4
THF 436 (2.85) 539 23.7 0.68 2.9 1.4
EtOAc 433 (2.87) 538 24.2 0.63 2.6 1.5
CH2Cl2 436 (2.85) 565 16.6 0.33 2.0 4.0
DMF 441 (2.82) 573 22.1 0.42 1.9 2.6
1c toluene 432 (2.86) 522 19.1 0.73 3.8 1.4
CH2Cl2 434 (2.85) 559 19.4 0.39 2.0 3.1
[a] Lifetime. [b] Radiative constant. [c] Non-radiative constant.
SI 7
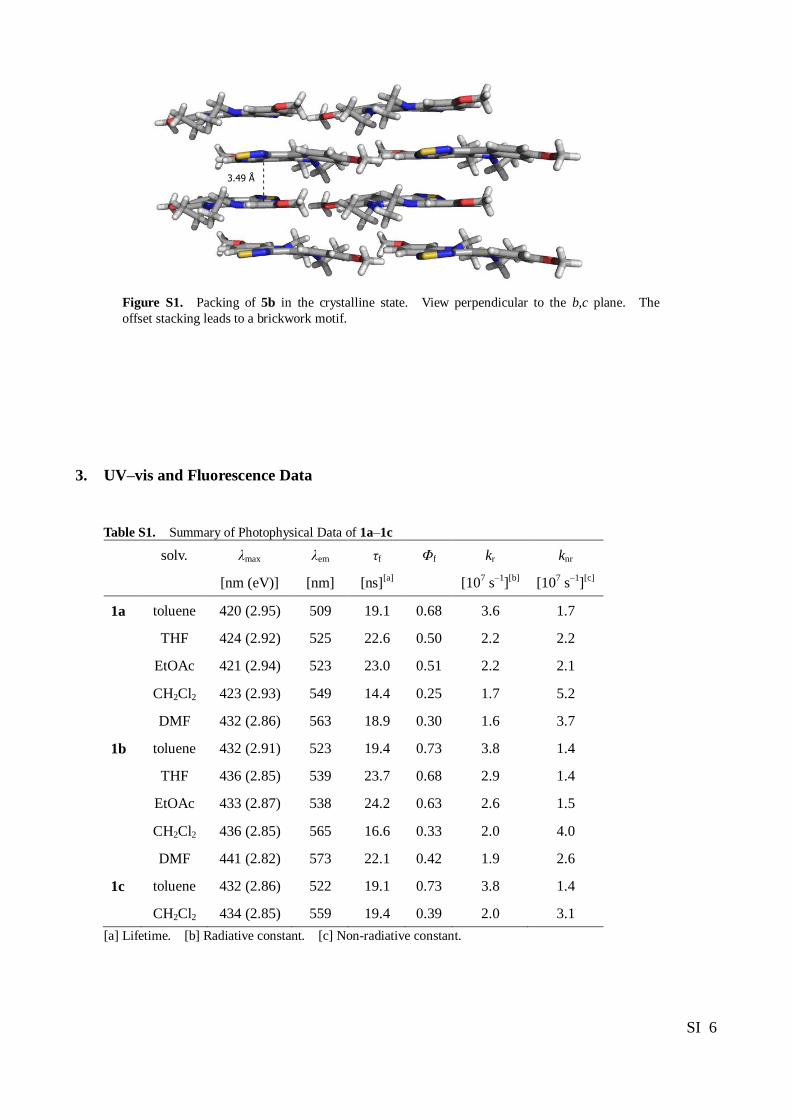
Table S2. Summary of Photophysical Data of 2a‒2c
solv. λmax
[nm (eV)]
λem
[nm]
τf
[ns][a]
Φf kr
[107 s
‒1]
[b]
knr
[107 s
‒1]
[c]
2a toluene 411 (3.01) 496 13.8 0.42 3.1 4.2
THF 420 (2.95) 511 16.2 0.38 2.3 3.8
EtOAc 414 (2.99) 510 16.5 0.34 2.1 4.0
CH2Cl2 415 (2.98) 533 13.2 0.27 2.0 5.5
DMF 423 (2.93) 547 16.0 0.33 2.0 4.1
2b toluene 423 (2.94) 508 13.0 0.45 3.5 4.2
THF 424 (2.93) 521 15.0 0.51 3.4 3.3
EtOAc 422 (2.94) 521 15.6 0.47 3.0 3.4
CH2Cl2 425 (2.92) 548 14.6 0.34 2.3 4.5
DMF 430 (2.89) 552 16.8 0.43 2.5 3.4
2c toluene 424 (2.92) 508 13.5 0.55 4.1 3.4
CH2Cl2 424 (2.92) 541 16.2 0.41 2.5 3.7
[a] Lifetime. [b] Radiative constant. [c] Non-radiative constant.
SI 8
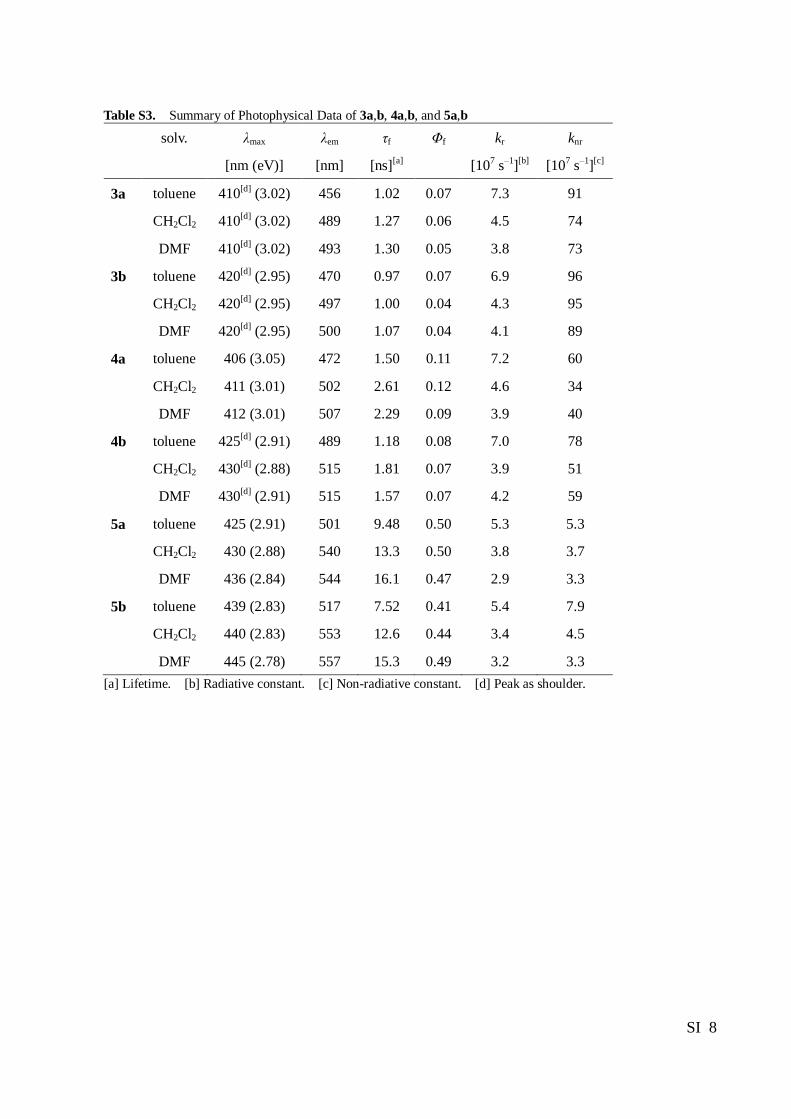
Table S3. Summary of Photophysical Data of 3a,b, 4a,b, and 5a,b
solv. λmax
[nm (eV)]
λem
[nm]
τf
[ns][a]
Φf kr
[107 s
‒1]
[b]
knr
[107 s
‒1]
[c]
3a toluene 410[d]
(3.02) 456 1.02 0.07 7.3 91
CH2Cl2 410[d]
(3.02) 489 1.27 0.06 4.5 74
DMF 410[d]
(3.02) 493 1.30 0.05 3.8 73
3b toluene 420[d]
(2.95) 470 0.97 0.07 6.9 96
CH2Cl2 420[d]
(2.95) 497 1.00 0.04 4.3 95
DMF 420[d]
(2.95) 500 1.07 0.04 4.1 89
4a toluene 406 (3.05) 472 1.50 0.11 7.2 60
CH2Cl2 411 (3.01) 502 2.61 0.12 4.6 34
DMF 412 (3.01) 507 2.29 0.09 3.9 40
4b toluene 425[d]
(2.91) 489 1.18 0.08 7.0 78
CH2Cl2 430[d]
(2.88) 515 1.81 0.07 3.9 51
DMF 430[d]
(2.91) 515 1.57 0.07 4.2 59
5a toluene 425 (2.91) 501 9.48 0.50 5.3 5.3
CH2Cl2 430 (2.88) 540 13.3 0.50 3.8 3.7
DMF 436 (2.84) 544 16.1 0.47 2.9 3.3
5b toluene 439 (2.83) 517 7.52 0.41 5.4 7.9
CH2Cl2 440 (2.83) 553 12.6 0.44 3.4 4.5
DMF 445 (2.78) 557 15.3 0.49 3.2 3.3
[a] Lifetime. [b] Radiative constant. [c] Non-radiative constant. [d] Peak as shoulder.
SI 9
0
5
10
15
20
25
30
35
250 300 350 400 450 500 550 600
e/10
3 c
m-1
M-1
Wavelength/nm
1a
1b
1c
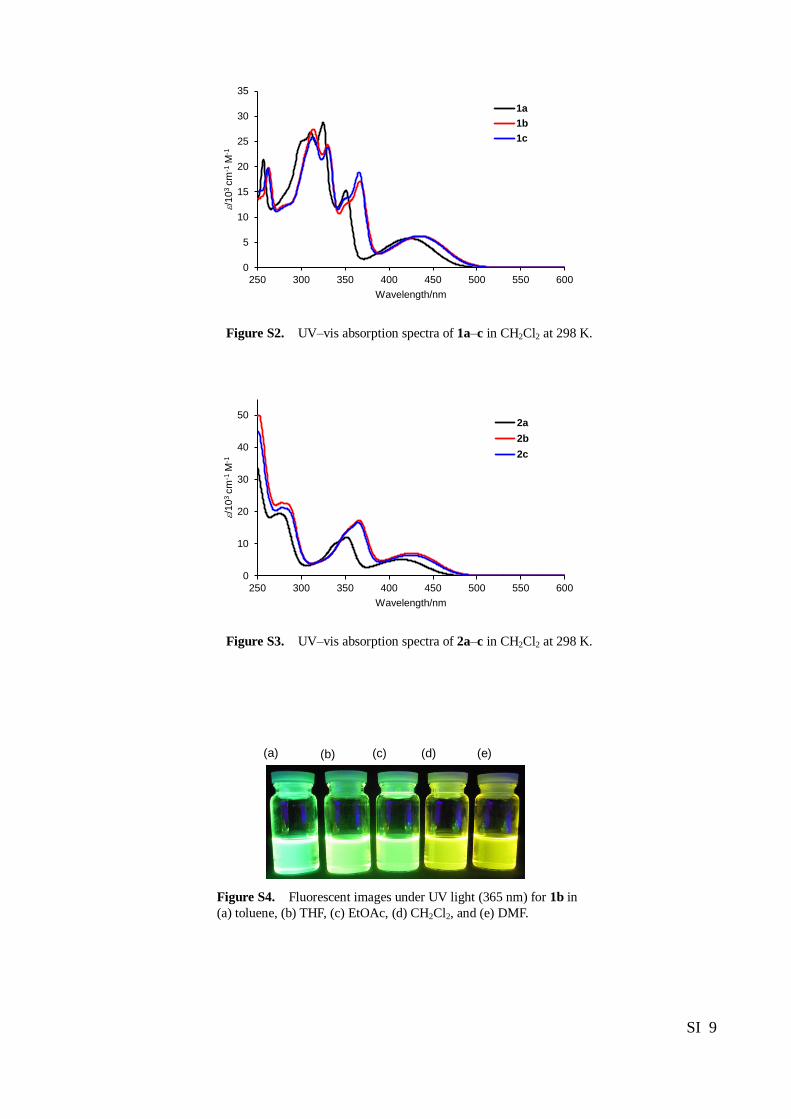
Figure S2. UV‒vis absorption spectra of 1a‒c in CH2Cl2 at 298 K.
0
10
20
30
40
50
250 300 350 400 450 500 550 600
e/10
3 c
m-1
M-1
Wavelength/nm
2a
2b
2c
Figure S3. UV‒vis absorption spectra of 2a‒c in CH2Cl2 at 298 K.
Figure S4. Fluorescent images under UV light (365 nm) for 1b in
(a) toluene, (b) THF, (c) EtOAc, (d) CH2Cl2, and (e) DMF.
(a) (b) (c) (d) (e)
SI 10
400 600 8000
1
0
1
Toluene
THF
EtOAcCH2Cl2DMF
0 100
100
101
102
103
−202
Time (ns)
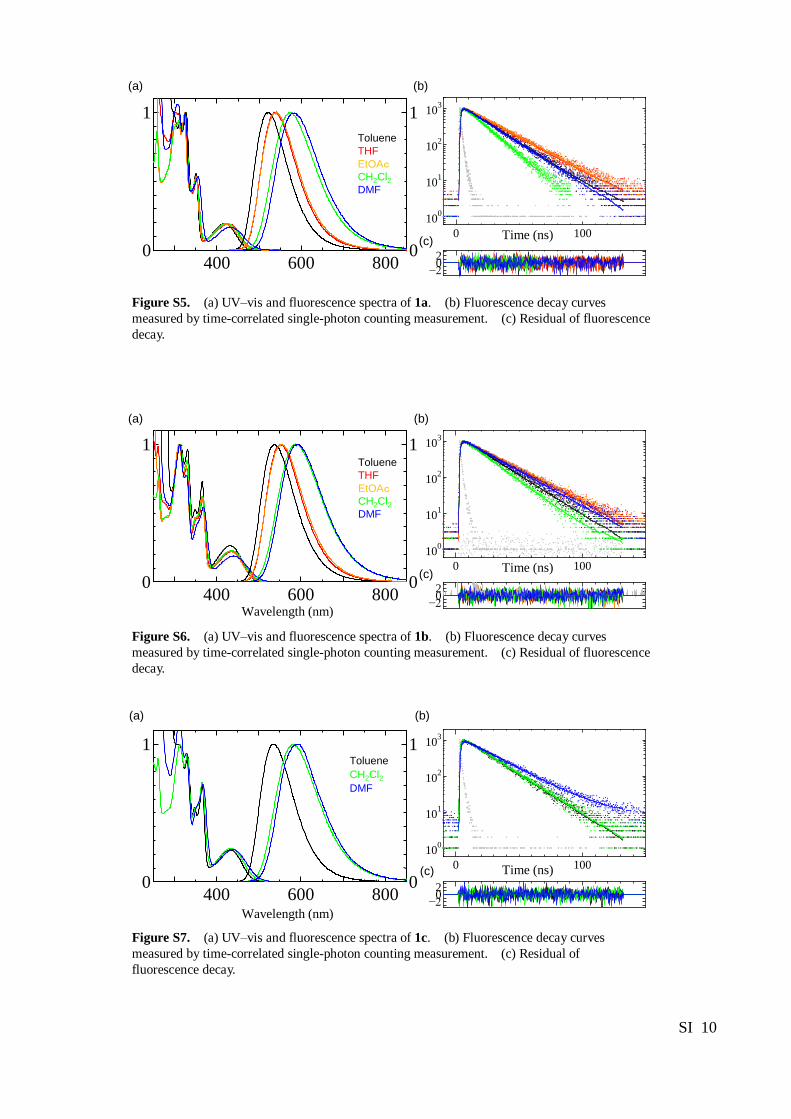
Figure S5. (a) UV‒vis and fluorescence spectra of 1a. (b) Fluorescence decay curves
measured by time-correlated single-photon counting measurement. (c) Residual of fluorescence
decay.
400 600 8000
1
0
1
0 100
100
101
102
103
−202
Toluene
THF
EtOAcCH2Cl2DMF
Time (ns)
Wavelength (nm)
Figure S6. (a) UV‒vis and fluorescence spectra of 1b. (b) Fluorescence decay curves
measured by time-correlated single-photon counting measurement. (c) Residual of fluorescence
decay.
0 100
100
101
102
103
−202
400 600 8000
1
0
1Toluene
CH2Cl2DMF
Time (ns)
Wavelength (nm)
Figure S7. (a) UV‒vis and fluorescence spectra of 1c. (b) Fluorescence decay curves
measured by time-correlated single-photon counting measurement. (c) Residual of
fluorescence decay.
(a) (b)
(c)
(a) (b)
(c)
(a) (b)
(c)
SI 11
400 600 8000
1
0
1
0 50 100
100
101
102
103
−202
Toluene
THF
EtOAcCH2Cl2DMF
Time (ns)
Wavelength (nm)
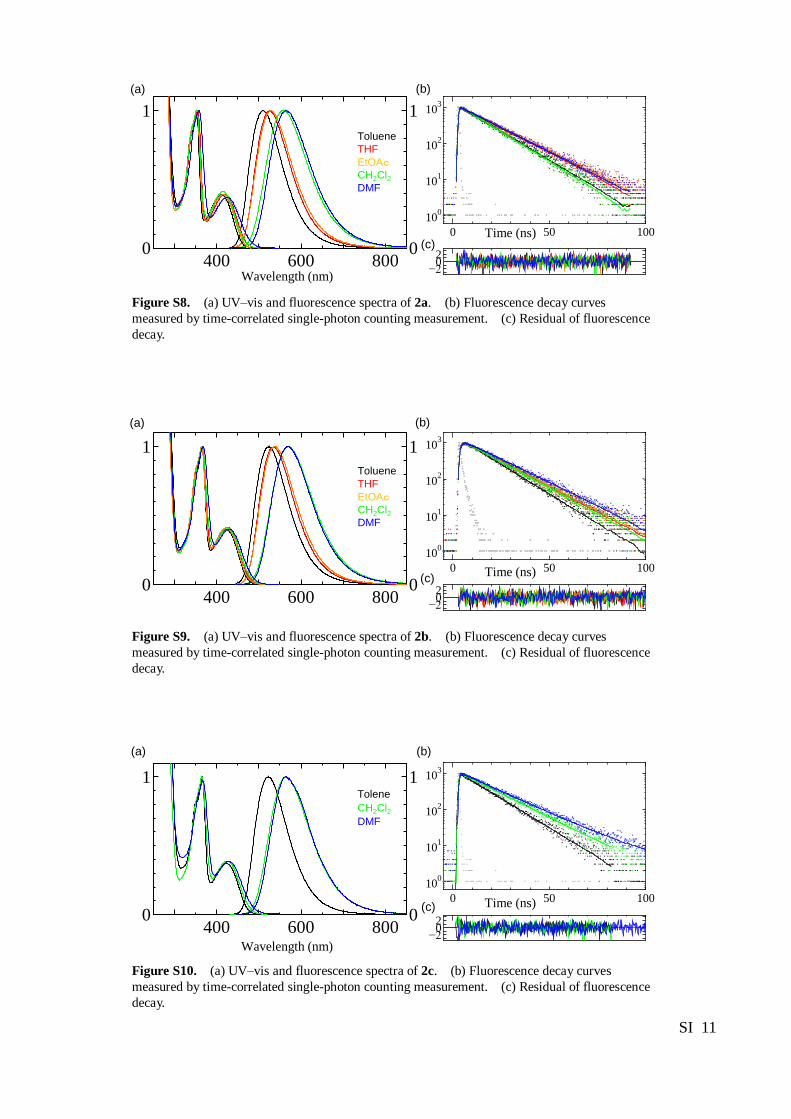
Figure S8. (a) UV‒vis and fluorescence spectra of 2a. (b) Fluorescence decay curves
measured by time-correlated single-photon counting measurement. (c) Residual of fluorescence
decay.
400 600 8000
1
0
1
0 50 100
100
101
102
103
−202
Time (ns)
Toluene
THF
EtOAcCH2Cl2DMF
Figure S9. (a) UV‒vis and fluorescence spectra of 2b. (b) Fluorescence decay curves
measured by time-correlated single-photon counting measurement. (c) Residual of fluorescence
decay.
0 50 100
100
101
102
103
−202
400 600 8000
1
0
1Tolene
CH2Cl2DMF
Time (ns)
Wavelength (nm)
Figure S10. (a) UV‒vis and fluorescence spectra of 2c. (b) Fluorescence decay curves
measured by time-correlated single-photon counting measurement. (c) Residual of fluorescence
decay.
(a) (b)
(c)
(a) (b)
(c)
(a) (b)
(c)
SI 12
0 50 10010
0
101
102
103
−404
400 600 8000
1
0
1
Toluene
CH2Cl2DMF
Time (ns)
Wavelength (nm)
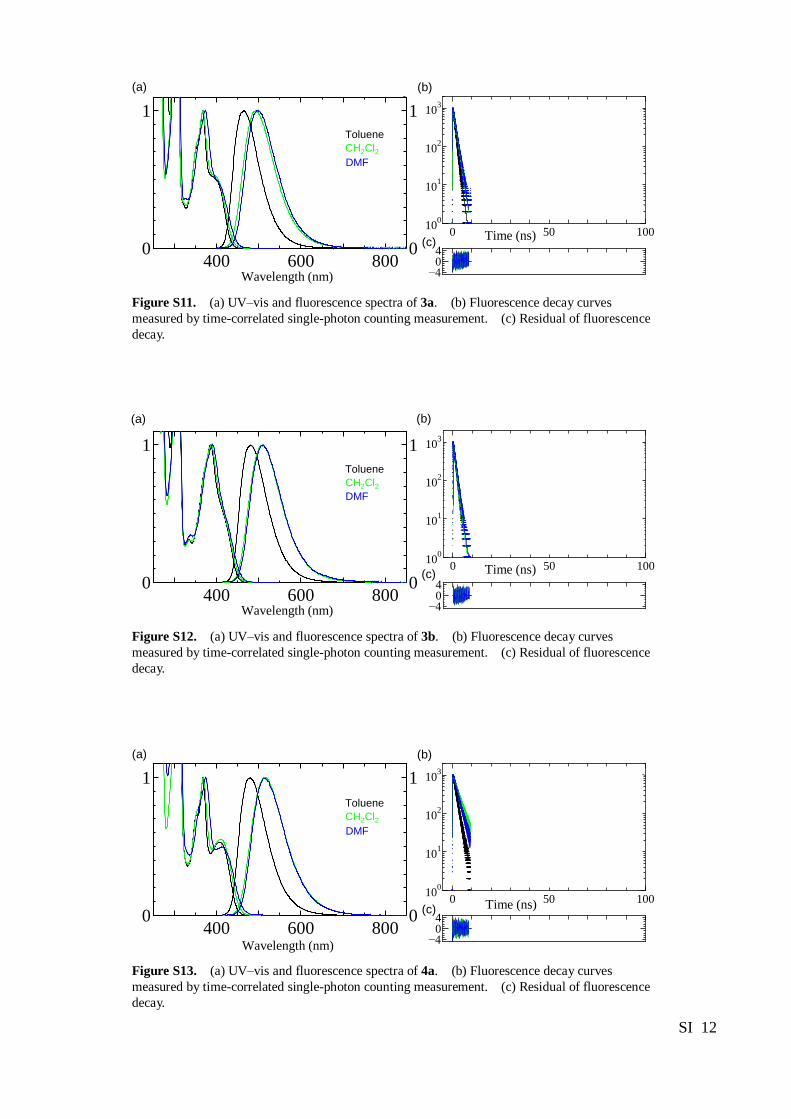
Figure S11. (a) UV‒vis and fluorescence spectra of 3a. (b) Fluorescence decay curves
measured by time-correlated single-photon counting measurement. (c) Residual of fluorescence
decay.
0 50 10010
0
101
102
103
−404
400 600 8000
1
0
1
Toluene
CH2Cl2DMF
Time (ns)
Wavelength (nm)
Figure S12. (a) UV‒vis and fluorescence spectra of 3b. (b) Fluorescence decay curves
measured by time-correlated single-photon counting measurement. (c) Residual of fluorescence
decay.
0 50 10010
0
101
102
103
−404
400 600 8000
1
0
1
Time (ns)
Wavelength (nm)
Toluene
CH2Cl2DMF
Figure S13. (a) UV‒vis and fluorescence spectra of 4a. (b) Fluorescence decay curves
measured by time-correlated single-photon counting measurement. (c) Residual of fluorescence
decay.
(a) (b)
(c)
(a) (b)
(c)
(a) (b)
(c)
SI 13
0 50 10010
0
101
102
103
−404
400 600 8000
1
0
1
Toluene
CH2Cl2DMF
Time (ns)
Wavelength (nm)
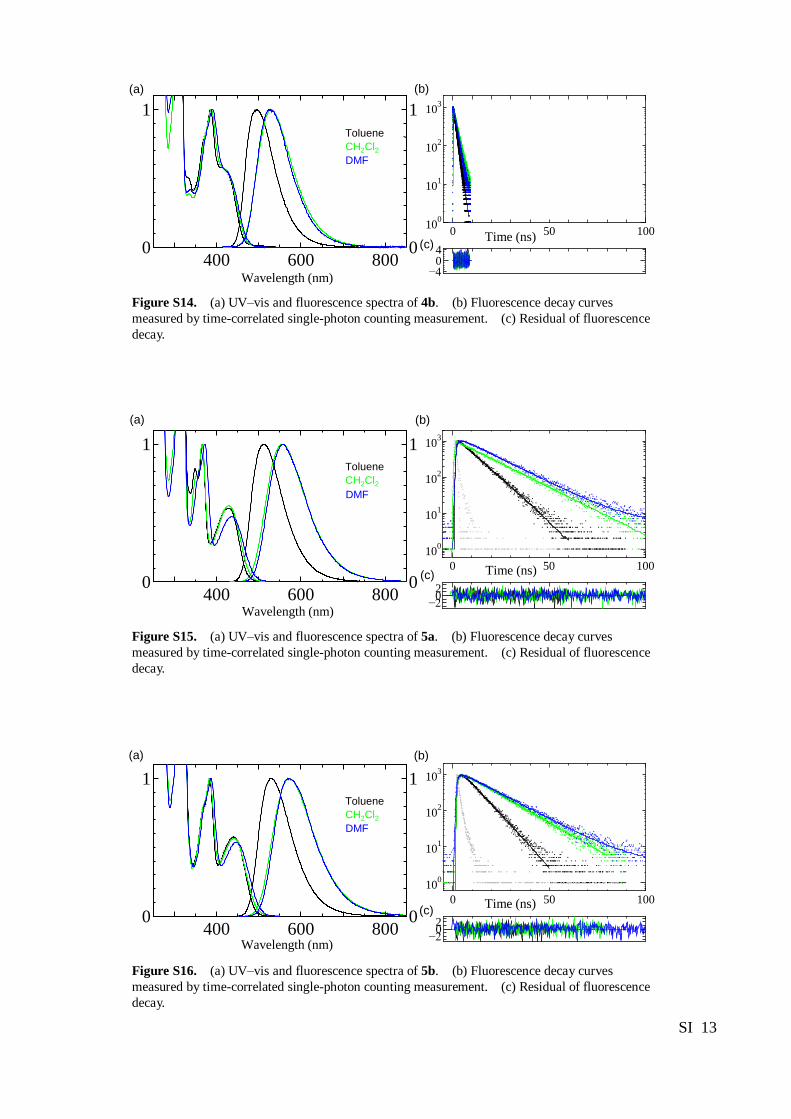
Figure S14. (a) UV‒vis and fluorescence spectra of 4b. (b) Fluorescence decay curves
measured by time-correlated single-photon counting measurement. (c) Residual of fluorescence
decay.
0 50 100
100
101
102
103
−202400 600 800
0
1
0
1
Time (ns)
Wavelength (nm)
Toluene
CH2Cl2DMF
Figure S15. (a) UV‒vis and fluorescence spectra of 5a. (b) Fluorescence decay curves
measured by time-correlated single-photon counting measurement. (c) Residual of fluorescence
decay.
0 50 100
100
101
102
103
−202
400 600 8000
1
0
1Toluene
CH2Cl2DMF
Time (ns)
Wavelength (nm)
Figure S16. (a) UV‒vis and fluorescence spectra of 5b. (b) Fluorescence decay curves
measured by time-correlated single-photon counting measurement. (c) Residual of fluorescence
decay.
(a) (b)
(c)
(a) (b)
(c)
(a) (b)
(c)
SI 14
400 600 8000
0.3
0
1
Wavelength / nm
Ab
so
rba
nce / a
rb. u
nit
Inte
nsity / a
rb. u
nit
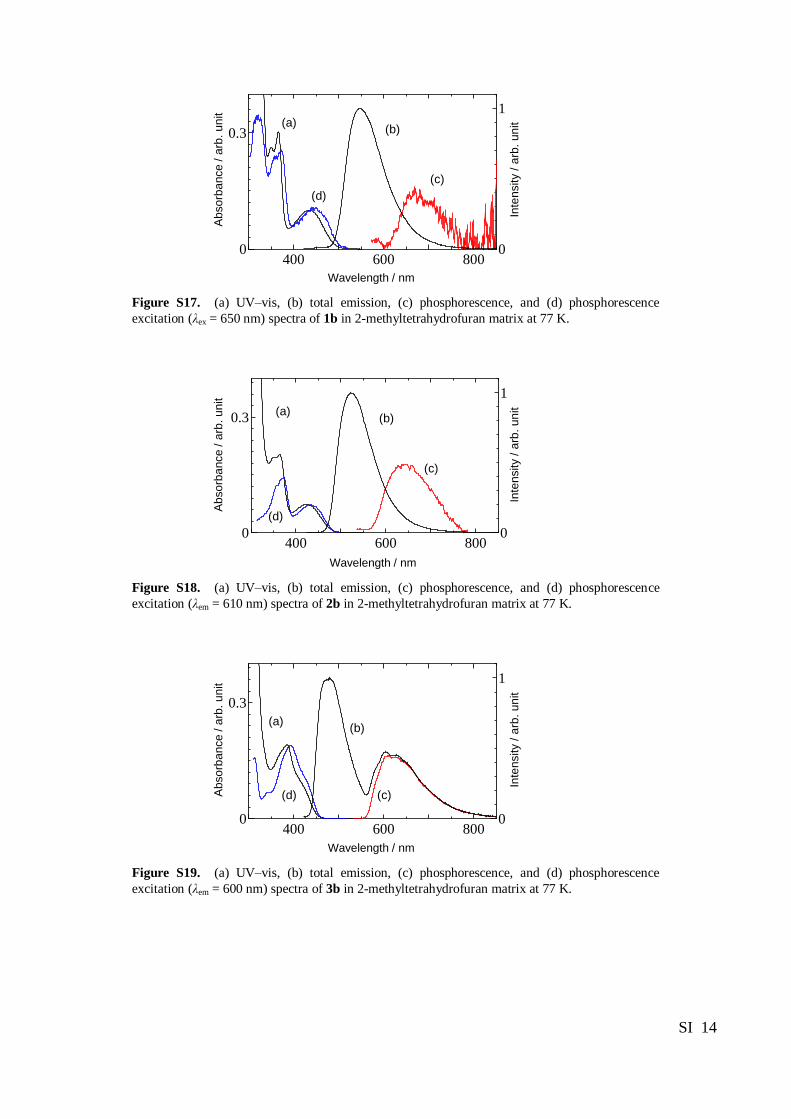
Figure S17. (a) UV‒vis, (b) total emission, (c) phosphorescence, and (d) phosphorescence
excitation (λex = 650 nm) spectra of 1b in 2-methyltetrahydrofuran matrix at 77 K.
400 600 8000
0.3
0
1
Wavelength / nm
Ab
so
rba
nce / a
rb. u
nit
Inte
nsity / a
rb. un
it
Figure S18. (a) UV‒vis, (b) total emission, (c) phosphorescence, and (d) phosphorescence
excitation (λem = 610 nm) spectra of 2b in 2-methyltetrahydrofuran matrix at 77 K.
400 600 8000
0.3
0
1
Wavelength / nm
Ab
so
rba
nce / a
rb. u
nit
Inte
nsity / a
rb. u
nit
Figure S19. (a) UV‒vis, (b) total emission, (c) phosphorescence, and (d) phosphorescence
excitation (λem = 600 nm) spectra of 3b in 2-methyltetrahydrofuran matrix at 77 K.
(a) (b)
(c)
(d)
(a) (b)
(c)
(d)
(a) (b)
(c) (d)
SI 15
400 600 8000
0.3
0
1
Wavelength / nm
Ab
so
rba
nce / a
rb. u
nit
Inte
nsity / a
rb. u
nit
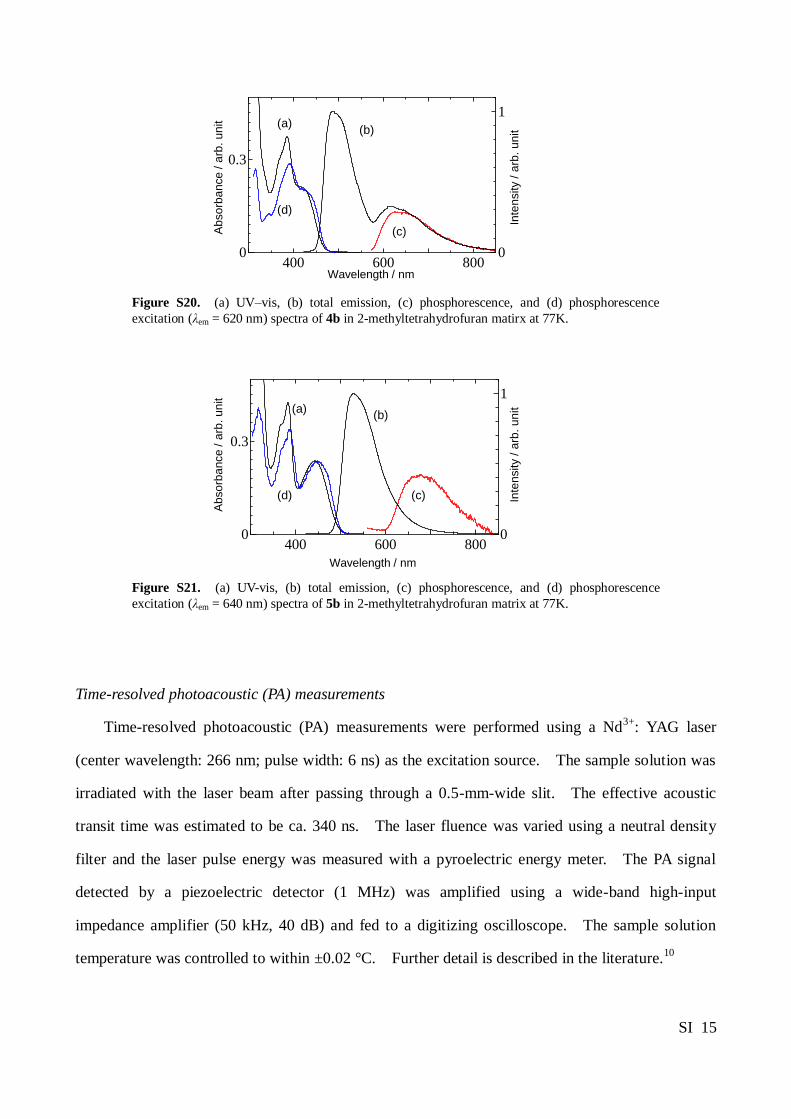
Figure S20. (a) UV‒vis, (b) total emission, (c) phosphorescence, and (d) phosphorescence
excitation (λem = 620 nm) spectra of 4b in 2-methyltetrahydrofuran matirx at 77K.
400 600 8000
0.3
0
1
Wavelength / nm
Ab
so
rba
nce / a
rb. u
nit
Inte
nsity / a
rb. u
nit
Figure S21. (a) UV-vis, (b) total emission, (c) phosphorescence, and (d) phosphorescence
excitation (λem = 640 nm) spectra of 5b in 2-methyltetrahydrofuran matrix at 77K.
Time-resolved photoacoustic (PA) measurements
Time-resolved photoacoustic (PA) measurements were performed using a Nd3+
: YAG laser
(center wavelength: 266 nm; pulse width: 6 ns) as the excitation source. The sample solution was
irradiated with the laser beam after passing through a 0.5-mm-wide slit. The effective acoustic
transit time was estimated to be ca. 340 ns. The laser fluence was varied using a neutral density
filter and the laser pulse energy was measured with a pyroelectric energy meter. The PA signal
detected by a piezoelectric detector (1 MHz) was amplified using a wide-band high-input
impedance amplifier (50 kHz, 40 dB) and fed to a digitizing oscilloscope. The sample solution
temperature was controlled to within ±0.02 °C. Further detail is described in the literature.10
(a) (b)
(c)
(d)
(a) (b)
(c) (d)
SI 16
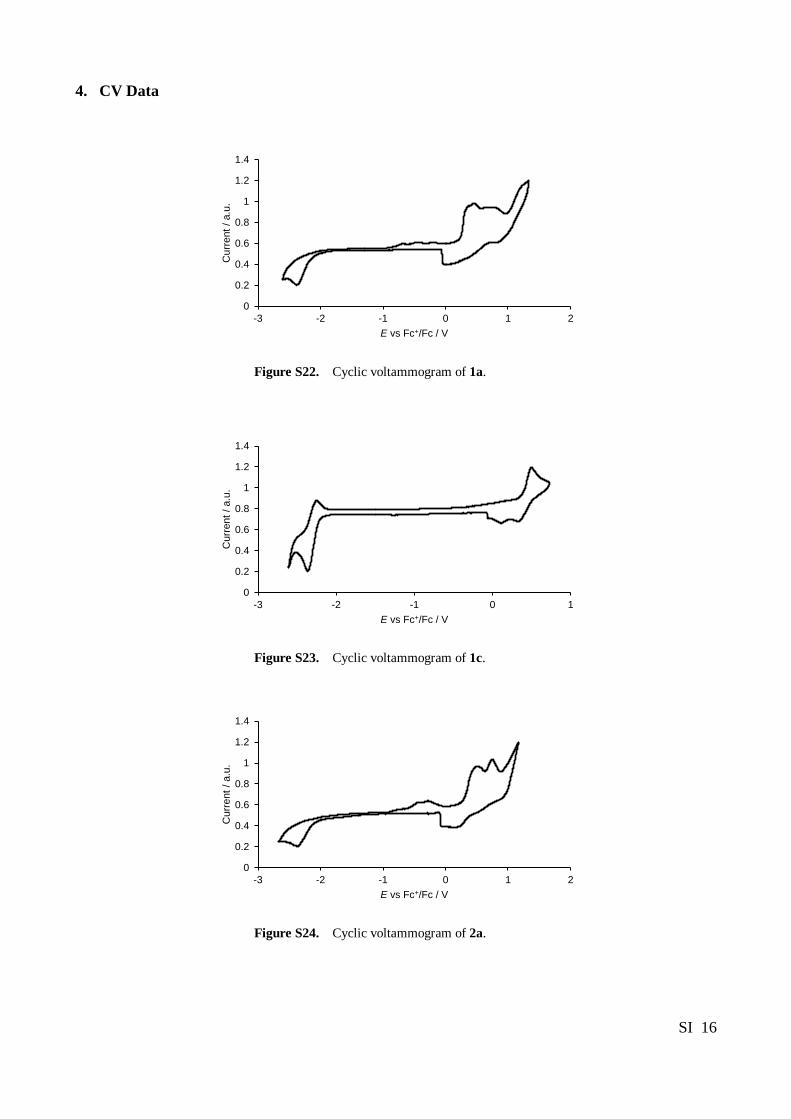
4. CV Data
0
0.2
0.4
0.6
0.8
1
1.2
1.4
-3 -2 -1 0 1 2
Curr
ent
/ a.u
.
E vs Fc+/Fc / V
Figure S22. Cyclic voltammogram of 1a.
0
0.2
0.4
0.6
0.8
1
1.2
1.4
-3 -2 -1 0 1
Cu
rre
nt
/ a.u
.
E vs Fc+/Fc / V
Figure S23. Cyclic voltammogram of 1c.
0
0.2
0.4
0.6
0.8
1
1.2
1.4
-3 -2 -1 0 1 2
Cu
rre
nt
/ a.u
.
E vs Fc+/Fc / V
Figure S24. Cyclic voltammogram of 2a.
SI 17
0
0.2
0.4
0.6
0.8
1
1.2
1.4
-3 -2 -1 0 1 2
Curr
ent
/ a.u
.
E vs Fc+/Fc / V
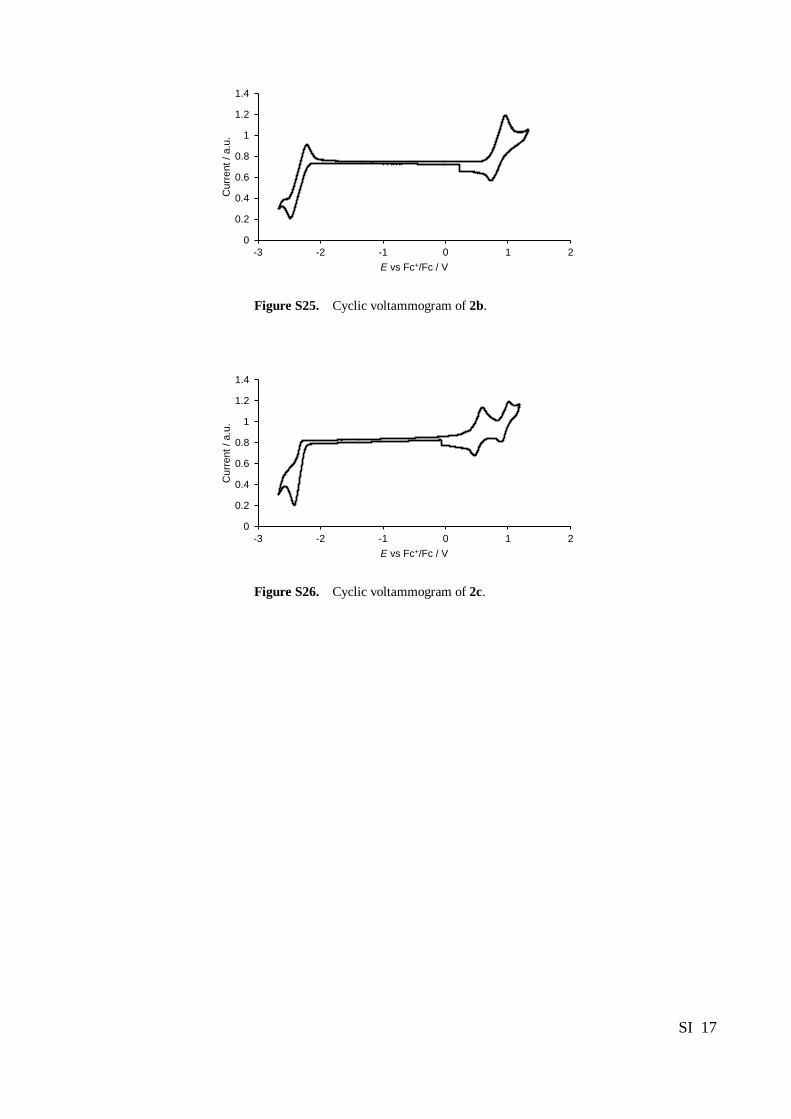
Figure S25. Cyclic voltammogram of 2b.
0
0.2
0.4
0.6
0.8
1
1.2
1.4
-3 -2 -1 0 1 2
Curr
ent
/ a.u
.
E vs Fc+/Fc / V
Figure S26. Cyclic voltammogram of 2c.
SI 18
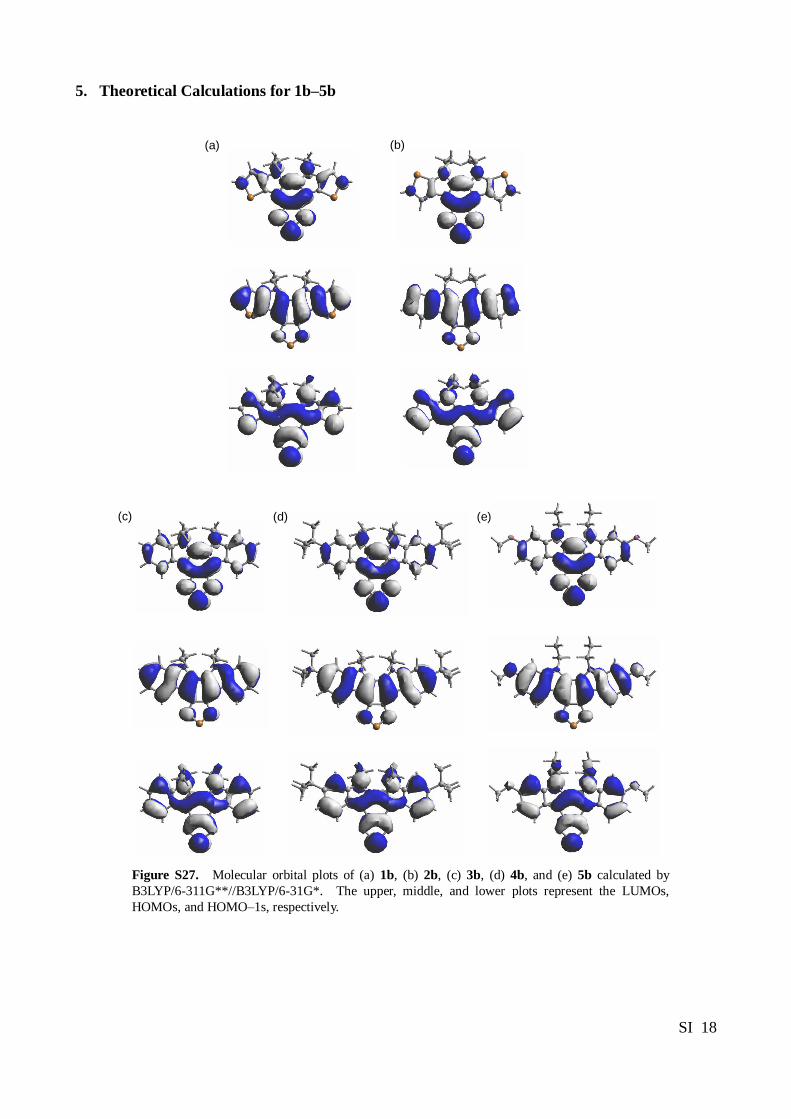
5. Theoretical Calculations for 1b‒5b
Figure S27. Molecular orbital plots of (a) 1b, (b) 2b, (c) 3b, (d) 4b, and (e) 5b calculated by
B3LYP/6-311G**//B3LYP/6-31G*. The upper, middle, and lower plots represent the LUMOs,
HOMOs, and HOMO‒1s, respectively.
(a) (b)
(c) (d) (e)
SI 19
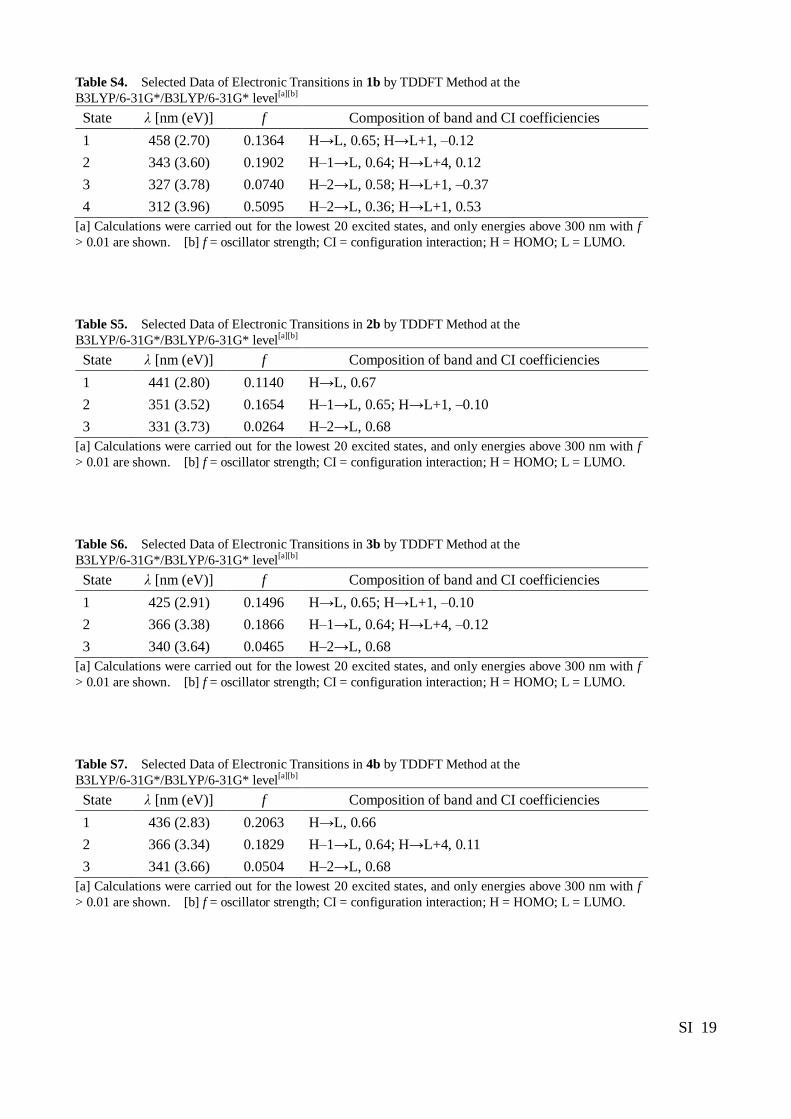
Table S4. Selected Data of Electronic Transitions in 1b by TDDFT Method at the
B3LYP/6-31G*/B3LYP/6-31G* level[a][b]
State λ [nm (eV)] f Composition of band and CI coefficiencies
1 458 (2.70) 0.1364 H→L, 0.65; H→L+1, ‒0.12
2 343 (3.60) 0.1902 H‒1→L, 0.64; H→L+4, 0.12
3 327 (3.78) 0.0740 H–2→L, 0.58; H→L+1, ‒0.37
4 312 (3.96) 0.5095 H–2→L, 0.36; H→L+1, 0.53
[a] Calculations were carried out for the lowest 20 excited states, and only energies above 300 nm with f
> 0.01 are shown. [b] f = oscillator strength; CI = configuration interaction; H = HOMO; L = LUMO.
Table S5. Selected Data of Electronic Transitions in 2b by TDDFT Method at the
B3LYP/6-31G*/B3LYP/6-31G* level[a][b]
State λ [nm (eV)] f Composition of band and CI coefficiencies
1 441 (2.80) 0.1140 H→L, 0.67
2 351 (3.52) 0.1654 H‒1→L, 0.65; H→L+1, ‒0.10
3 331 (3.73) 0.0264 H–2→L, 0.68
[a] Calculations were carried out for the lowest 20 excited states, and only energies above 300 nm with f
> 0.01 are shown. [b] f = oscillator strength; CI = configuration interaction; H = HOMO; L = LUMO.
Table S6. Selected Data of Electronic Transitions in 3b by TDDFT Method at the
B3LYP/6-31G*/B3LYP/6-31G* level[a][b]
State λ [nm (eV)] f Composition of band and CI coefficiencies
1 425 (2.91) 0.1496 H→L, 0.65; H→L+1, ‒0.10
2 366 (3.38) 0.1866 H‒1→L, 0.64; H→L+4, ‒0.12
3 340 (3.64) 0.0465 H–2→L, 0.68
[a] Calculations were carried out for the lowest 20 excited states, and only energies above 300 nm with f
> 0.01 are shown. [b] f = oscillator strength; CI = configuration interaction; H = HOMO; L = LUMO.
Table S7. Selected Data of Electronic Transitions in 4b by TDDFT Method at the
B3LYP/6-31G*/B3LYP/6-31G* level[a][b]
State λ [nm (eV)] f Composition of band and CI coefficiencies
1 436 (2.83) 0.2063 H→L, 0.66
2 366 (3.34) 0.1829 H‒1→L, 0.64; H→L+4, 0.11
3 341 (3.66) 0.0504 H–2→L, 0.68
[a] Calculations were carried out for the lowest 20 excited states, and only energies above 300 nm with f
> 0.01 are shown. [b] f = oscillator strength; CI = configuration interaction; H = HOMO; L = LUMO.
SI 20
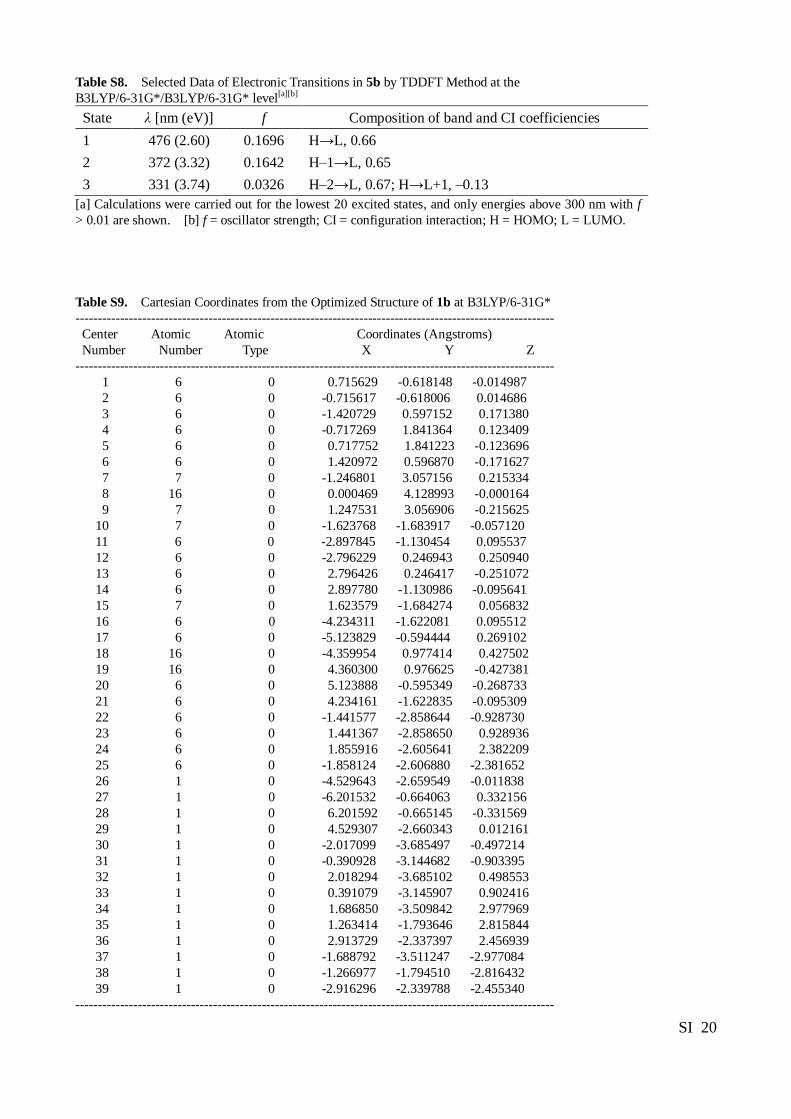
Table S8. Selected Data of Electronic Transitions in 5b by TDDFT Method at the
B3LYP/6-31G*/B3LYP/6-31G* level[a][b]
State λ [nm (eV)] f Composition of band and CI coefficiencies
1 476 (2.60) 0.1696 H→L, 0.66
2 372 (3.32) 0.1642 H‒1→L, 0.65
3 331 (3.74) 0.0326 H–2→L, 0.67; H→L+1, ‒0.13
[a] Calculations were carried out for the lowest 20 excited states, and only energies above 300 nm with f
> 0.01 are shown. [b] f = oscillator strength; CI = configuration interaction; H = HOMO; L = LUMO.
Table S9. Cartesian Coordinates from the Optimized Structure of 1b at B3LYP/6-31G*
------------------------------------------------------------------------------------------------------------
Center Atomic Atomic Coordinates (Angstroms)
Number Number Type X Y Z
------------------------------------------------------------------------------------------------------------
1 6 0 0.715629 -0.618148 -0.014987
2 6 0 -0.715617 -0.618006 0.014686
3 6 0 -1.420729 0.597152 0.171380
4 6 0 -0.717269 1.841364 0.123409
5 6 0 0.717752 1.841223 -0.123696
6 6 0 1.420972 0.596870 -0.171627
7 7 0 -1.246801 3.057156 0.215334
8 16 0 0.000469 4.128993 -0.000164
9 7 0 1.247531 3.056906 -0.215625
10 7 0 -1.623768 -1.683917 -0.057120
11 6 0 -2.897845 -1.130454 0.095537
12 6 0 -2.796229 0.246943 0.250940
13 6 0 2.796426 0.246417 -0.251072
14 6 0 2.897780 -1.130986 -0.095641
15 7 0 1.623579 -1.684274 0.056832
16 6 0 -4.234311 -1.622081 0.095512
17 6 0 -5.123829 -0.594444 0.269102
18 16 0 -4.359954 0.977414 0.427502
19 16 0 4.360300 0.976625 -0.427381
20 6 0 5.123888 -0.595349 -0.268733
21 6 0 4.234161 -1.622835 -0.095309
22 6 0 -1.441577 -2.858644 -0.928730
23 6 0 1.441367 -2.858650 0.928936
24 6 0 1.855916 -2.605641 2.382209
25 6 0 -1.858124 -2.606880 -2.381652
26 1 0 -4.529643 -2.659549 -0.011838
27 1 0 -6.201532 -0.664063 0.332156
28 1 0 6.201592 -0.665145 -0.331569
29 1 0 4.529307 -2.660343 0.012161
30 1 0 -2.017099 -3.685497 -0.497214
31 1 0 -0.390928 -3.144682 -0.903395
32 1 0 2.018294 -3.685102 0.498553
33 1 0 0.391079 -3.145907 0.902416
34 1 0 1.686850 -3.509842 2.977969
35 1 0 1.263414 -1.793646 2.815844
36 1 0 2.913729 -2.337397 2.456939
37 1 0 -1.688792 -3.511247 -2.977084
38 1 0 -1.266977 -1.794510 -2.816432
39 1 0 -2.916296 -2.339788 -2.455340
------------------------------------------------------------------------------------------------------------
SI 21
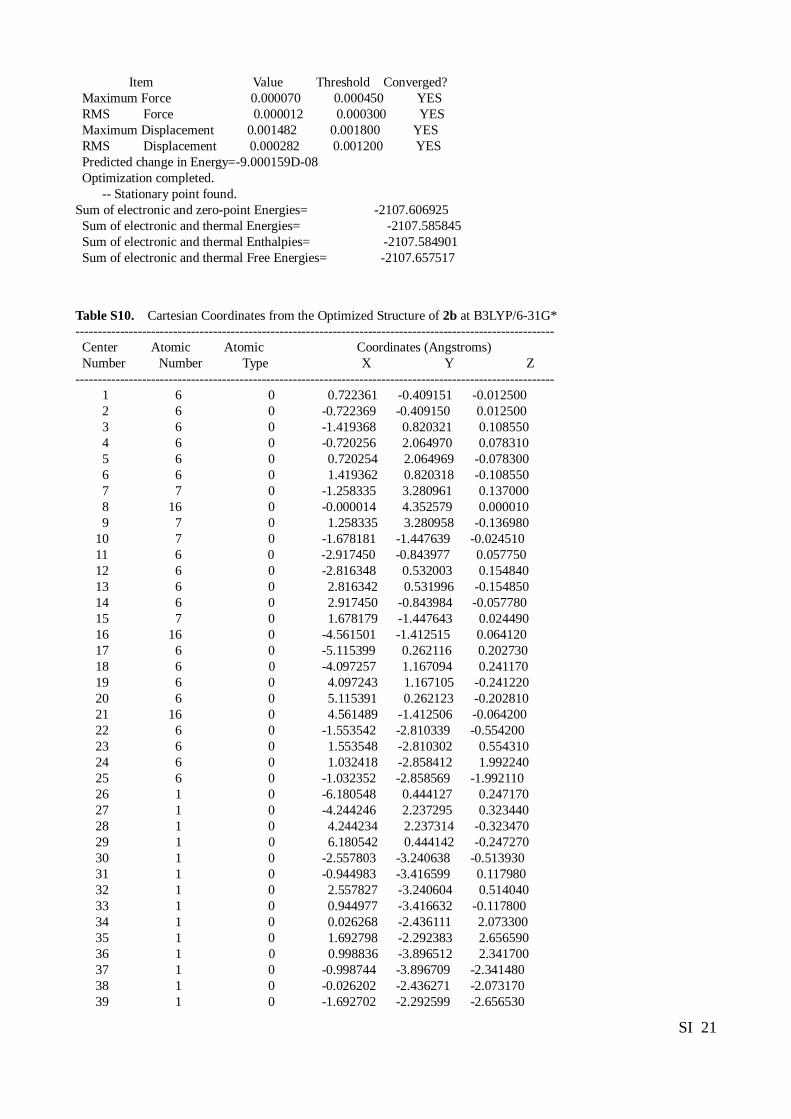
Item Value Threshold Converged?
Maximum Force 0.000070 0.000450 YES
RMS Force 0.000012 0.000300 YES
Maximum Displacement 0.001482 0.001800 YES
RMS Displacement 0.000282 0.001200 YES
Predicted change in Energy=-9.000159D-08
Optimization completed.
-- Stationary point found.
Sum of electronic and zero-point Energies= -2107.606925
Sum of electronic and thermal Energies= -2107.585845
Sum of electronic and thermal Enthalpies= -2107.584901
Sum of electronic and thermal Free Energies= -2107.657517
Table S10. Cartesian Coordinates from the Optimized Structure of 2b at B3LYP/6-31G* ------------------------------------------------------------------------------------------------------------
Center Atomic Atomic Coordinates (Angstroms)
Number Number Type X Y Z
------------------------------------------------------------------------------------------------------------
1 6 0 0.722361 -0.409151 -0.012500
2 6 0 -0.722369 -0.409150 0.012500
3 6 0 -1.419368 0.820321 0.108550
4 6 0 -0.720256 2.064970 0.078310
5 6 0 0.720254 2.064969 -0.078300
6 6 0 1.419362 0.820318 -0.108550
7 7 0 -1.258335 3.280961 0.137000
8 16 0 -0.000014 4.352579 0.000010
9 7 0 1.258335 3.280958 -0.136980
10 7 0 -1.678181 -1.447639 -0.024510
11 6 0 -2.917450 -0.843977 0.057750
12 6 0 -2.816348 0.532003 0.154840
13 6 0 2.816342 0.531996 -0.154850
14 6 0 2.917450 -0.843984 -0.057780
15 7 0 1.678179 -1.447643 0.024490
16 16 0 -4.561501 -1.412515 0.064120
17 6 0 -5.115399 0.262116 0.202730
18 6 0 -4.097257 1.167094 0.241170
19 6 0 4.097243 1.167105 -0.241220
20 6 0 5.115391 0.262123 -0.202810
21 16 0 4.561489 -1.412506 -0.064200
22 6 0 -1.553542 -2.810339 -0.554200
23 6 0 1.553548 -2.810302 0.554310
24 6 0 1.032418 -2.858412 1.992240
25 6 0 -1.032352 -2.858569 -1.992110
26 1 0 -6.180548 0.444127 0.247170
27 1 0 -4.244246 2.237295 0.323440
28 1 0 4.244234 2.237314 -0.323470
29 1 0 6.180542 0.444142 -0.247270
30 1 0 -2.557803 -3.240638 -0.513930
31 1 0 -0.944983 -3.416599 0.117980
32 1 0 2.557827 -3.240604 0.514040
33 1 0 0.944977 -3.416632 -0.117800
34 1 0 0.026268 -2.436111 2.073300
35 1 0 1.692798 -2.292383 2.656590
36 1 0 0.998836 -3.896512 2.341700
37 1 0 -0.998744 -3.896709 -2.341480
38 1 0 -0.026202 -2.436271 -2.073170
39 1 0 -1.692702 -2.292599 -2.656530
SI 22
------------------------------------------------------------------------------------------------------------
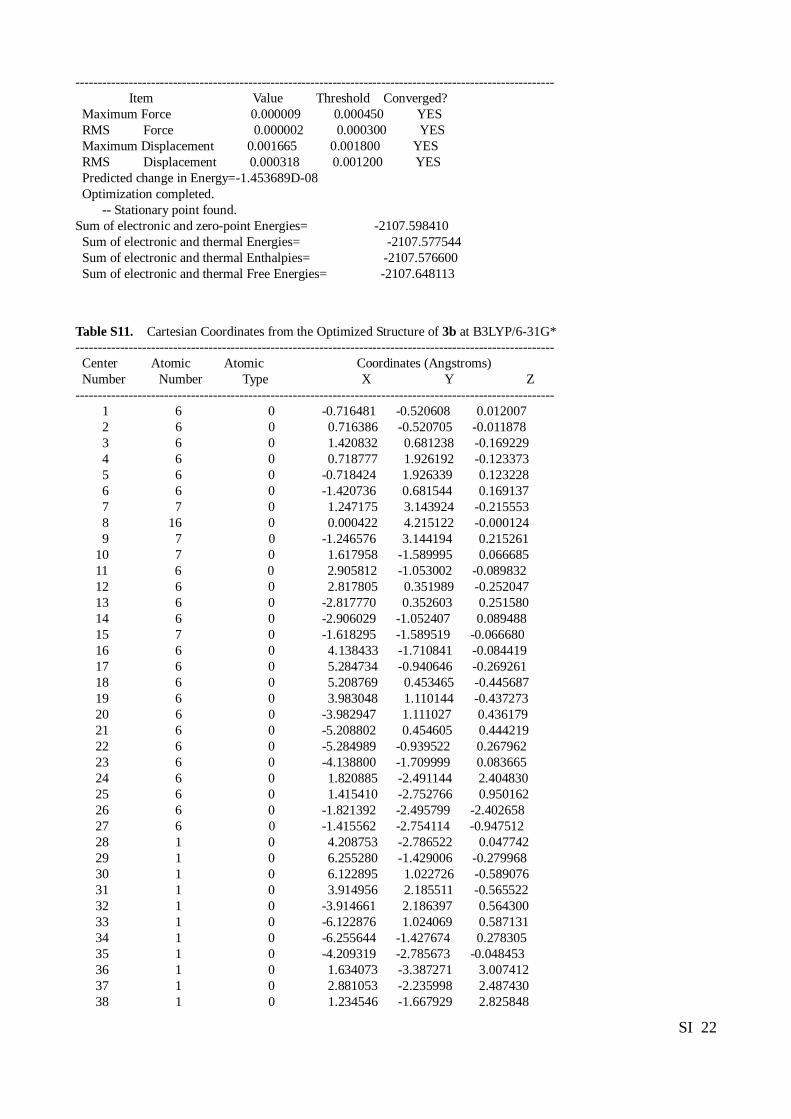
Item Value Threshold Converged?
Maximum Force 0.000009 0.000450 YES
RMS Force 0.000002 0.000300 YES
Maximum Displacement 0.001665 0.001800 YES
RMS Displacement 0.000318 0.001200 YES
Predicted change in Energy=-1.453689D-08
Optimization completed.
-- Stationary point found.
Sum of electronic and zero-point Energies= -2107.598410
Sum of electronic and thermal Energies= -2107.577544
Sum of electronic and thermal Enthalpies= -2107.576600
Sum of electronic and thermal Free Energies= -2107.648113
Table S11. Cartesian Coordinates from the Optimized Structure of 3b at B3LYP/6-31G* ------------------------------------------------------------------------------------------------------------
Center Atomic Atomic Coordinates (Angstroms)
Number Number Type X Y Z
------------------------------------------------------------------------------------------------------------
1 6 0 -0.716481 -0.520608 0.012007
2 6 0 0.716386 -0.520705 -0.011878
3 6 0 1.420832 0.681238 -0.169229
4 6 0 0.718777 1.926192 -0.123373
5 6 0 -0.718424 1.926339 0.123228
6 6 0 -1.420736 0.681544 0.169137
7 7 0 1.247175 3.143924 -0.215553
8 16 0 0.000422 4.215122 -0.000124
9 7 0 -1.246576 3.144194 0.215261
10 7 0 1.617958 -1.589995 0.066685
11 6 0 2.905812 -1.053002 -0.089832
12 6 0 2.817805 0.351989 -0.252047
13 6 0 -2.817770 0.352603 0.251580
14 6 0 -2.906029 -1.052407 0.089488
15 7 0 -1.618295 -1.589519 -0.066680
16 6 0 4.138433 -1.710841 -0.084419
17 6 0 5.284734 -0.940646 -0.269261
18 6 0 5.208769 0.453465 -0.445687
19 6 0 3.983048 1.110144 -0.437273
20 6 0 -3.982947 1.111027 0.436179
21 6 0 -5.208802 0.454605 0.444219
22 6 0 -5.284989 -0.939522 0.267962
23 6 0 -4.138800 -1.709999 0.083665
24 6 0 1.820885 -2.491144 2.404830
25 6 0 1.415410 -2.752766 0.950162
26 6 0 -1.821392 -2.495799 -2.402658
27 6 0 -1.415562 -2.754114 -0.947512
28 1 0 4.208753 -2.786522 0.047742
29 1 0 6.255280 -1.429006 -0.279968
30 1 0 6.122895 1.022726 -0.589076
31 1 0 3.914956 2.185511 -0.565522
32 1 0 -3.914661 2.186397 0.564300
33 1 0 -6.122876 1.024069 0.587131
34 1 0 -6.255644 -1.427674 0.278305
35 1 0 -4.209319 -2.785673 -0.048453
36 1 0 1.634073 -3.387271 3.007412
37 1 0 2.881053 -2.235998 2.487430
38 1 0 1.234546 -1.667929 2.825848
SI 23
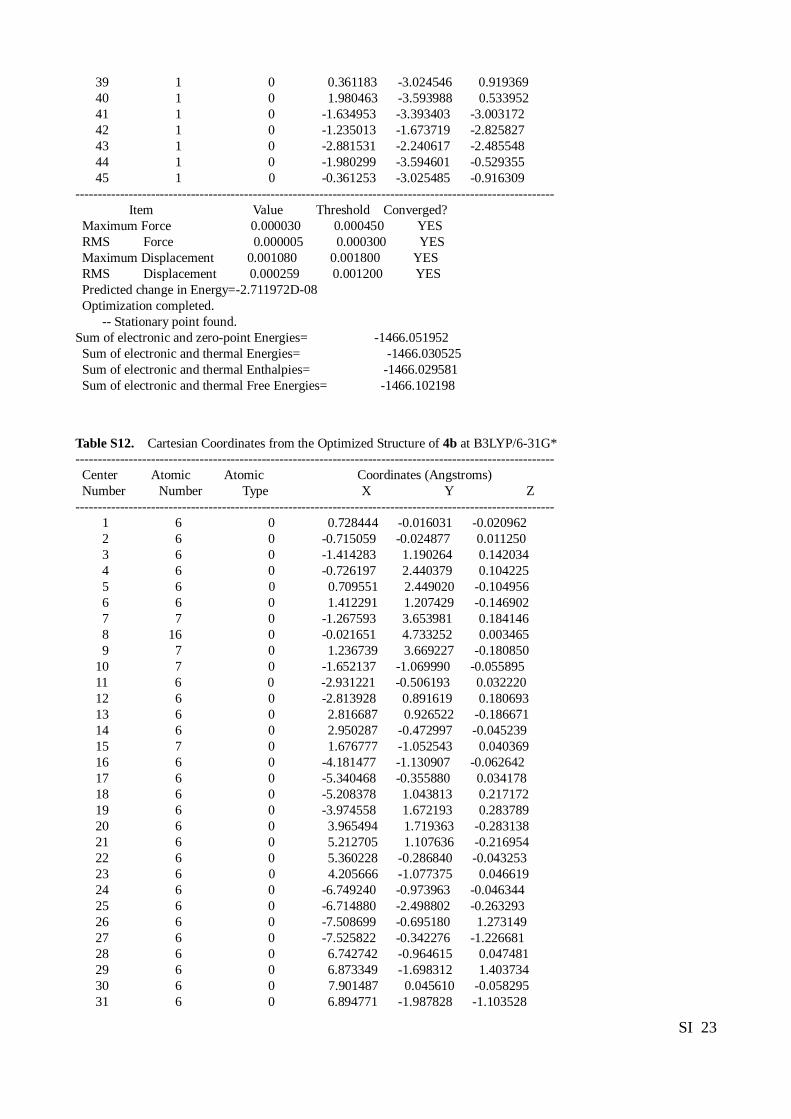
39 1 0 0.361183 -3.024546 0.919369
40 1 0 1.980463 -3.593988 0.533952
41 1 0 -1.634953 -3.393403 -3.003172
42 1 0 -1.235013 -1.673719 -2.825827
43 1 0 -2.881531 -2.240617 -2.485548
44 1 0 -1.980299 -3.594601 -0.529355
45 1 0 -0.361253 -3.025485 -0.916309
------------------------------------------------------------------------------------------------------------
Item Value Threshold Converged?
Maximum Force 0.000030 0.000450 YES
RMS Force 0.000005 0.000300 YES
Maximum Displacement 0.001080 0.001800 YES
RMS Displacement 0.000259 0.001200 YES
Predicted change in Energy=-2.711972D-08
Optimization completed.
-- Stationary point found.
Sum of electronic and zero-point Energies= -1466.051952
Sum of electronic and thermal Energies= -1466.030525
Sum of electronic and thermal Enthalpies= -1466.029581
Sum of electronic and thermal Free Energies= -1466.102198
Table S12. Cartesian Coordinates from the Optimized Structure of 4b at B3LYP/6-31G* ------------------------------------------------------------------------------------------------------------
Center Atomic Atomic Coordinates (Angstroms)
Number Number Type X Y Z
------------------------------------------------------------------------------------------------------------
1 6 0 0.728444 -0.016031 -0.020962
2 6 0 -0.715059 -0.024877 0.011250
3 6 0 -1.414283 1.190264 0.142034
4 6 0 -0.726197 2.440379 0.104225
5 6 0 0.709551 2.449020 -0.104956
6 6 0 1.412291 1.207429 -0.146902
7 7 0 -1.267593 3.653981 0.184146
8 16 0 -0.021651 4.733252 0.003465
9 7 0 1.236739 3.669227 -0.180850
10 7 0 -1.652137 -1.069990 -0.055895
11 6 0 -2.931221 -0.506193 0.032220
12 6 0 -2.813928 0.891619 0.180693
13 6 0 2.816687 0.926522 -0.186671
14 6 0 2.950287 -0.472997 -0.045239
15 7 0 1.676777 -1.052543 0.040369
16 6 0 -4.181477 -1.130907 -0.062642
17 6 0 -5.340468 -0.355880 0.034178
18 6 0 -5.208378 1.043813 0.217172
19 6 0 -3.974558 1.672193 0.283789
20 6 0 3.965494 1.719363 -0.283138
21 6 0 5.212705 1.107636 -0.216954
22 6 0 5.360228 -0.286840 -0.043253
23 6 0 4.205666 -1.077375 0.046619
24 6 0 -6.749240 -0.973963 -0.046344
25 6 0 -6.714880 -2.498802 -0.263293
26 6 0 -7.508699 -0.695180 1.273149
27 6 0 -7.525822 -0.342276 -1.226681
28 6 0 6.742742 -0.964615 0.047481
29 6 0 6.873349 -1.698312 1.403734
30 6 0 7.901487 0.045610 -0.058295
31 6 0 6.894771 -1.987828 -1.103528
SI 24
32 6 0 -1.769821 -3.583367 0.166163
33 6 0 -1.460174 -2.366766 -0.712757
34 6 0 1.824340 -3.567098 -0.151873
35 6 0 1.502150 -2.343951 0.713240
36 1 0 -4.250948 -2.200364 -0.209177
37 1 0 -6.102901 1.653554 0.301004
38 1 0 -3.896236 2.747928 0.401776
39 1 0 3.874881 2.794845 -0.394549
40 1 0 6.093283 1.734377 -0.293795
41 1 0 4.294881 -2.148620 0.185042
42 1 0 -7.738105 -2.886875 -0.318703
43 1 0 -6.210916 -3.018118 0.560137
44 1 0 -6.211023 -2.766725 -1.199321
45 1 0 -8.518440 -1.121978 1.230554
46 1 0 -7.608107 0.377605 1.467233
47 1 0 -6.986089 -1.141128 2.127065
48 1 0 -8.536141 -0.765366 -1.288301
49 1 0 -7.017120 -0.535810 -2.178000
50 1 0 -7.625495 0.742293 -1.117039
51 1 0 7.854721 -2.182089 1.483675
52 1 0 6.110496 -2.474911 1.524913
53 1 0 6.770850 -0.996771 2.239370
54 1 0 8.858591 -0.483858 0.009889
55 1 0 7.873951 0.784294 0.750493
56 1 0 7.888927 0.582784 -1.013241
57 1 0 7.871541 -2.484310 -1.048488
58 1 0 6.818361 -1.493910 -2.078825
59 1 0 6.123833 -2.764575 -1.062234
60 1 0 -1.597244 -4.501710 -0.406389
61 1 0 -2.810704 -3.586810 0.498871
62 1 0 -1.142903 -3.616375 1.061825
63 1 0 -0.434919 -2.402142 -1.078610
64 1 0 -2.105096 -2.388786 -1.601090
65 1 0 1.666792 -4.480489 0.432843
66 1 0 2.863612 -3.560704 -0.489558
67 1 0 1.194077 -3.619734 -1.044178
68 1 0 0.478193 -2.388026 1.081922
69 1 0 2.149382 -2.347797 1.600304
------------------------------------------------------------------------------------------------------------
Item Value Threshold Converged?
Maximum Force 0.000019 0.000450 YES
RMS Force 0.000003 0.000300 YES
Maximum Displacement 0.001625 0.001800 YES
RMS Displacement 0.000372 0.001200 YES
Predicted change in Energy=-2.251212D-08
Optimization completed.
-- Stationary point found.
Sum of electronic and zero-point Energies= -1780.335233
Sum of electronic and thermal Energies= -1780.302540
Sum of electronic and thermal Enthalpies= -1780.301596
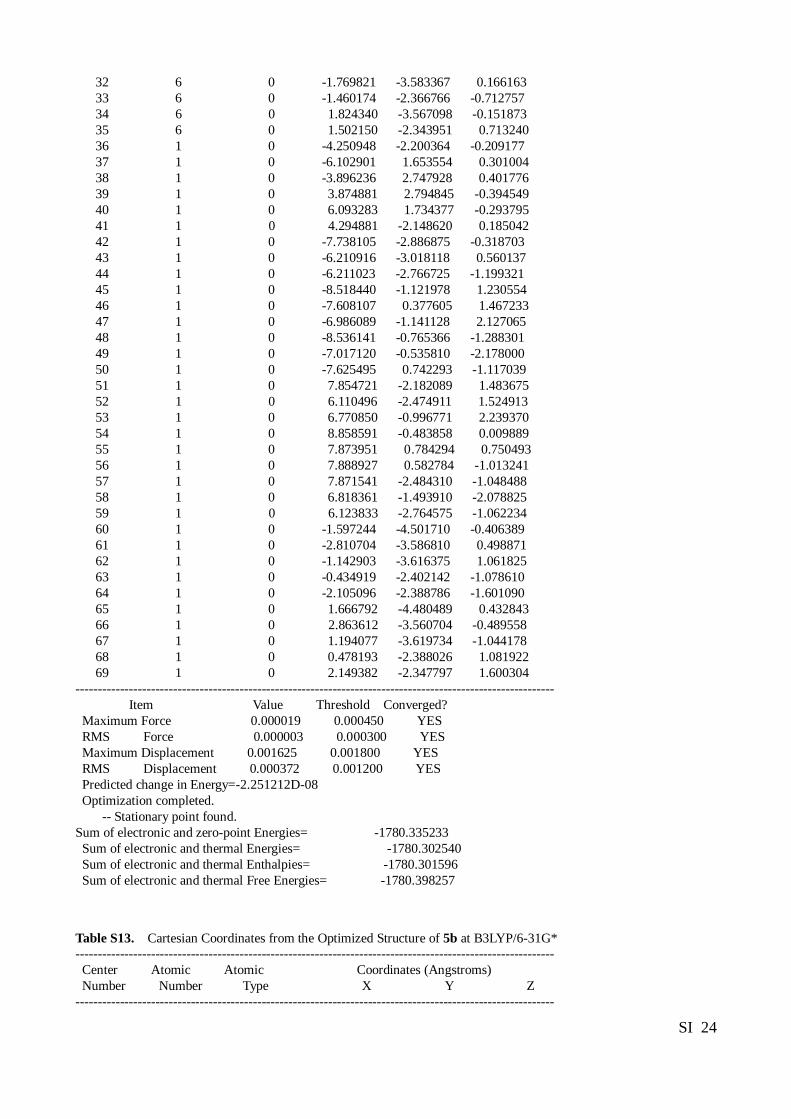
Sum of electronic and thermal Free Energies= -1780.398257
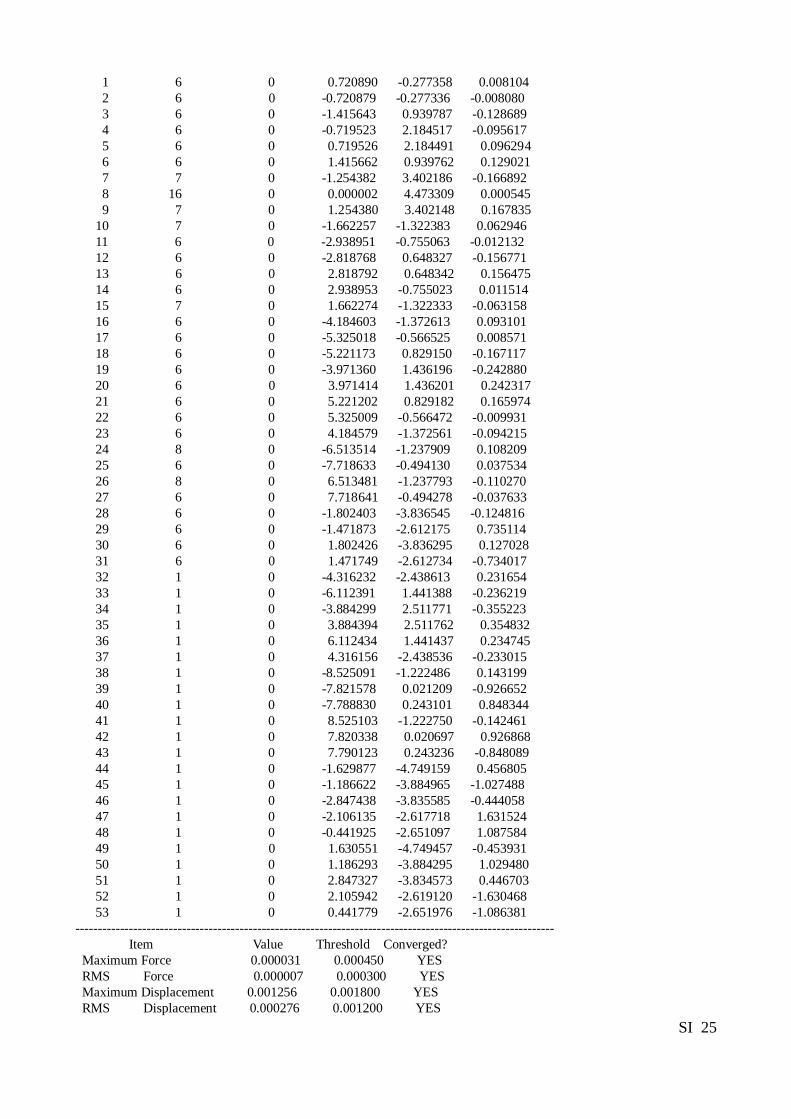
Table S13. Cartesian Coordinates from the Optimized Structure of 5b at B3LYP/6-31G* ------------------------------------------------------------------------------------------------------------
Center Atomic Atomic Coordinates (Angstroms)
Number Number Type X Y Z
------------------------------------------------------------------------------------------------------------
SI 25
1 6 0 0.720890 -0.277358 0.008104
2 6 0 -0.720879 -0.277336 -0.008080
3 6 0 -1.415643 0.939787 -0.128689
4 6 0 -0.719523 2.184517 -0.095617
5 6 0 0.719526 2.184491 0.096294
6 6 0 1.415662 0.939762 0.129021
7 7 0 -1.254382 3.402186 -0.166892
8 16 0 0.000002 4.473309 0.000545
9 7 0 1.254380 3.402148 0.167835
10 7 0 -1.662257 -1.322383 0.062946
11 6 0 -2.938951 -0.755063 -0.012132
12 6 0 -2.818768 0.648327 -0.156771
13 6 0 2.818792 0.648342 0.156475
14 6 0 2.938953 -0.755023 0.011514
15 7 0 1.662274 -1.322333 -0.063158
16 6 0 -4.184603 -1.372613 0.093101
17 6 0 -5.325018 -0.566525 0.008571
18 6 0 -5.221173 0.829150 -0.167117
19 6 0 -3.971360 1.436196 -0.242880
20 6 0 3.971414 1.436201 0.242317
21 6 0 5.221202 0.829182 0.165974
22 6 0 5.325009 -0.566472 -0.009931
23 6 0 4.184579 -1.372561 -0.094215
24 8 0 -6.513514 -1.237909 0.108209
25 6 0 -7.718633 -0.494130 0.037534
26 8 0 6.513481 -1.237793 -0.110270
27 6 0 7.718641 -0.494278 -0.037633
28 6 0 -1.802403 -3.836545 -0.124816
29 6 0 -1.471873 -2.612175 0.735114
30 6 0 1.802426 -3.836295 0.127028
31 6 0 1.471749 -2.612734 -0.734017
32 1 0 -4.316232 -2.438613 0.231654
33 1 0 -6.112391 1.441388 -0.236219
34 1 0 -3.884299 2.511771 -0.355223
35 1 0 3.884394 2.511762 0.354832
36 1 0 6.112434 1.441437 0.234745
37 1 0 4.316156 -2.438536 -0.233015
38 1 0 -8.525091 -1.222486 0.143199
39 1 0 -7.821578 0.021209 -0.926652
40 1 0 -7.788830 0.243101 0.848344
41 1 0 8.525103 -1.222750 -0.142461
42 1 0 7.820338 0.020697 0.926868
43 1 0 7.790123 0.243236 -0.848089
44 1 0 -1.629877 -4.749159 0.456805
45 1 0 -1.186622 -3.884965 -1.027488
46 1 0 -2.847438 -3.835585 -0.444058
47 1 0 -2.106135 -2.617718 1.631524
48 1 0 -0.441925 -2.651097 1.087584
49 1 0 1.630551 -4.749457 -0.453931
50 1 0 1.186293 -3.884295 1.029480
51 1 0 2.847327 -3.834573 0.446703
52 1 0 2.105942 -2.619120 -1.630468
53 1 0 0.441779 -2.651976 -1.086381
------------------------------------------------------------------------------------------------------------
Item Value Threshold Converged?
Maximum Force 0.000031 0.000450 YES
RMS Force 0.000007 0.000300 YES
Maximum Displacement 0.001256 0.001800 YES
RMS Displacement 0.000276 0.001200 YES

SI 26
Predicted change in Energy=-4.647487D-08
Optimization completed.
-- Stationary point found.
Sum of electronic and zero-point Energies= -1695.027382
Sum of electronic and thermal Energies= -1695.000747
Sum of electronic and thermal Enthalpies= -1694.999803
Sum of electronic and thermal Free Energies= -1695.083632
SI 27
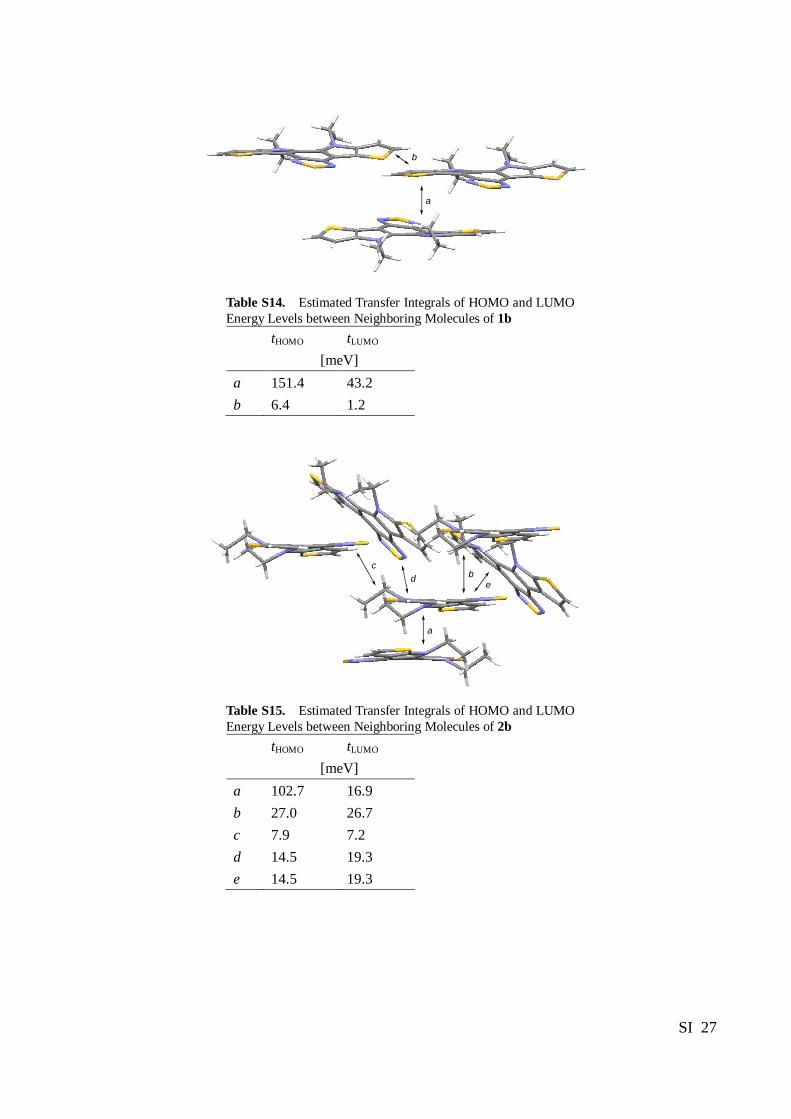
a
b
Table S14. Estimated Transfer Integrals of HOMO and LUMO
Energy Levels between Neighboring Molecules of 1b
tHOMO tLUMO
[meV]
a 151.4 43.2
b 6.4 1.2
a
be
c
d
Table S15. Estimated Transfer Integrals of HOMO and LUMO
Energy Levels between Neighboring Molecules of 2b
tHOMO tLUMO
[meV]
a 102.7 16.9
b 27.0 26.7
c 7.9 7.2
d 14.5 19.3
e 14.5 19.3
SI 28
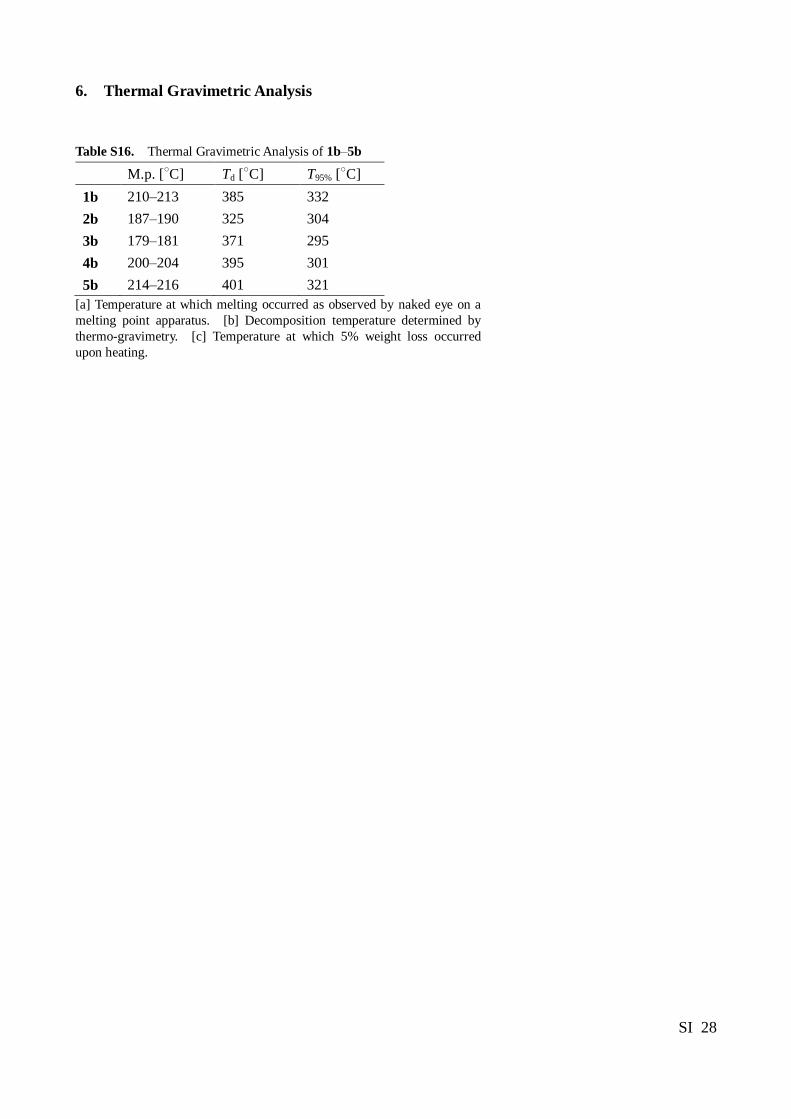
6. Thermal Gravimetric Analysis
Table S16. Thermal Gravimetric Analysis of 1b‒5b
M.p. [○C] Td [
○C] T95% [
○C]
1b 210‒213 385 332
2b 187‒190 325 304
3b 179‒181 371 295
4b 200‒204 395 301
5b 214‒216 401 321
[a] Temperature at which melting occurred as observed by naked eye on a
melting point apparatus. [b] Decomposition temperature determined by
thermo-gravimetry. [c] Temperature at which 5% weight loss occurred
upon heating.
SI 29
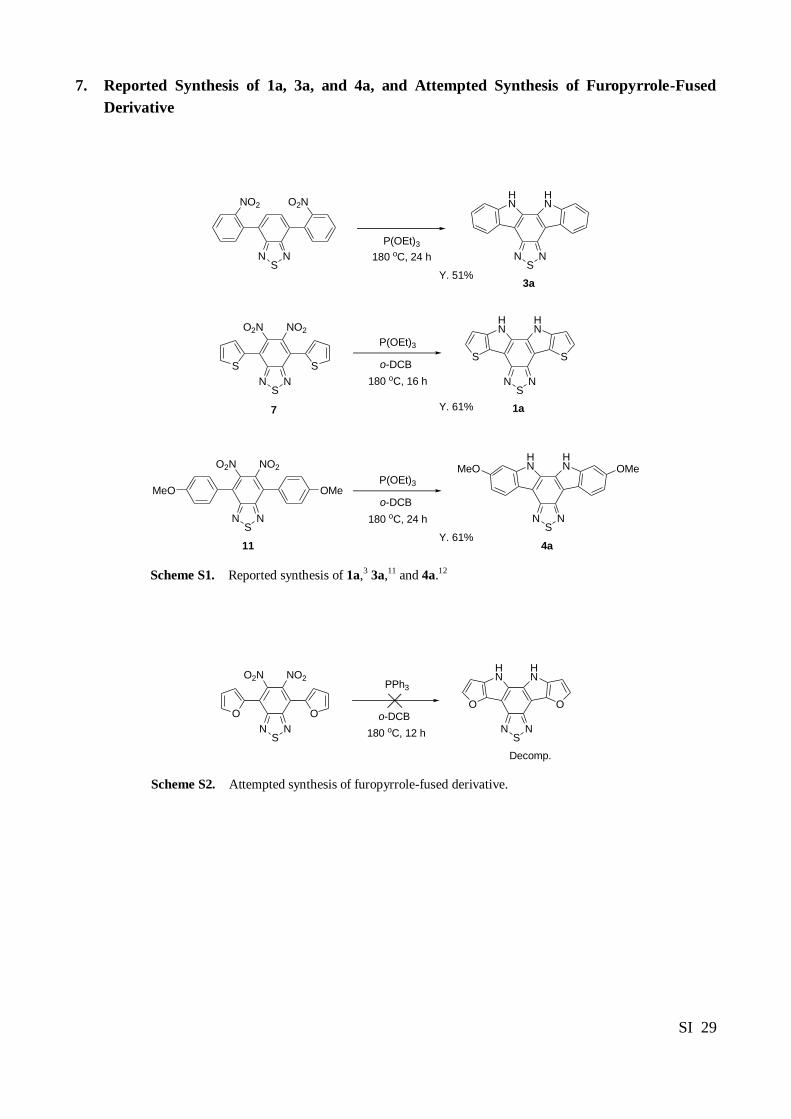
7. Reported Synthesis of 1a, 3a, and 4a, and Attempted Synthesis of Furopyrrole-Fused
Derivative
NS
N
O2NNO2
NS
N
HN
HN
Y. 51%
P(OEt)3
180 oC, 24 h
3a
NS
N
HN
HN
S S
NS
N
S S
O2N NO2
7 1a
P(OEt)3
180 oC, 16 h
o-DCB
Y. 61%
NS
N NS
N
HN
HN
Y. 61%4a
MeO OMe
MeO OMeO2N NO2
P(OEt)3
180 oC, 24 h
o-DCB
11
Scheme S1. Reported synthesis of 1a,3 3a,11 and 4a.12
NS
N
HN
HN
O O
NS
N
O O
O2N NO2
Decomp.
PPh3
180 oC, 12 h
o-DCB
Scheme S2. Attempted synthesis of furopyrrole-fused derivative.
SI 30
8. NMR Data
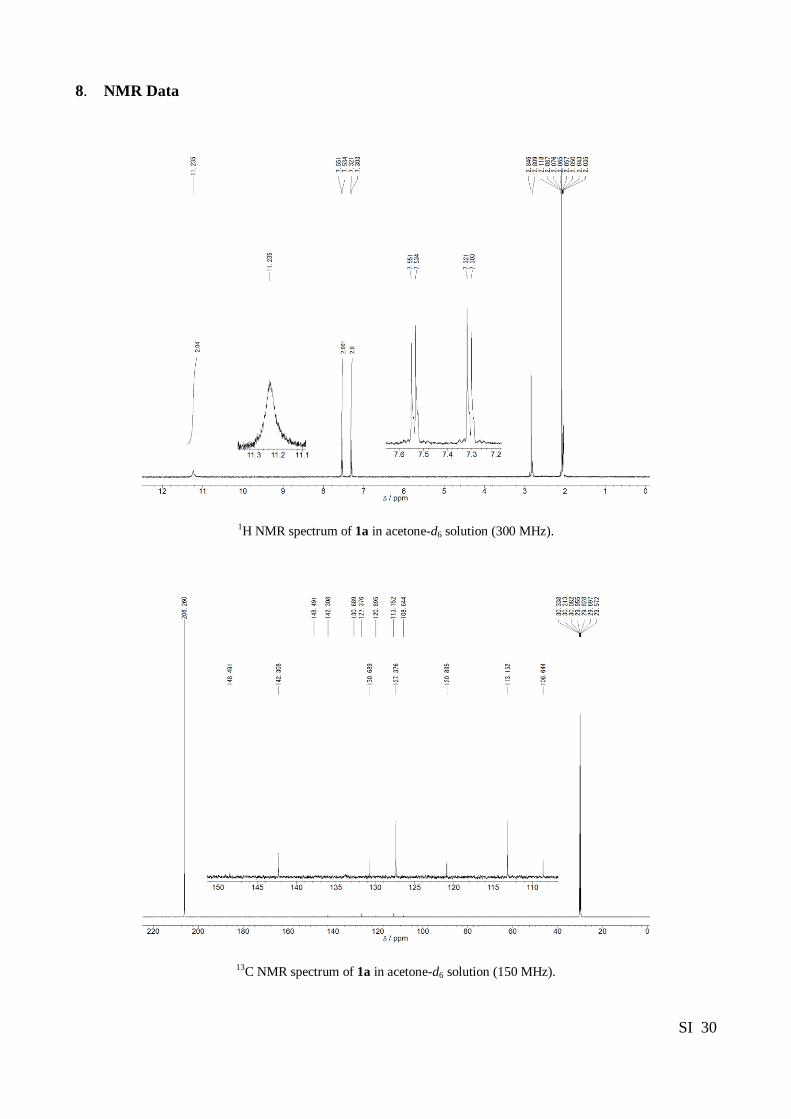
1H NMR spectrum of 1a in acetone-d6 solution (300 MHz).
13C NMR spectrum of 1a in acetone-d6 solution (150 MHz).
SI 31
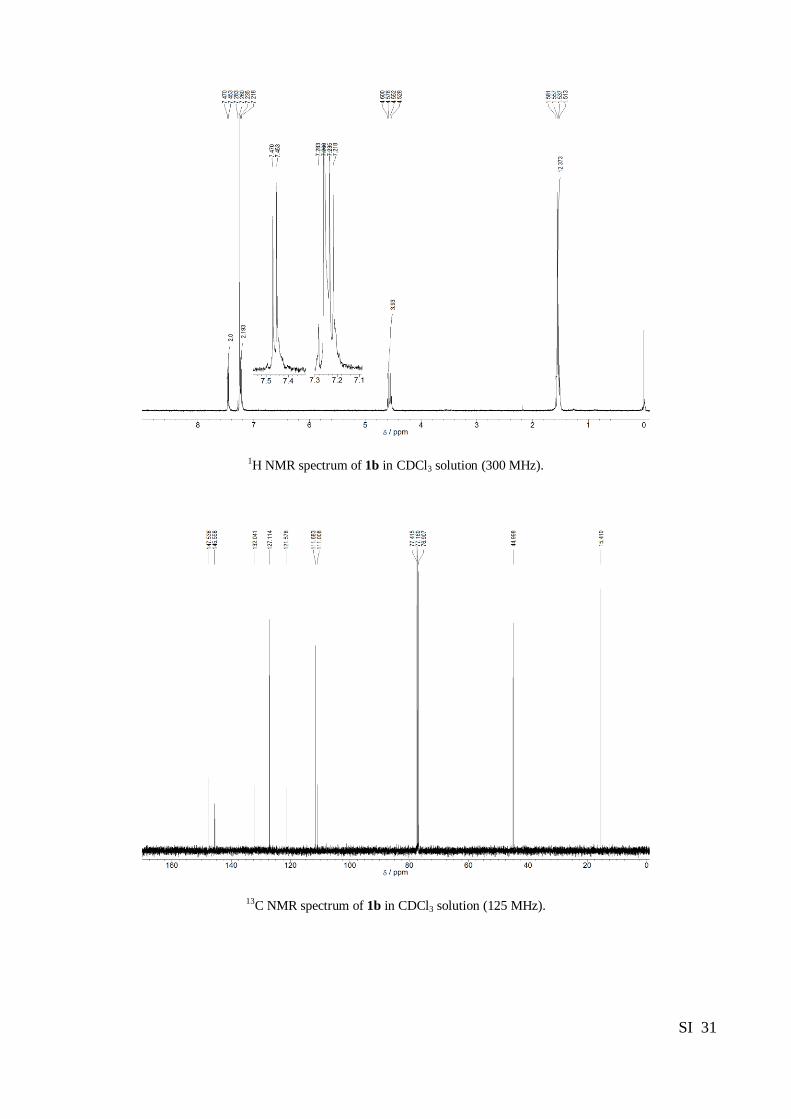
1H NMR spectrum of 1b in CDCl3 solution (300 MHz).
13C NMR spectrum of 1b in CDCl3 solution (125 MHz).
SI 32
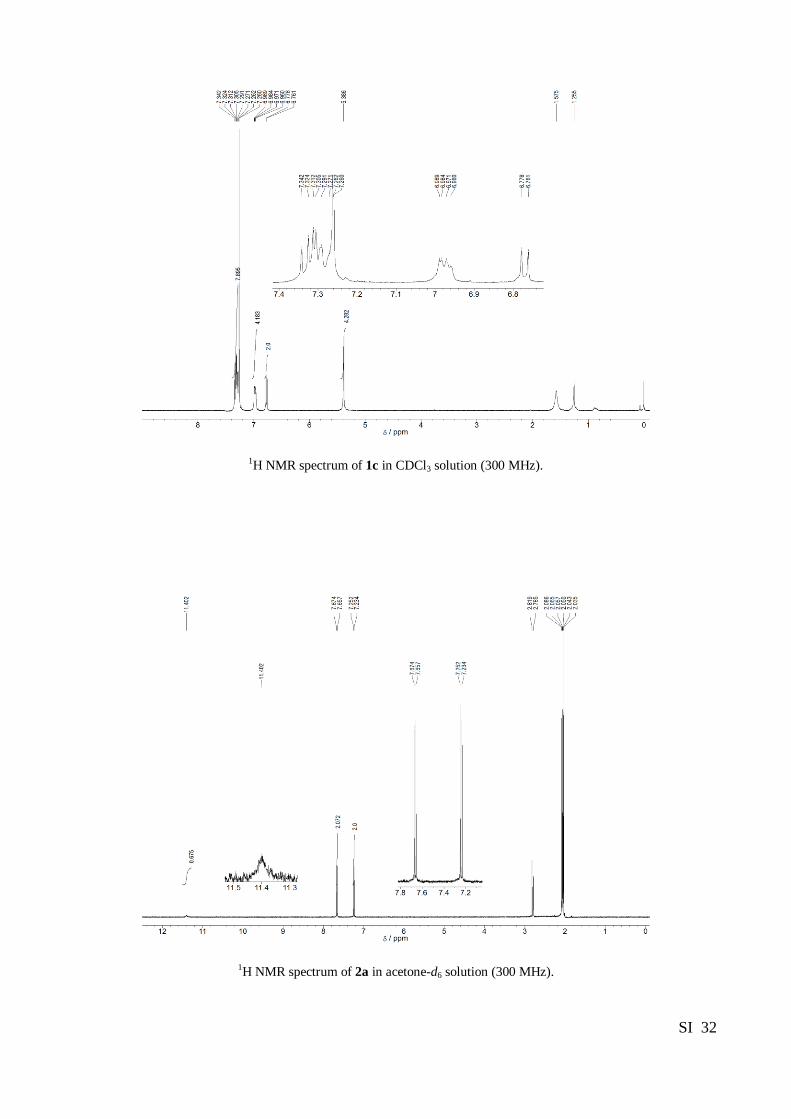
1H NMR spectrum of 1c in CDCl3 solution (300 MHz).
1H NMR spectrum of 2a in acetone-d6 solution (300 MHz).
SI 33
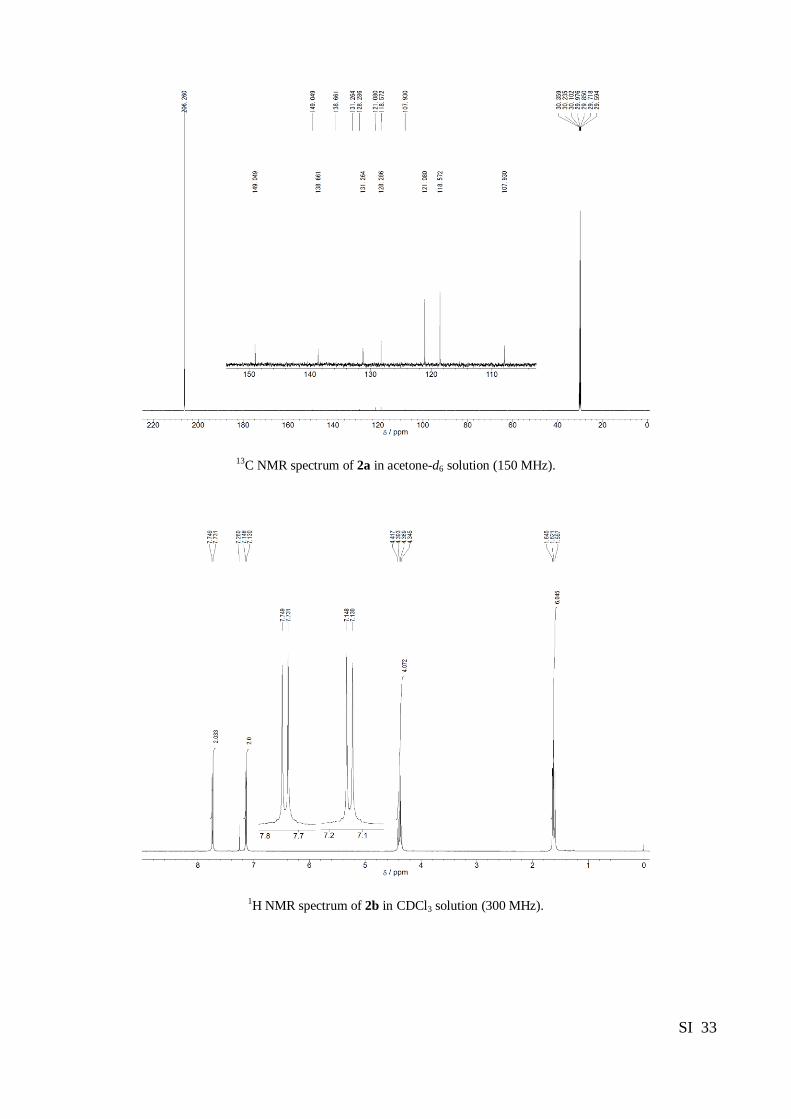
13C NMR spectrum of 2a in acetone-d6 solution (150 MHz).
1H NMR spectrum of 2b in CDCl3 solution (300 MHz).
SI 34
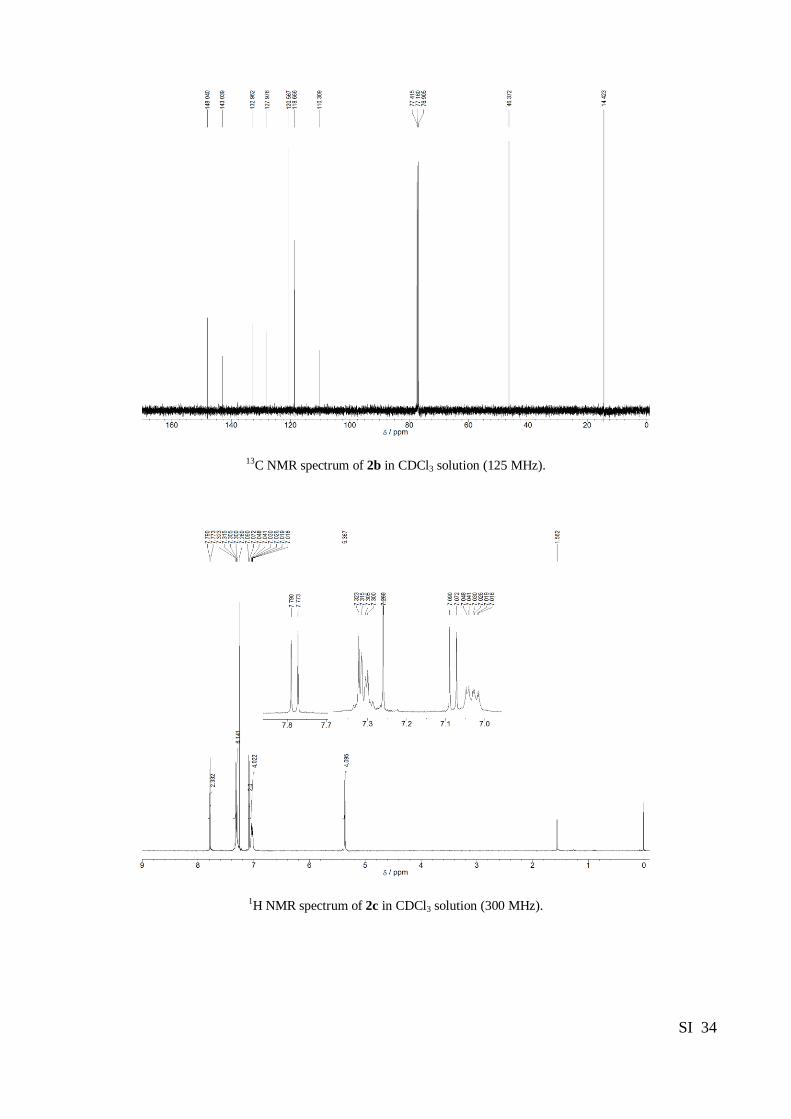
13C NMR spectrum of 2b in CDCl3 solution (125 MHz).
1H NMR spectrum of 2c in CDCl3 solution (300 MHz).
SI 35
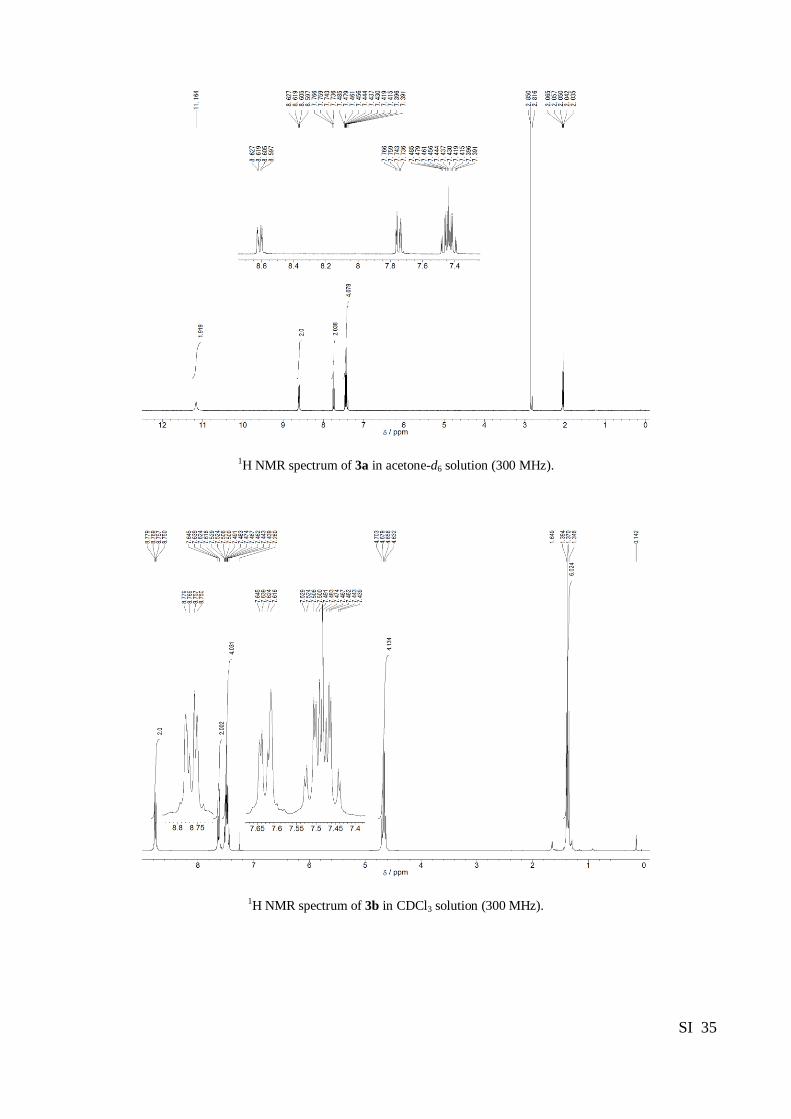
1H NMR spectrum of 3a in acetone-d6 solution (300 MHz).
1H NMR spectrum of 3b in CDCl3 solution (300 MHz).
SI 36
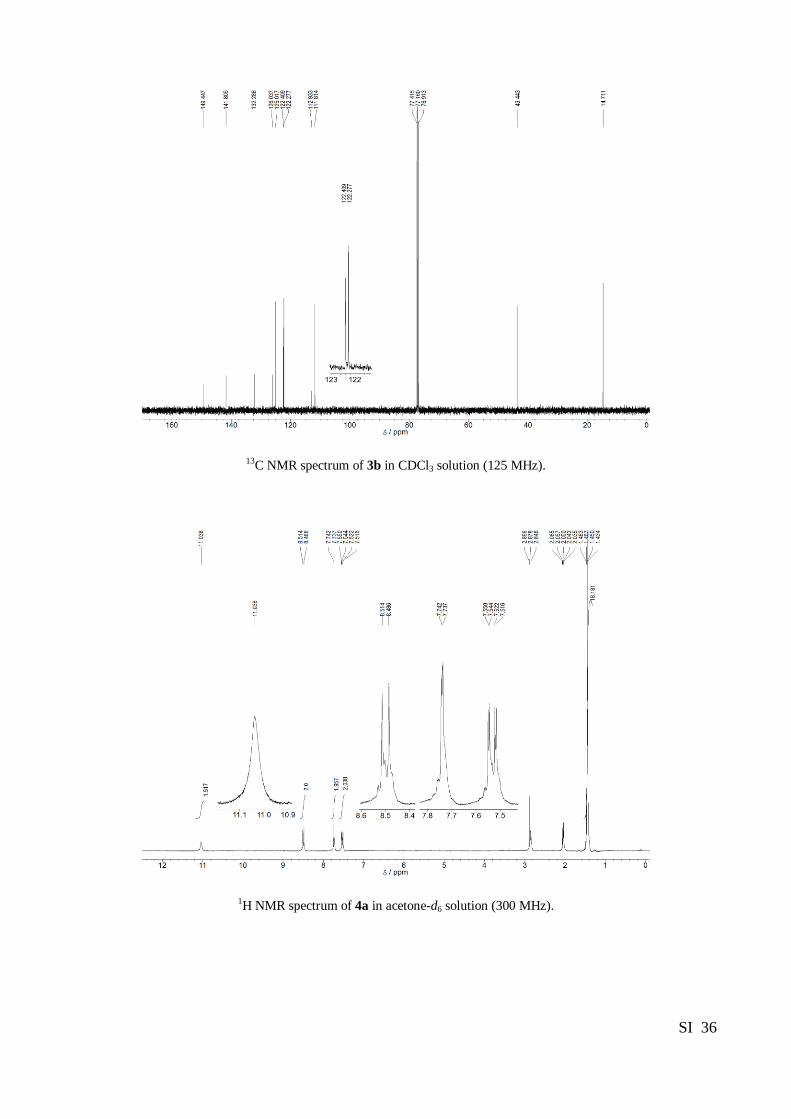
13C NMR spectrum of 3b in CDCl3 solution (125 MHz).
1H NMR spectrum of 4a in acetone-d6 solution (300 MHz).
SI 37
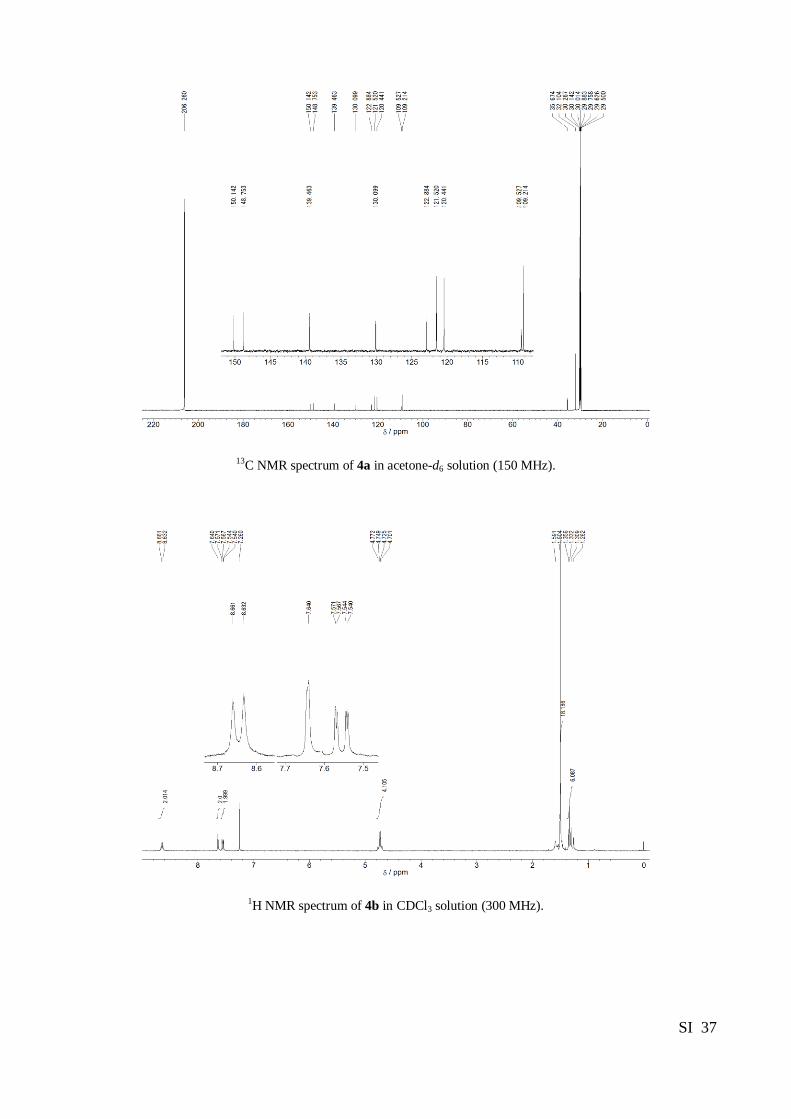
13C NMR spectrum of 4a in acetone-d6 solution (150 MHz).
1H NMR spectrum of 4b in CDCl3 solution (300 MHz).
SI 38
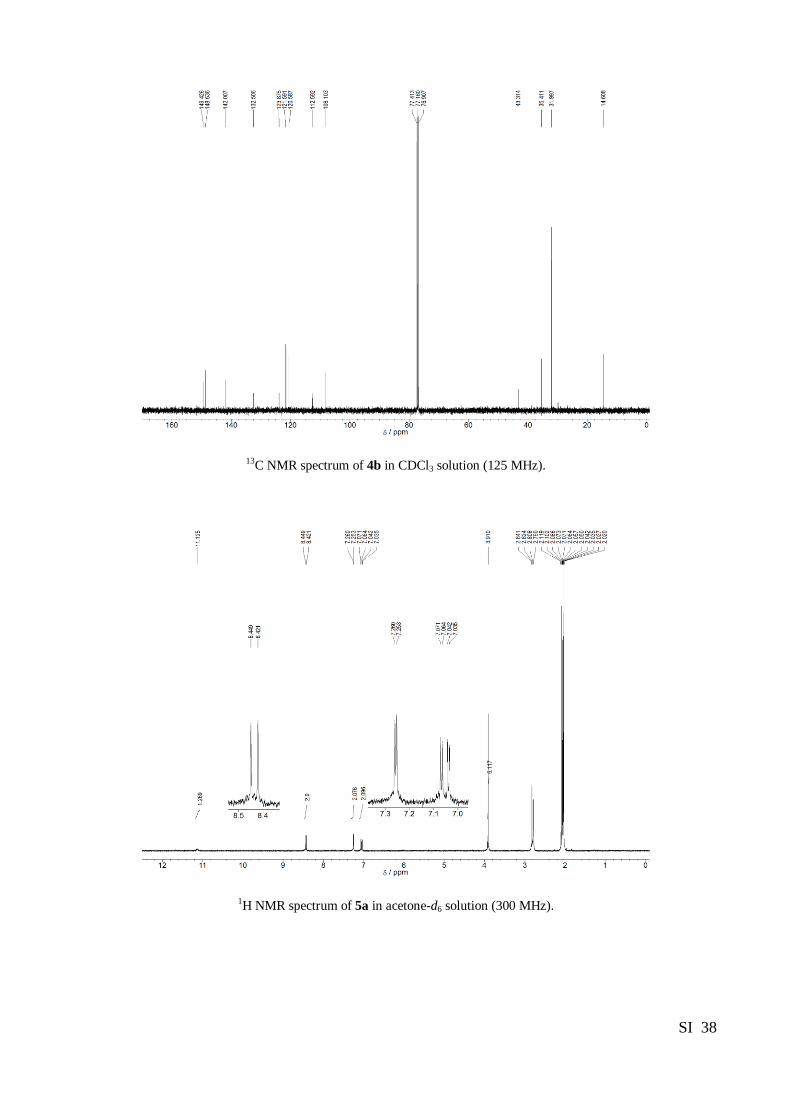
13C NMR spectrum of 4b in CDCl3 solution (125 MHz).
1H NMR spectrum of 5a in acetone-d6 solution (300 MHz).
SI 39
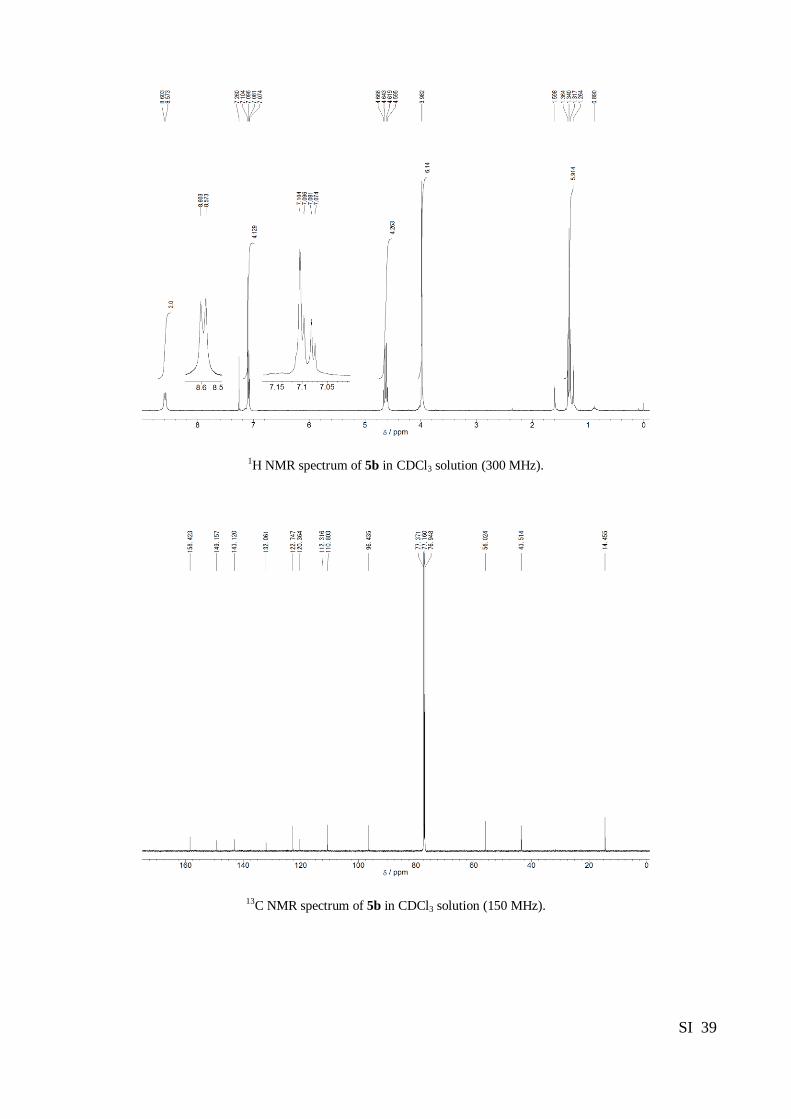
1H NMR spectrum of 5b in CDCl3 solution (300 MHz).
13C NMR spectrum of 5b in CDCl3 solution (150 MHz).
SI 40
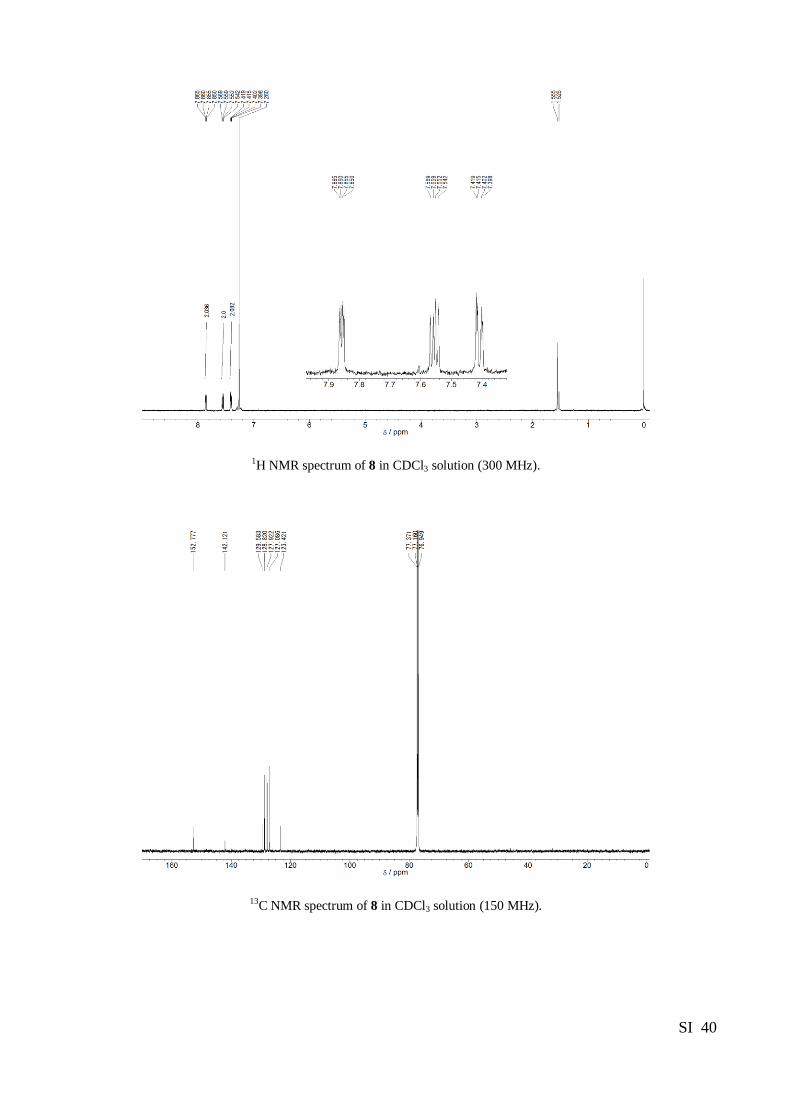
1H NMR spectrum of 8 in CDCl3 solution (300 MHz).
13C NMR spectrum of 8 in CDCl3 solution (150 MHz).
SI 41
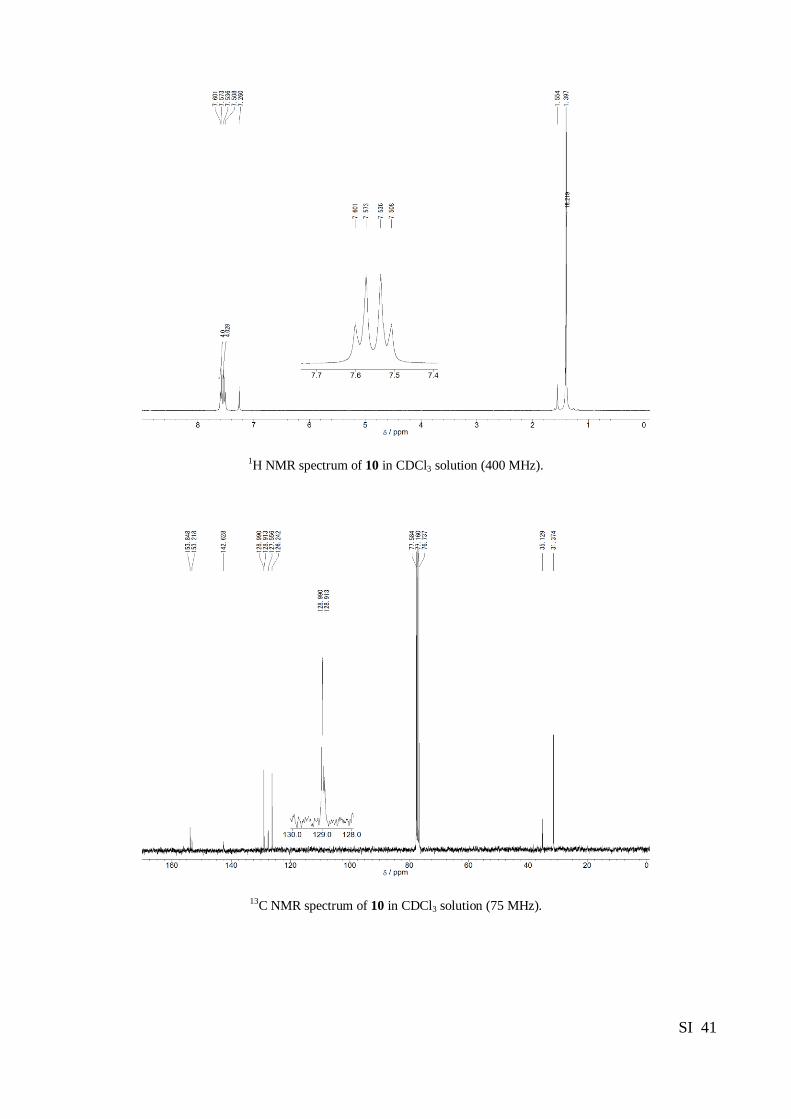
1H NMR spectrum of 10 in CDCl3 solution (400 MHz).
13C NMR spectrum of 10 in CDCl3 solution (75 MHz).
SI 42
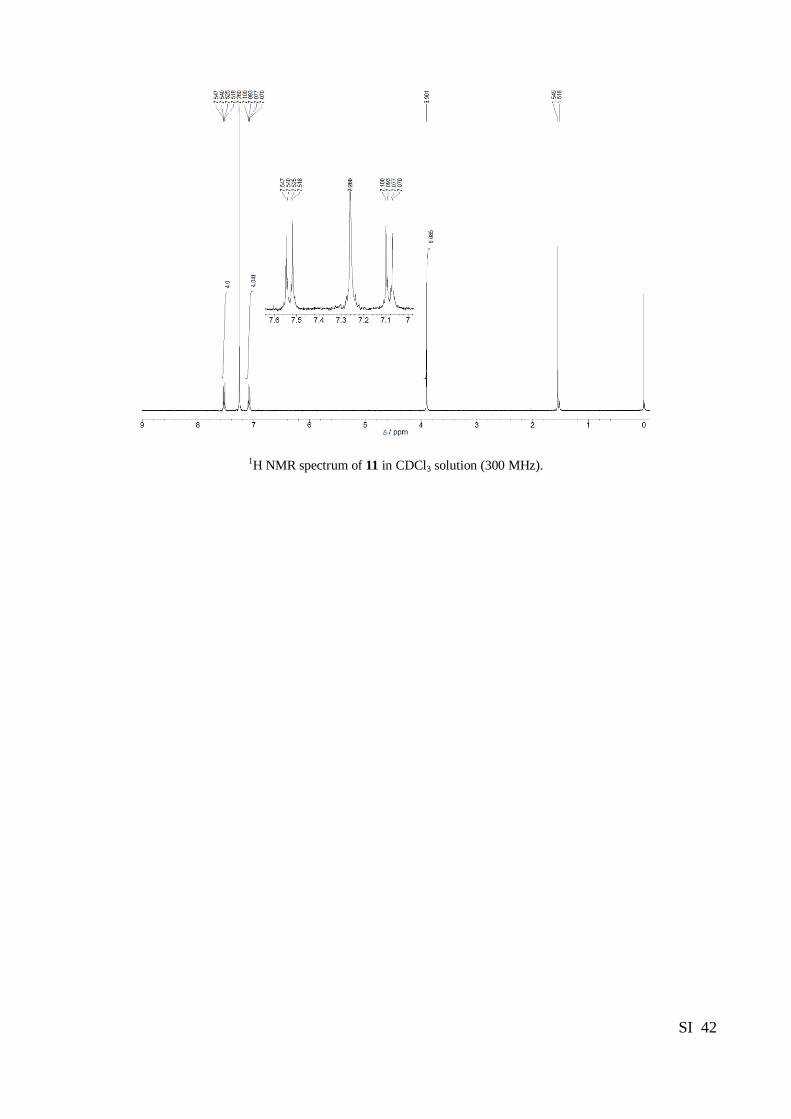
1H NMR spectrum of 11 in CDCl3 solution (300 MHz).
SI 43
9. References
1. Uno, T.; Takagi, K.; Tomoeda, M. Chem. Pharm. Bull. 1980, 28, 1909.
2. Zoombelt, A. P.; Fonrodona, M.; Turbiez, M. G. R.; Wienk, M. M.; Janssen, R. A. J. J. Mater.
Chem. 2009, 19, 5336.
3. Balaji, G.; Shim, W. L.; Parameswaran, M.; Valiyaveettil, S. Org. Lett. 2009, 11, 4450.
4. Frisch, M. J.; Trucks, G. W.; Schlegel, H. B.; Scuseria, G. E.; Robb, M. A.; Cheeseman, J. R.;
Montgomery, J. A., Jr.; Vreven, T.; Kudin, K. N.; Burant, J. C.; Millam, J. M.; Iyengar, S. S.;
Tomasi, J.; Barone, V.; Mennucci, B.; Cossi, M.; Scalmani, G.; Rega, N.; Petersson, G. A.;
Nakatsuji, H.; Hada, M.; Ehara, M.; Toyota, K.; Fukuda, R.; Hasegawa, J.; Ishida, M.;
Nakajima, T.; Honda, Y.; Kitao, O.; Nakai, H.; Klene, M.; Li, X.; Knox, J. E.; Hratchian, H. P.;
Cross, J. B.; Bakken, V.; Adamo, C.; Jaramillo, J.; Gomperts, R.; Stratmann, R. E.; Yazyev, O.;
Austin, A. J.; Cammi, R.; Pomelli, C.; Ochterski, J. W.; Ayala, P. Y.; Morokuma, K.; Voth, G.
A.; Salvador, P.; Dannenberg, J. J.; Zakrzewski, V. G.; Dapprich, S.; Daniels, A. D.; Strain, M.
C.; Farkas, O.; Malick, D. K.; Rabuck, A. D.; Raghavachari, K.; Foresman, J. B.; Ortiz, J. V.;
Cui, Q.; Baboul, A. G.; Clifford, S.; Cioslowski, J.; Stefanov, B. B.; Liu, G.; Liashenko, A.;
Piskorz, P.; Komaromi, I.; Martin, R. L.; Fox, D. J.; Keith, T.; Al-Laham, M. A.; Peng, C. Y.;
Nanayakkara, A.; Challacombe, M.; Gill, P. M. W.; Johnson, B.; Chen, W.; Wong, M. W.;
Gonzalez, C.; Pople, J. A. Gaussian 03, revision C.02; Gaussian, Inc.: Wallingford, CT, 2004.
5. (a) Becje, A. D. J. Chem. Phys. 1993, 98, 5648. (b) Lee, C.; Yang, W.; Parr, R. G. Phys. Rev. B
1988, 37, 785.
6. Binkley, J. S.; Pople, J. A.; Hehre, W. J. J. Am. Chem. Soc. 1980, 102, 939.
7. (a) Petersson, G. A.; Al-Laham, M. A. J. Chem. Phys. 1991, 94, 6081. (b) Petersson, G. A.;
Bennett, A.; Tensfeldt, T. G.; Al-Laham, M. A.; Shirley, W. A.; Mangzaris, J. J. Chem. Phys.
1988, 89, 2193.
8. Altomare, A.; Burla, M. C.; Camalli, M.; Cascarano, G. L.; Giacovazzo, C.; Guagliardi, A.;
Moliterni, A. G. G.; Polidori, G.; Spagna, R. J. Appl. Crystallogr. 1999, 32, 115.
9. Sheldrick, G. M. SHELXL-97, Program for the Refinement of Crystal Structures, University of
Göttingen, Germany, 1997.
SI 44
10. Kobayashi, A.; Takehira, K.; Yoshihara, T.; Uchiyama, S.; Tobita, S. Photochem. Photobiol. Sci.
2012, 11, 1368‒1376.
11. Cheng, Y.-S.; Chen, C.-H.; Ho, Y.-J.; Chang, S.-W.; Witek, H. A.; Hsu, C.-S. Org. Lett. 2011, 13,
5484.
12. Biniek, L.; Bulut, I.; Lévêque, P.; Heiser, T.; Leclerc, N. Tetrahedron Lett. 2011, 52, 1811.