ΑΣΥΡΜΑΤΕΣ-ΔΟΡΥΦΟΡΙΚΕΣ_διάλεξη 9η
41
ΑΣΥΡΜΑΤΕΣ-ΔΟΡΥΦΟΡΙΚΕΣ ΕΠΙΚΟΙΝΩΝΙΕΣ Διδάσκων Λούβρος Σπυρίδων Επίκουρος Καθηγητής - ΤΕΣΥΔ ΔΙΑΛΕΞΗ 9 ΕΠΙΓΕΙΑ ΜΙΚΡΟΚΥΜΑΤΙΚΗ ΖΕΥΞΗ (MW LINK) – ΣΧΕΔΙΑΣΜΟΣ 3 ο Μέρος
-
Upload
ender-sali -
Category
Documents
-
view
221 -
download
0
Transcript of ΑΣΥΡΜΑΤΕΣ-ΔΟΡΥΦΟΡΙΚΕΣ_διάλεξη 9η
ΑΣΥΡΜΑΤΕΣ-ΔΟΡΥΦΟΡΙΚΕΣΕΠΙΚΟΙΝΩΝΙΕΣ
Διδάσκων
Λούβρος Σπυρίδων
Επίκουρος Καθηγητής - ΤΕΣΥΔ
ΔΙΑΛΕΞΗ 9
ΕΠΙΓΕΙΑ ΜΙΚΡΟΚΥΜΑΤΙΚΗ ΖΕΥΞΗ (MW LINK) – ΣΧΕΔΙΑΣΜΟΣ 3ο Μέρος
Σχεδιασμός Μικροκυματικής Ζεύξης κοντινής απόστασης- Short-haul microwave radio design
Μικροκυματική μετάδοση υπό συνθήκες καναλιού ελεύθερες από κατακρυμνήσεις σήματος ισχύος (non-Fading Conditions)
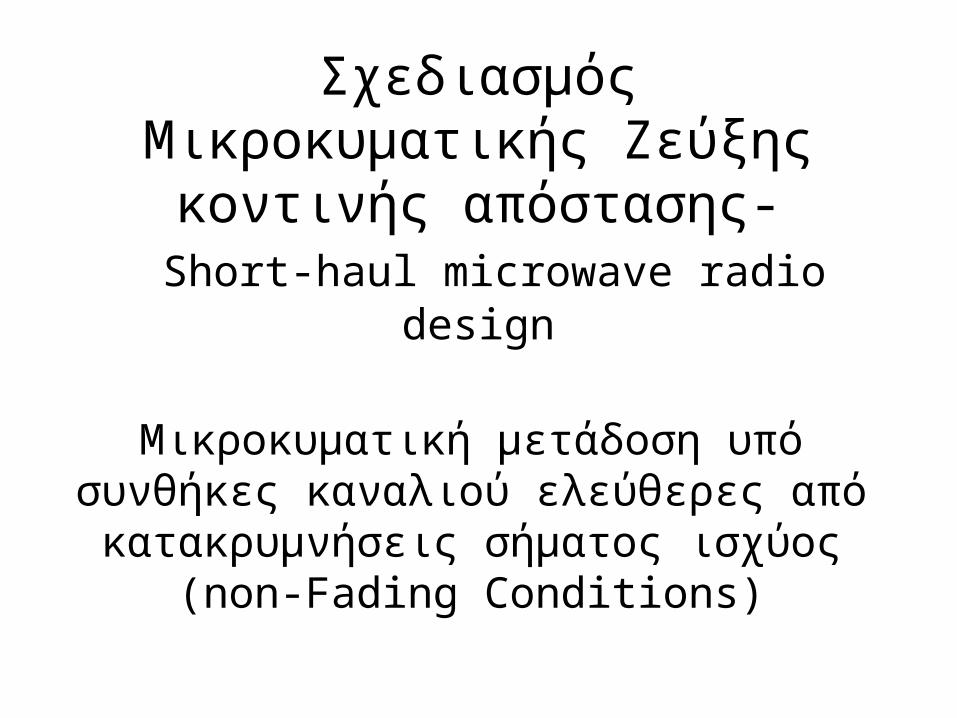
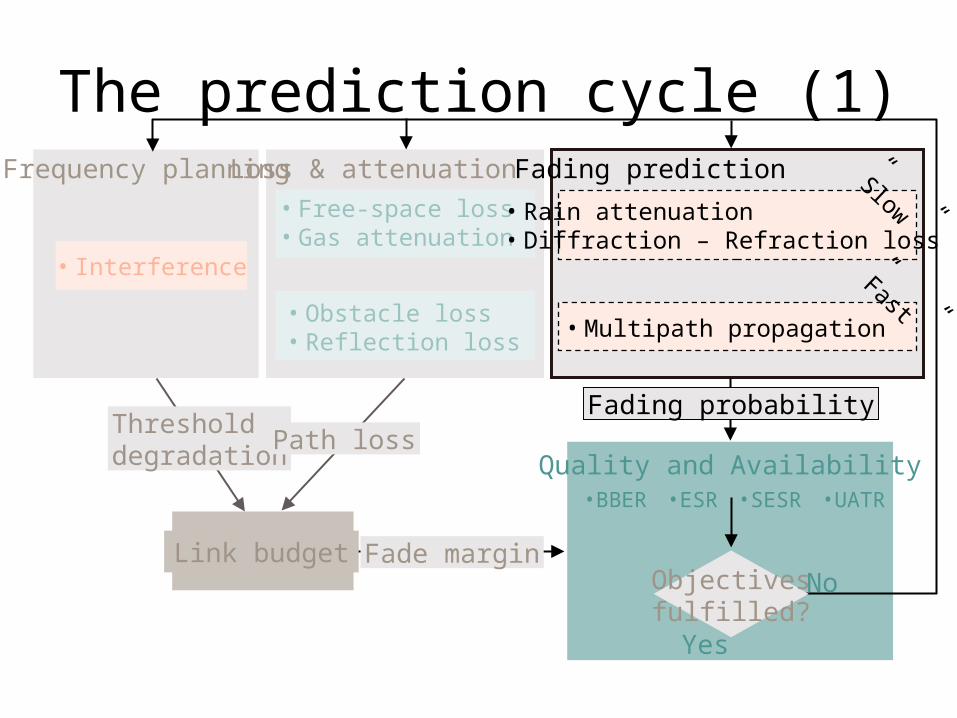
The prediction cycle (1)
• Free-space loss• Gas attenuation
Link budget
• Rain attenuation• Diffraction – Refraction loss
• Multipath propagation
Quality and Availability
• Interference
”Slow”
”Fast”+
• Obstacle loss• Reflection loss
•BBER •ESR •SESR •UATR
Frequency planningLoss & attenuation Fading prediction
Fade marginObjectivesfulfilled?
No
Yes
Thresholddegradation
Fading probabilityPath loss
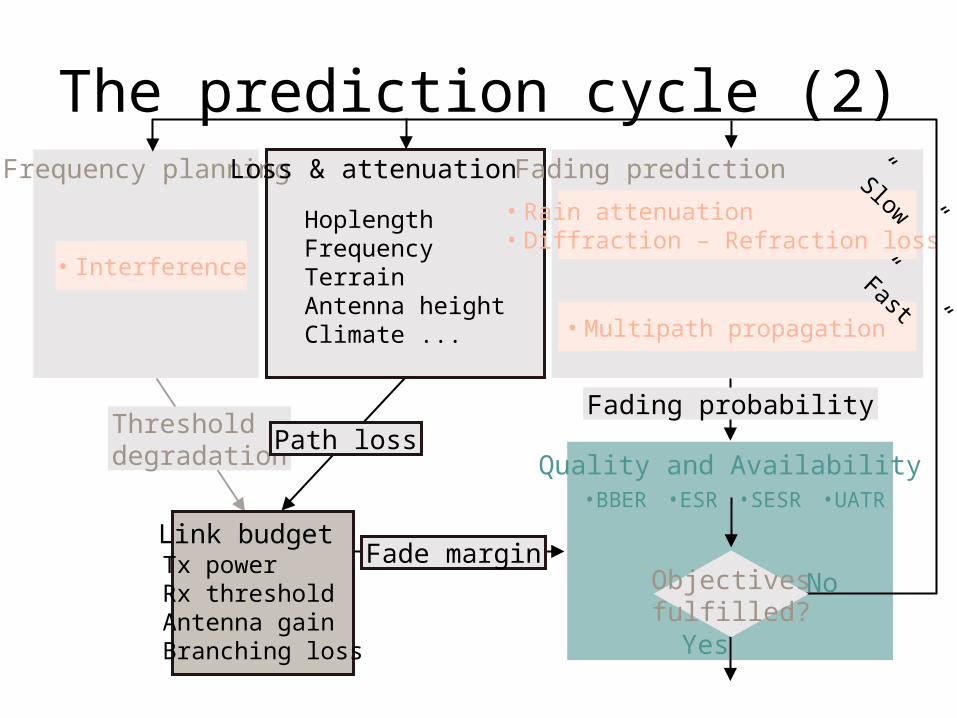
The prediction cycle (2)
• Rain attenuation• Diffraction – Refraction loss
• Multipath propagation
Quality and Availability
• Interference
”Slow”
”Fast”
•BBER •ESR •SESR •UATR
Frequency planningLoss & attenuation Fading prediction
Fade marginObjectivesfulfilled?
No
Yes
Thresholddegradation
Fading probabilityPath loss
Link budget
HoplengthFrequencyTerrainAntenna heightClimate ...
Tx powerRx thresholdAntenna gainBranching loss
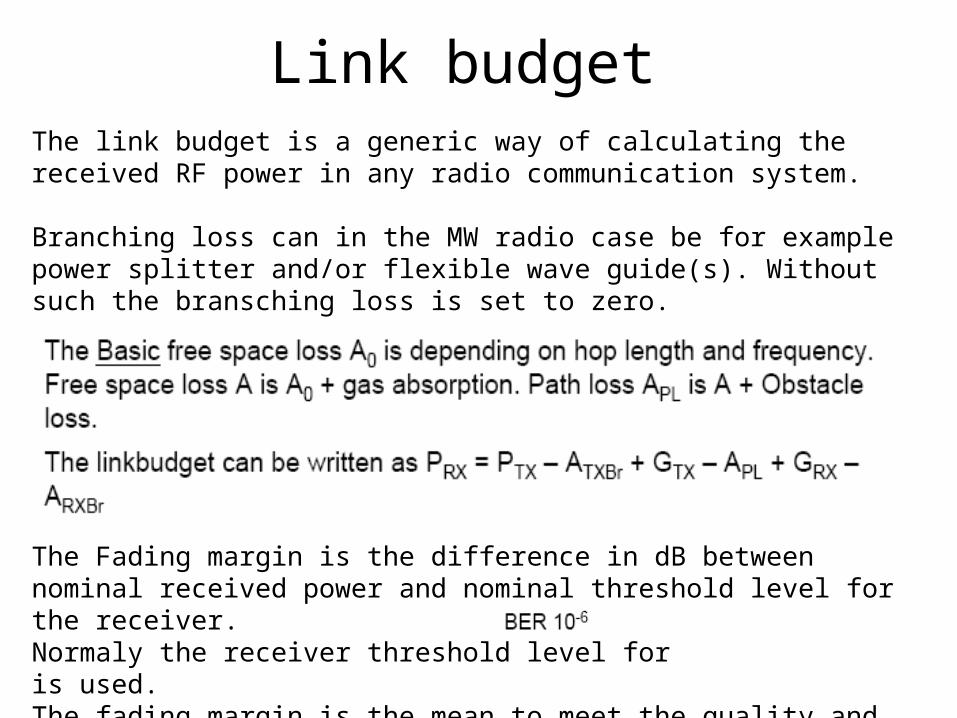
Link budget The link budget is a generic way of calculating the received RF power in any radio communication system.
Branching loss can in the MW radio case be for example power splitter and/or flexible wave guide(s). Without such the bransching loss is set to zero.
The Fading margin is the difference in dB between nominal received power and nominal threshold level for the receiver. Normaly the receiver threshold level for is used. The fading margin is the mean to meet the quality and availability objectives in fading conditions.
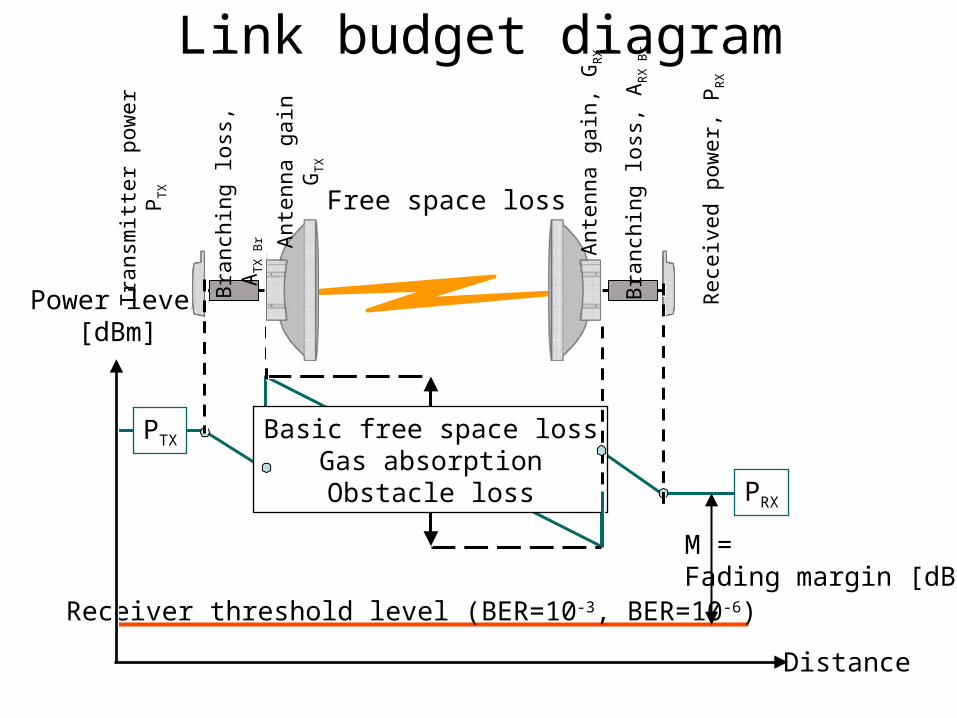
Link budget diagram
M = Fading margin [dB]
Receiver threshold level (BER=10-3, BER=10-6)
Distance
Basic free space lossGas absorptionObstacle loss
Power level[dBm]
PTX
PRX
Bra
nchi
ng lo
ss,
ATX
Br
Free space loss
Ant
enna
gai
nG
TX
Ant
enna
gai
n, G
RX
Tran
smitt
er p
ower
PTX
Rec
eive
d po
wer
, PR
X
Bra
nchi
ng lo
ss, A
RX
Br
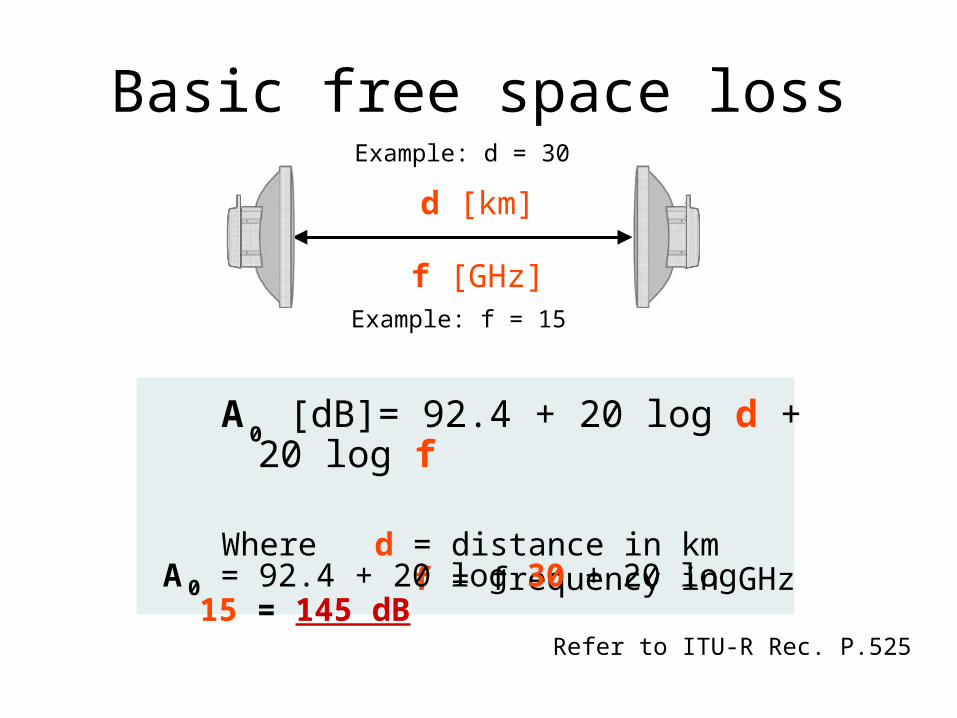
Basic free space loss
d [km]
f [GHz]
A [dB]= 92.4 + 20 log d + 20 log f
Where d = distance in km f = frequency in GHz
0
A = 92.4 + 20 log 30 + 20 log 15 = 145 dB0
Refer to ITU-R Rec. P.525
Example: f = 15
Example: d = 30
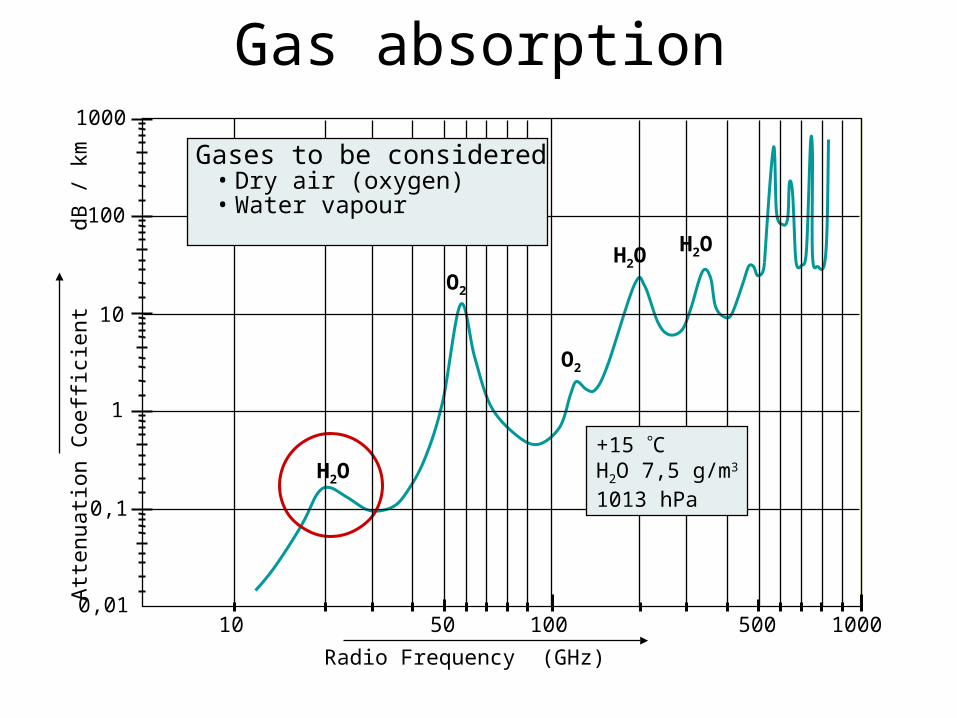
Gas absorption
H2O
O2
O2
H2OH2O
Radio Frequency (GHz)10 50 100 1000500
1000
100
10
1
0,1
0,01
+15 CH2O 7,5 g/m3
1013 hPa
Gases to be considered• Dry air (oxygen) • Water vapour
Atte
nuat
ion
Coe
ffici
ent
d
B /
km
Gas absorption
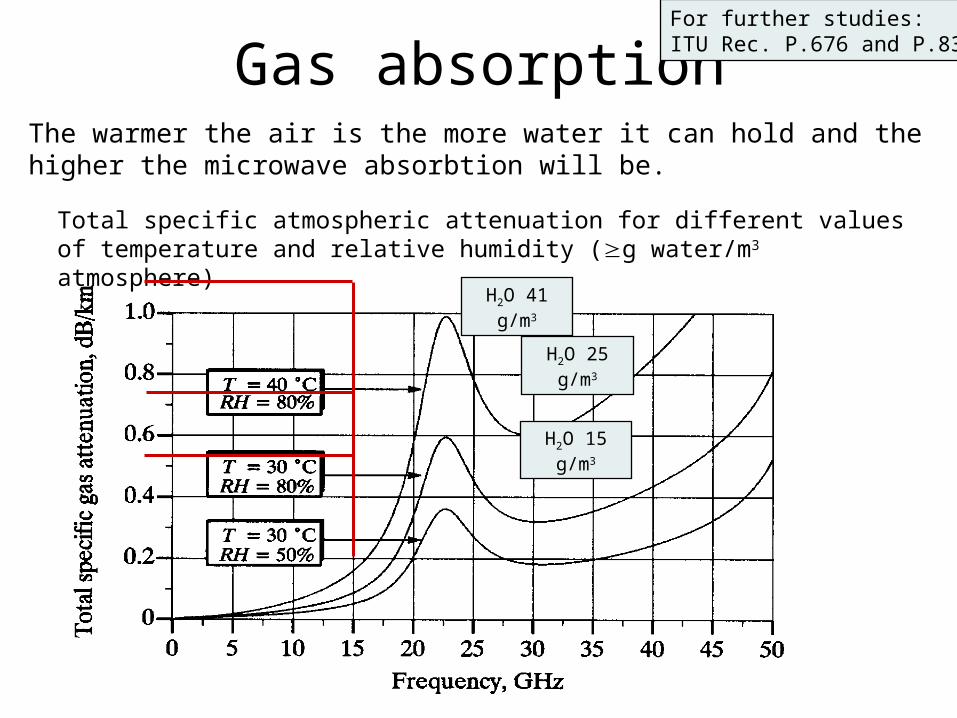
Total specific atmospheric attenuation for different values of temperature and relative humidity (g water/m3 atmosphere)
H2O 41 g/m3
H2O 25 g/m3
H2O 15 g/m3
For further studies:ITU Rec. P.676 and P.836
The warmer the air is the more water it can hold and the higher the microwave absorbtion will be.
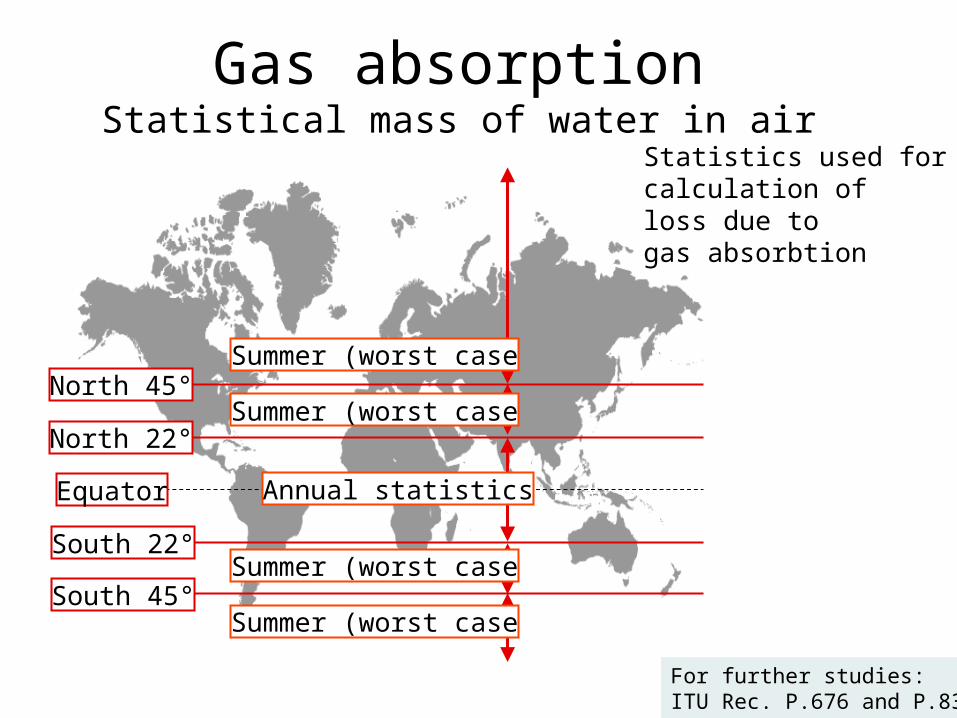
Gas absorptionStatistical mass of water in air
For further studies:ITU Rec. P.676 and P.836
Equator
South 22°
North 22°
South 45°
North 45°
Annual statistics
Summer (worst case
Summer (worst case
Summer (worst case
Summer (worst case
Statistics used forcalculation of loss due togas absorbtion
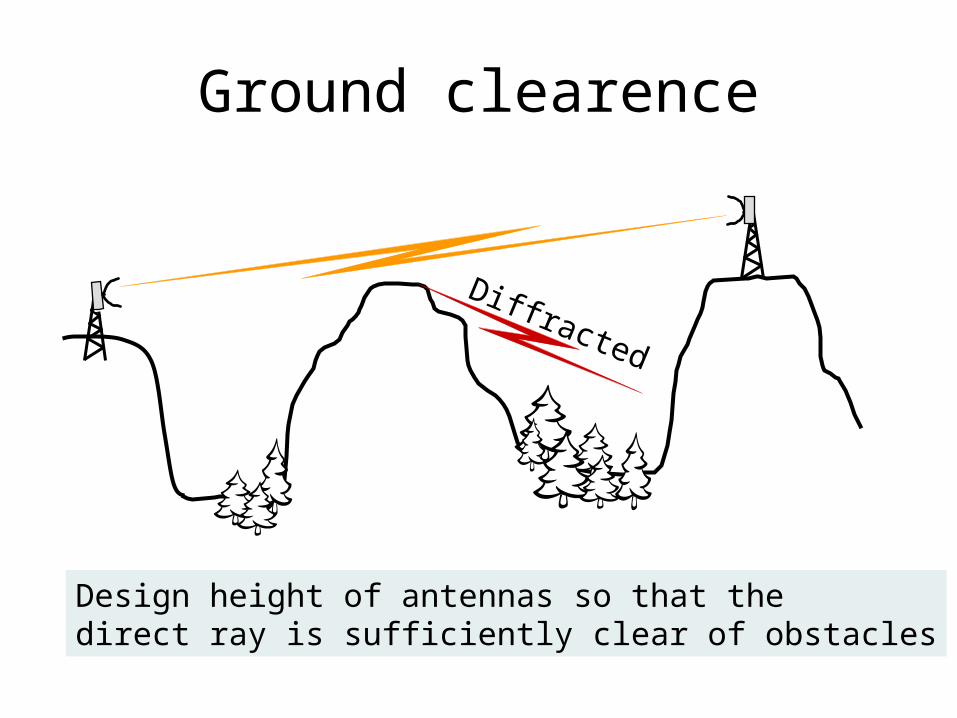
Ground clearence
Diffracted
Design height of antennas so that thedirect ray is sufficiently clear of obstacles
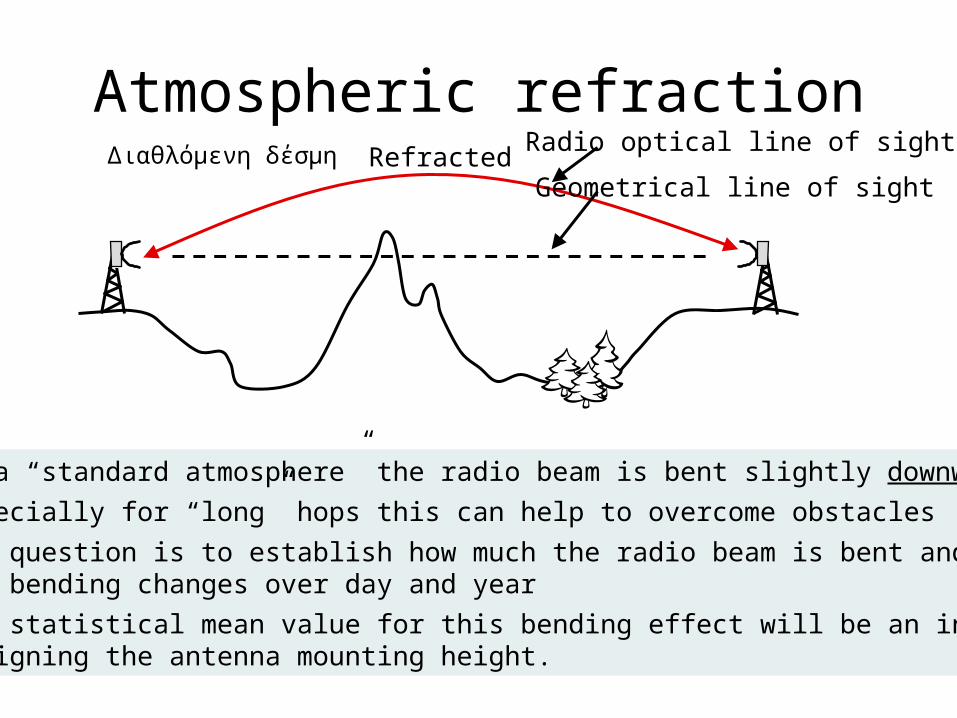
Atmospheric refractionGeometrical line of sight
Radio optical line of sightRefracted
• In a “standard atmosphere” the radio beam is bent slightly downwards.• Especially for “long” hops this can help to overcome obstacles• The question is to establish how much the radio beam is bent and how
the bending changes over day and year• The statistical mean value for this bending effect will be an input to
designing the antenna mounting height.
Διαθλόμενη δέσμη
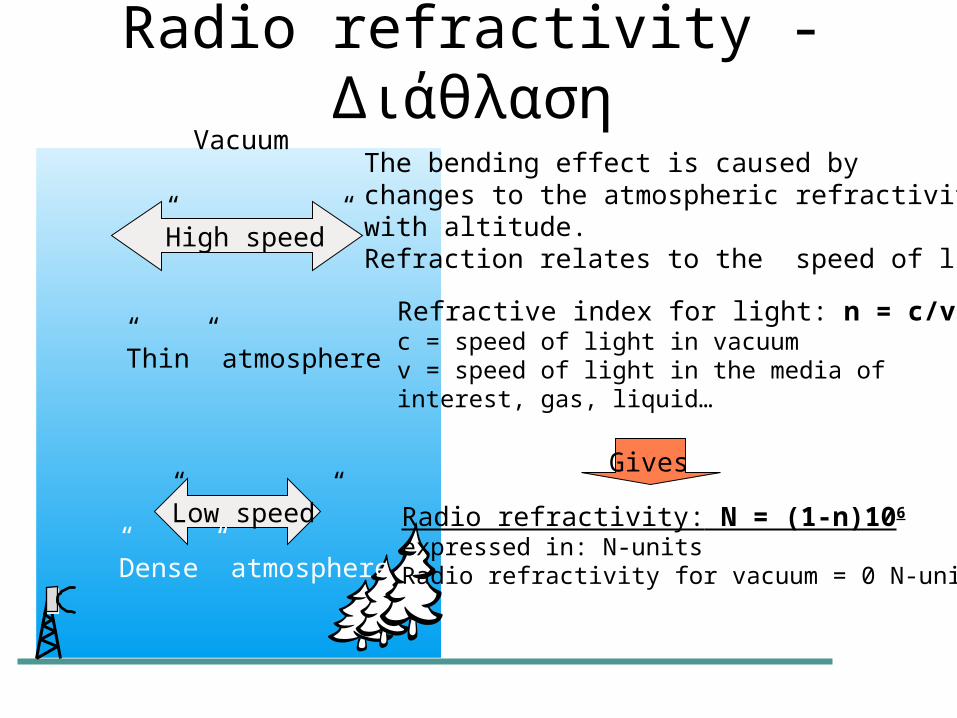
Radio refractivity - ΔιάθλασηThe bending effect is caused by changes to the atmospheric refractivity with altitude.Refraction relates to the speed of light:
Refractive index for light: n = c/vc = speed of light in vacuumv = speed of light in the media of interest, gas, liquid…
Radio refractivity: N = (1-n)106
expressed in: N-unitsRadio refractivity for vacuum = 0 N-units
”Low speed”
”High speed”
Gives
Vacuum
”Thin” atmosphere
”Dense” atmosphere
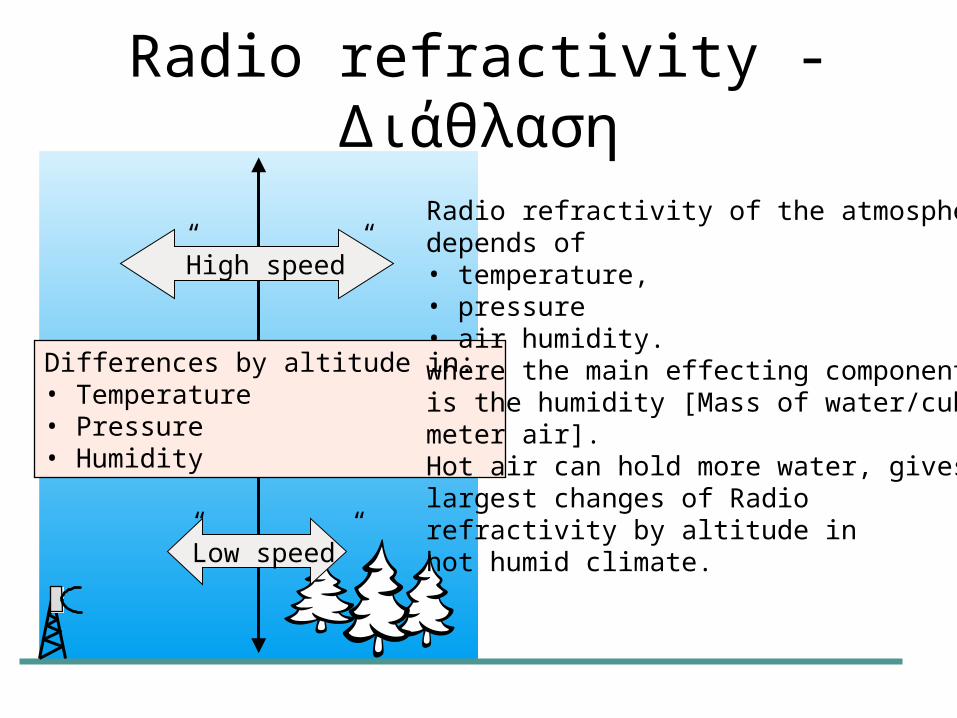
Differences by altitude in:• Temperature• Pressure• Humidity
”Low speed”
”High speed”
Radio refractivity of the atmosphere depends of • temperature, • pressure• air humidity.where the main effecting component is the humidity [Mass of water/cubicmeter air].Hot air can hold more water, giveslargest changes of Radio refractivity by altitude in hot humid climate.
Radio refractivity - Διάθλαση
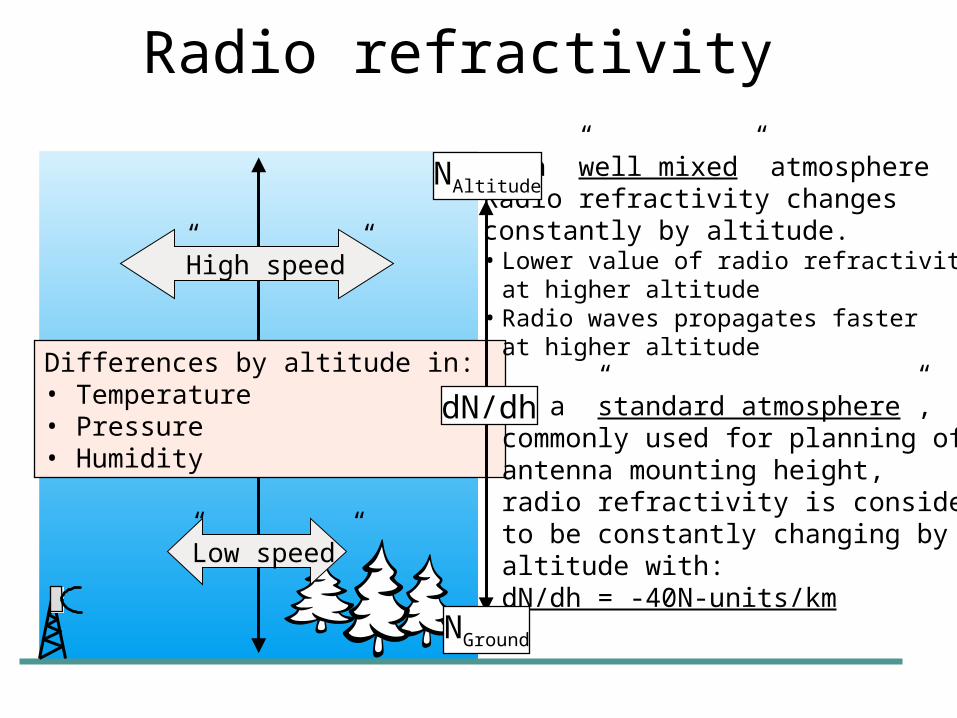
Radio refractivity
Differences by altitude in:• Temperature• Pressure• Humidity
”Low speed”
”High speed”
In a ”well mixed” atmosphereRadio refractivity changesconstantly by altitude.• Lower value of radio refractivity
at higher altitude• Radio waves propagates faster
at higher altitude
• In a ”standard atmosphere”, commonly used for planning of antenna mounting height,radio refractivity is consideredto be constantly changing by altitude with: dN/dh = -40N-units/km
NAltitude
NGround
dN/dh
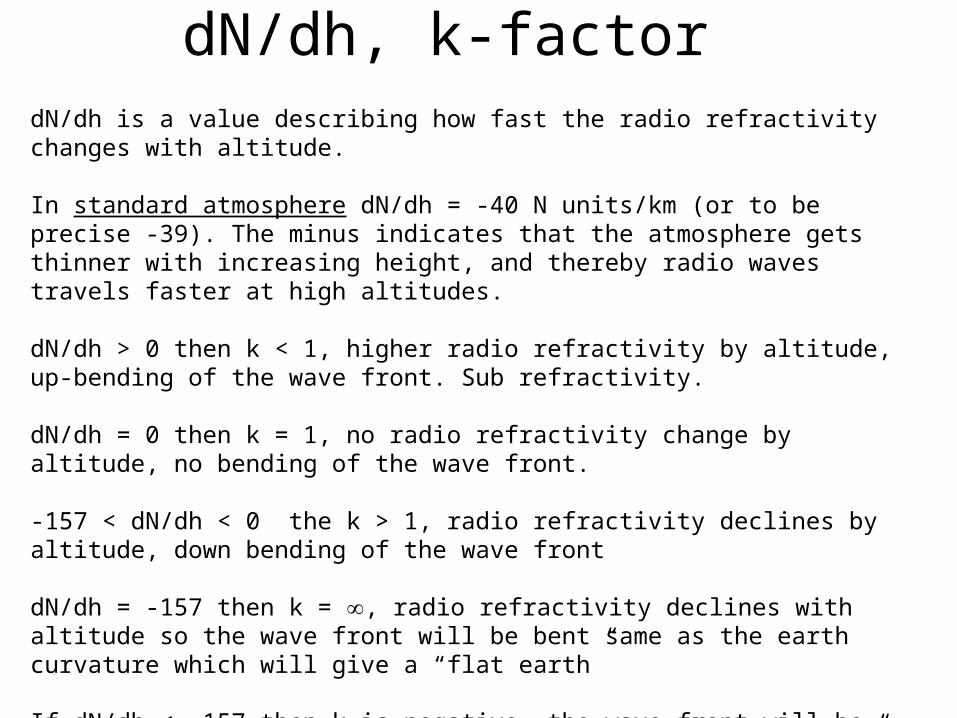
dN/dh, k-factordN/dh is a value describing how fast the radio refractivity changes with altitude.
In standard atmosphere dN/dh = -40 N units/km (or to be precise -39). The minus indicates that the atmosphere gets thinner with increasing height, and thereby radio waves travels faster at high altitudes.
dN/dh > 0 then k < 1, higher radio refractivity by altitude, up-bending of the wave front. Sub refractivity.
dN/dh = 0 then k = 1, no radio refractivity change by altitude, no bending of the wave front.
-157 < dN/dh < 0 the k > 1, radio refractivity declines by altitude, down bending of the wave front
dN/dh = -157 then k = , radio refractivity declines with altitude so the wave front will be bent same as the earth curvature which will give a “flat earth”
If dN/dh < -157 then k is negative, the wave front will be bent more than the earth curvature and will “hit the earth”. Super refractivity or ducting.
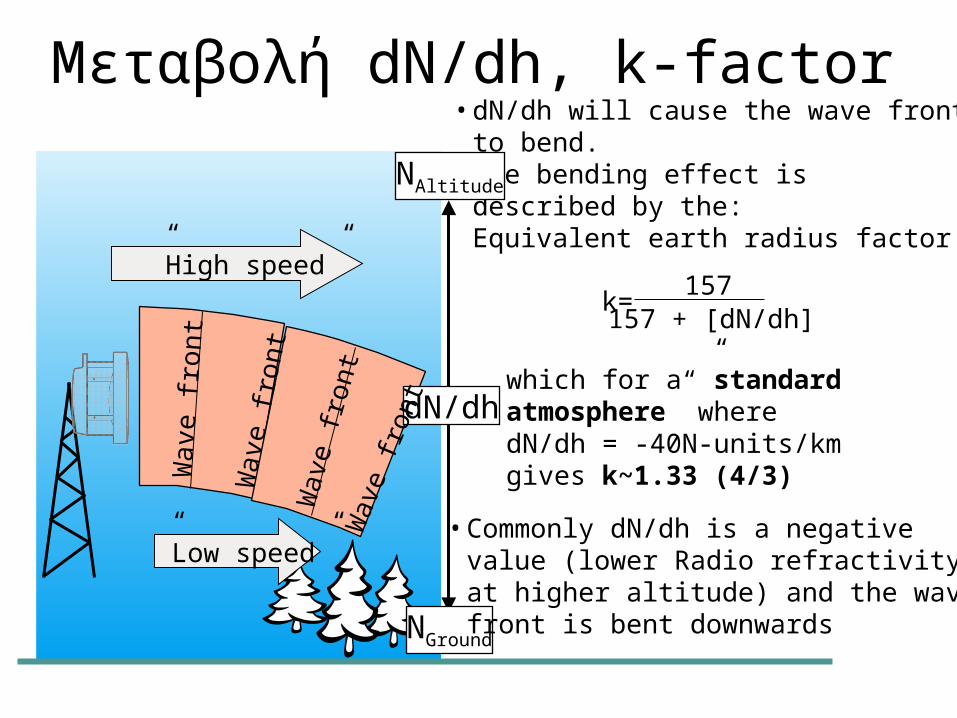
Μεταβολή dN/dh, k-factor• dN/dh will cause the wave front
to bend.• The bending effect is
described by the: Equivalent earth radius factor:
”Low speed”
”High speed”
NAltitude
NGround
dN/dh
Wav
e fro
nt
Wav
e fro
ntW
ave
front
Wav
e fro
nt
k= 157157 + [dN/dh]
which for a ”standard atmosphere” where dN/dh = -40N-units/km gives k~1.33 (4/3)
• Commonly dN/dh is a negative value (lower Radio refractivityat higher altitude) and the wave front is bent downwards
dN/dh, k-factor
0453-045
FIGURE 4
Monthly mean values of N: February
FIGURE 5
Monthly mean values of N: May
February
May
0453-067
FIGURE 6
Monthly mean values of N: August
FIGURE 7
Monthly mean values of N: November
August
November
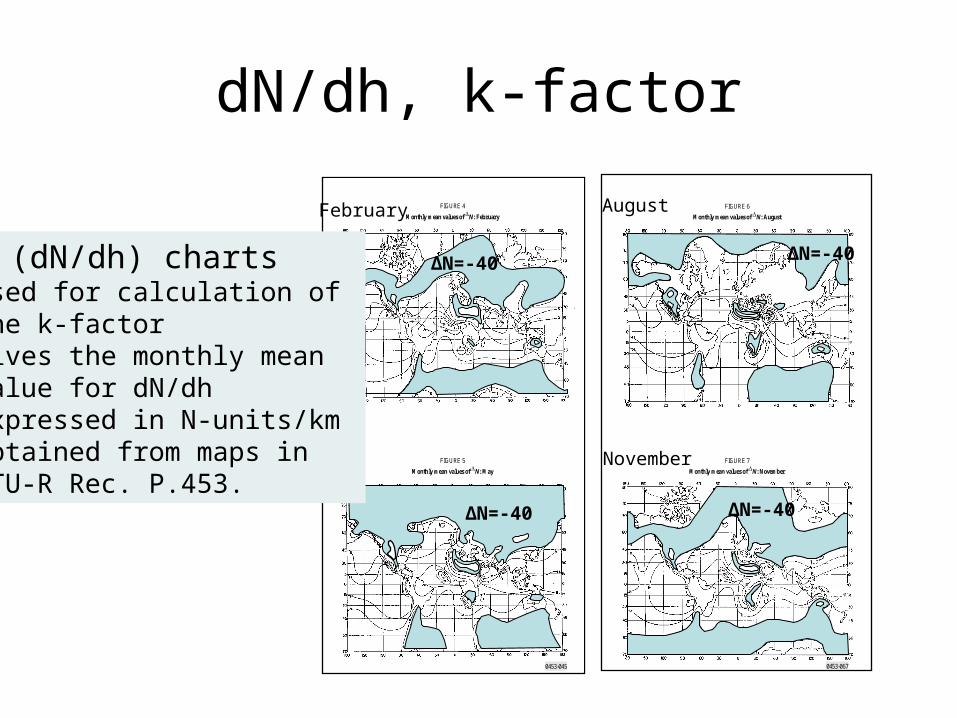
ΔN=-40ΔN (dN/dh) charts• Used for calculation of
the k-factor • Gives the monthly mean
value for dN/dh• Expressed in N-units/km• Obtained from maps in
ITU-R Rec. P.453. ΔN=-40
ΔN=-40
ΔN=-40
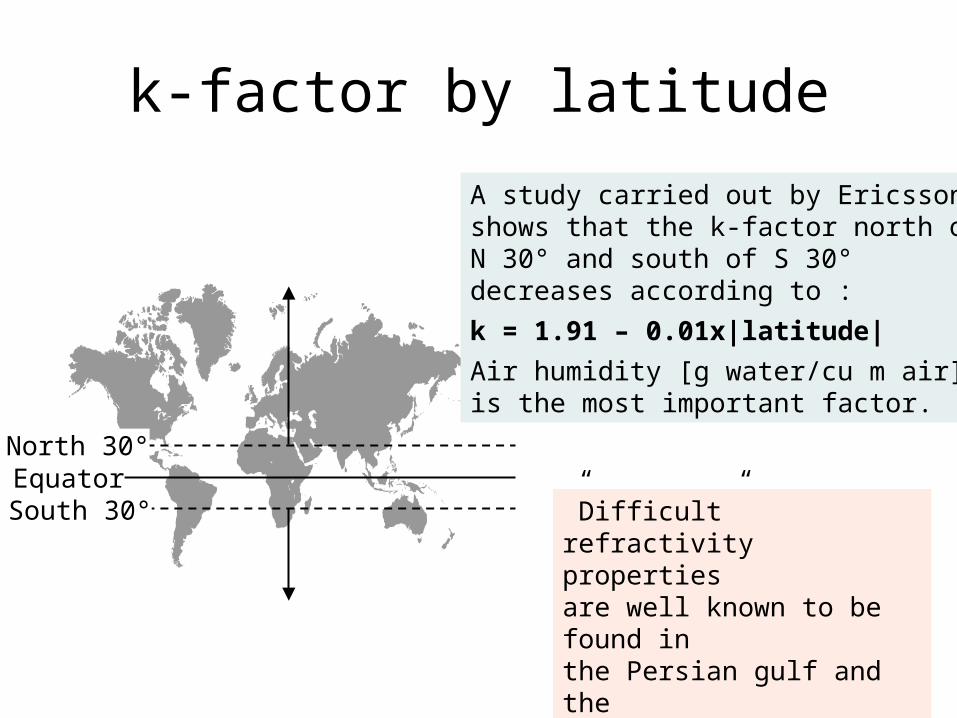
k-factor by latitude
EquatorSouth 30°
North 30°
A study carried out by Ericssonshows that the k-factor north of N 30° and south of S 30° decreases according to :k = 1.91 – 0.01x|latitude|Air humidity [g water/cu m air]is the most important factor.
”Difficult” refractivity propertiesare well known to be found in the Persian gulf and thewest coast of Africa.
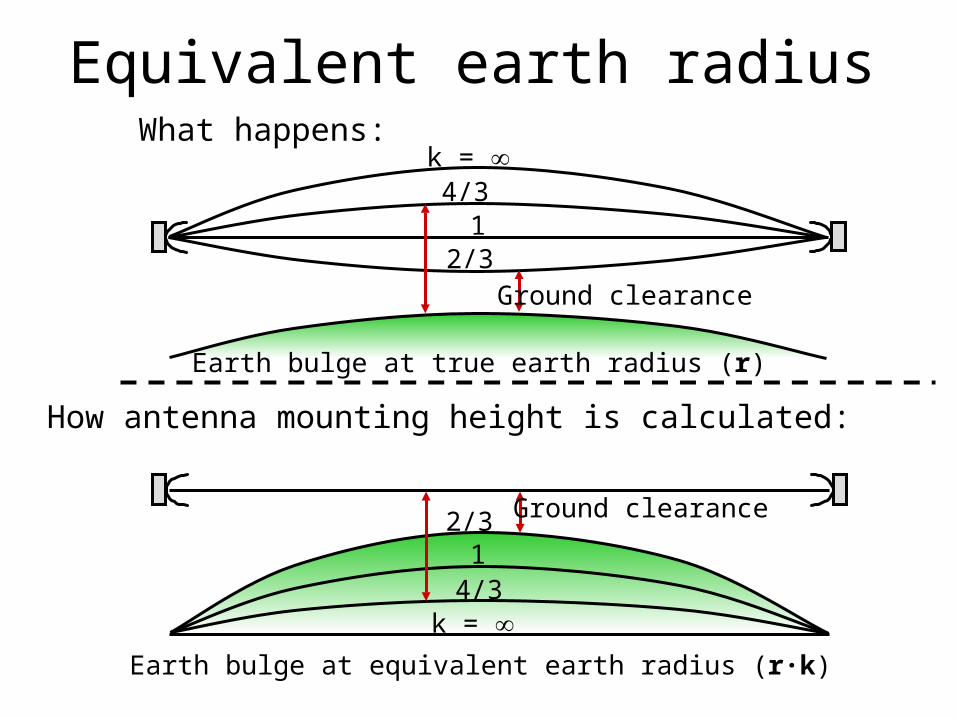
Equivalent earth radiusk = 4/3
12/3
Earth bulge at true earth radius (r)
Ground clearance
2/3
4/31
k = Earth bulge at equivalent earth radius (r·k)
Ground clearance
What happens:
How antenna mounting height is calculated:
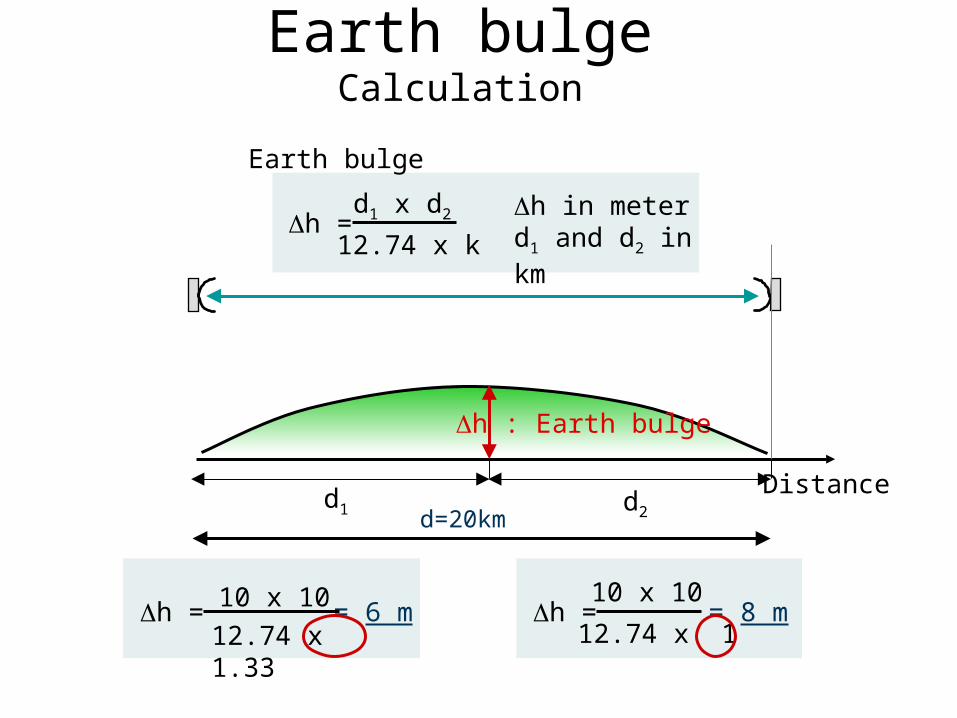
Earth bulgeCalculation
Distanced1 d2
h : Earth bulge
d=20km
h =12.74 x kd1 x d2 h in meter
d1 and d2 in km
h =12.74 x 110 x 10
= 8 m= 6 mh = 10 x 1012.74 x 1.33
Earth bulge
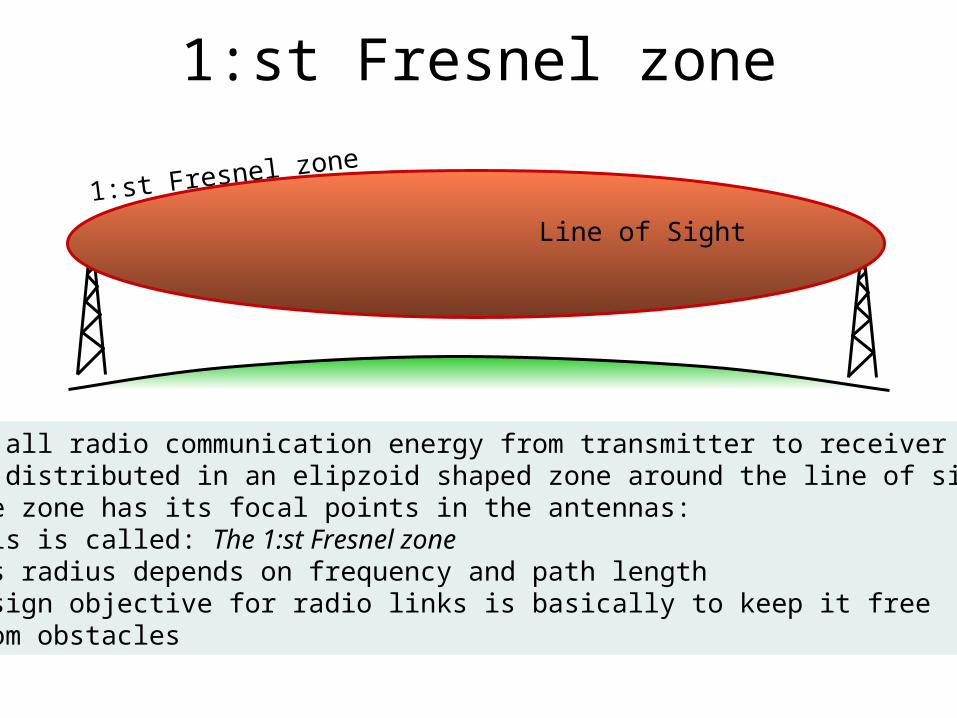
1:st Fresnel zone
1:st Fresnel zone
• In all radio communication energy from transmitter to receiver is distributed in an elipzoid shaped zone around the line of sight.The zone has its focal points in the antennas:This is called: The 1:st Fresnel zone
• Its radius depends on frequency and path length• Design objective for radio links is basically to keep it free
from obstacles
Line of Sight
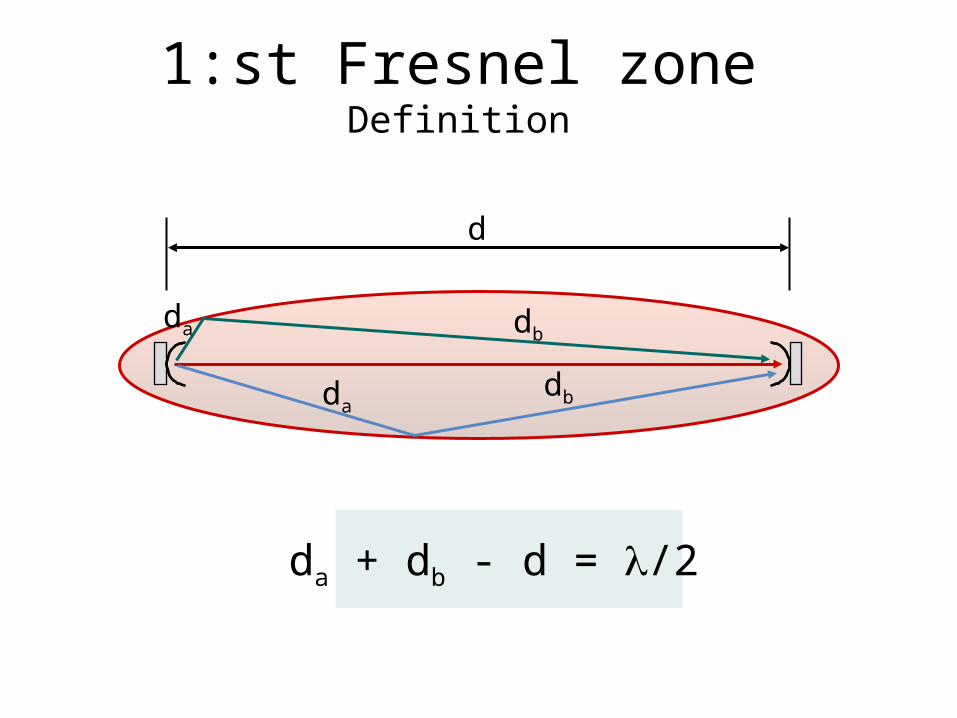
1:st Fresnel zoneDefinition
dadb
d
da + db - d = /2
dbda
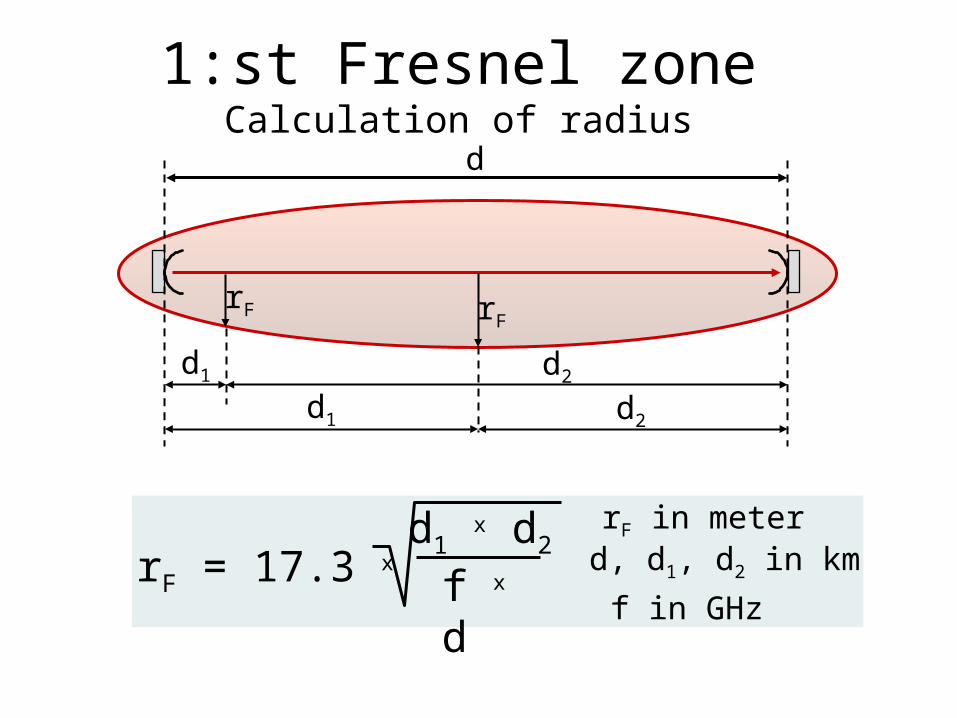
1:st Fresnel zoneCalculation of radius
d
d1 x d2
f x drF = 17.3 x
rF in meterd, d1, d2 in kmf in GHz
rFrF
d1 d2
d1 d2
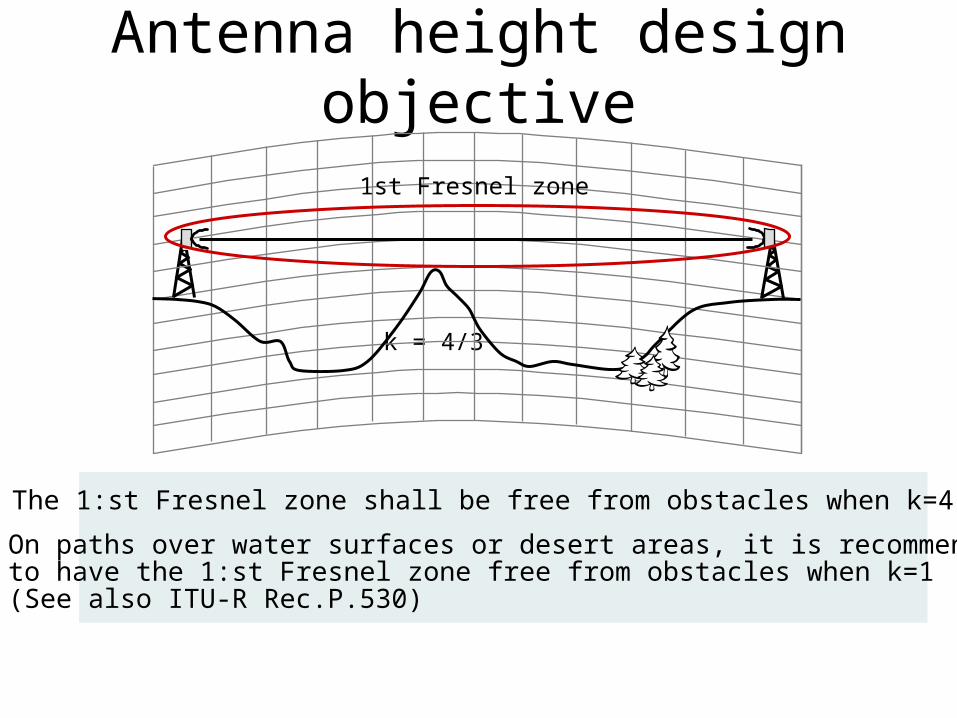
Antenna height design objective
1 The 1:st Fresnel zone shall be free from obstacles when k=4/3
2 On paths over water surfaces or desert areas, it is recommended to have the 1:st Fresnel zone free from obstacles when k=1(See also ITU-R Rec.P.530)
k = 4/3
1st Fresnel zone
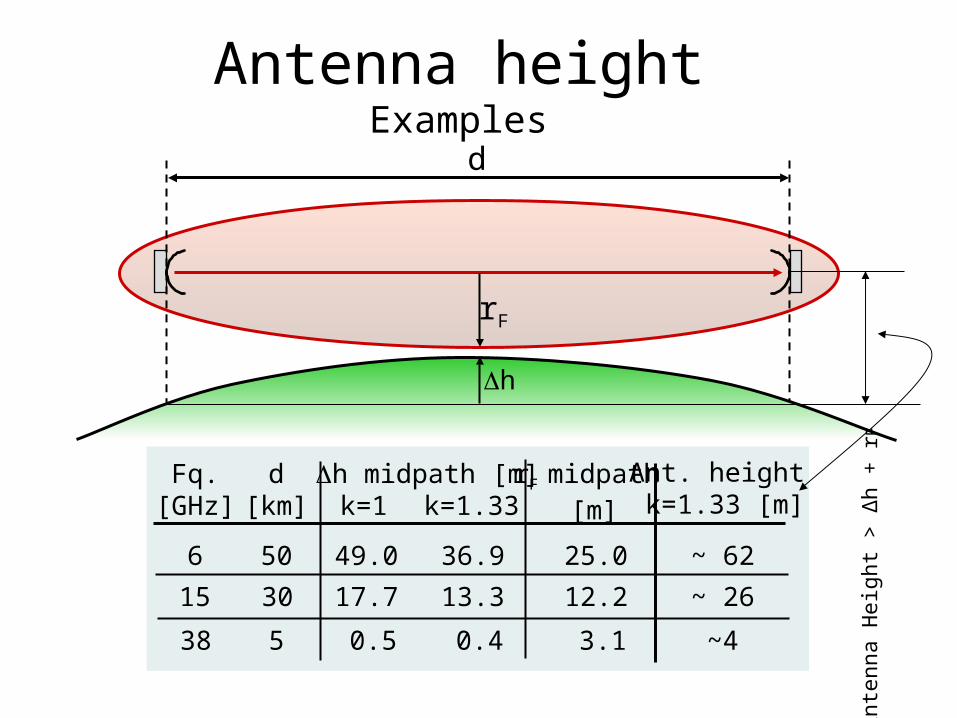
Antenna heightExamples
d
rF
h
Fq.[GHz]
d[km]
h midpath [m]k=1 k=1.33
rF midpath [m]
615
38
5030
5
25.012.2
3.1
36.949.017.7 13.3
0.40.5
Ant. height k=1.33 [m]
~ 62~ 26
~4
Ant
enna
Hei
ght >
Δh
+ rF
Σχεδιασμός Μικροκυματικής Ζεύξης κοντινής απόστασης- Short-haul microwave radio design
Μικροκυματική μετάδοση υπό συνθήκες καναλιού με κατακρυμνήσεις σήματος
ισχύος (Fading Conditions)
The prediction cycle (1)
• Free-space loss• Gas attenuation
Link budget
• Rain attenuation• Diffraction – Refraction loss
• Multipath propagation
Quality and Availability
• Interference
”Slow”
”Fast”• Obstacle loss• Reflection loss
•BBER •ESR •SESR •UATR
Frequency planningLoss & attenuation Fading prediction
Fade marginObjectivesfulfilled?
No
Yes
Thresholddegradation
Fading probabilityPath loss
Definition of fading
• Variation in signal strength, phase or polarisation• Attenuation that is changing temporarily
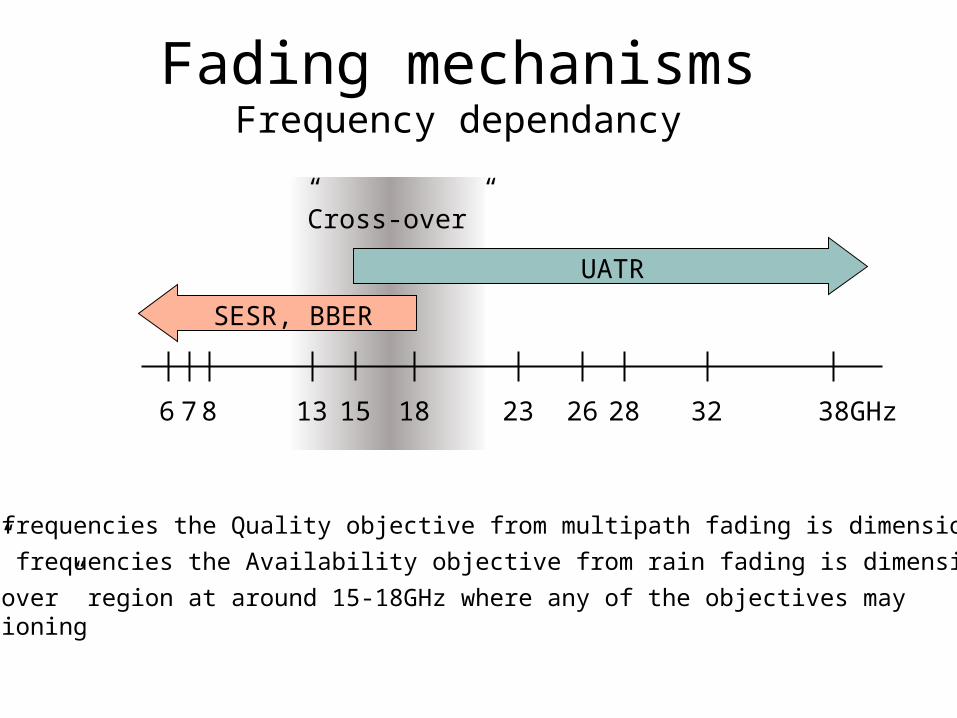
Fading mechanismsFrequency dependancy
6 7 8 13 15 18 23 26 28 32 38GHz
UATR
SESR, BBER
”Cross-over”
• At ”low” frequencies the Quality objective from multipath fading is dimensioning.• At ”high” frequencies the Availability objective from rain fading is dimensioning.• A ”cross-over” region at around 15-18GHz where any of the objectives may
be dimensioning
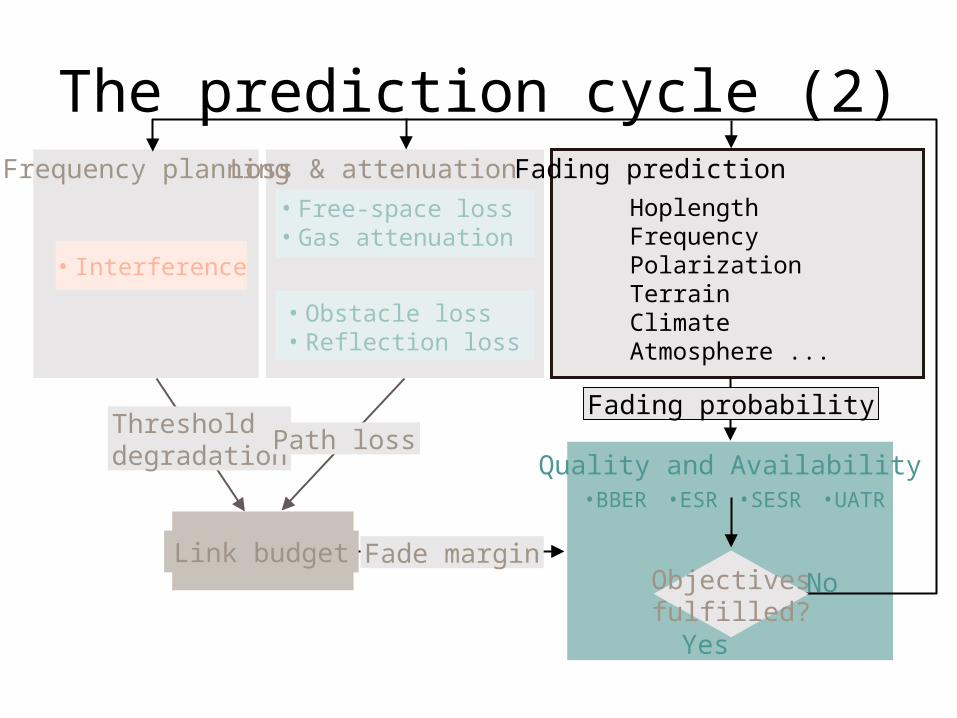
The prediction cycle (2)
• Free-space loss• Gas attenuation
Link budget
Quality and Availability
• Interference
• Obstacle loss• Reflection loss
•BBER •ESR •SESR •UATR
Frequency planningLoss & attenuation Fading prediction
Fade marginObjectivesfulfilled?
No
Yes
Thresholddegradation
Fading probabilityPath loss
HoplengthFrequencyPolarizationTerrainClimateAtmosphere ...
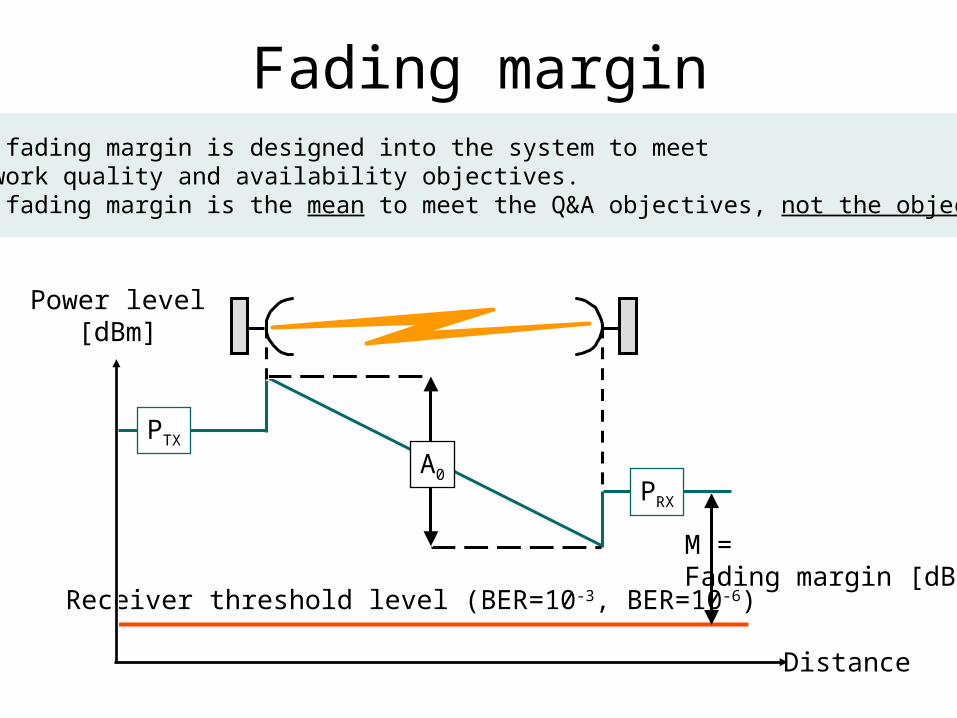
Fading margin• The fading margin is designed into the system to meet
network quality and availability objectives.• The fading margin is the mean to meet the Q&A objectives, not the objective.
M = Fading margin [dB]
Receiver threshold level (BER=10-3, BER=10-6)
Distance
A0
Power level[dBm]
PTX
PRX
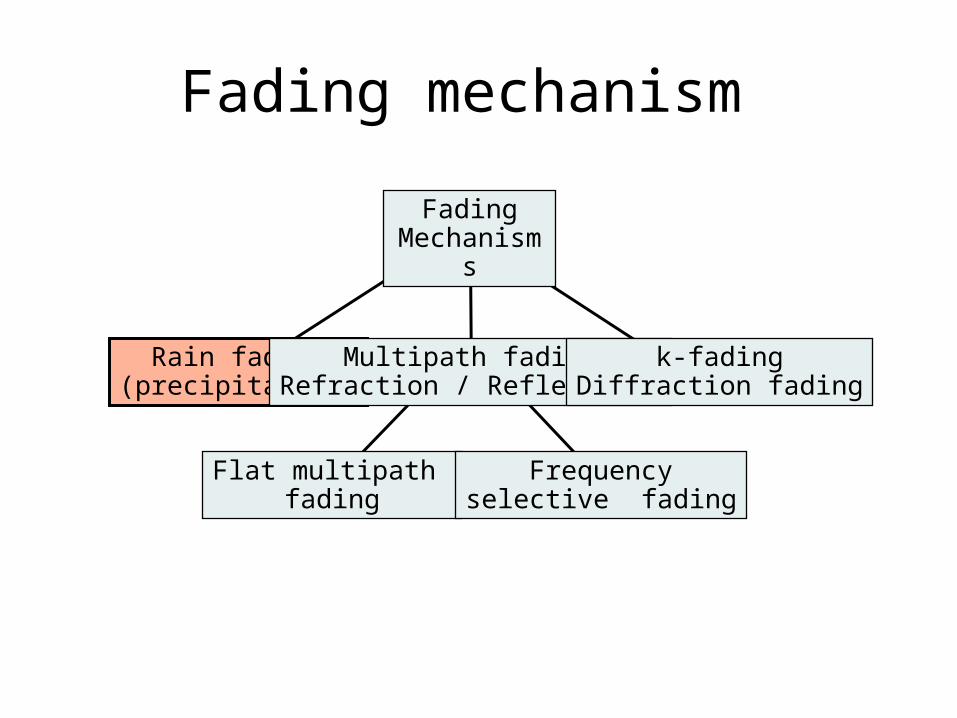
Fading mechanism
Flat multipath fading
Frequencyselective fading
Rain fading(precipitation)
Multipath fadingRefraction / Reflections
k-fadingDiffraction fading
FadingMechanisms
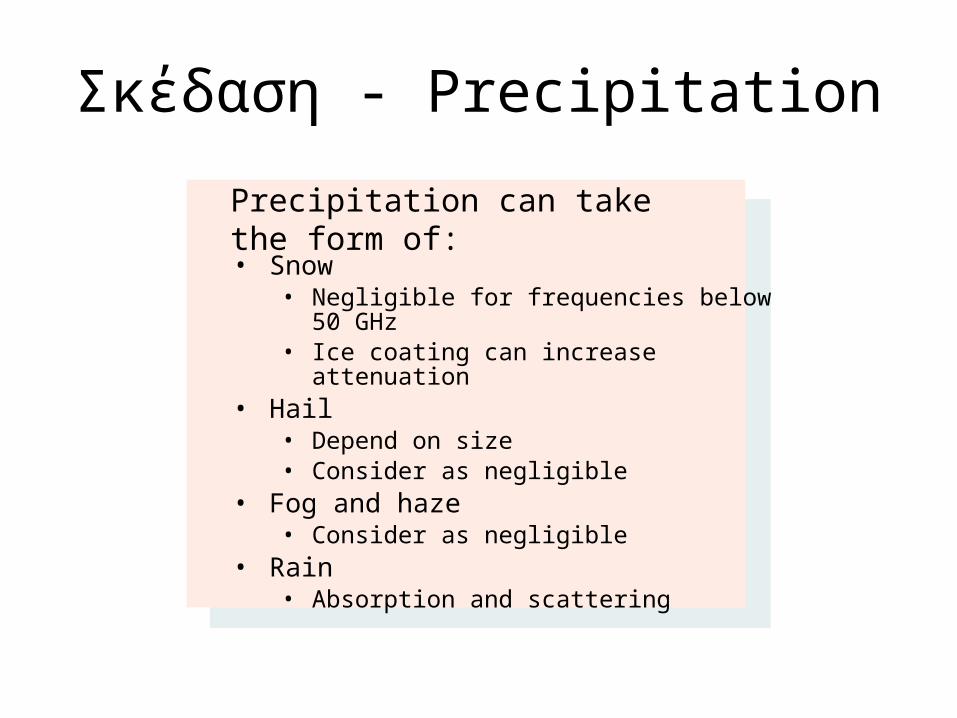
Σκέδαση - Precipitation
Precipitation can take the form of:• Snow
• Negligible for frequencies below 50 GHz• Ice coating can increase attenuation
• Hail• Depend on size• Consider as negligible
• Fog and haze• Consider as negligible
• Rain• Absorption and scattering
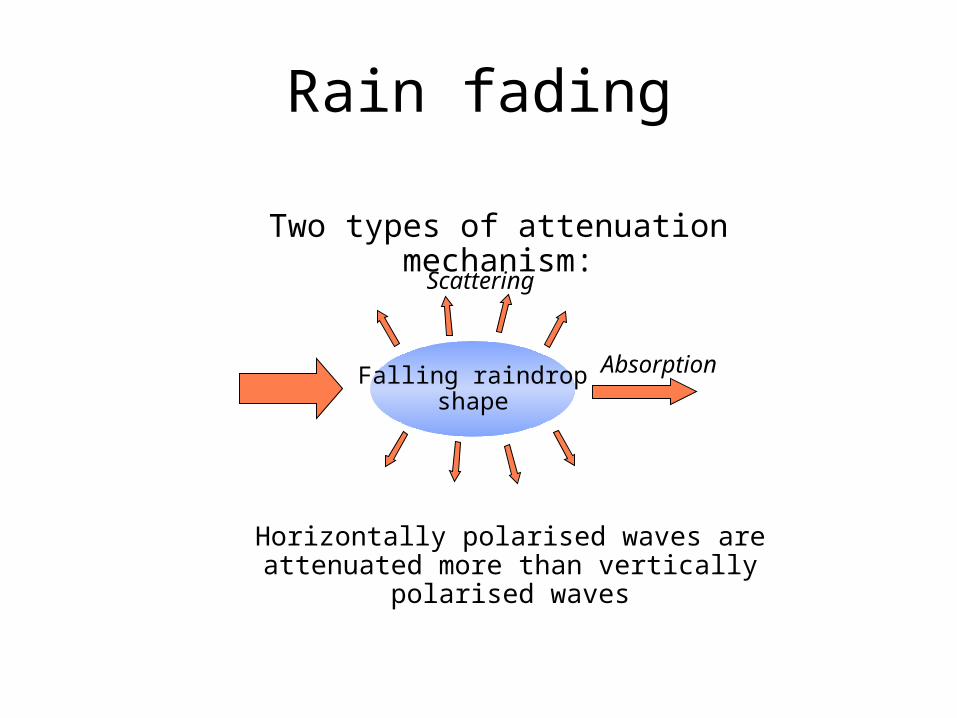
Rain fading
Falling raindropshape
Two types of attenuation mechanism:
Horizontally polarised waves are attenuated more than vertically polarised waves
Absorption
Scattering
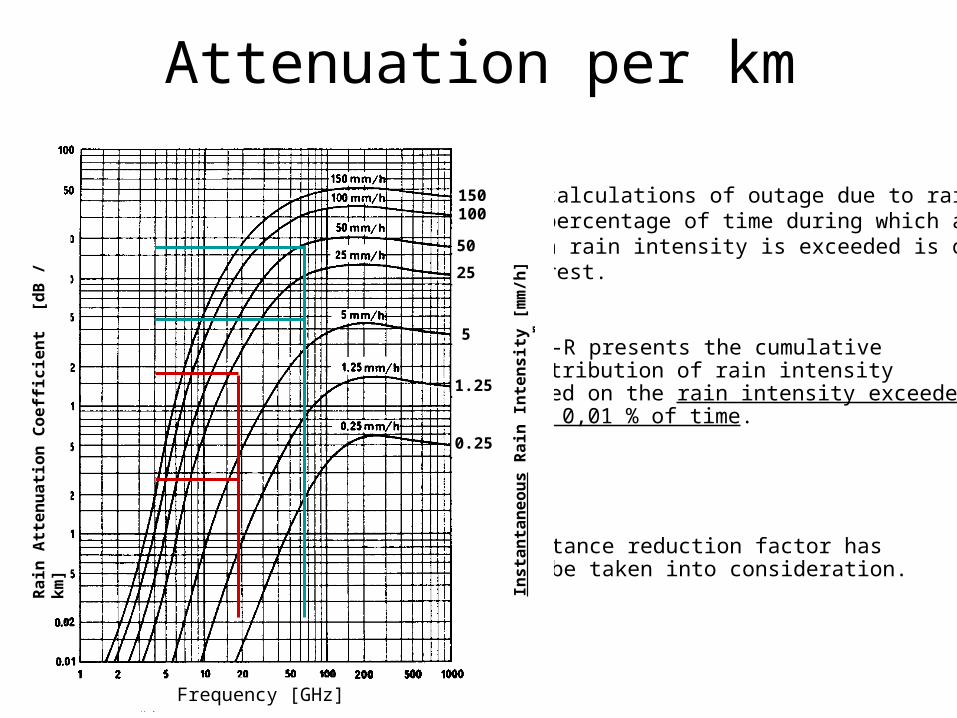
Attenuation per km
ITU-R presents the cumulative distribution of rain intensity based on the rain intensity exceeded for 0,01 % of time.
Distance reduction factor has to be taken into consideration.
For calculations of outage due to rain, the percentage of time during which a given rain intensity is exceeded is of interest.
Rai
n A
ttenu
atio
n C
oeffi
cien
t [d
B /
km]
150100
5025
5
1.25
0.25
Frequency [GHz]
Inst
anta
neou
s R
ain
Inte
nsity
[mm
/h]
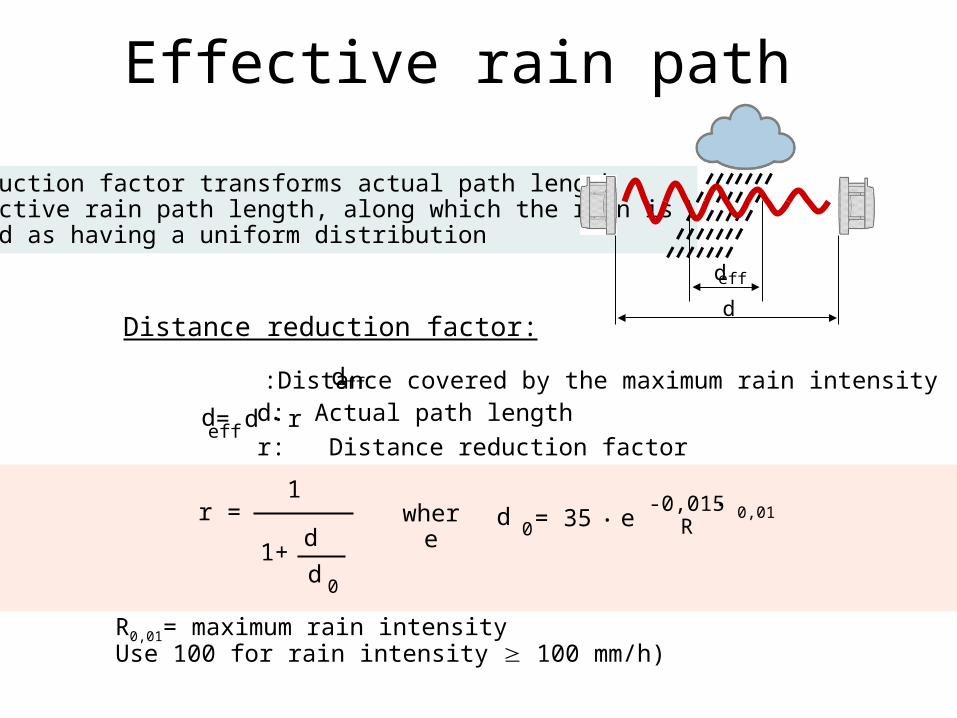
Effective rain path
The reduction factor transforms actual path lengthto effective rain path length, along which the rain is regarded as having a uniform distribution
Distance reduction factor:
effd = d r . d: Actual path length
r: Distance reduction factor
r = 1
1+0d
d 0d = 35 e. -0,015 R. 0,01where
R0,01= maximum rain intensityUse 100 for rain intensity 100 mm/h)
effd:Distance covered by the maximum rain intensity
effd
d
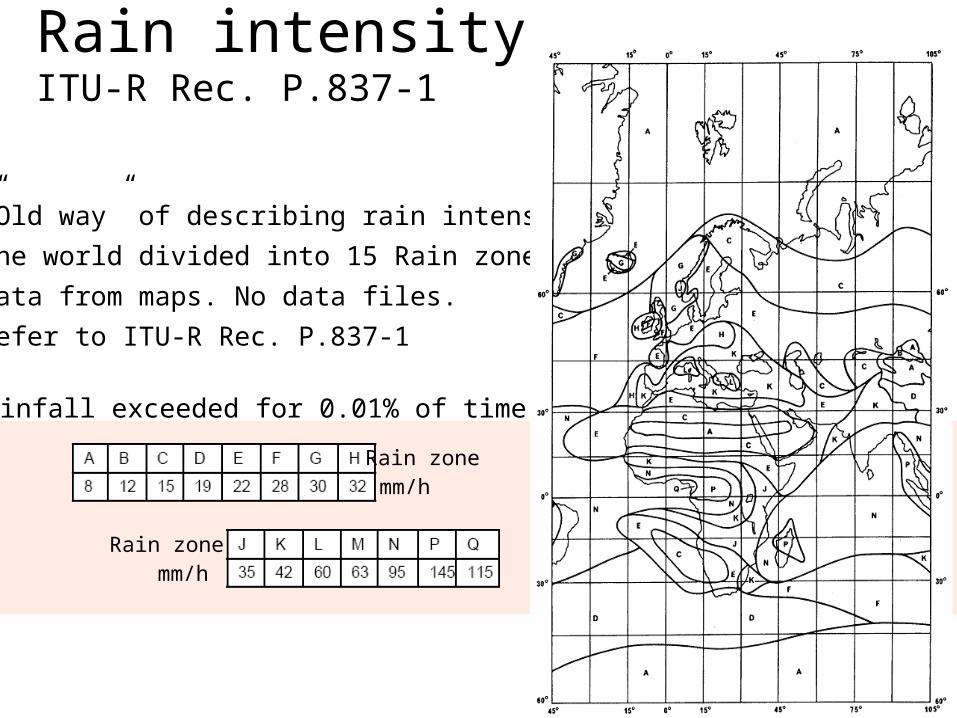
Rain intensityITU-R Rec. P.837-1
• ”Old way” of describing rain intensity.• The world divided into 15 Rain zones.• Data from maps. No data files.• Refer to ITU-R Rec. P.837-1
Rainfall exceeded for 0.01% of time
Rain zonemm/h
Rain zonemm/h
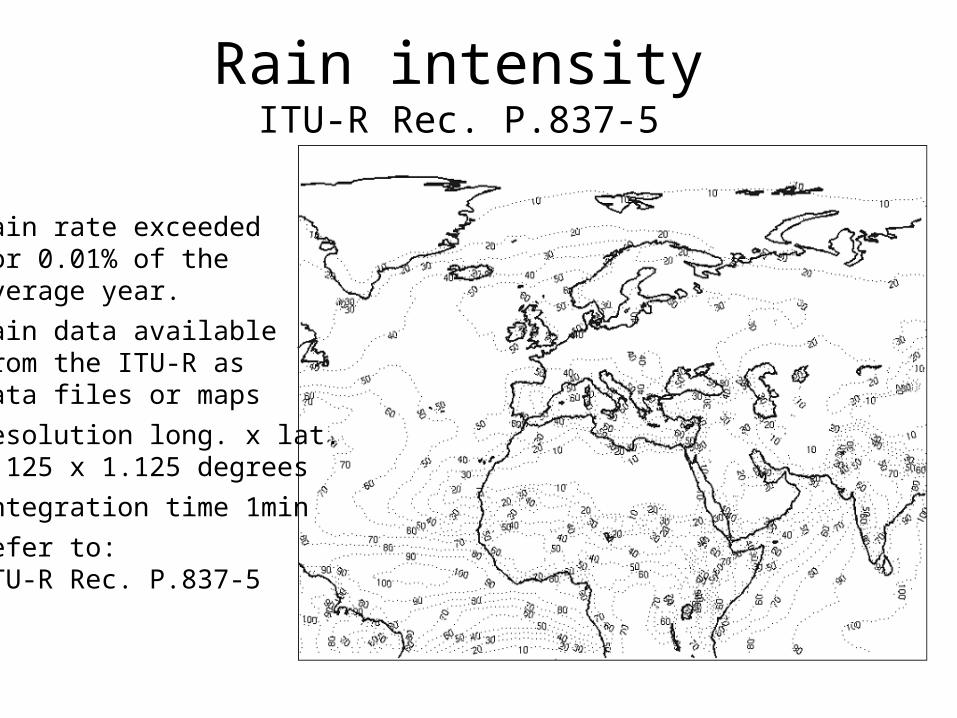
Rain intensityITU-R Rec. P.837-5
• Rain rate exceededfor 0.01% of theaverage year.
• Rain data available from the ITU-R asdata files or maps
• Resolution long. x lat. 1.125 x 1.125 degrees
• Integration time 1min• Refer to:
ITU-R Rec. P.837-5
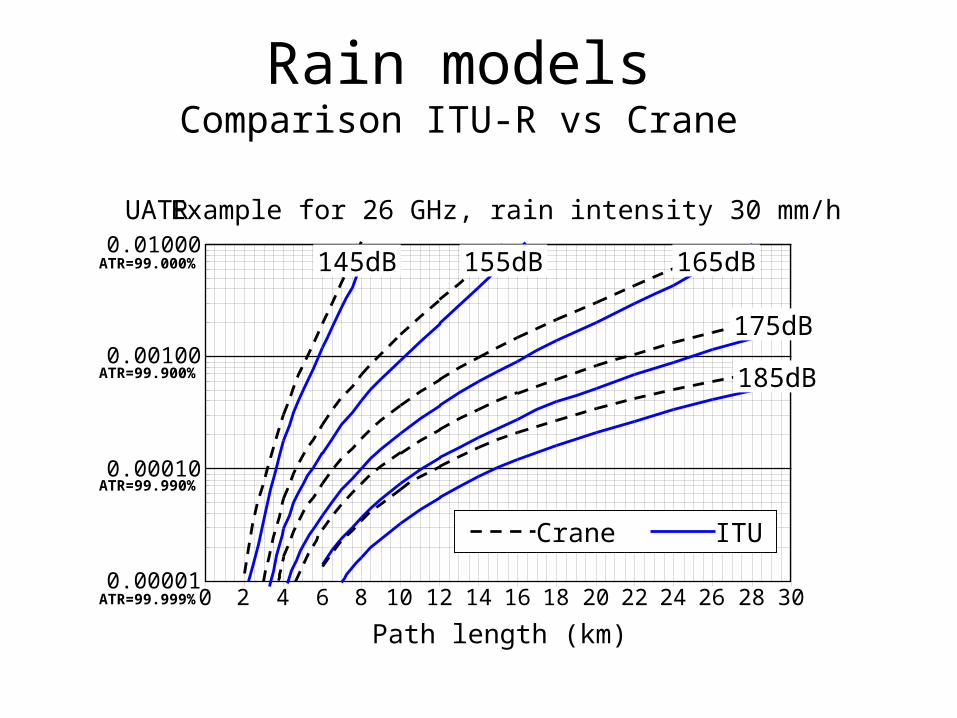
Rain modelsComparison ITU-R vs Crane
0.00001
0.00010
0.00100
0.01000
0 2 4 6 8 10 12 14 16 18 20 22 24 26 28 30
Path length (km)
UATR Example for 26 GHz, rain intensity 30 mm/h
ATR=99.000%
ATR=99.900%
ATR=99.990%
ITUCrane
ATR=99.999%
145dB 155dB 165dB
175dB
185dB
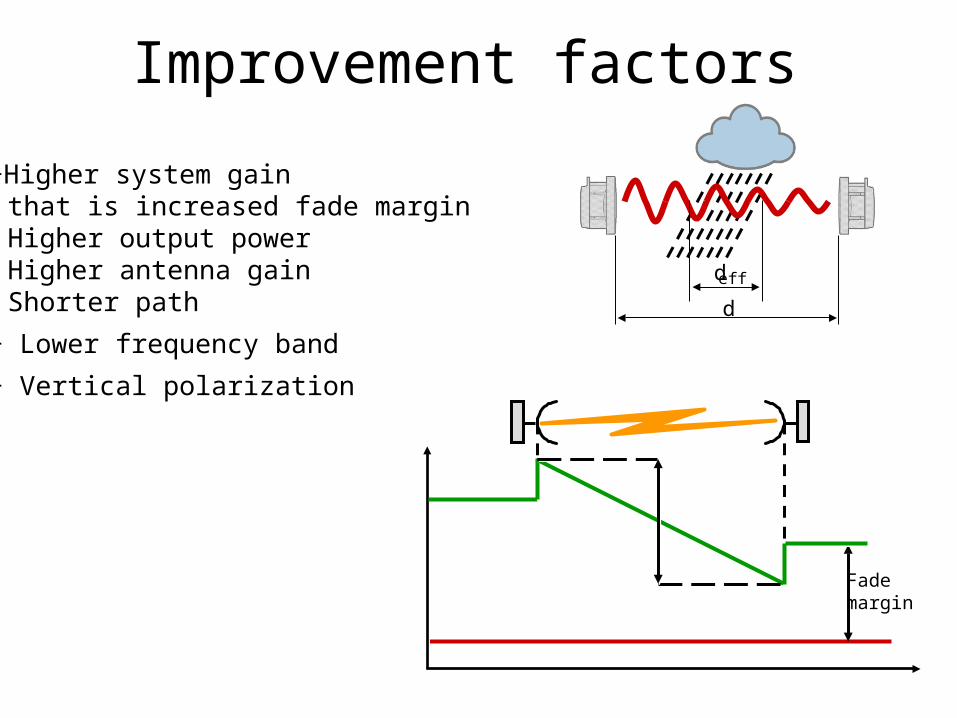
Improvement factors
+Higher system gain that is increased fade marginHigher output powerHigher antenna gainShorter path
+ Lower frequency band+ Vertical polarization
Fade margin
effd
d