Tiffany Horng NIH Public Access Author Manuscript School ...
Supplementary Material for the Manuscript
A novel multi-modal RAGE-specific inhibitor controls amyloid-β-mediated brain disorder in mice
Rashid Deane1*, Itender Singh1*, Abhay P. Sagare1, Robert D. Bell1, Nathan T. Ross2,3, Barbra LaRue1, Rachal Love1, Sheldon Perry1, Nicole Paquette1, Richard J. Deane1, Thiyagarajan Meenakshisundaram1, Troy Zarcone3, Gunter Fritz5, Alan E. Friedman4, Benjamin L. Miller2,3, Berislav V. Zlokovic1,5. 1Center of Neurodegenerative and Vascular Brain Disorders, 2Department of Biochemistry and Biophysics, 3Department of Dermatology, 4Department of Environmental Medicine, University of Rochester, Rochester, NY, USA, and 5Department of Neuropathology, University of Freiburg, Freiburg, Germany, and 5Center for Neurodegeneration and Regeneration at the Zilkha Neurogenetic Institute and Department of Physiology and Biophysics, Keck School of Medicine, University of Southern California, Los Angeles, CA, USA. Correspondence: Berislav V. Zlokovic, M.D., Ph.D. Center for Neurodegeneration and Regeneration The Zilkha Neurogenetic Institute Keck School of Medicine, University of Southern California 1501 San Pablo St. Los Angeles, CA 90089 Email: [email protected] *First co-authors
100 2000
0.2
0.4
0.6
Aβ4
0 bi
ndin
g
(nm
oles
/104 c
ells
)
A
Aβ40 (nM)
RAGE
4824 24
- +pcDNA3-RAGE
Time (h)
+
β-Actin
RAGE-CHO cells
pcDNA3-RAGE
pcDNA3-GFP
B
0 5 50 125 500 1000 10000
50
25
0
125
75
100
(nM)
Cel
l sur
viva
l(%
of c
ontr
ol)
CRAGE-CHO cellsRAGE-CHO cells
pcDNA3-GFP -+ -
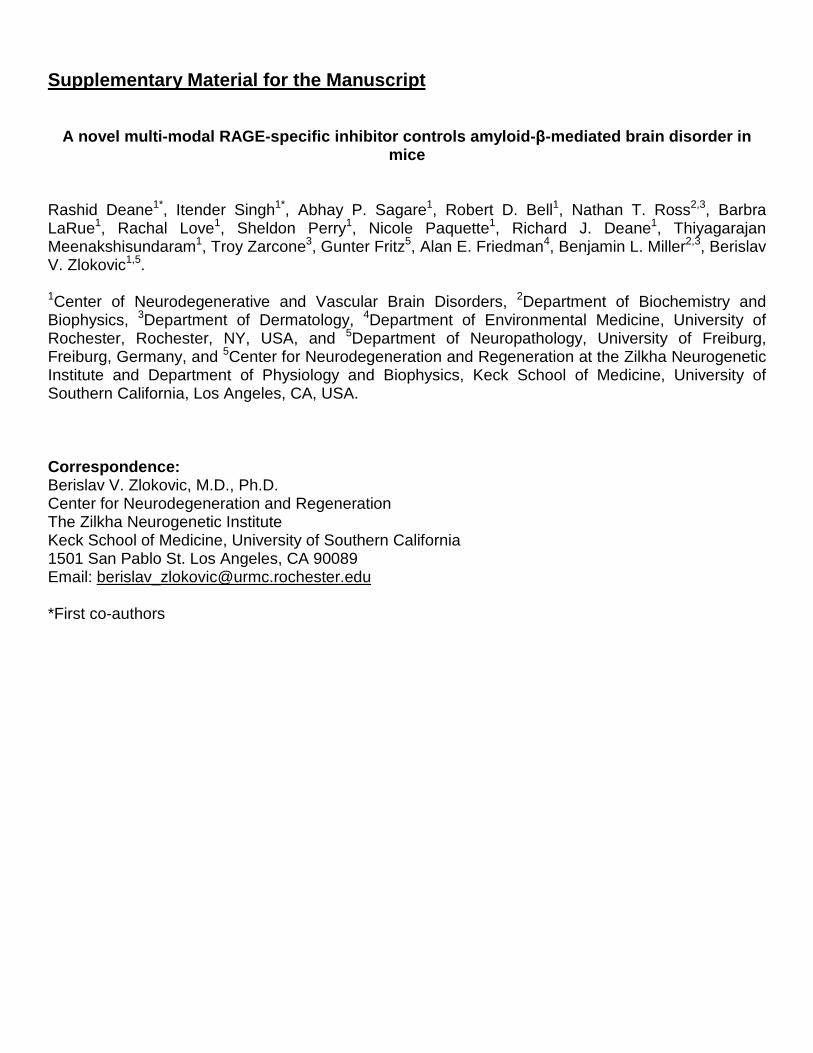
Supplementary Figure 1. Saturable Aβ binding to RAGE-CHO cells. (A) Western blot analysis of RAGE levels in RAGE-transfected CHO cells (pcDNA3-RAGE; RAGE-CHO cells) and mock-transfected CHO cells (pcDNA3-GFP, green fluorescent protein). (B) 125I-Aβ40 binding to RAGE-CHO cells (closed squares) and mock-transfected CHO cells (closed triangles) in the presence of various concentrations of unlabeled Aβ40. (C) CHO cell survival with and without the indicated concentrations of FPS2 (gray column) or FPS-ZM1 (black column). Values are mean ± s.e.m., n = 3 independent experiments.
N
B
AC
OA NH2 B H
O
C Cl
O+
NaBH3CN (1.0 eq)
(1.0 eq) (1.0 eq)MeOH / EtOH64 deg. C, 9 h B
HNA
+
(1.1 eq)
DMAP (0.1 eq)DIPEA (1.1 eq)
dry CH2Cl2RT, 30 min
A = hydrophobic amineB = electron rich aromaticC = electron poor benzene
Hydrophobic Amines
Electron Rich Aromatic Group
Electron Deficient Benzene
N1 N2 N3
B1 B2 B3 B4 B5
NH2
N4
NH2NH2 NH2
H
OH
OH
O
NH
OH
F
H
O
Cl
Cl
O
Cl Cl
Cl
O
N+O-O
N+O-
O Cl
O
N+O-O
Cl
O
N+O-O
Cl
O
Cl
A1 A2 A3 A4 A5
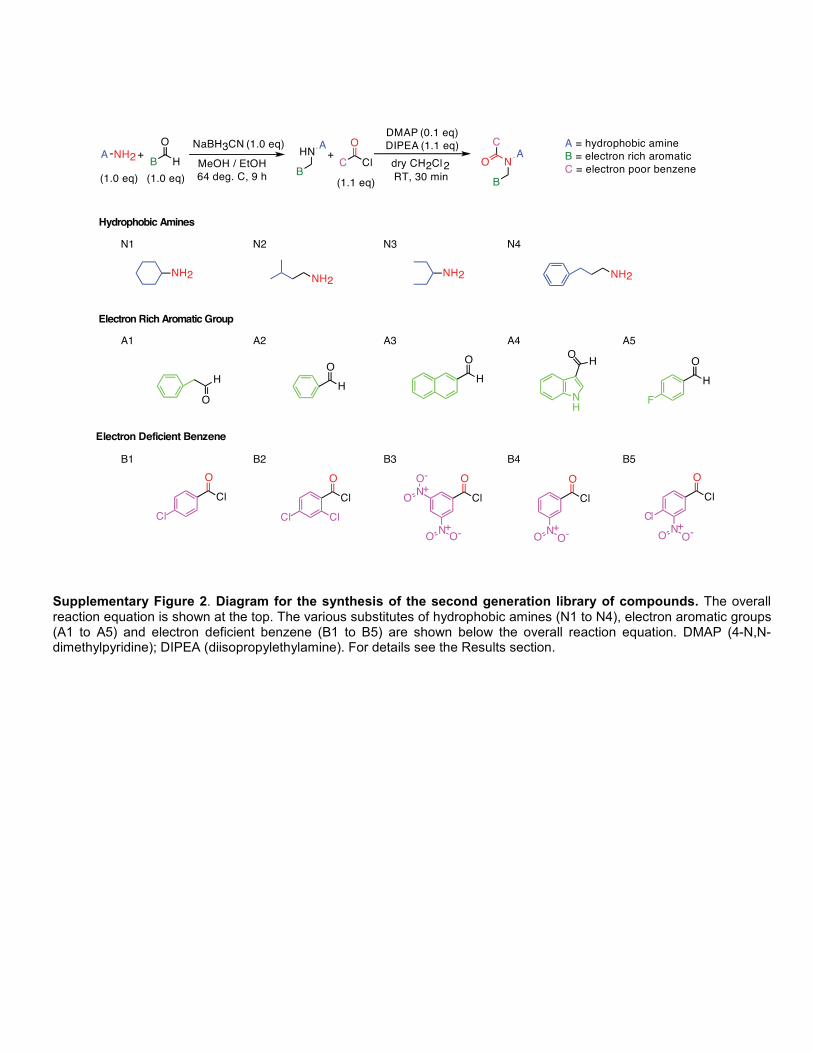
Supplementary Figure 2. Diagram for the synthesis of the second generation library of compounds. The overall reaction equation is shown at the top. The various substitutes of hydrophobic amines (N1 to N4), electron aromatic groups (A1 to A5) and electron deficient benzene (B1 to B5) are shown below the overall reaction equation. DMAP (4-N,N-dimethylpyridine); DIPEA (diisopropylethylamine). For details see the Results section.
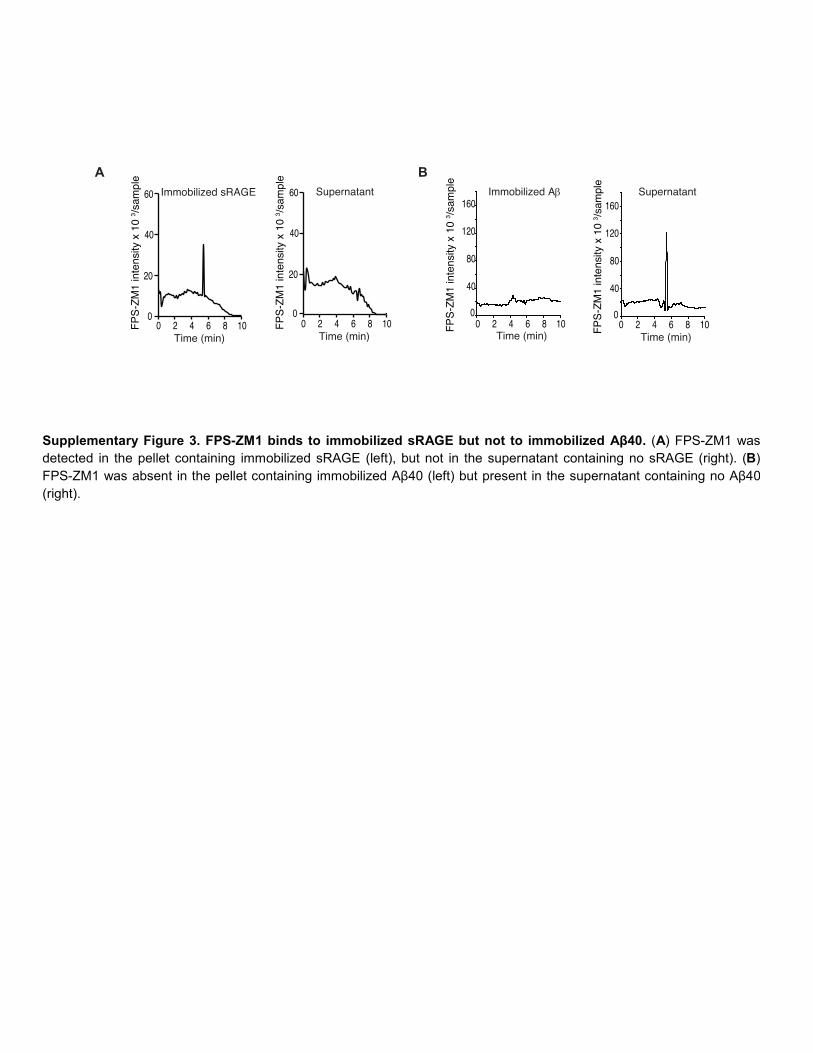
Supplementary Figure 3. FPS-ZM1 binds to immobilized sRAGE but not to immobilized Aβ40. (A) FPS-ZM1 was detected in the pellet containing immobilized sRAGE (left), but not in the supernatant containing no sRAGE (right). (B) FPS-ZM1 was absent in the pellet containing immobilized Aβ40 (left) but present in the supernatant containing no Aβ40 (right).
0 2 4 6 8 10Time (min)
A B
FP
S-Z
M1
inte
nsity
x 1
0 3 /
sam
ple
Immobilized sRAGE Supernatant
0
20
40
60
FP
S-Z
M1
inte
nsity
x 1
0 3 /
sam
ple
0
20
40
60
0 2 4 6 8 10Time (min)
0 2 4 6 8 100
40
80
120
160
0 2 4 6 8 100
40
80
120
160
Time (min)Time (min)
FP
S-Z
M1
inte
nsity
x 1
0 3 /
sam
ple
FP
S-Z
M1
inte
nsity
x 1
0 3 /
sam
ple
Immobilized Aβ Supernatant
Aβ40 − + + +
Nuc
lear
NF
-κB
re
lativ
e ab
unda
nce
P<0.05
0
2
4
8
6
0
15000
Aβ40
FPS-ZM1
FPS2
- + + +
- - + -
- - - +
+
-
-
- - - -
30000
45000
Ad.IκB-α +
+
Ad.GFP - - +- -
-
-
-
-
SH-SY5Y cells
P<0.05 P<0.05
B
Aβ40
FPS-ZM1
FPS2
-
- - -
- - -
BA
CE
1re
lativ
e ab
unda
nce
0
1
2
3
P<0.05
+ + +
+
+
P<0.05
P<0.05
SH -SY5Y cells
RAGE-CHO cells
− +Aβ40 + +FPS2
FPS-ZM1
Ap<0.05
Rel
ativ
e D
CF
fluor
esce
nce
0
4
8
12
RAGE-CHO cells
− 50− 50
− −− −
C D
RAGE
RAGE-siRNA - +
β-Actin
ESH-SY5Y cells
Scrambled siRNA -+Nuc
lear
NF
-κB
p65
(R
LU)
FPS-ZM1FPS2 −
50−
50050050− −
−− − −
+ +Aβ40 − + + +
FPS-ZM1FPS2 −
5−
50505− −
−− − −
+ + +
500500 −−
+
RAGE-CHO cells
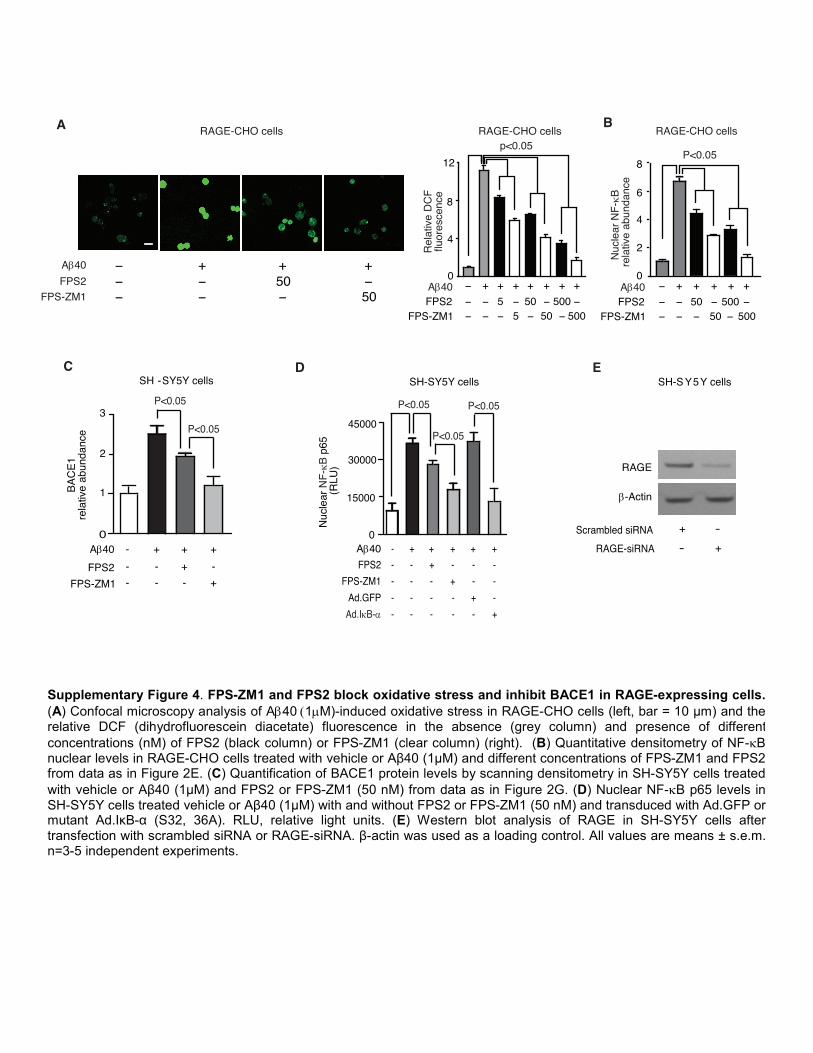
Supplementary Figure 4. FPS-ZM1 and FPS2 block oxidative stress and inhibit BACE1 in RAGE-expressing cells. (A) Confocal microscopy analysis of Aβ40 (1µM)-induced oxidative stress in RAGE-CHO cells (left, bar = 10 μm) and the relative DCF (dihydrofluorescein diacetate) fluorescence in the absence (grey column) and presence of different concentrations (nM) of FPS2 (black column) or FPS-ZM1 (clear column) (right). (B) Quantitative densitometry of NF-κB nuclear levels in RAGE-CHO cells treated with vehicle or Aβ40 (1μM) and different concentrations of FPS-ZM1 and FPS2 from data as in Figure 2E. (C) Quantification of BACE1 protein levels by scanning densitometry in SH-SY5Y cells treated with vehicle or Aβ40 (1μM) and FPS2 or FPS-ZM1 (50 nM) from data as in Figure 2G. (D) Nuclear NF-κB p65 levels in SH-SY5Y cells treated vehicle or Aβ40 (1μM) with and without FPS2 or FPS-ZM1 (50 nM) and transduced with Ad.GFP or mutant Ad.IκB-α (S32, 36A). RLU, relative light units. (E) Western blot analysis of RAGE in SH-SY5Y cells after transfection with scrambled siRNA or RAGE-siRNA. β-actin was used as a loading control. All values are means ± s.e.m. n=3-5 independent experiments.
P<0.05
P<0.05
P<0.05
FPS2
Aβ42
FPS-ZM1 +
+
-
--
- -
-
-+
+ +
SH-SY5Y cells D
A B
TB
AR
S (µ
M)
FPS2
BA
CE
1 m
RN
A (
% o
f con
trol
)
SH-SY5Y cells
sAP
Pβ
ng/m
l/106
cel
ls
C
Drug (nM)
125
I-Aβ4
2 bi
ndin
g (%
of c
ontro
l)P<0.01
P<0.05
P<0.01
0
20
40
60
80
100
120
FPS2
NI-IgG
Anti-Vd
FPS-ZM1
+
+
- -
--
- -
---
-
---
-
-
+
-
+
1 10 100 10005
10
15
20
25
30
35
Vehicle
0
50
100
150
200
250
P<0.05 P<0.05
P<0.05
FPS2
Aβ42
FPS-ZM1 +
+
-
--
- -
-
-+
+ +0
5
10
15
20
25
30
35
RAGE-CHO
FPS-ZM1
RAGE-CHO
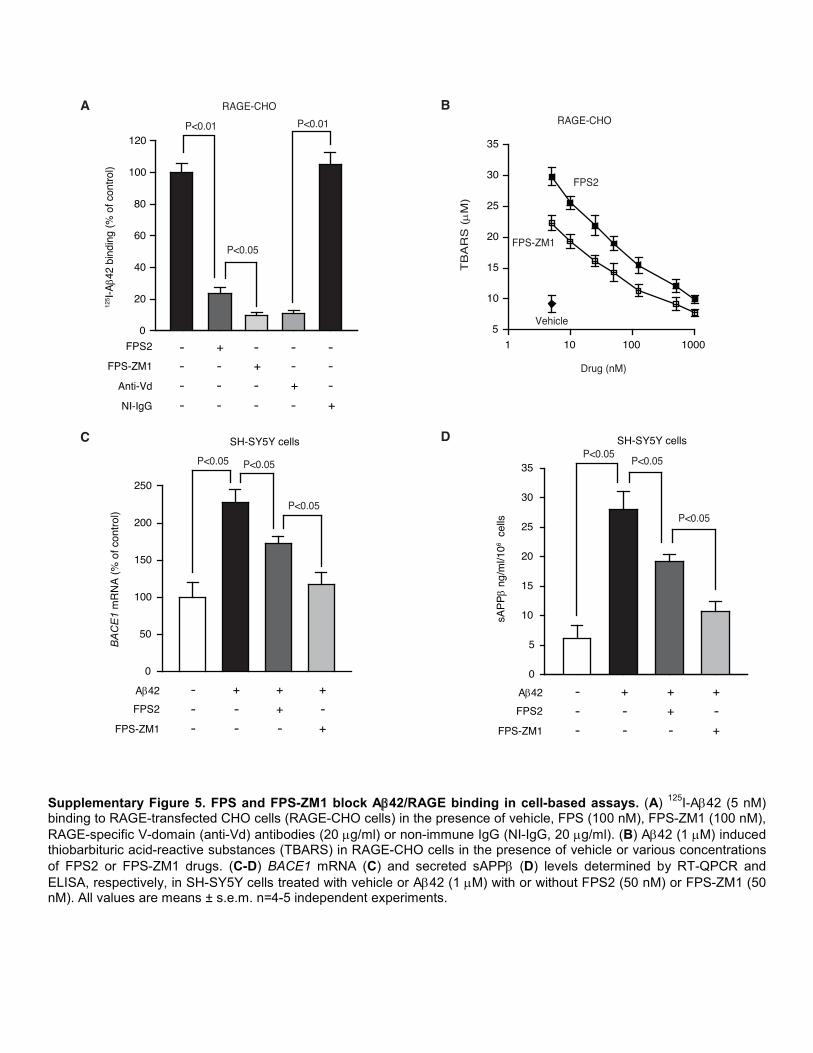
Supplementary Figure 5. FPS and FPS-ZM1 block Aβ42/RAGE binding in cell-based assays. (A) 125I-Aβ42 (5 nM) binding to RAGE-transfected CHO cells (RAGE-CHO cells) in the presence of vehicle, FPS (100 nM), FPS-ZM1 (100 nM), RAGE-specific V-domain (anti-Vd) antibodies (20 µg/ml) or non-immune IgG (NI-IgG, 20 µg/ml). (B) Aβ42 (1 µM) induced thiobarbituric acid-reactive substances (TBARS) in RAGE-CHO cells in the presence of vehicle or various concentrations of FPS2 or FPS-ZM1 drugs. (C-D) BACE1 mRNA (C) and secreted sAPPβ (D) levels determined by RT-QPCR and ELISA, respectively, in SH-SY5Y cells treated with vehicle or Aβ42 (1 µM) with or without FPS2 (50 nM) or FPS-ZM1 (50 nM). All values are means ± s.e.m. n=4-5 independent experiments.
0
2
4
6
8
10
(fm
ol/m
im/g
ISF
)p<0.05
p<0.05
Vehicle
Anti-RAGE+ -
+- -
-
+- -FPS-ZM1
+- --
--
-sRAGE
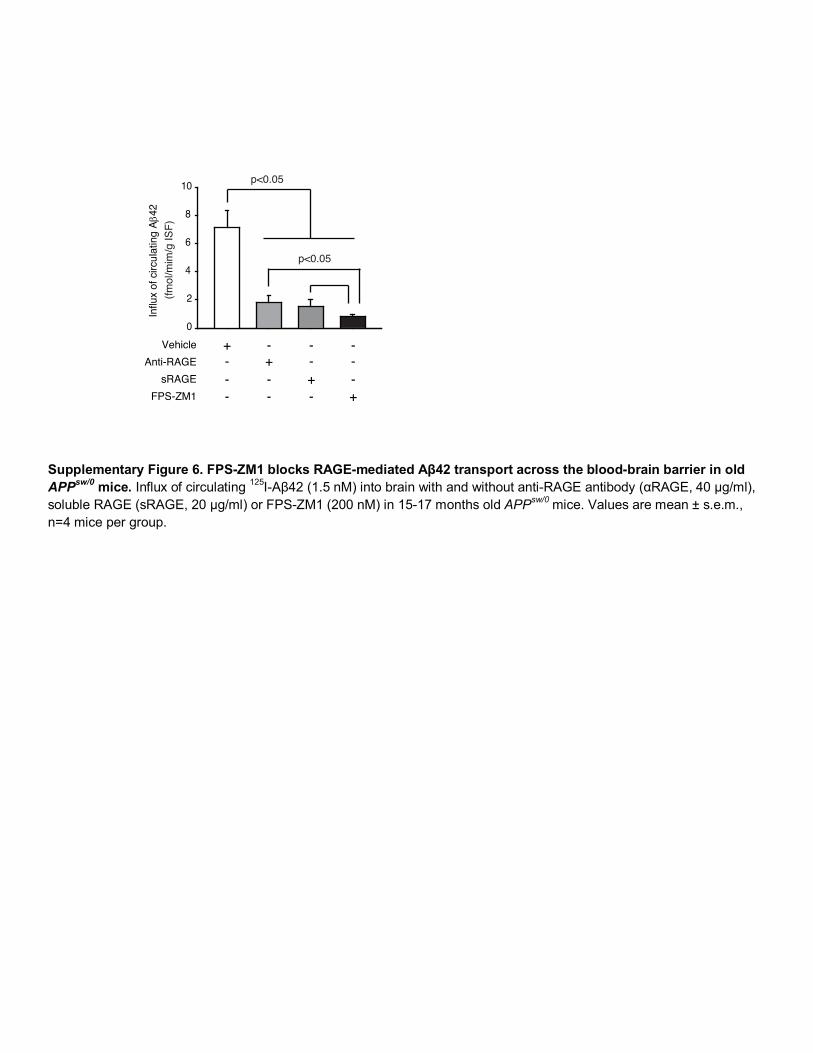
Supplementary Figure 6. FPS-ZM1 blocks RAGE-mediated Aβ42 transport across the blood-brain barrier in old APPsw/0 mice. Influx of circulating 125I-Aβ42 (1.5 nM) into brain with and without anti-RAGE antibody (αRAGE, 40 µg/ml), soluble RAGE (sRAGE, 20 µg/ml) or FPS-ZM1 (200 nM) in 15-17 months old APPsw/0 mice. Values are mean ± s.e.m., n=4 mice per group.
Influ
x of
circ
ulat
ing
Aβ4
2
Vehicle
FPS2
FPS-ZM1
0
25
50
75
100
DH
E fl
uore
scen
ce in
neu
rons
(% o
f veh
icle
-tre
ated
con
trol
s)
Vehicle
FPS-ZM1FPS2
-
+- +
-
-
+--
P<0.05
P<0.05
A BNeuN DHE Merge
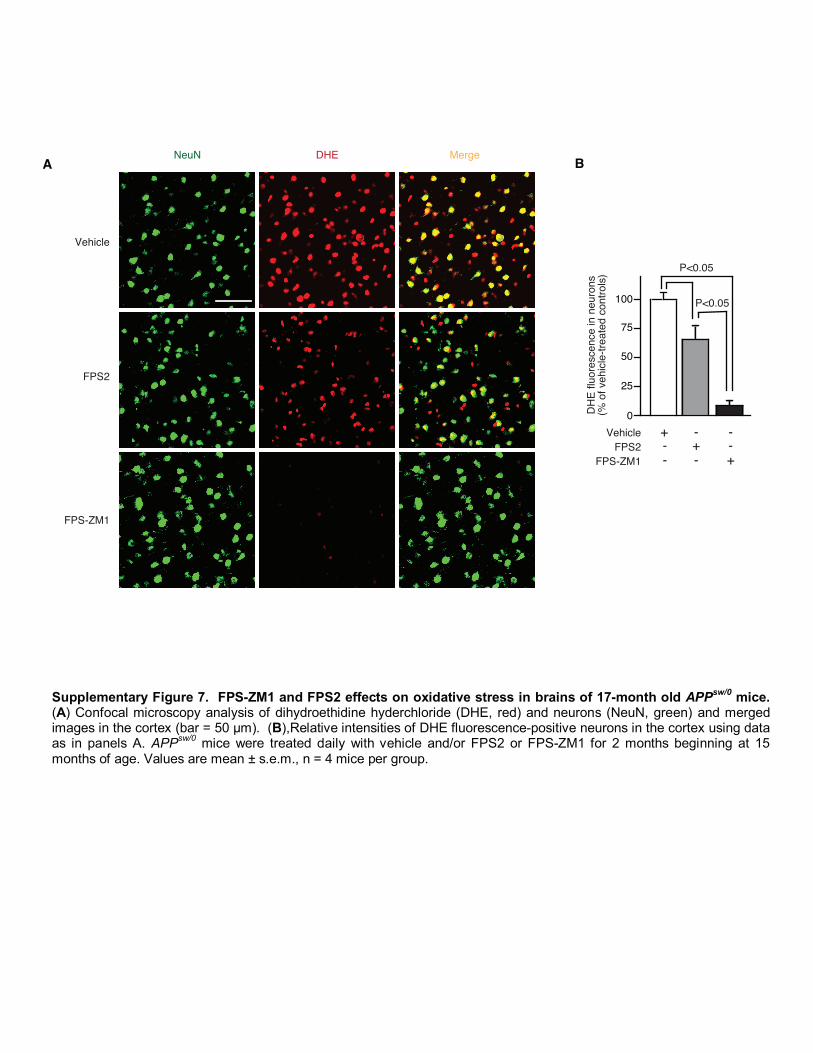
Supplementary Figure 7. FPS-ZM1 and FPS2 effects on oxidative stress in brains of 17-month old APPsw/0 mice. (A) Confocal microscopy analysis of dihydroethidine hyderchloride (DHE, red) and neurons (NeuN, green) and merged images in the cortex (bar = 50 μm). (B),Relative intensities of DHE fluorescence-positive neurons in the cortex using data as in panels A. APPsw/0 mice were treated daily with vehicle and/or FPS2 or FPS-ZM1 for 2 months beginning at 15 months of age. Values are mean ± s.e.m., n = 4 mice per group.
− + +
+− −
NF-κB
Free Probe
BV-2 cells
− + +
+− −
0
3
6
9P<0.05
C
− + + +− −
TN
Fα
sec
retio
n (
pg/m
l/106
cells
)
100
200
300P<0.05
+ +−
− − −+− − − +
−−−
P<0.05
BV-2 cellsE
RAGE
A
FPS-ZM1
Aβ40
FPS-ZM1Aβ40
0
Ad.IκB-α (S32, 36A)Ad.GFP
B
D
Il1β
secr
etio
n (
pg/m
l/106
cells
)
25
50
75P<0.05 P<0.05
BV-2 cells
0
F
FPS-ZM1
Aβ40
Scrambled siRNARAGE-siRNA
− −− −
− −− − − +− − −− − − +− − −
++ − + + +
− −+ +−
− − −+− − − +
−−−
FPS-ZM1Aβ40
Ad.IκB-α (S32, 36A)Ad.GFP
Scrambled siRNARAGE-siRNA
− −− −
− −− − − +− − −− − − +− − −
++
P<0.05
FPS-ZM1Aβ40
BV-2 cells
0
300
600
900
mR
NA
(%
of c
ontr
ol)
Ad.IκB-α (S32, 36A)
− + + + + − + + + + − + + + + − + + + +− +− − − − +− − − − +− − − − +− − −− +− − − − +− − − − +− − − − +− − −− +− − − − +− − − − +− − − − +− − −
Ad.GFP
Tnf Il6 Ccl2Il1βα
1200
Nuc
lear
NF
-κB
re
lativ
e ab
unda
nce
P<0.05P<0.05
P<0.05
P<0.05
BV-2 cells
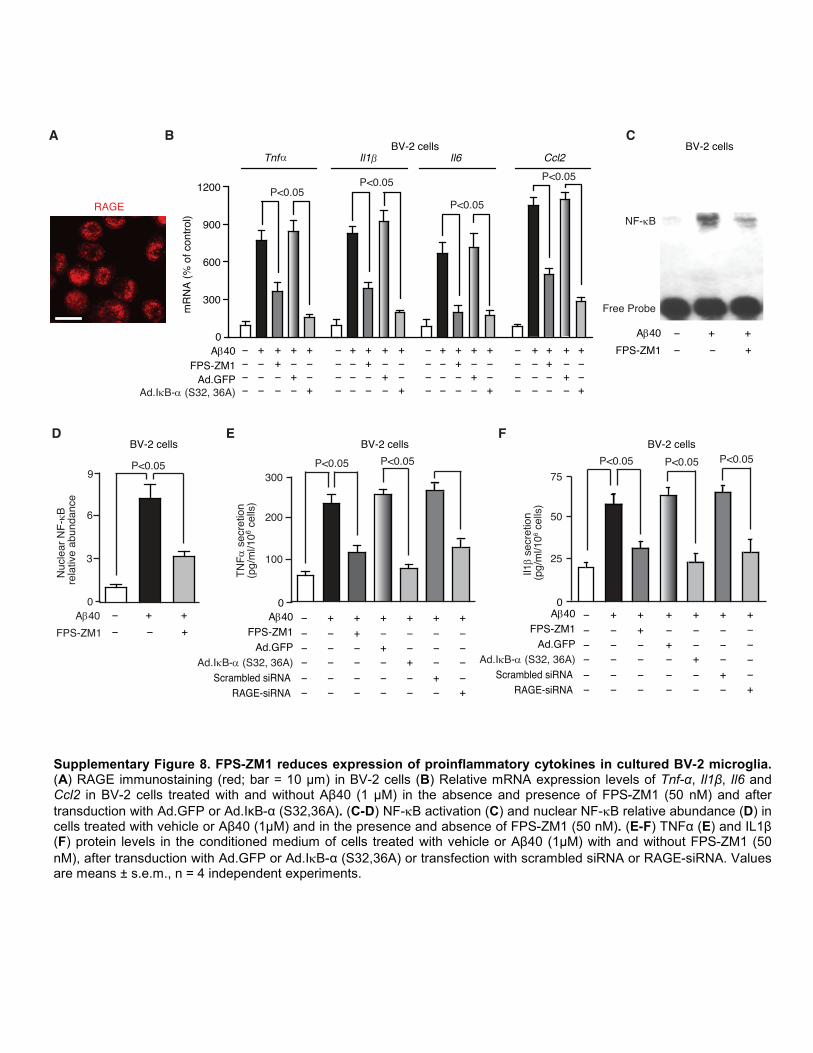
Supplementary Figure 8. FPS-ZM1 reduces expression of proinflammatory cytokines in cultured BV-2 microglia. (A) RAGE immunostaining (red; bar = 10 μm) in BV-2 cells (B) Relative mRNA expression levels of Tnf-α, Il1β, Il6 and Ccl2 in BV-2 cells treated with and without Aβ40 (1 μM) in the absence and presence of FPS-ZM1 (50 nM) and after transduction with Ad.GFP or Ad.IκB-α (S32,36A). (C-D) NF-κB activation (C) and nuclear NF-κB relative abundance (D) in cells treated with vehicle or Aβ40 (1μM) and in the presence and absence of FPS-ZM1 (50 nM). (E-F) TNFα (E) and IL1β (F) protein levels in the conditioned medium of cells treated with vehicle or Aβ40 (1μM) with and without FPS-ZM1 (50 nM), after transduction with Ad.GFP or Ad.IκB-α (S32,36A) or transfection with scrambled siRNA or RAGE-siRNA. Values are means ± s.e.m., n = 4 independent experiments.
![Supplementary Material: Unsupervised Learning of Probably ...openaccess.thecvf.com/content_CVPR_2020/...C. V. Jawahar. Cats and dogs. In Proc. CVPR, 2012.1 [8] Yuxin Wu and Kaiming](https://static.fdocument.org/doc/165x107/5f9e6e331fb6866d2166c552/supplementary-material-unsupervised-learning-of-probably-c-v-jawahar.jpg)