
a b - Nature · a b c 532 nm 307 pixels k = 1.733 nm/pixel λmax = k·d d Raw data Gaussian fit λ...
12
Supplementary Figures Transmission Grating Dark-field Condenser Sample Objective HQ2 CCD Beam splitting lens Color CCD Transmission Grating Dark-field Condenser Sample Objective HQ2 CCD Beam splitting lens Color CCD a b c 532 nm 307 pixels k = 1.733 nm/pixel λmax = k· d d Raw data Gaussian fit c 532 nm 307 pixels k = 1.733 nm/pixel 532 nm 307 pixels k = 1.733 nm/pixel λmax = k· d d d Raw data Gaussian fit Raw data Gaussian fit Supplementary Figure S1. Illustrations of single particle spectral measurement. (a) Device diagram of the high-throughput single-particle dark-field spectral microscope. (b) Typical spectral image of PNP probes absorbed on a glass slide surface. The scale bar is 10 μm. Notice that there is some overlap between zero- and first-order images from different particles. However, since the first-order streaks are always on the right side of the corresponding zero-order spots and have about the same peak-to-peak distance, the spectrum of almost every particle is readily derived. (c) By calibrating using a 532 nm laser, 1 pixel is found to correspond to 1.733 nm. Gaussian fitting to the line graph of the first order image gives the location of the spectral intensity maximum in pixels. The spectral maximum in nm can subsequently be obtained.
Transcript of a b - Nature · a b c 532 nm 307 pixels k = 1.733 nm/pixel λmax = k·d d Raw data Gaussian fit λ...
Supplementary Figures
Transmission Grating
Dark-field Condenser
Sample
Objective
HQ2 CCD
Beam splitting lens
Color CCD
Transmission Grating
Dark-field Condenser
Sample
Objective
HQ2 CCD
Beam splitting lens
Color CCD
a b
c
532 nm
307 pixels
k = 1.733 nm/pixel λmax = k·d
d
Raw data Gaussian fitc
532 nm
307 pixels
k = 1.733 nm/pixel532 nm
307 pixels
k = 1.733 nm/pixel λmax = k·d
dd
Raw data Gaussian fit Raw data Gaussian fit
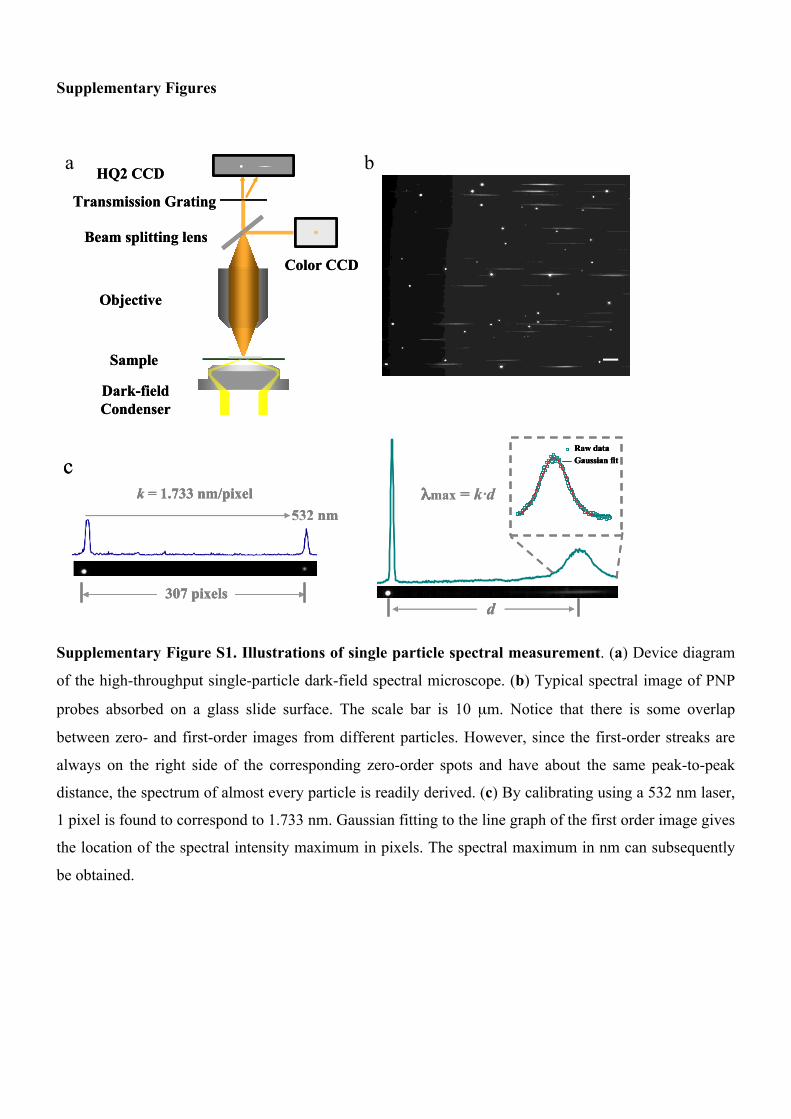
Supplementary Figure S1. Illustrations of single particle spectral measurement. (a) Device diagram
of the high-throughput single-particle dark-field spectral microscope. (b) Typical spectral image of PNP
probes absorbed on a glass slide surface. The scale bar is 10 µm. Notice that there is some overlap
between zero- and first-order images from different particles. However, since the first-order streaks are
always on the right side of the corresponding zero-order spots and have about the same peak-to-peak
distance, the spectrum of almost every particle is readily derived. (c) By calibrating using a 532 nm laser,
1 pixel is found to correspond to 1.733 nm. Gaussian fitting to the line graph of the first order image gives
the location of the spectral intensity maximum in pixels. The spectral maximum in nm can subsequently
be obtained.
0 2 4 6 8 10 12 14 160
20
40
60
80
100
λmax
shift
(nm
)
Time (min)
100 µM 50 µM 10 µM
400 500 600 700 800 900 10000.0
0.2
0.4
0.6
0.8
1.0 0 µM 10 µM 50 µM 100 µM
Ext
inct
ion
Wavelength (nm)
1.0 1.5 2.0 2.5 3.0048
121620242832
Freq
uenc
y (%
)
Aspect Ratioc
a b
d
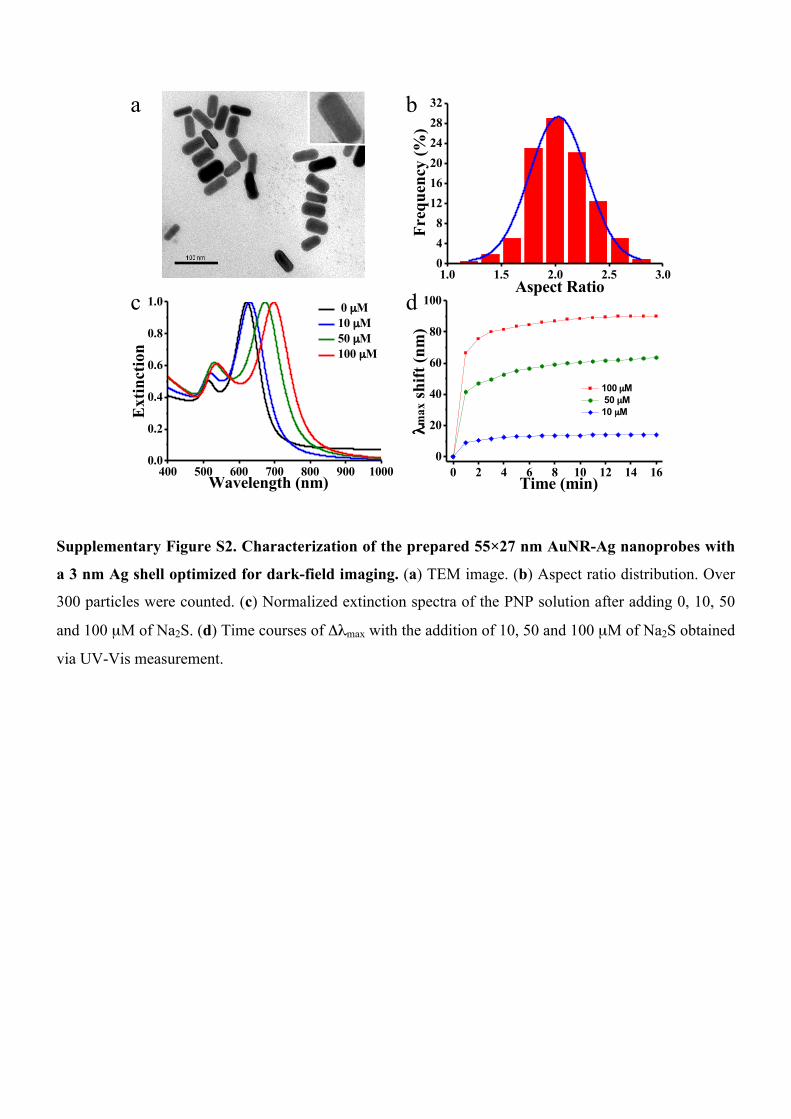
Supplementary Figure S2. Characterization of the prepared 55×27 nm AuNR-Ag nanoprobes with
a 3 nm Ag shell optimized for dark-field imaging. (a) TEM image. (b) Aspect ratio distribution. Over
300 particles were counted. (c) Normalized extinction spectra of the PNP solution after adding 0, 10, 50
and 100 µM of Na2S. (d) Time courses of Δλmax with the addition of 10, 50 and 100 µM of Na2S obtained
via UV-Vis measurement.
0 2 4 6 8 10 12 14 16 18 20
0
10
20
30
40
50
60
70
80
-10 -8 -6 -4 -2 0 2 4 6 8 100.00
0.05
0.10
0.15
0.20
0.25
0.30
0.35
0.40
Δλmax (nm)F
requ
ency
(%
)
GSH & NaCl
0 20 40 60 80 1000.00
0.05
0.10
0.15
0.20
0.25
0.30
0.35
0.40
Fre
quen
cy (
%)
Δλmax (nm)
Na2S
0 20 40 60 80 1000.00
0.05
0.10
0.15
0.20
0.25
0.30
0.35
0.40
Fre
quen
cy (
%)
Δλmax (nm)
Cys & NaCl & Na2S
0 20 40 60 80 1000.00
0.05
0.10
0.15
0.20
0.25
0.30
0.35
0.40F
requ
ency
(%
)
Δλmax (nm)
CSH & NaCl & Na2S
Time (min)
Δλm
ax (
nm)
Cys & NaCl & Na2S GSH & NaCl & Na2S Na2S
-10 -8 -6 -4 -2 0 2 4 6 8 100.00
0.05
0.10
0.15
0.20
0.25
0.30
0.35
0.40
Fre
quen
cy (
%)
Δλmax (nm)
Cys & NaCla
f
b c
d e
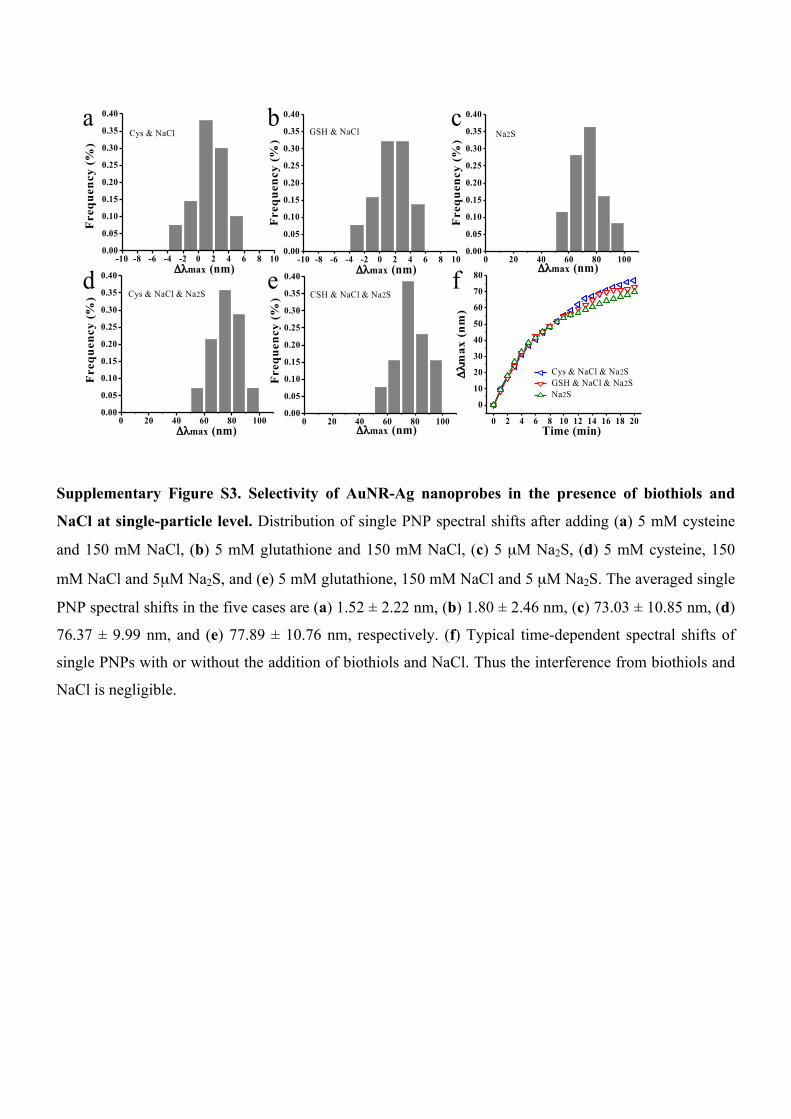
Supplementary Figure S3. Selectivity of AuNR-Ag nanoprobes in the presence of biothiols and
NaCl at single-particle level. Distribution of single PNP spectral shifts after adding (a) 5 mM cysteine
and 150 mM NaCl, (b) 5 mM glutathione and 150 mM NaCl, (c) 5 µM Na2S, (d) 5 mM cysteine, 150
mM NaCl and 5µM Na2S, and (e) 5 mM glutathione, 150 mM NaCl and 5 µM Na2S. The averaged single
PNP spectral shifts in the five cases are (a) 1.52 ± 2.22 nm, (b) 1.80 ± 2.46 nm, (c) 73.03 ± 10.85 nm, (d)
76.37 ± 9.99 nm, and (e) 77.89 ± 10.76 nm, respectively. (f) Typical time-dependent spectral shifts of
single PNPs with or without the addition of biothiols and NaCl. Thus the interference from biothiols and
NaCl is negligible.
.
0 5 10 15 20 25 30 350
20
40
60
80
100
120
140λm
ax sh
ift (n
m)
CS,NP ( nM)
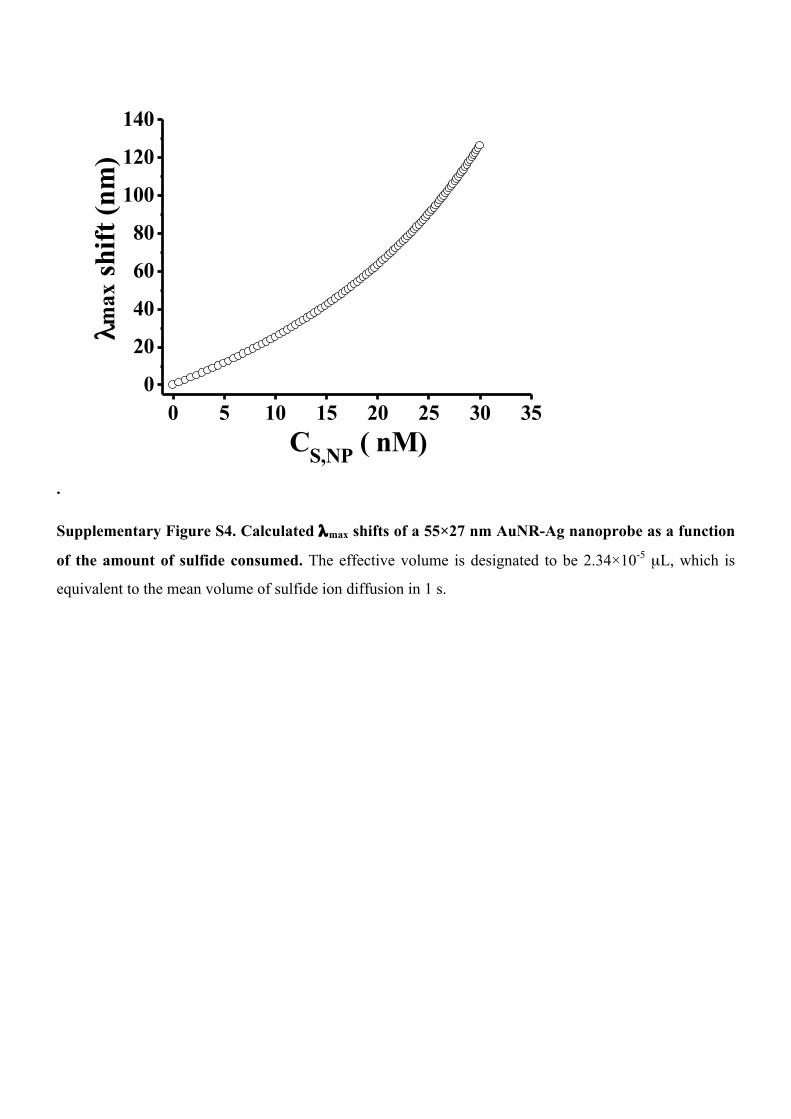
Supplementary Figure S4. Calculated λmax shifts of a 55×27 nm AuNR-Ag nanoprobe as a function
of the amount of sulfide consumed. The effective volume is designated to be 2.34×10⁻⁵ µL, which is
equivalent to the mean volume of sulfide ion diffusion in 1 s.
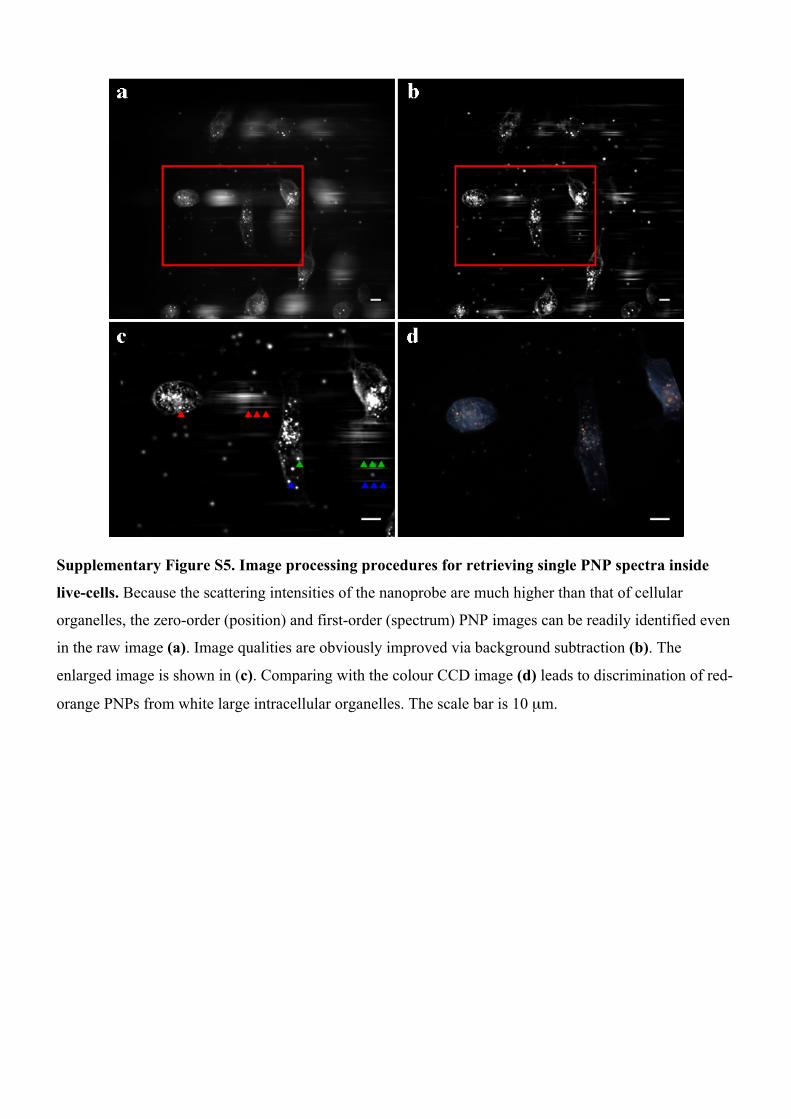
Supplementary Figure S5. Image processing procedures for retrieving single PNP spectra inside
live-cells. Because the scattering intensities of the nanoprobe are much higher than that of cellular
organelles, the zero-order (position) and first-order (spectrum) PNP images can be readily identified even
in the raw image (a). Image qualities are obviously improved via background subtraction (b). The
enlarged image is shown in (c). Comparing with the colour CCD image (d) leads to discrimination of red-
orange PNPs from white large intracellular organelles. The scale bar is 10 µm.
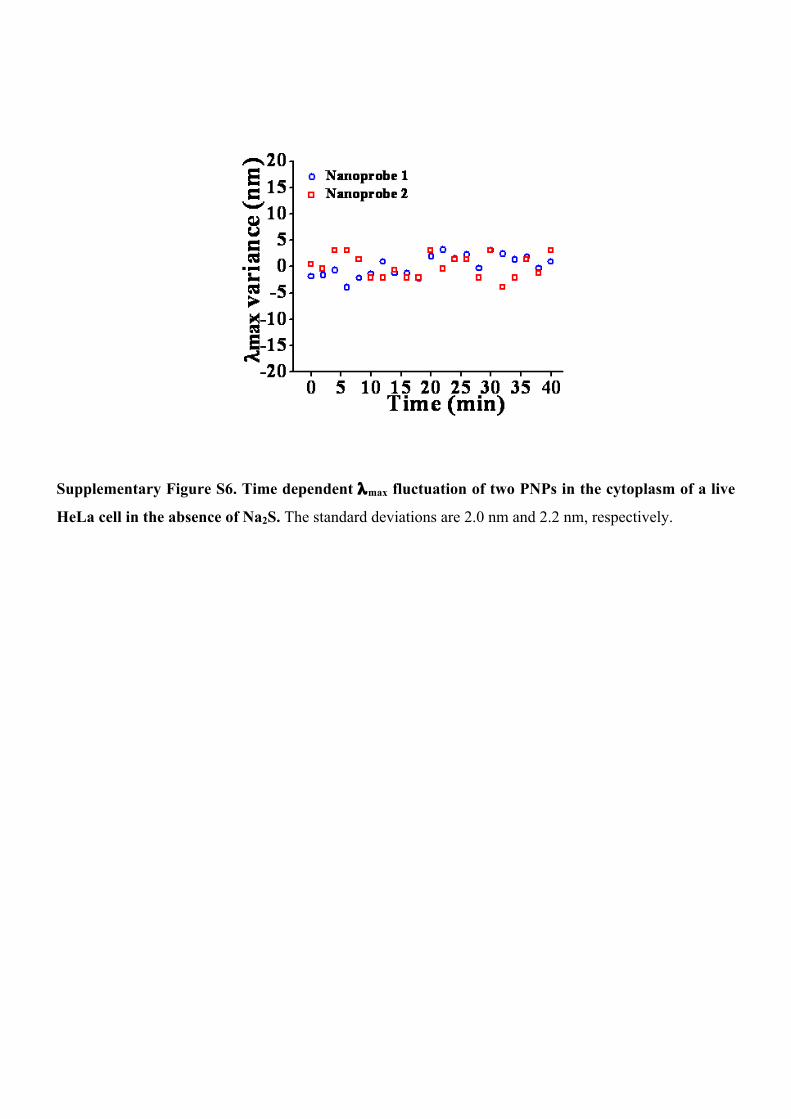
Supplementary Figure S6. Time dependent λmax fluctuation of two PNPs in the cytoplasm of a live
HeLa cell in the absence of Na2S. The standard deviations are 2.0 nm and 2.2 nm, respectively.
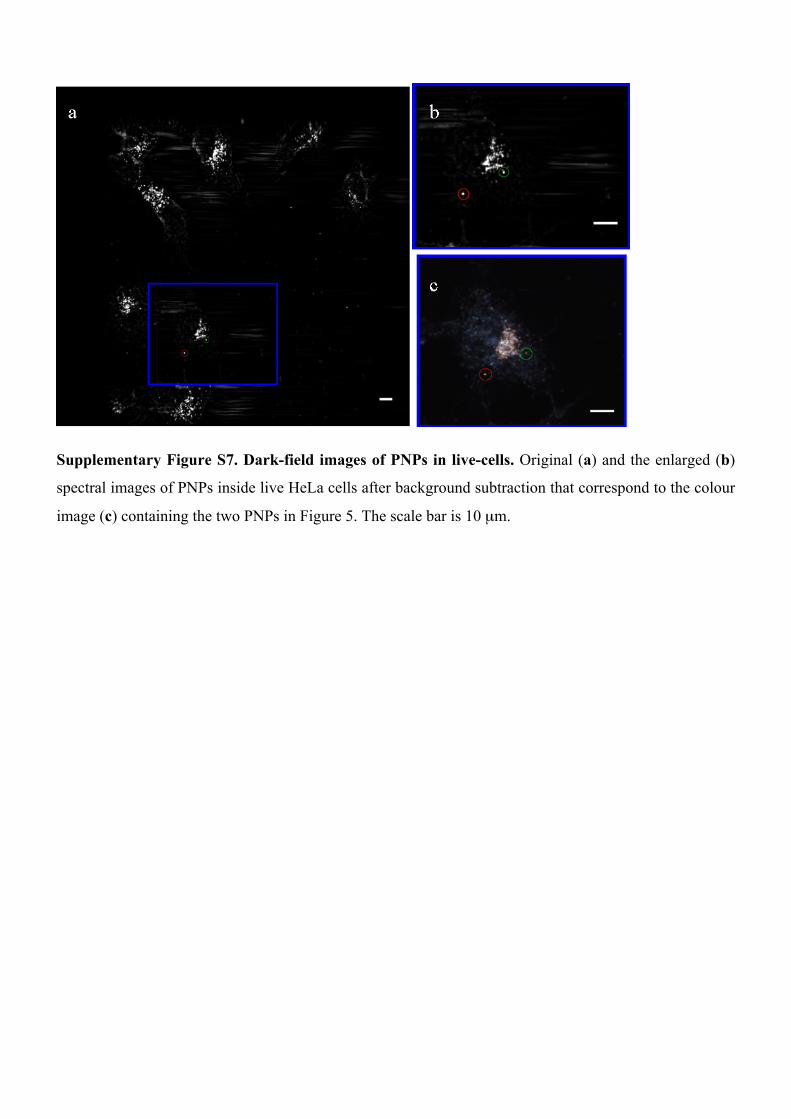
Supplementary Figure S7. Dark-field images of PNPs in live-cells. Original (a) and the enlarged (b)
spectral images of PNPs inside live HeLa cells after background subtraction that correspond to the colour
image (c) containing the two PNPs in Figure 5. The scale bar is 10 µm.
0 5 10 15 20 25 30 35 40590600610620630640650660670
0 5 10 15 20 25 30 35 40590600610620630640650660670
Probe 1 Probe 2
λmax
(nm
)
Time (min)
b
λmax
(nm
)
Time (min)
a
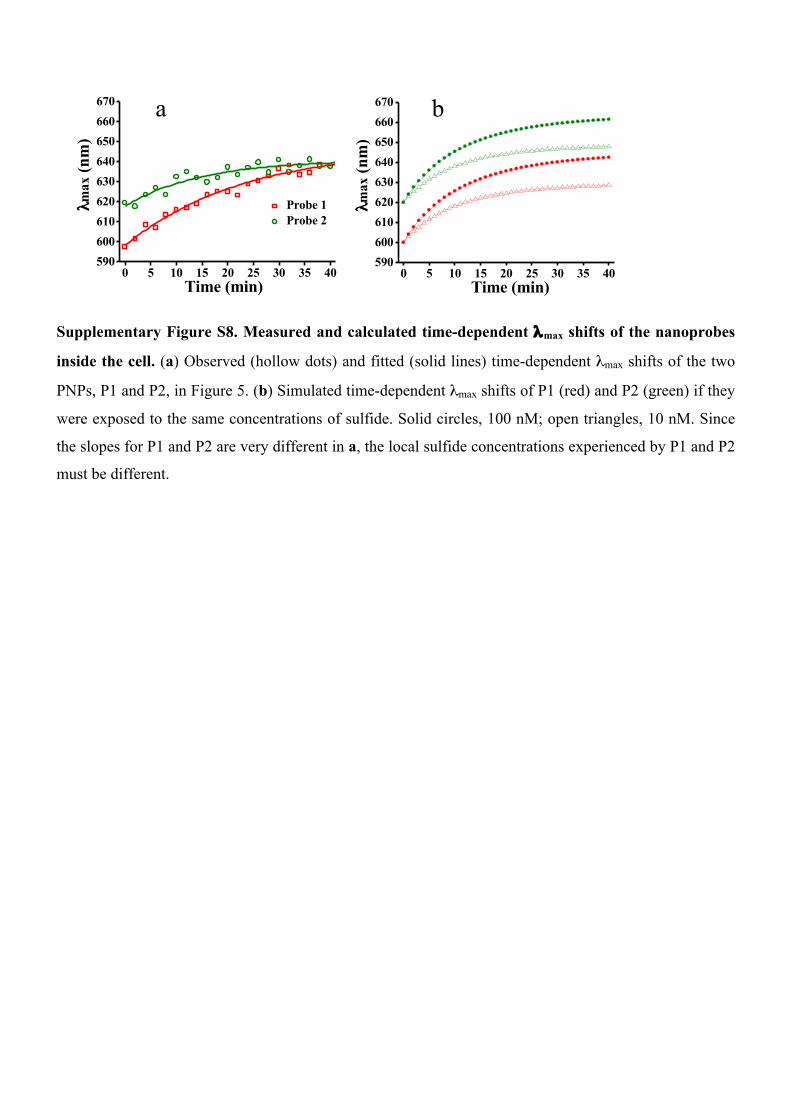
Supplementary Figure S8. Measured and calculated time-dependent λmax shifts of the nanoprobes
inside the cell. (a) Observed (hollow dots) and fitted (solid lines) time-dependent λmax shifts of the two
PNPs, P1 and P2, in Figure 5. (b) Simulated time-dependent λmax shifts of P1 (red) and P2 (green) if they
were exposed to the same concentrations of sulfide. Solid circles, 100 nM; open triangles, 10 nM. Since
the slopes for P1 and P2 are very different in a, the local sulfide concentrations experienced by P1 and P2
must be different.
a
c
b
d
a
c
b
d
0 5 10 15 20 25 30
600
620
640
660
680
700
Time (min)
λmax
(nm
)
negative control probe 3 probe 4 probe 5 probe 6
e
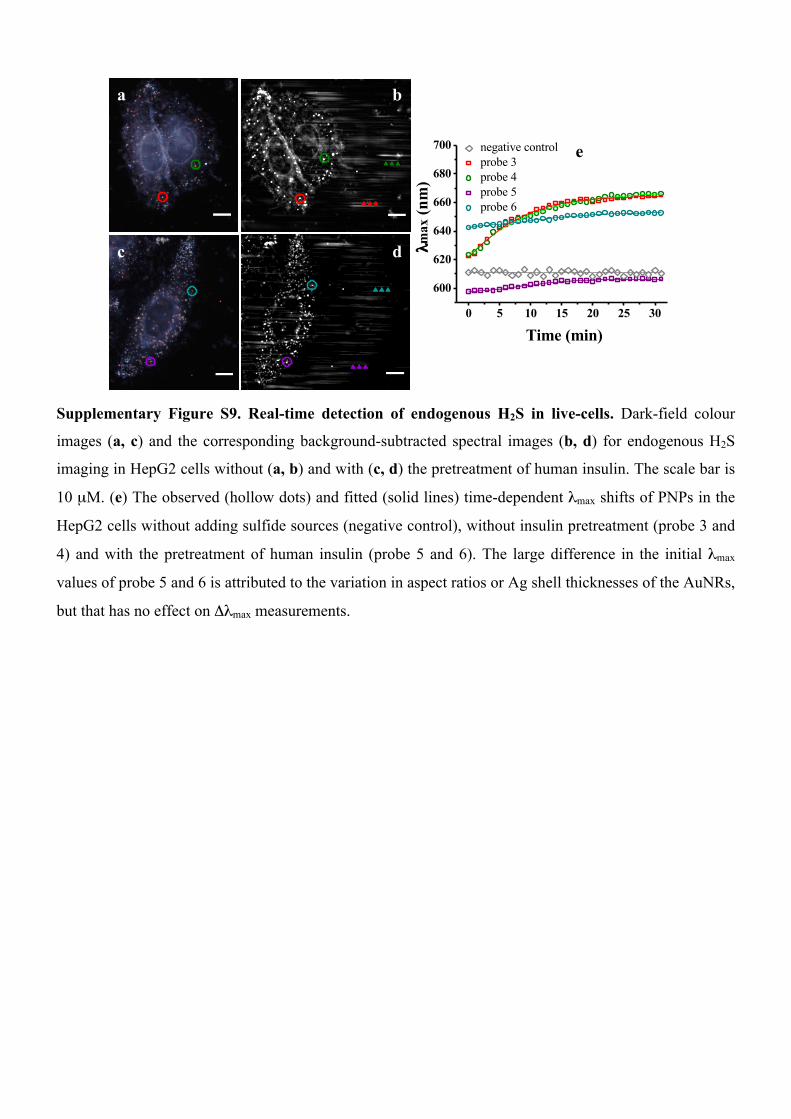
Supplementary Figure S9. Real-time detection of endogenous H2S in live-cells. Dark-field colour
images (a, c) and the corresponding background-subtracted spectral images (b, d) for endogenous H2S
imaging in HepG2 cells without (a, b) and with (c, d) the pretreatment of human insulin. The scale bar is
10 µM. (e) The observed (hollow dots) and fitted (solid lines) time-dependent λmax shifts of PNPs in the
HepG2 cells without adding sulfide sources (negative control), without insulin pretreatment (probe 3 and
4) and with the pretreatment of human insulin (probe 5 and 6). The large difference in the initial λmax
values of probe 5 and 6 is attributed to the variation in aspect ratios or Ag shell thicknesses of the AuNRs,
but that has no effect on Δλmax measurements.
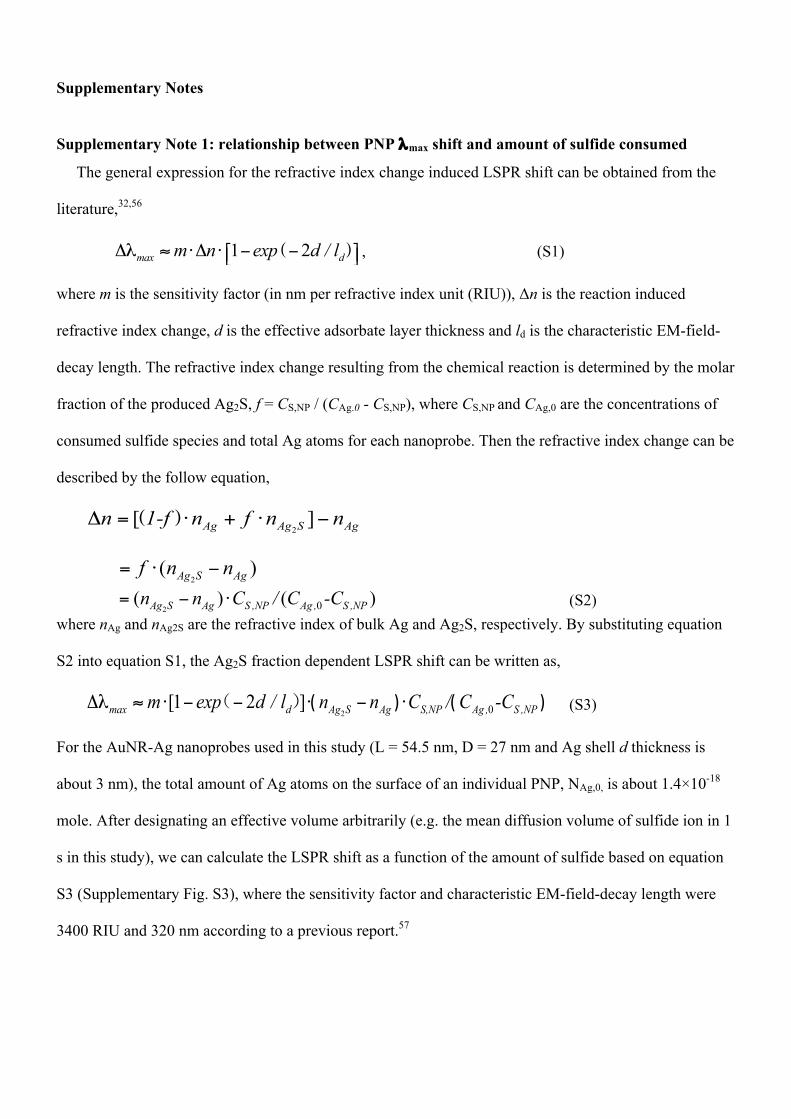
Supplementary Notes Supplementary Note 1: relationship between PNP λmax shift and amount of sulfide consumed
The general expression for the refractive index change induced LSPR shift can be obtained from the
literature,32,56
1 2max dm n exp d / lΔλ ≈ ⋅Δ ⋅ − −⎡ ⎤⎣ ⎦( ) , (S1)
where m is the sensitivity factor (in nm per refractive index unit (RIU)), Δn is the reaction induced
refractive index change, d is the effective adsorbate layer thickness and ld is the characteristic EM-field-
decay length. The refractive index change resulting from the chemical reaction is determined by the molar
fraction of the produced Ag2S, f = CS,NP / (CAg.0 - CS,NP), where CS,NP and CAg,0 are the concentrations of
consumed sulfide species and total Ag atoms for each nanoprobe. Then the refractive index change can be
described by the follow equation,
2[ ]Ag Ag S Agn 1-f n f n nΔ = ⋅ + ⋅ −( )
2( )Ag S Agf n n= ⋅ −
2 0( ) ( )= − ⋅Ag S Ag S ,NP Ag , S ,NPn n C / C -C (S2) where nAg and nAg2S are the refractive index of bulk Ag and Ag2S, respectively. By substituting equation
S2 into equation S1, the Ag2S fraction dependent LSPR shift can be written as,
2 0[1 2 ]Δλ ≈ ⋅ − − ⋅ − ⋅max d Ag S Ag S,NP Ag , S ,NPm exp d / l n n C / C -C( )( ) ( ) (S3)
For the AuNR-Ag nanoprobes used in this study (L = 54.5 nm, D = 27 nm and Ag shell d thickness is
about 3 nm), the total amount of Ag atoms on the surface of an individual PNP, NAg,0, is about 1.4×10⁻¹⁸
mole. After designating an effective volume arbitrarily (e.g. the mean diffusion volume of sulfide ion in 1
s in this study), we can calculate the LSPR shift as a function of the amount of sulfide based on equation
S3 (Supplementary Fig. S3), where the sensitivity factor and characteristic EM-field-decay length were
3400 RIU and 320 nm according to a previous report.57
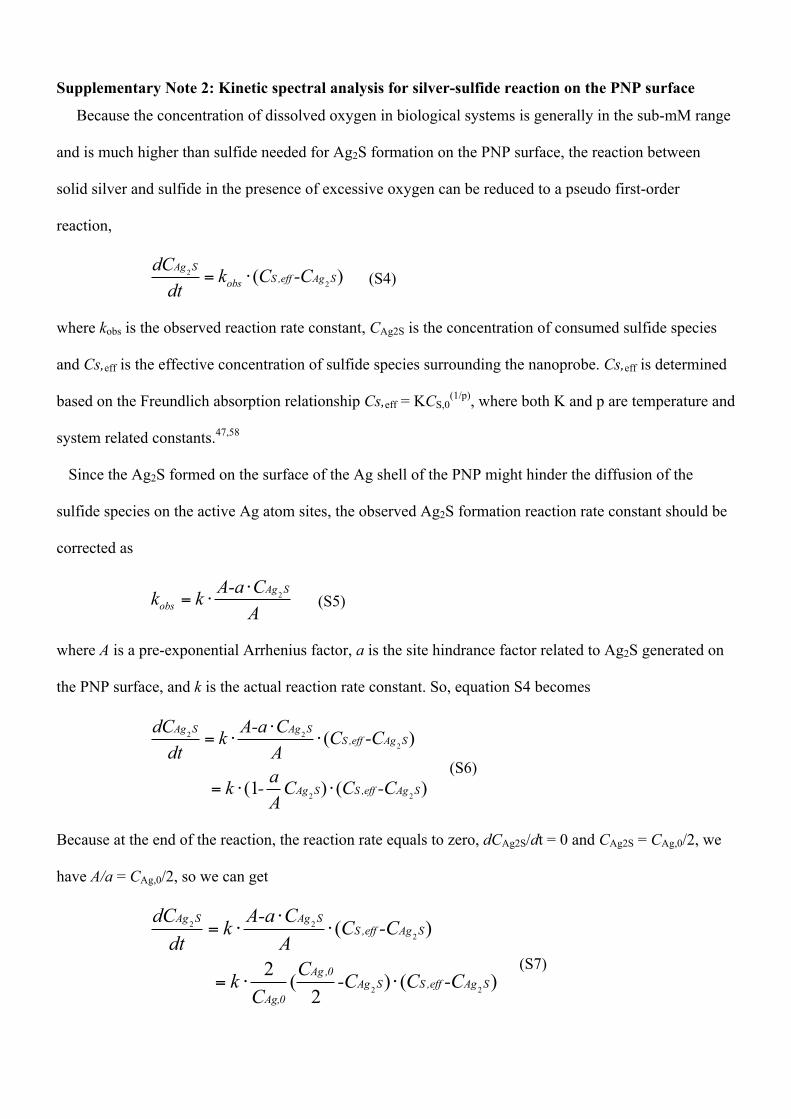
Supplementary Note 2: Kinetic spectral analysis for silver-sulfide reaction on the PNP surface
Because the concentration of dissolved oxygen in biological systems is generally in the sub-mM range
and is much higher than sulfide needed for Ag2S formation on the PNP surface, the reaction between
solid silver and sulfide in the presence of excessive oxygen can be reduced to a pseudo first-order
reaction,
22( )= ⋅
Ag SS ,eff Ag Sobs
dC k C -Cdt
(S4)
where kobs is the observed reaction rate constant, CAg2S is the concentration of consumed sulfide species
and Cs,eff is the effective concentration of sulfide species surrounding the nanoprobe. Cs,eff is determined
based on the Freundlich absorption relationship Cs,eff = KCS,0(1/p), where both K and p are temperature and
system related constants.47,58
Since the Ag2S formed on the surface of the Ag shell of the PNP might hinder the diffusion of the
sulfide species on the active Ag atom sites, the observed Ag2S formation reaction rate constant should be
corrected as
2⋅= ⋅
Ag Sobs
A-a Ck kA
(S5)
where A is a pre-exponential Arrhenius factor, a is the site hindrance factor related to Ag2S generated on
the PNP surface, and k is the actual reaction rate constant. So, equation S4 becomes
2 22
2 2
( )
(1 ) ( )
⋅= ⋅ ⋅
= ⋅ ⋅
Ag S Ag SS ,eff Ag S
Ag S S ,eff Ag S
dC A-a Ck C -Cdt A
ak - C C -CA
(S6)
Because at the end of the reaction, the reaction rate equals to zero, dCAg2S/dt = 0 and CAg2S = CAg,0/2, we
have A/a = CAg,0/2, so we can get
2 22
2 2
( )
2 ( ) ( )2
⋅= ⋅ ⋅
= ⋅ ⋅
Ag S Ag SS ,eff Ag S
Ag ,0Ag S S ,eff Ag S
Ag,0
dC A-a Ck C -Cdt A
Ck -C C -CC
(S7)
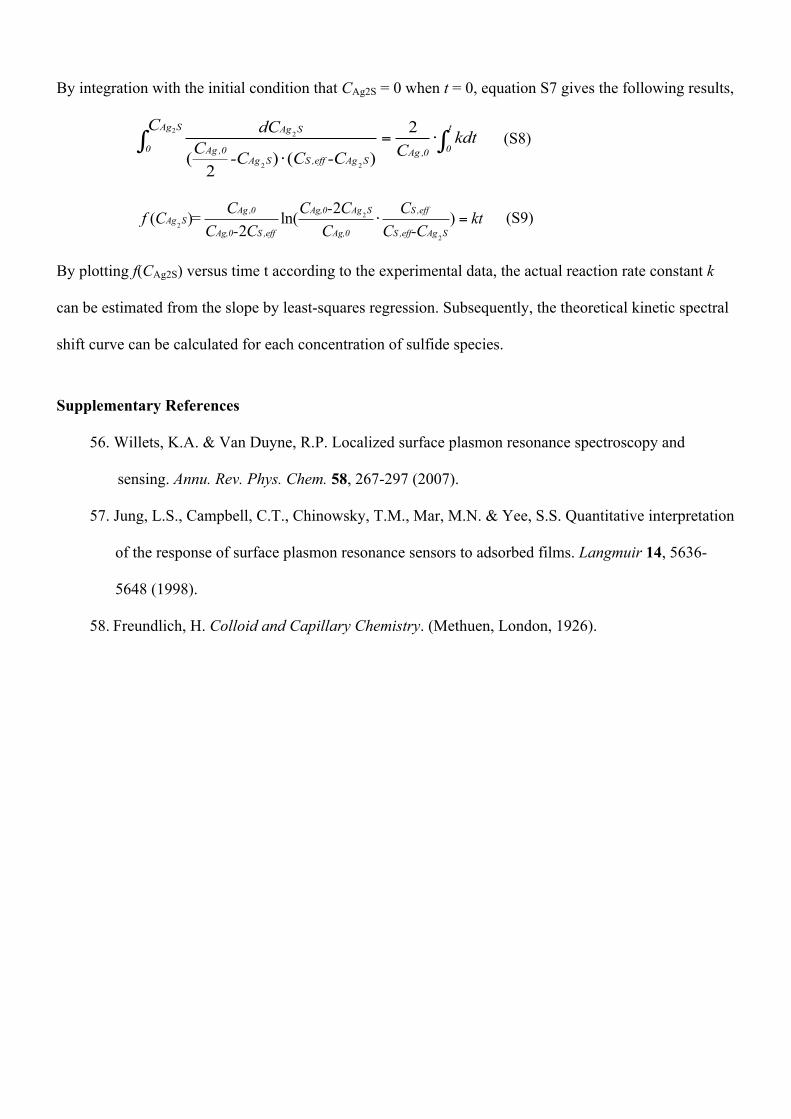
By integration with the initial condition that CAg2S = 0 when t = 0, equation S7 gives the following results,
2 2
2 2
2
( ) ( )2
= ⋅⋅
∫ ∫Ag S tAg S
0 0Ag ,0 Ag ,0Ag S S ,eff Ag S
C dC kdtC C-C C -C (S8)
22
2
2( ) ln( )2
⋅ =Ag ,0 Ag,0 Ag S S ,eff
Ag SAg,0 S ,eff Ag,0 S ,eff Ag S
C C - C Cf C = ktC - C C C -C
(S9)
By plotting f(CAg2S) versus time t according to the experimental data, the actual reaction rate constant k
can be estimated from the slope by least-squares regression. Subsequently, the theoretical kinetic spectral
shift curve can be calculated for each concentration of sulfide species.
Supplementary References
56. Willets, K.A. & Van Duyne, R.P. Localized surface plasmon resonance spectroscopy and
sensing. Annu. Rev. Phys. Chem. 58, 267-297 (2007).
57. Jung, L.S., Campbell, C.T., Chinowsky, T.M., Mar, M.N. & Yee, S.S. Quantitative interpretation
of the response of surface plasmon resonance sensors to adsorbed films. Langmuir 14, 5636-
5648 (1998).
58. Freundlich, H. Colloid and Capillary Chemistry. (Methuen, London, 1926).