146 32 practical_significance
25
MATH& 146 Lesson 32 Practical Significance 1
Transcript of 146 32 practical_significance
MATH& 146
Lesson 32
Practical Significance
1
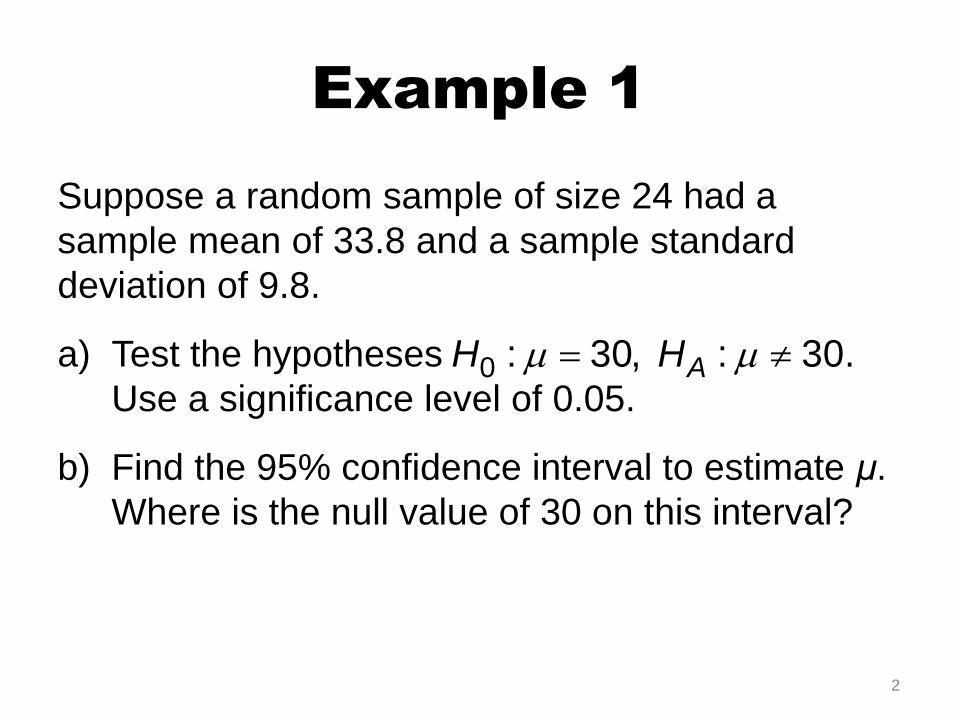
Example 1
Suppose a random sample of size 24 had a
sample mean of 33.8 and a sample standard
deviation of 9.8.
a) Test the hypotheses
Use a significance level of 0.05.
b) Find the 95% confidence interval to estimate μ.
Where is the null value of 30 on this interval?
2
0 : 30, : 30.AH H
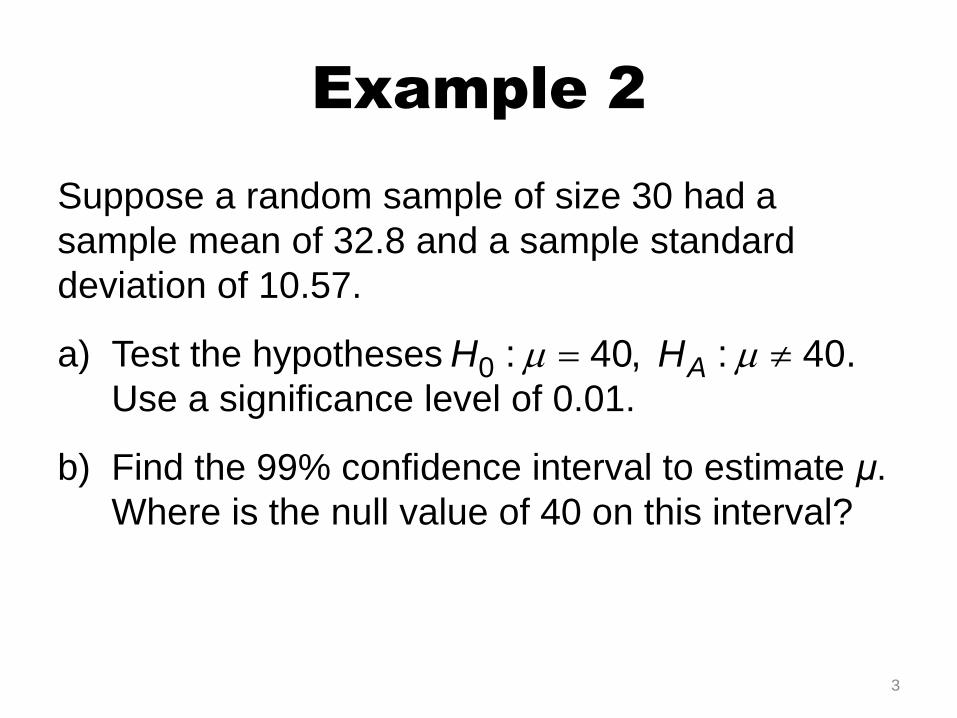
Example 2
Suppose a random sample of size 30 had a
sample mean of 32.8 and a sample standard
deviation of 10.57.
a) Test the hypotheses
Use a significance level of 0.01.
b) Find the 99% confidence interval to estimate μ.
Where is the null value of 40 on this interval?
3
0 : 40, : 40.AH H

Example 3
Suppose a random sample of size 10 had a
sample mean of 19.9 and a sample standard
deviation of 6.85.
a) Test the hypotheses
Use a significance level of 0.05.
b) Find the 95% confidence interval to estimate μ.
Where is the null value of 15 on this interval?
4
0 : 15, : 15.AH H
Confidence Intervals and
Tests
There is a close relationship between confidence
intervals and significance tests.
Specifically, if a point estimate is significantly
different from the null value at the 0.05 level, then
the 95% confidence interval will not contain that
null value.
5
Confidence Intervals and
Tests
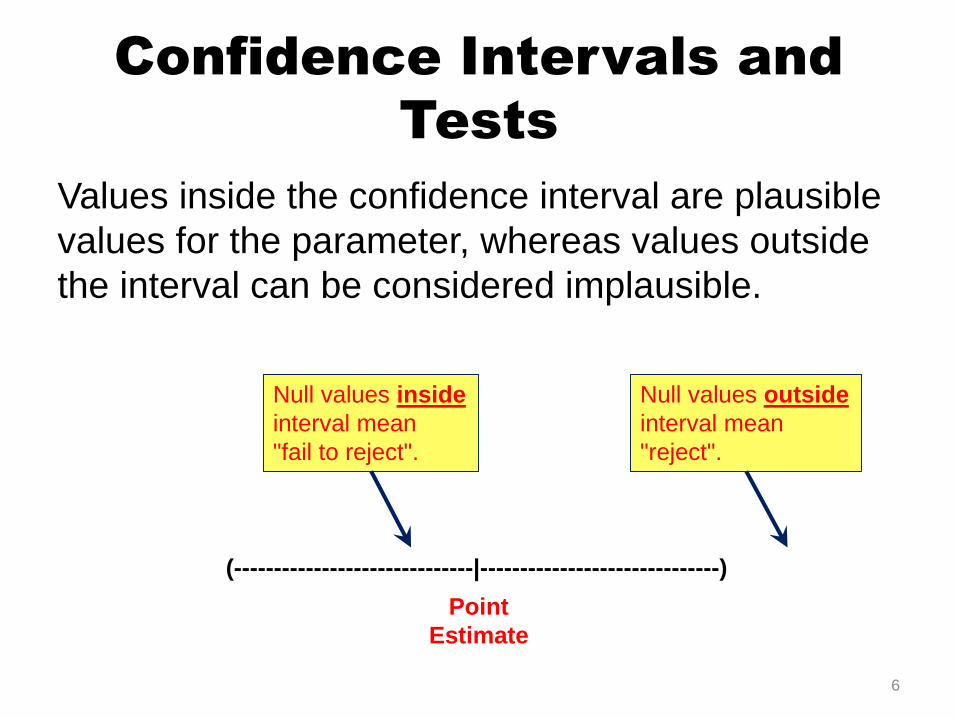
Values inside the confidence interval are plausible
values for the parameter, whereas values outside
the interval can be considered implausible.
6
(------------------------------|------------------------------)
Point
Estimate
Null values inside
interval mean
"fail to reject".
Null values outside
interval mean
"reject".
Confidence Intervals and
Tests
Looking at non-significant effects in terms of
confidence intervals makes clear why the null
hypothesis should not be accepted when it is not
rejected: Every value in the confidence interval is
a plausible value of the parameter.
If a null value is in the interval, then it is plausible
and cannot be rejected. However, there is an
infinite number of other values in the interval
(assuming continuous measurement), and none of
them can be rejected either.
7
Example 4
The null hypothesis for a particular experiment is
that the mean test score is 20. If the 95%
confidence interval is (18, 24), can you reject the
null hypothesis?
No. You cannot reject the null hypothesis because
the confidence interval shows that 20 is a plausible
value of the population parameter.
8

Example 5
Which of these 95% confidence intervals represent
samples that are significantly different from zero?
Select all that apply.
a) (–4.6, –1.8)
b) (–0.2, 8.1)
c) (–5.1, 6.7)
d) (3.0, 10.9)
9
Example 6
True or false?
If a 95% confidence interval contains 0, so will the
99% confidence interval.
True. The 99% confidence interval contains all of
the values that the 95% confidence interval has,
but it extends farther at both ends and has other
values, too. If something is not significant at the
.05 level, it is also non-significant at the .01 level.
10
Example 7
A researcher hypothesizes that the lowering in
cholesterol associated with weight loss is really
due to exercise. To test this, the researcher
carefully controls for exercise while comparing the
cholesterol levels of a group of subjects who lose
weight by dieting with a control group that does not
diet. The difference between groups in cholesterol
is not significant. Can the researcher claim that
weight loss has no effect?
11
Problems with Significance
Failing to reject the null hypothesis can mean
either that (1) the null hypothesis is true, or (2) the
alternative was actually true but there just wasn't
enough evidence (a Type 2 Error).
However, rejecting the null hypothesis can also be
problematic.
12
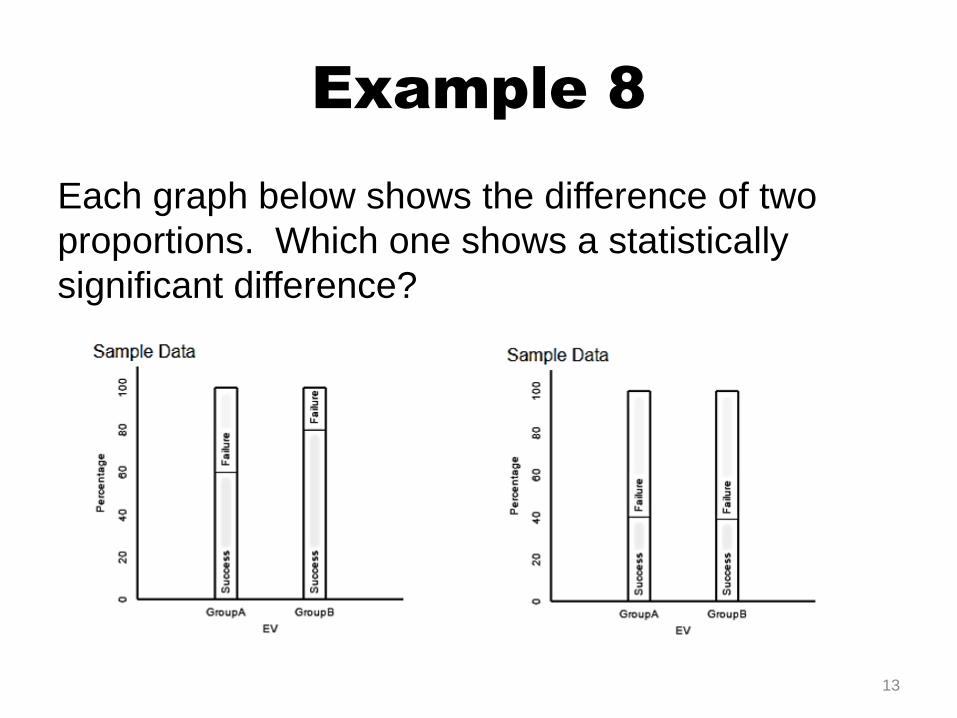
Example 8
Each graph below shows the difference of two
proportions. Which one shows a statistically
significant difference?
13
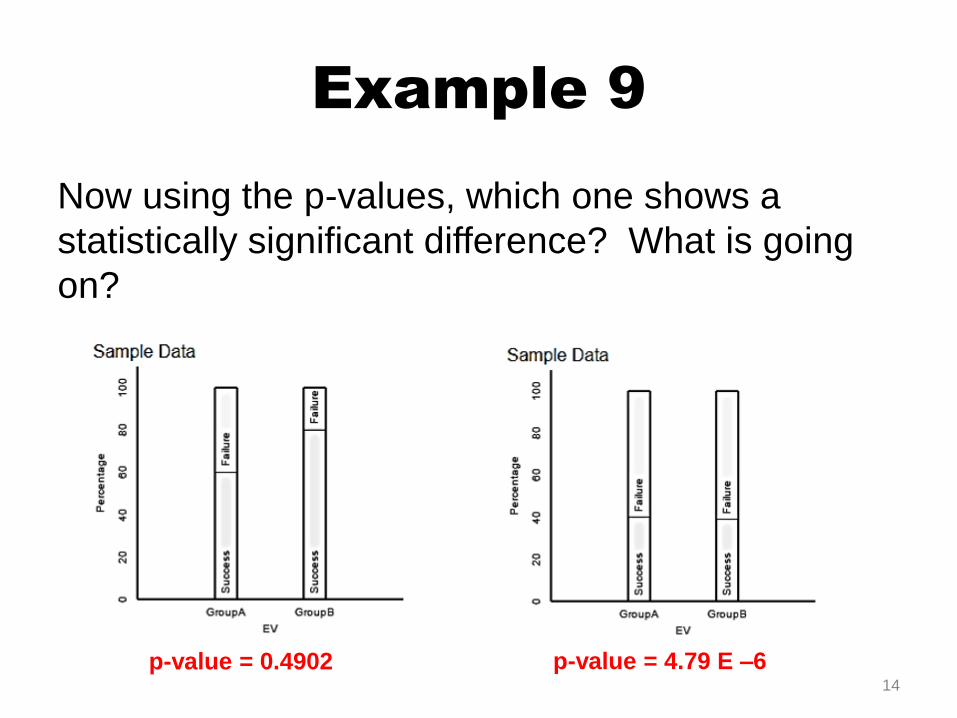
Example 9
Now using the p-values, which one shows a
statistically significant difference? What is going
on?
14
p-value = 0.4902 p-value = 4.79 E –6
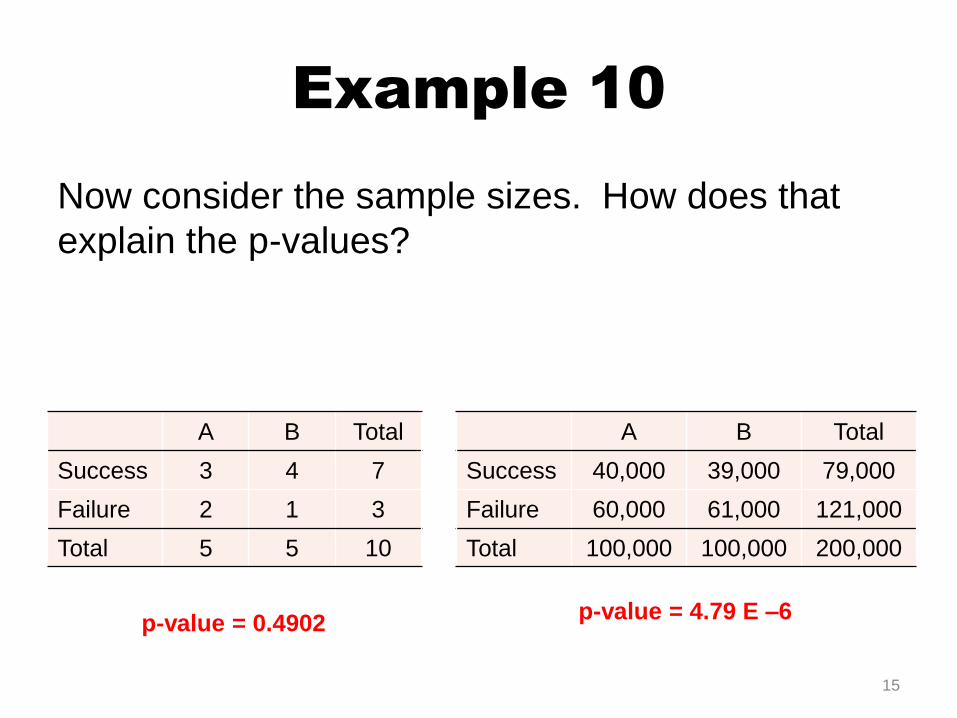
Example 10
Now consider the sample sizes. How does that
explain the p-values?
15
p-value = 0.4902p-value = 4.79 E –6
A B Total
Success 3 4 7
Failure 2 1 3
Total 5 5 10
A B Total
Success 40,000 39,000 79,000
Failure 60,000 61,000 121,000
Total 100,000 100,000 200,000
Problems with Significance
One problem with hypothesis tests is that samples
that are too large will tend to reject the null
hypothesis regardless of any effect.
The solution is that when you do reject the null
hypothesis, you should also consider the effect
size.
16
Effect Size
In most of the hypothesis-testing situations, we are
interested in comparing a population mean or
proportion to a specific null value. In many
research situations, we would like to know
something about the magnitude of the comparison.
The test statistic and p-value for a test are not
useful for this purpose because they depend on
the size of the sample.
17
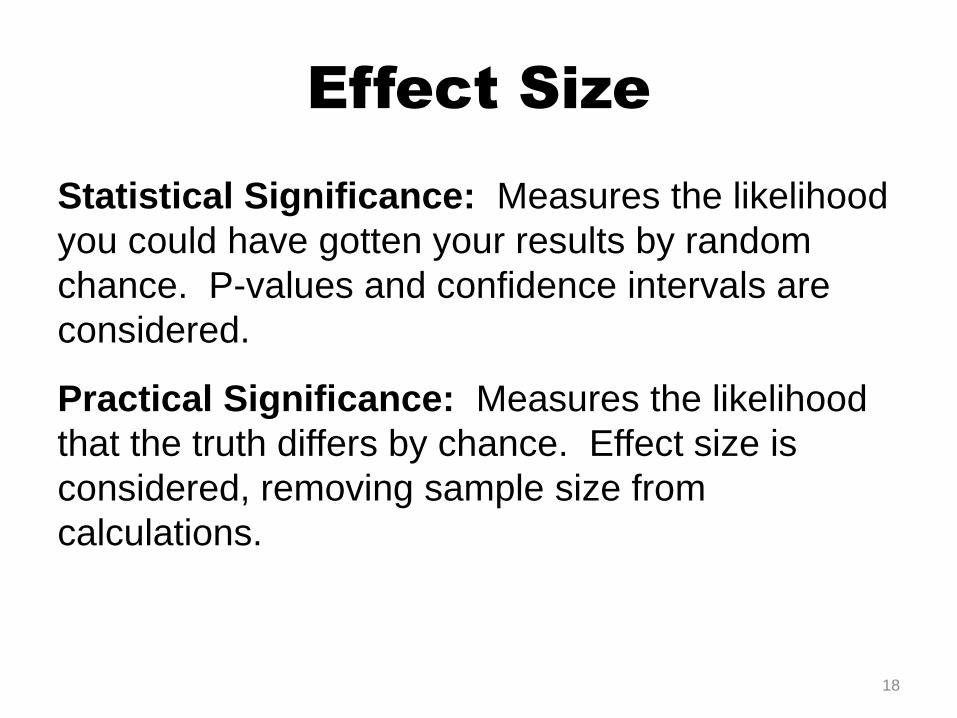
Effect Size
Statistical Significance: Measures the likelihood
you could have gotten your results by random
chance. P-values and confidence intervals are
considered.
Practical Significance: Measures the likelihood
that the truth differs by chance. Effect size is
considered, removing sample size from
calculations.
18
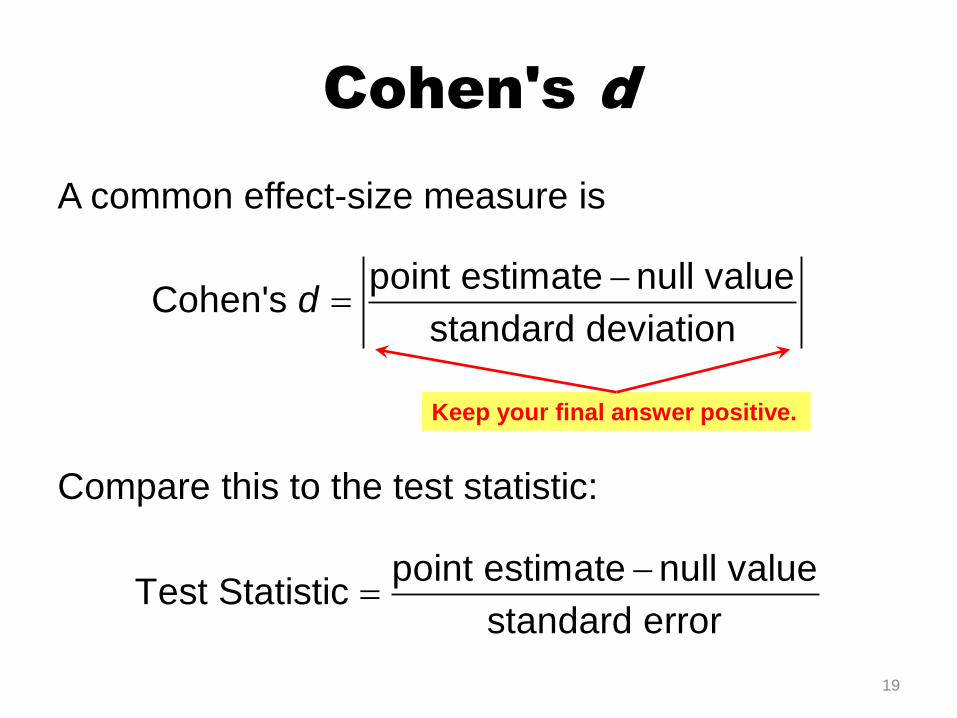
Cohen's d
A common effect-size measure is
Compare this to the test statistic:
point estimate null valueCohen's
standard deviationd
19
point estimate null valueTest Statistic
standard error
Keep your final answer positive.
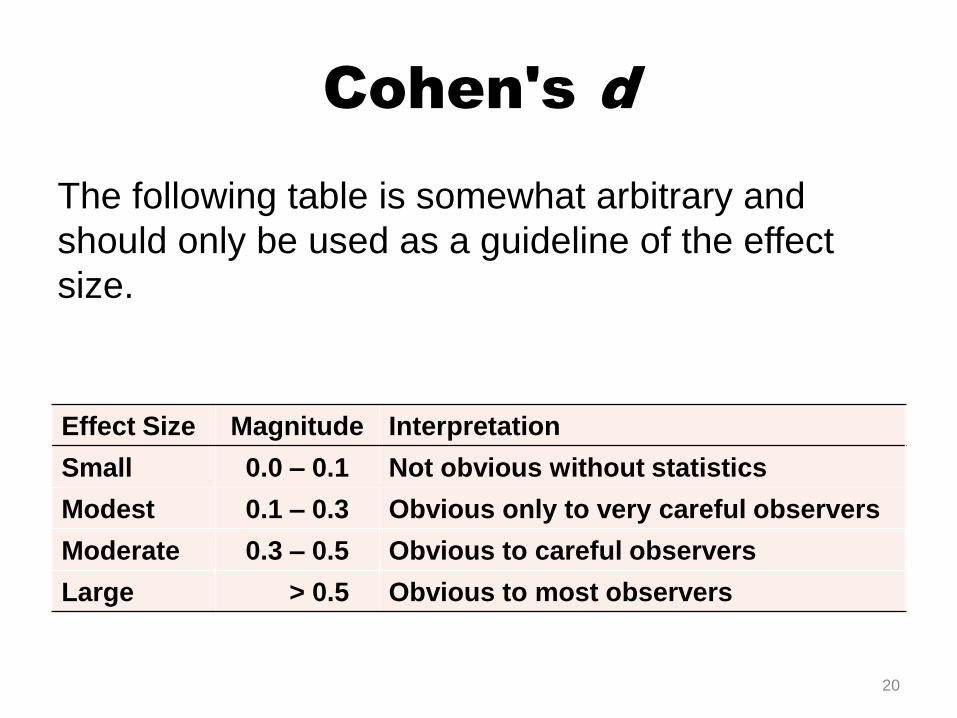
Cohen's d
The following table is somewhat arbitrary and
should only be used as a guideline of the effect
size.
Effect Size Magnitude Interpretation
Small 0.0 – 0.1 Not obvious without statistics
Modest 0.1 – 0.3 Obvious only to very careful observers
Moderate 0.3 – 0.5 Obvious to careful observers
Large > 0.5 Obvious to most observers
20
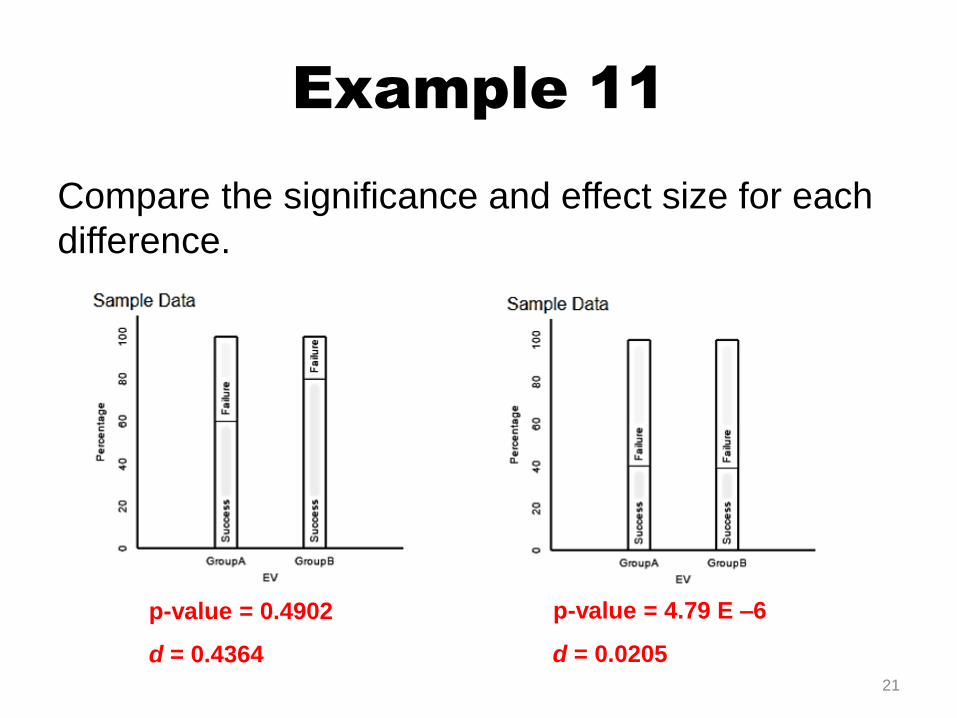
Example 11
Compare the significance and effect size for each
difference.
21
p-value = 0.4902 p-value = 4.79 E –6
d = 0.0205d = 0.4364
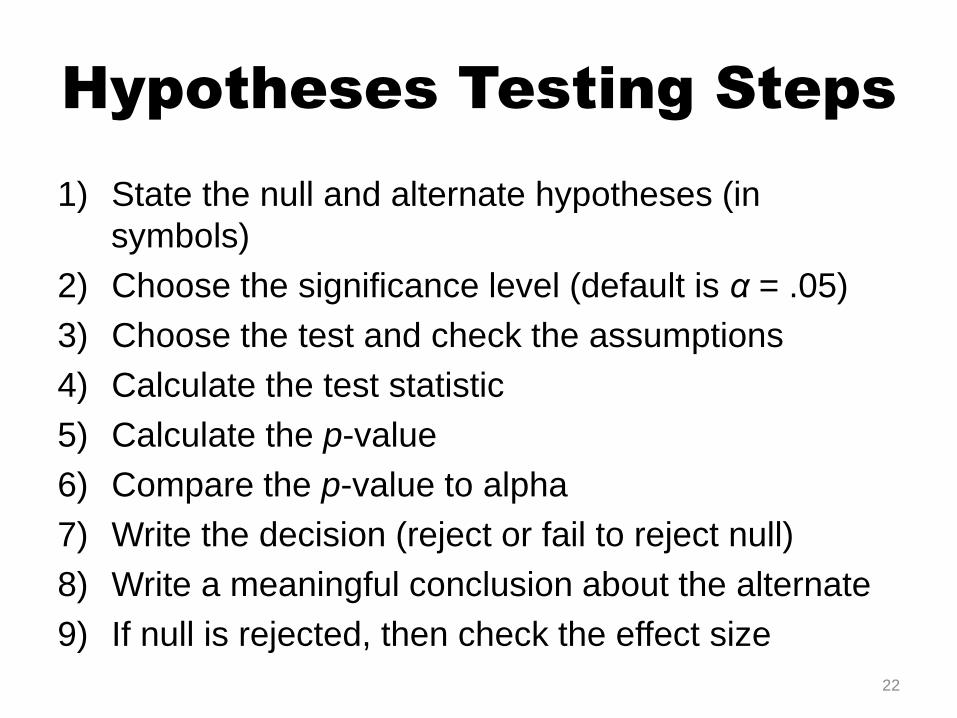
Hypotheses Testing Steps
1) State the null and alternate hypotheses (in
symbols)
2) Choose the significance level (default is α = .05)
3) Choose the test and check the assumptions
4) Calculate the test statistic
5) Calculate the p-value
6) Compare the p-value to alpha
7) Write the decision (reject or fail to reject null)
8) Write a meaningful conclusion about the alternate
9) If null is rejected, then check the effect size
22
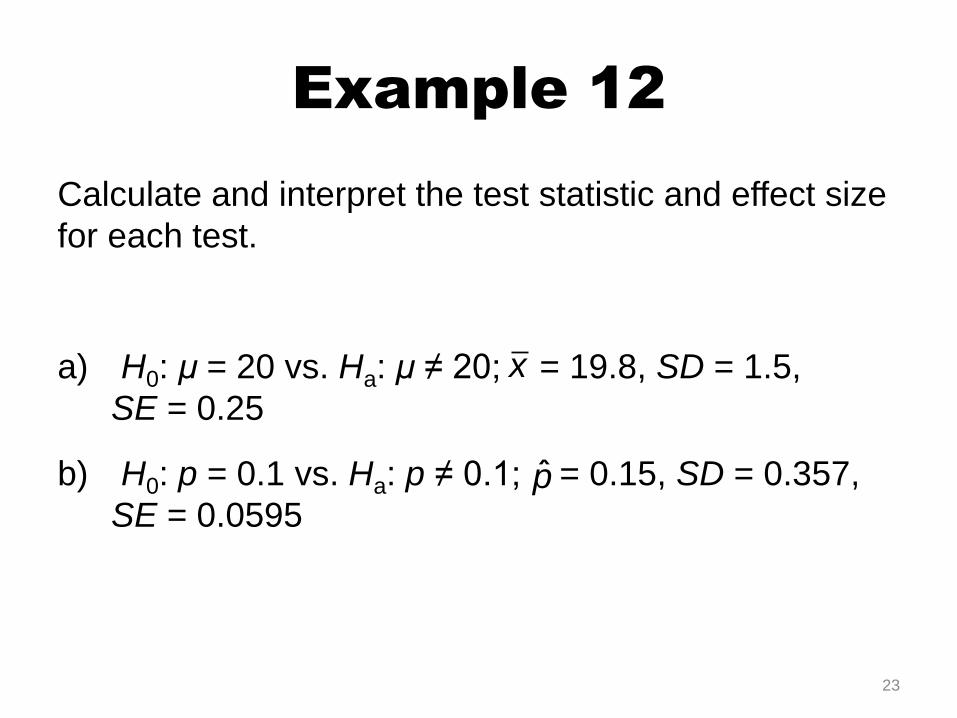
Example 12
Calculate and interpret the test statistic and effect size
for each test.
a) H0: μ = 20 vs. Ha: μ ≠ 20; = 19.8, SD = 1.5,
SE = 0.25
b) H0: p = 0.1 vs. Ha: p ≠ 0.1; = 0.15, SD = 0.357,
SE = 0.0595
x
23
p̂
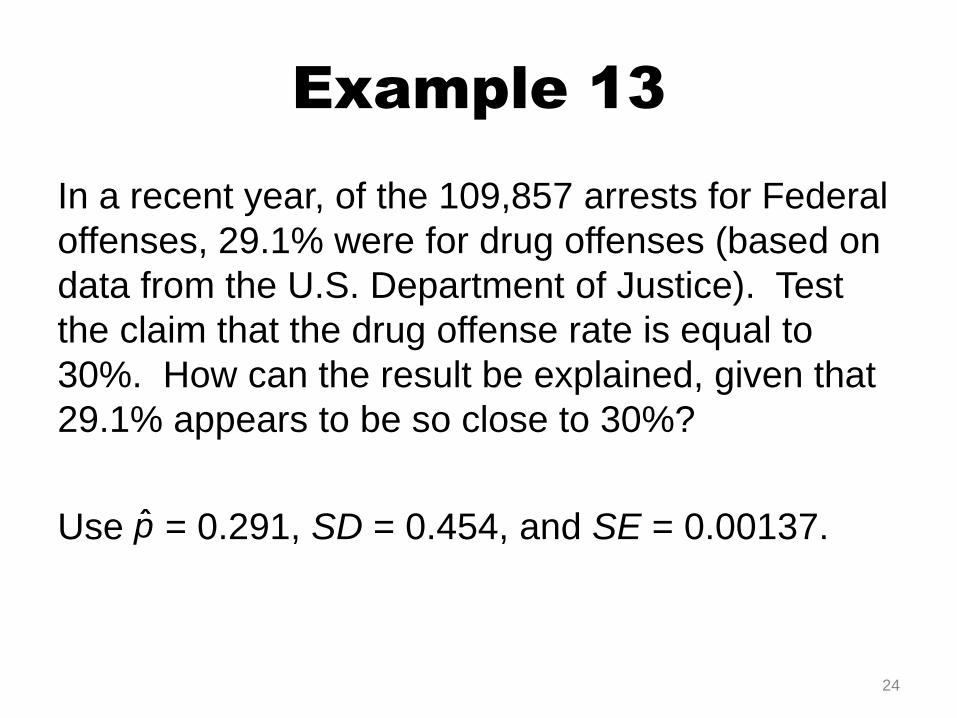
Example 13
In a recent year, of the 109,857 arrests for Federal
offenses, 29.1% were for drug offenses (based on
data from the U.S. Department of Justice). Test
the claim that the drug offense rate is equal to
30%. How can the result be explained, given that
29.1% appears to be so close to 30%?
Use = 0.291, SD = 0.454, and SE = 0.00137.
24
p̂

Example 14
USA Today ran a report about a University of North
Carolina poll of 1248 adults from the Southern United
States. It was reported that 8% of those surveyed
believe that Elvis Presley still lives. The article began
with the claim that "almost 1 out of 10" Southerners
still thinks Elvis is alive. Test the claim that the true
percentage is less than 10%. Based on the result,
determine whether the 8% sample result justifies the
phrase "almost 1 out of 10."
Use = 0.08, SD = 0.271, and SE = 0.00768.
25
p̂