

γλώσσες
Σελίδες
Νομικός


WEEK 7 HOMEWORK HELPNUMBERS 9,10 & 12
B HeardNot to be copied, posted, shared without my permission. Students can download one copy for their personal use.
WEEK 7 HOMEWORK HELP (MORE)
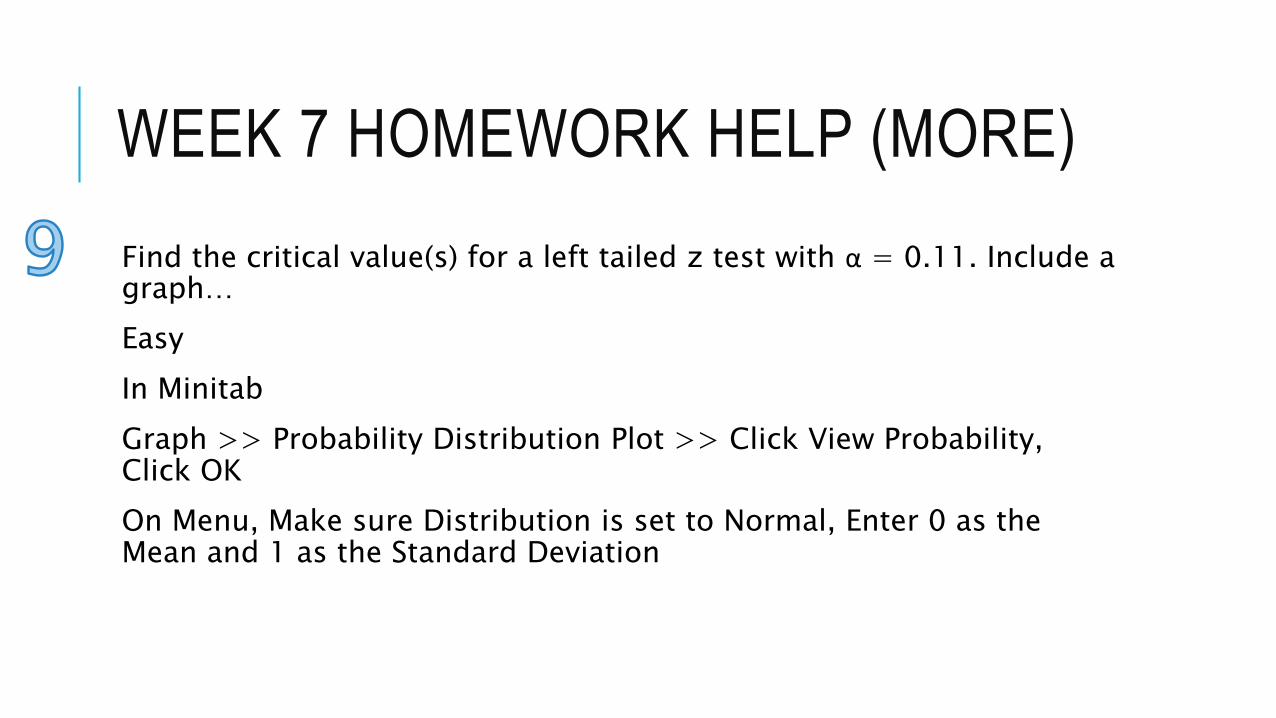
Find the critical value(s) for a left tailed z test with α = 0.11. Include a graph…
Easy
In Minitab
Graph >> Probability Distribution Plot >> Click View Probability, Click OK
On Menu, Make sure Distribution is set to Normal, Enter 0 as the Mean and 1 as the Standard Deviation
WEEK 7 HOMEWORK HELP (MORE)
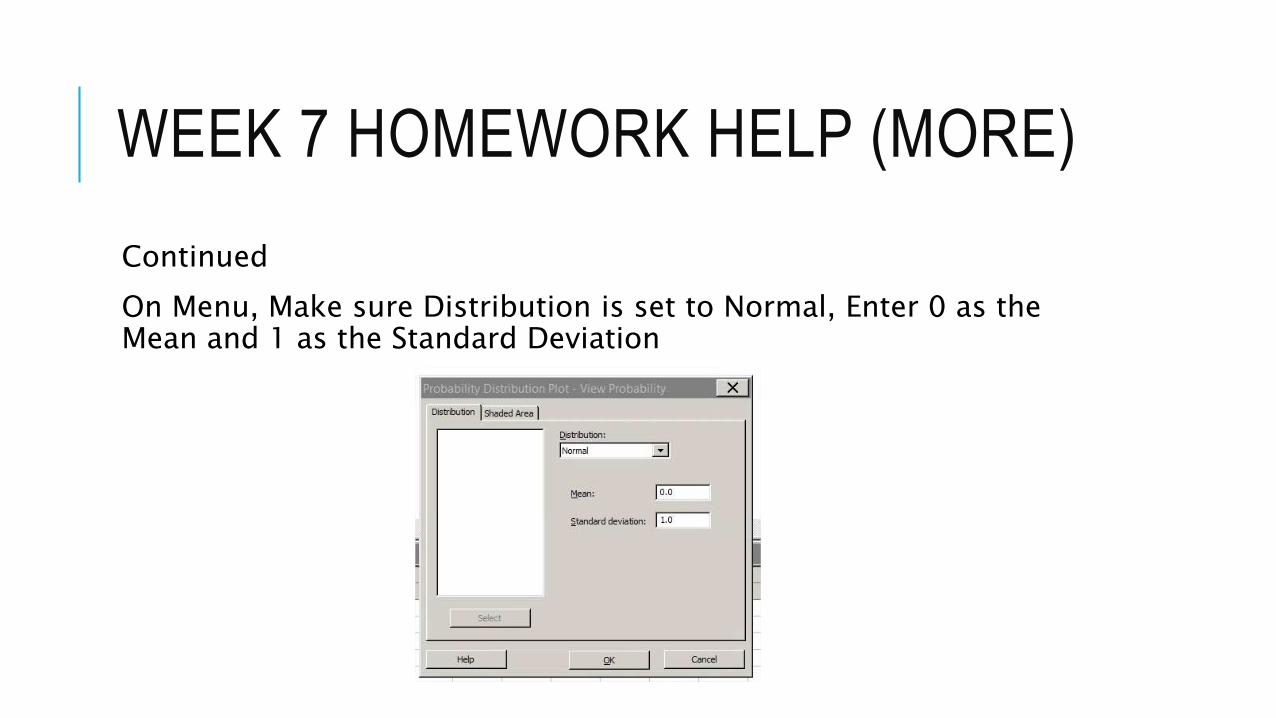
Continued
On Menu, Make sure Distribution is set to Normal, Enter 0 as the Mean and 1 as the Standard Deviation
WEEK 7 HOMEWORK HELP (MORE)
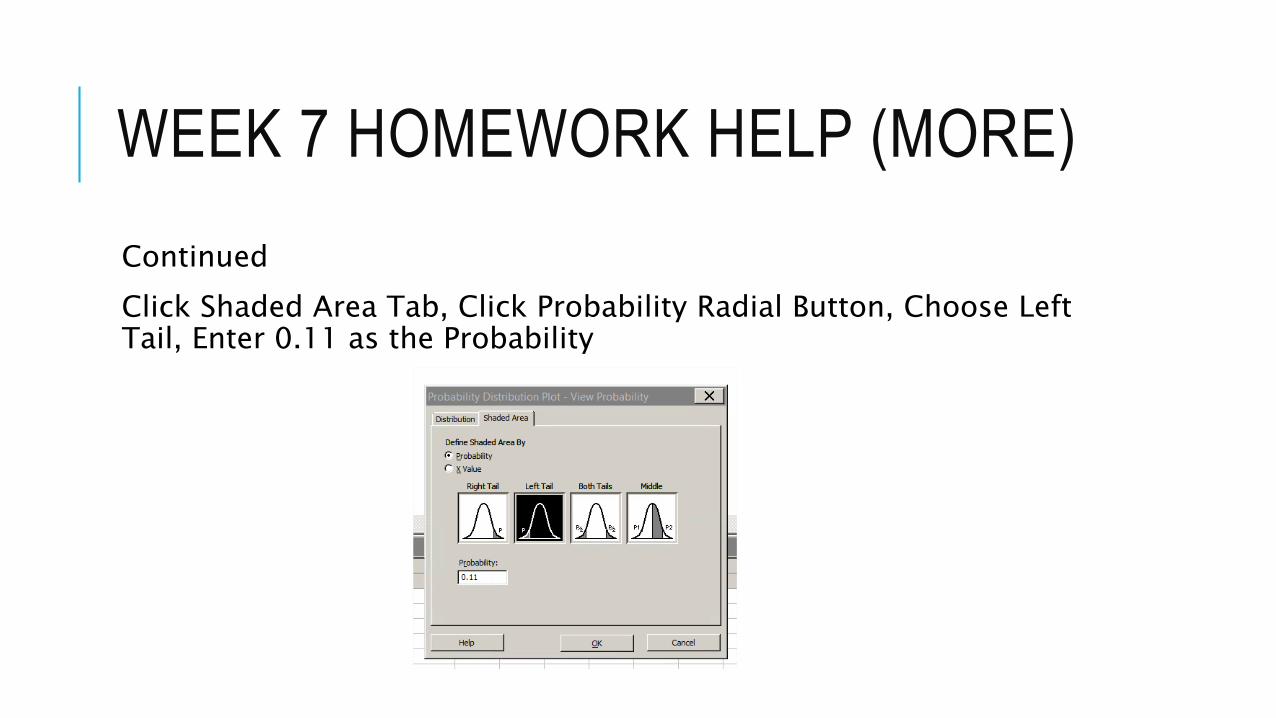
Continued
Click Shaded Area Tab, Click Probability Radial Button, Choose Left Tail, Enter 0.11 as the Probability
WEEK 7 HOMEWORK HELP (MORE)
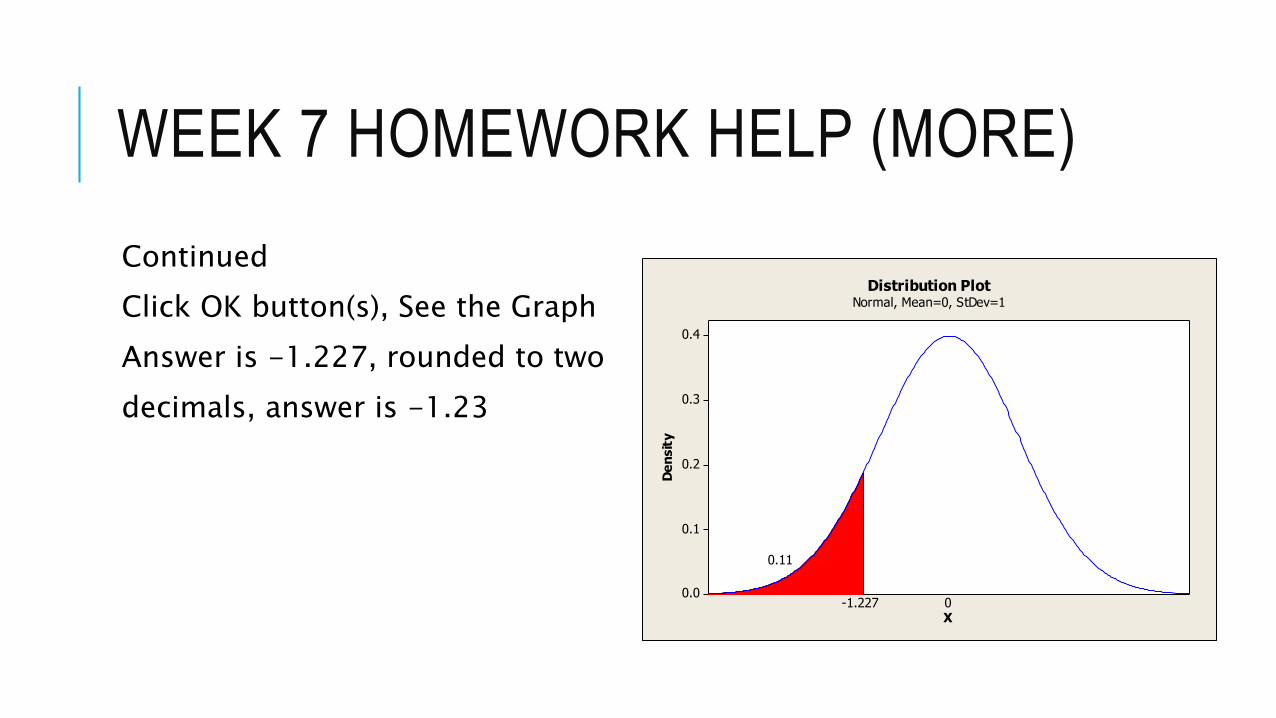
Continued
Click OK button(s), See the Graph
Answer is -1.227, rounded to two
decimals, answer is -1.23
0.4
0.3
0.2
0.1
0.0
X
De
nsit
y
-1.227
0.11
0
Distribution PlotNormal, Mean=0, StDev=1
WEEK 7 HOMEWORK HELP (MORE)
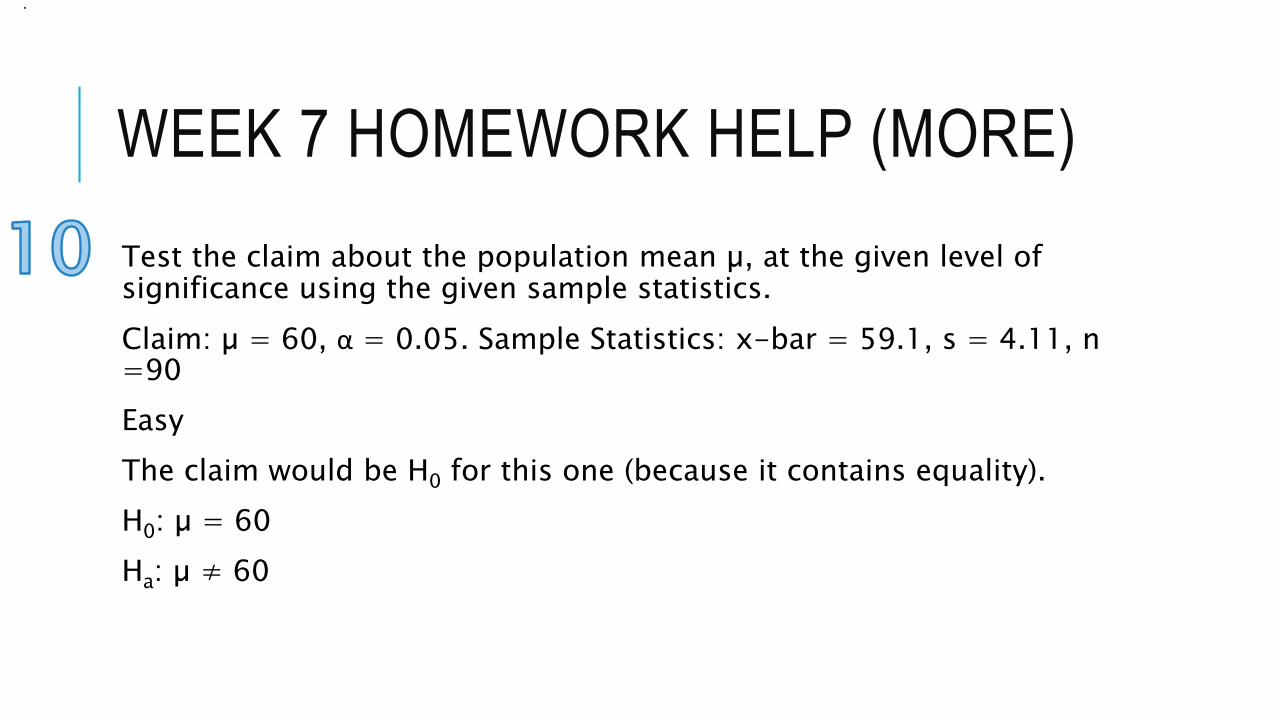
Test the claim about the population mean µ, at the given level of significance using the given sample statistics.
Claim: µ = 60, α = 0.05. Sample Statistics: x-bar = 59.1, s = 4.11, n =90
Easy
The claim would be H0 for this one (because it contains equality).
H0: µ = 60
Ha: µ ≠ 60
.
WEEK 7 HOMEWORK HELP (MORE)
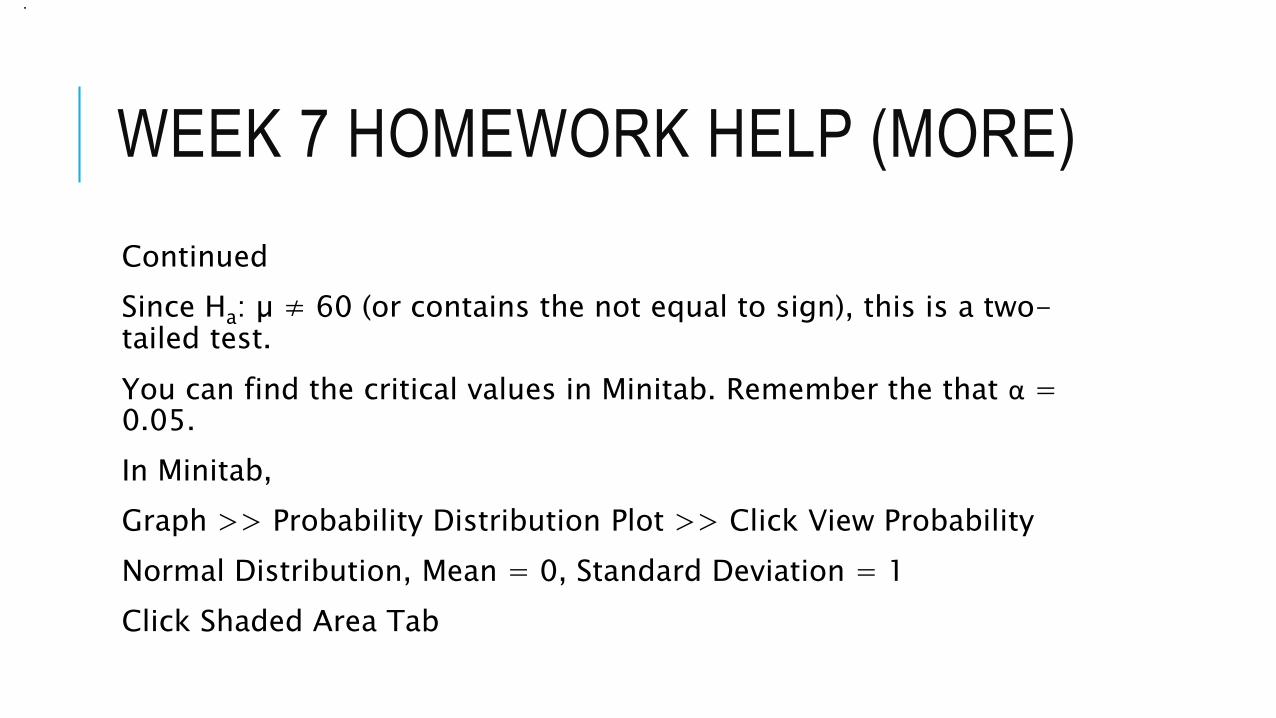
Continued
Since Ha: µ ≠ 60 (or contains the not equal to sign), this is a two-tailed test.
You can find the critical values in Minitab. Remember the that α = 0.05.
In Minitab,
Graph >> Probability Distribution Plot >> Click View Probability
Normal Distribution, Mean = 0, Standard Deviation = 1
Click Shaded Area Tab
.
WEEK 7 HOMEWORK HELP (MORE)
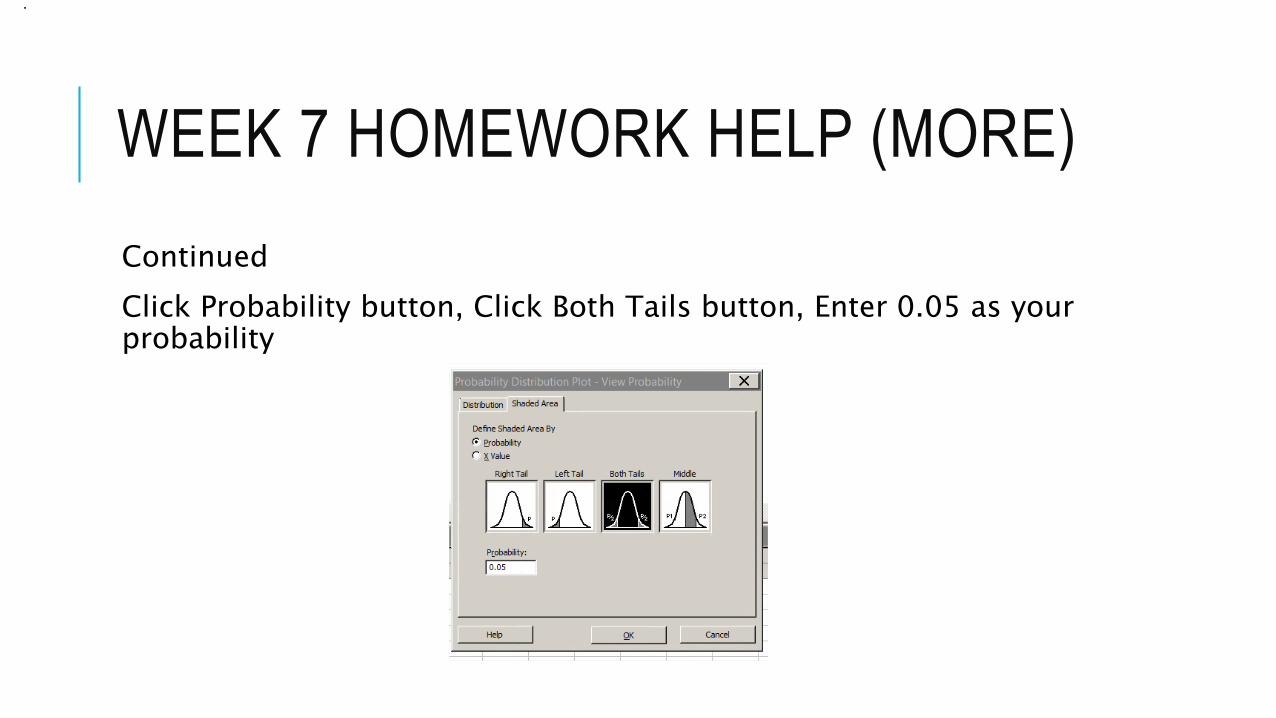
Continued
Click Probability button, Click Both Tails button, Enter 0.05 as your probability
.
WEEK 7 HOMEWORK HELP (MORE)
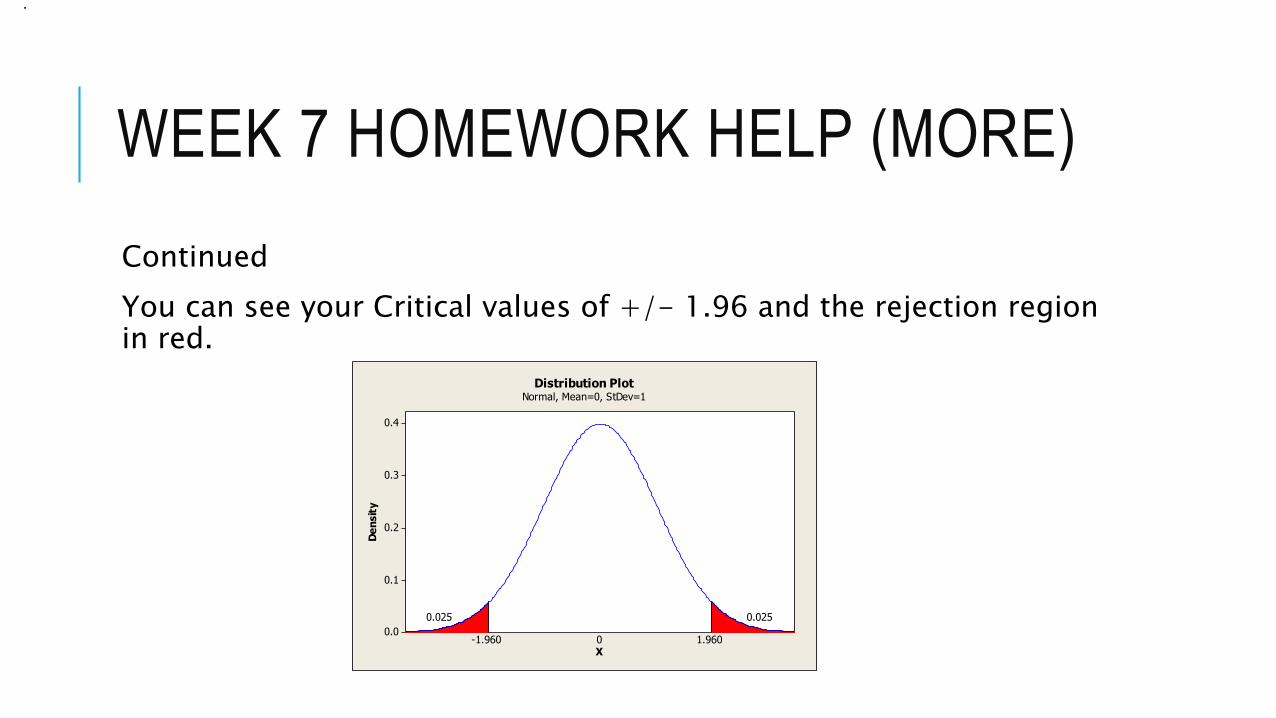
Continued
You can see your Critical values of +/- 1.96 and the rejection region in red.
.
0.4
0.3
0.2
0.1
0.0
X
De
nsit
y
-1.960
0.025
1.960
0.025
0
Distribution PlotNormal, Mean=0, StDev=1
WEEK 7 HOMEWORK HELP (MORE)
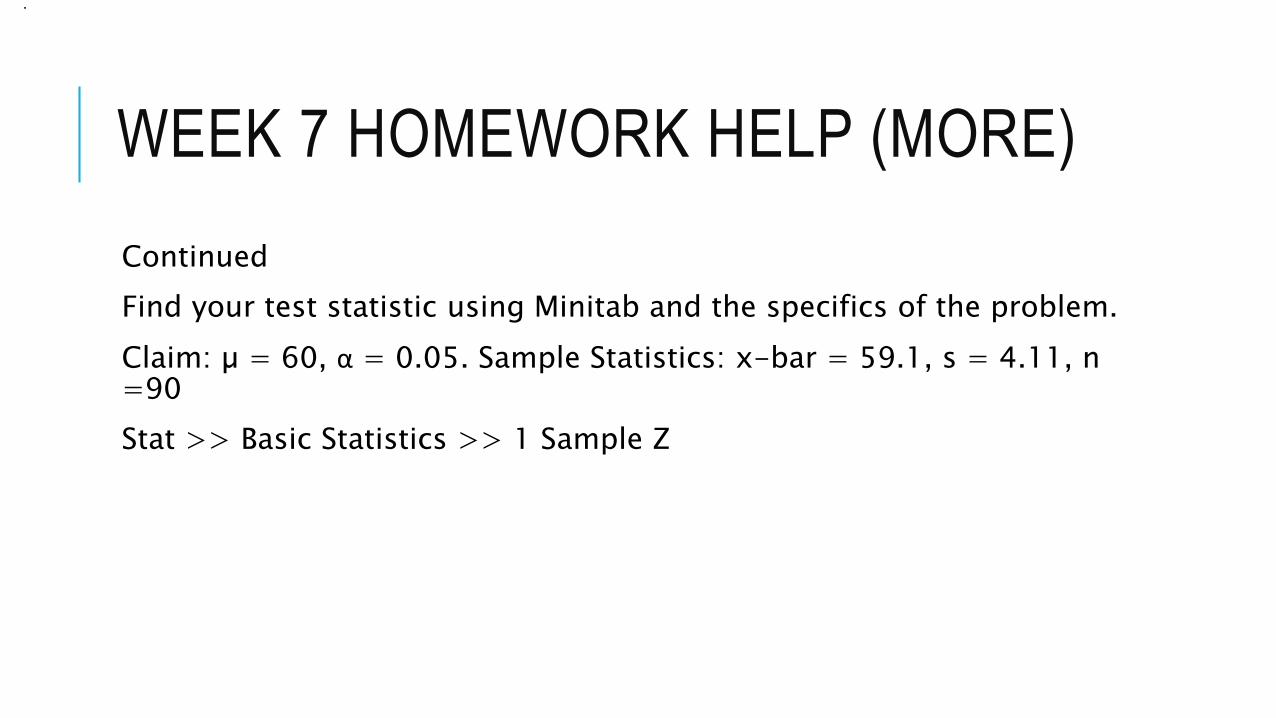
Continued
Find your test statistic using Minitab and the specifics of the problem.
Claim: µ = 60, α = 0.05. Sample Statistics: x-bar = 59.1, s = 4.11, n =90
Stat >> Basic Statistics >> 1 Sample Z
.
WEEK 7 HOMEWORK HELP (MORE)
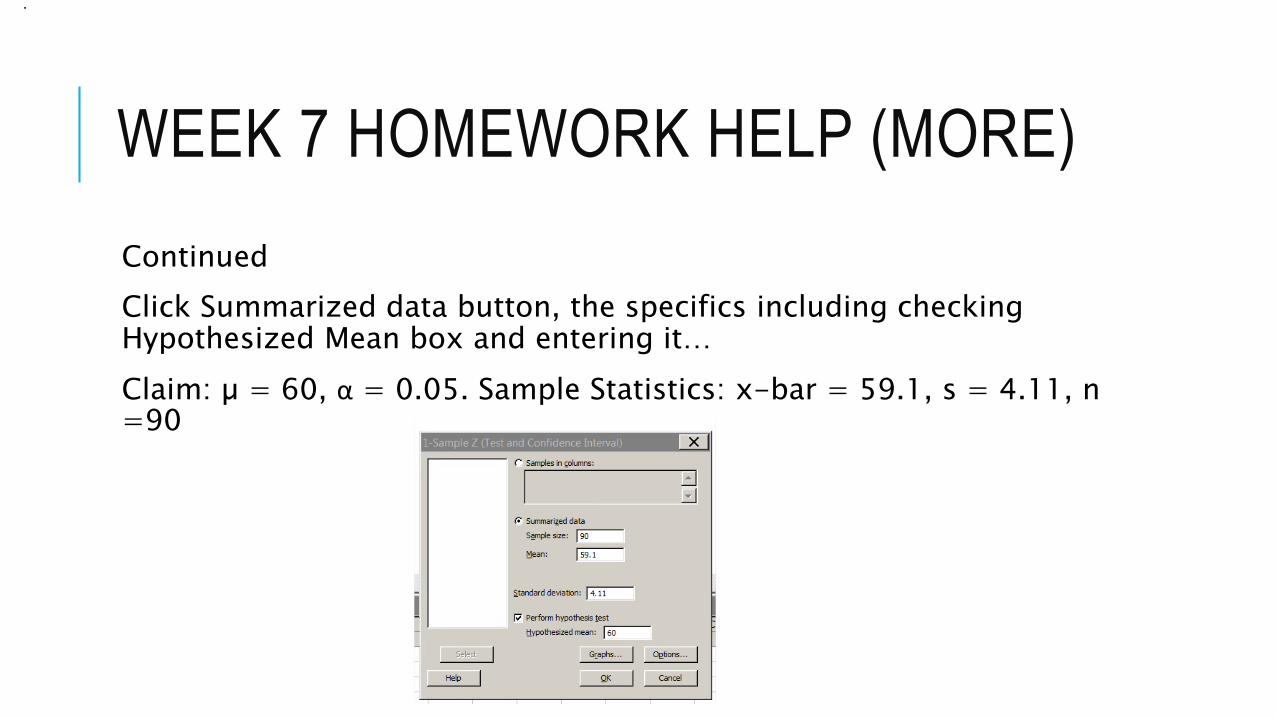
Continued
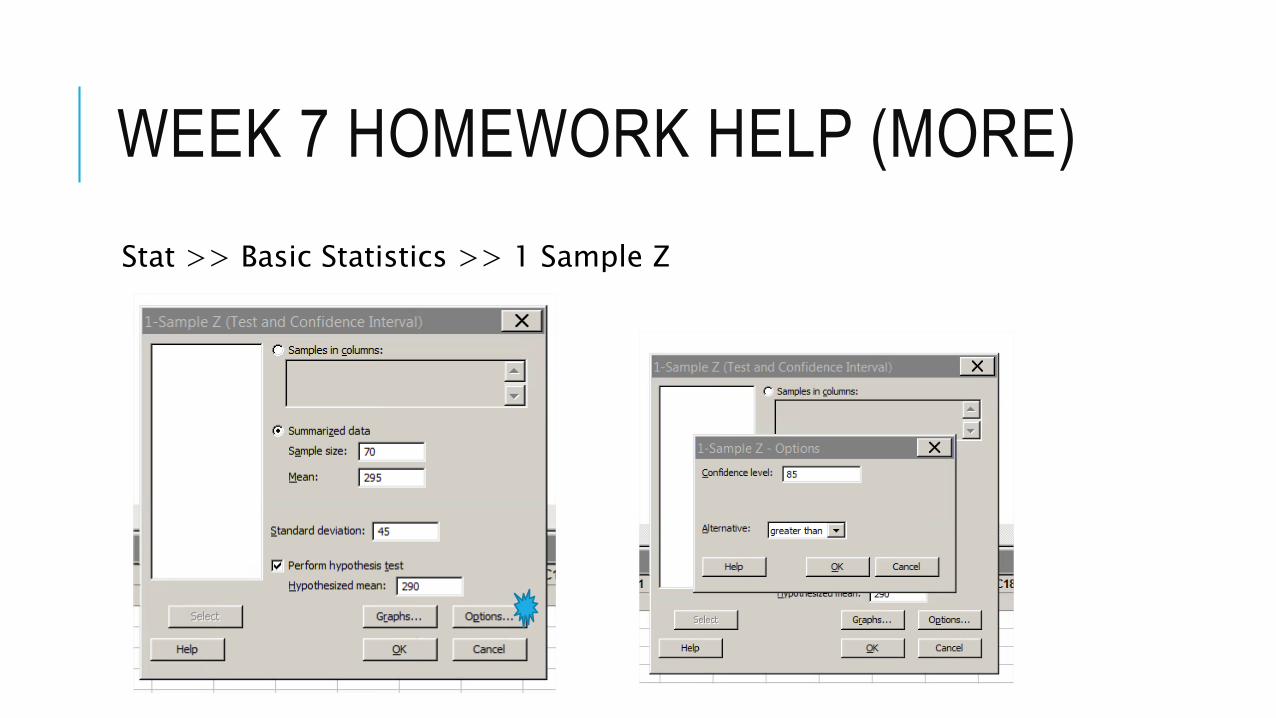
Click Summarized data button, the specifics including checking Hypothesized Mean box and entering it…
Claim: µ = 60, α = 0.05. Sample Statistics: x-bar = 59.1, s = 4.11, n =90
.
WEEK 7 HOMEWORK HELP (MORE)
Continued
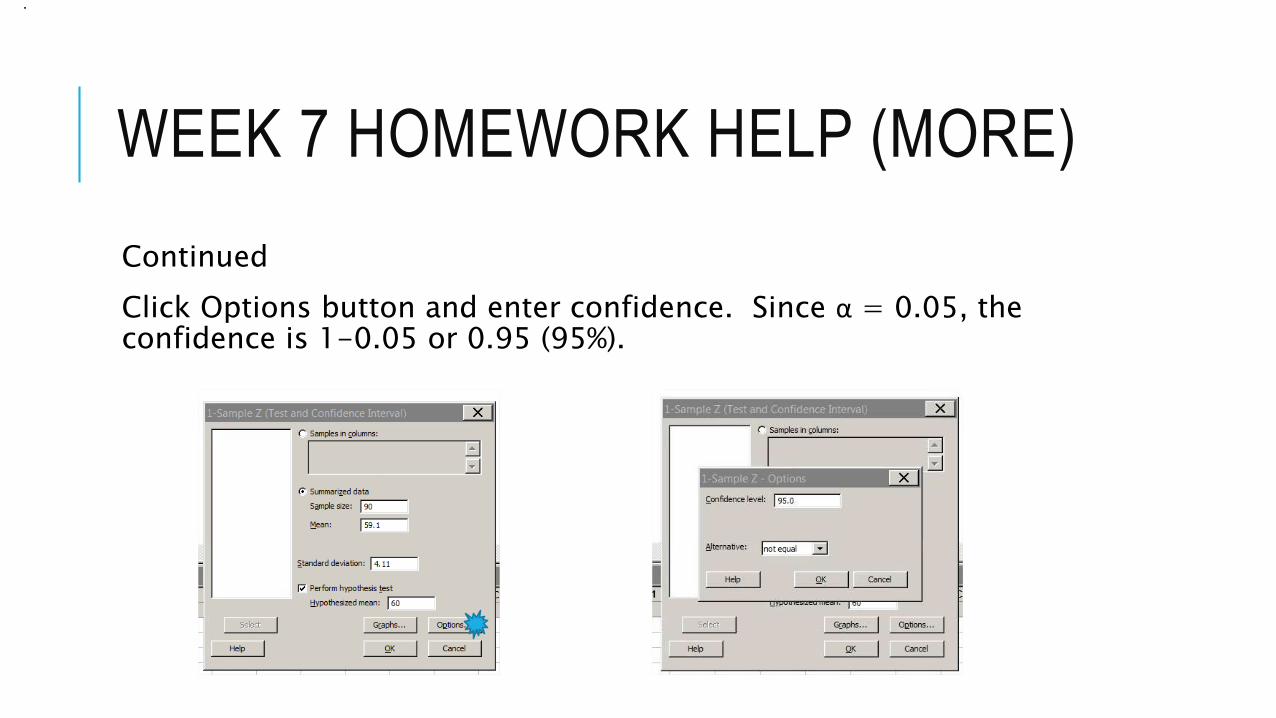
Click Options button and enter confidence. Since α = 0.05, the confidence is 1-0.05 or 0.95 (95%).
.
WEEK 7 HOMEWORK HELP (MORE)
Continued
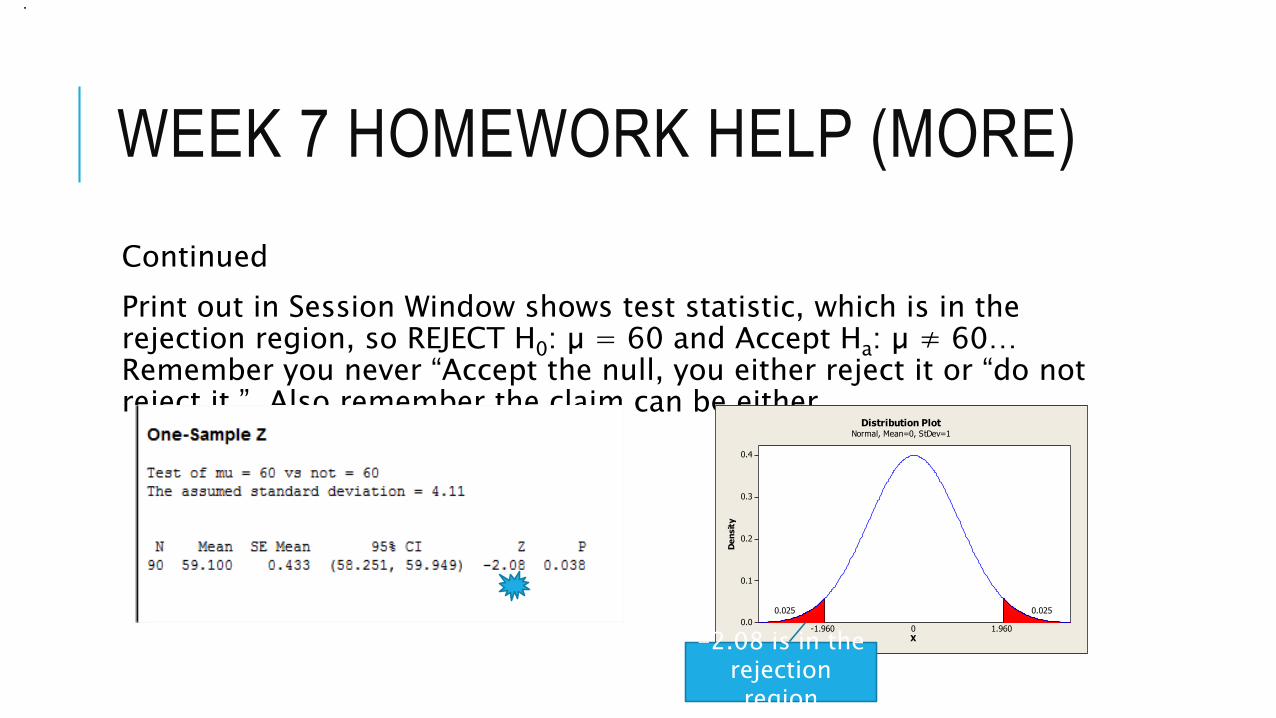
Print out in Session Window shows test statistic, which is in the rejection region, so REJECT H0: µ = 60 and Accept Ha: µ ≠ 60… Remember you never “Accept the null, you either reject it or “do not reject it.” Also remember the claim can be either…
.
0.4
0.3
0.2
0.1
0.0
X
De
nsit
y
-1.960
0.025
1.960
0.025
0
Distribution PlotNormal, Mean=0, StDev=1
-2.08 is in the rejection region
WEEK 7 HOMEWORK HELP (MORE)
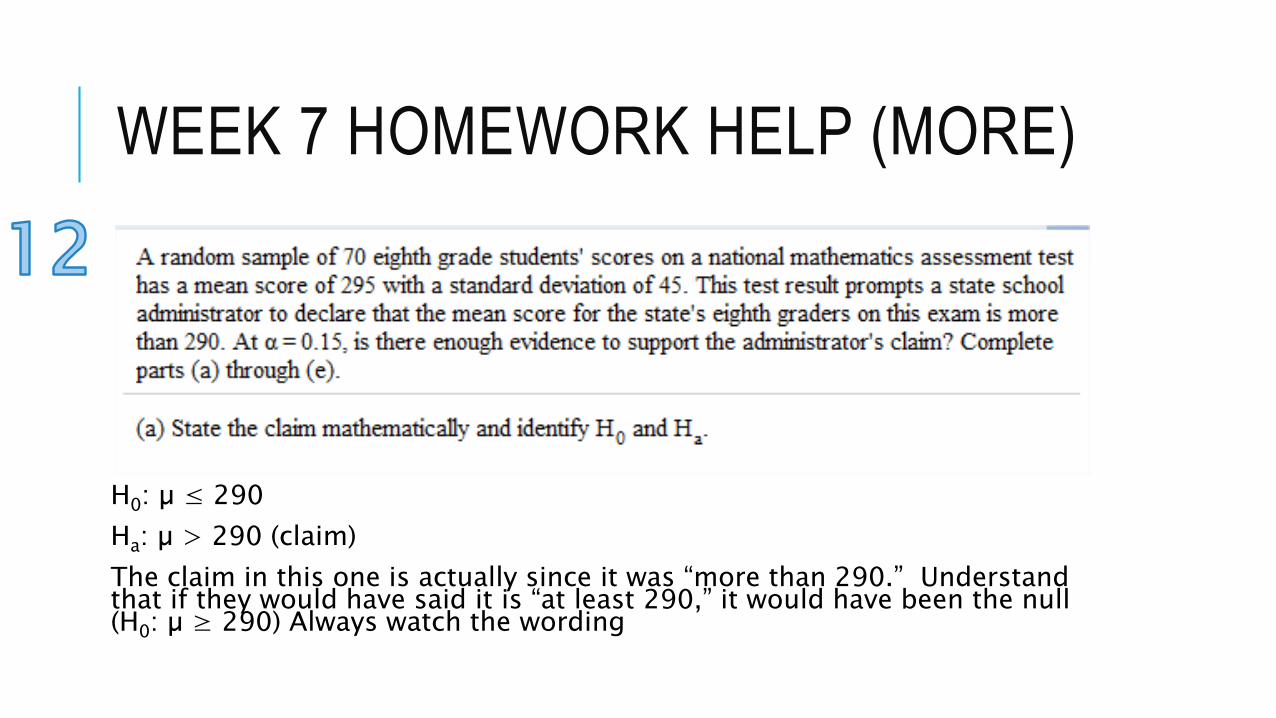
H0: µ ≤ 290
Ha: µ > 290 (claim)
The claim in this one is actually since it was “more than 290.” Understand that if they would have said it is “at least 290,” it would have been the null (H0: µ ≥ 290) Always watch the wording
WEEK 7 HOMEWORK HELP (MORE)
Continued
Same approach as in number 10 but this one is right tailed…
Why?
Always look at the Ha
Ha: µ > 290 (Pretend it is an arrow, > is “pointing right)
The only time you have two tails is when Ha contains an ≠ sign.
Ha has a >, it’s right tailed. Ha has a <, it’s left tailed.
.
WEEK 7 HOMEWORK HELP (MORE)
In Minitab, they ask us FIRST to find the standardized test statistic z and the corresponding area…
Next Chart…
WEEK 7 HOMEWORK HELP (MORE)
Stat >> Basic Statistics >> 1 Sample Z
WEEK 7 HOMEWORK HELP (MORE)
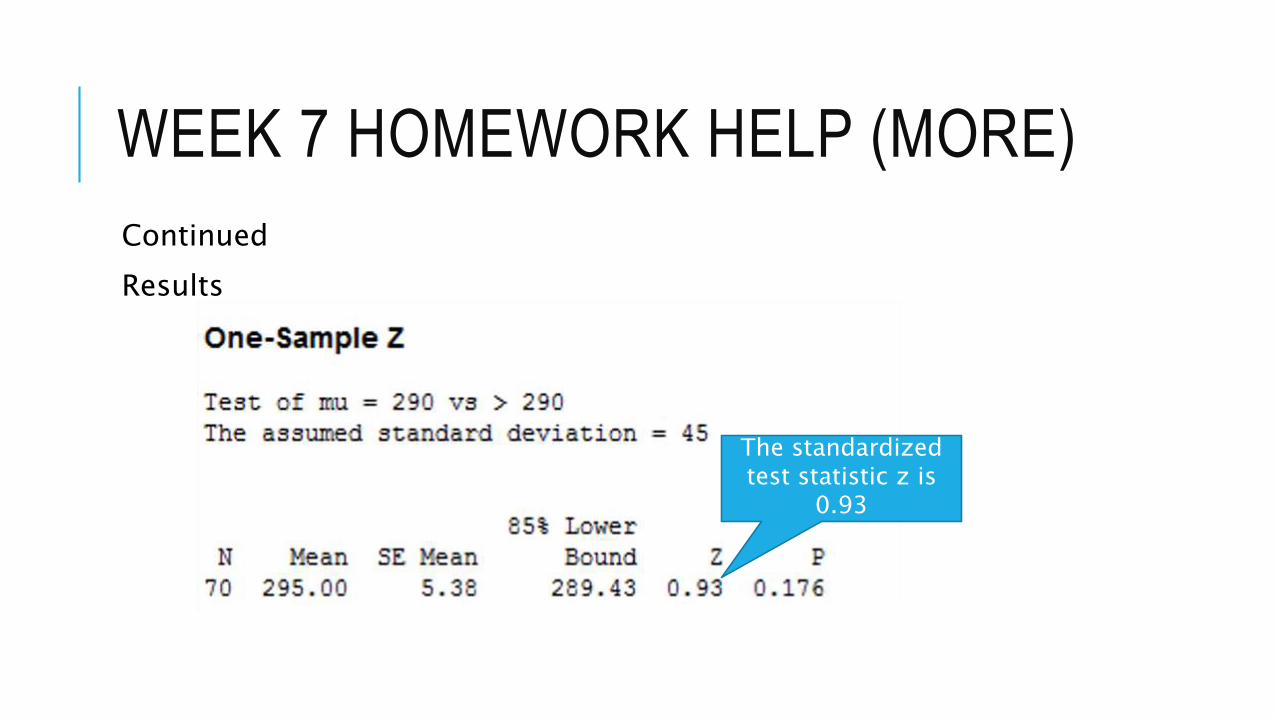
Continued
Results
The standardized test statistic z is
0.93
WEEK 7 HOMEWORK HELP (MORE)
Continued
To find the Area, you can use tables or Minitab
In Minitab
Graph >> Probability Distribution Plot > Click View Probability
Normal, Mean of 0, Standard Deviation of 1
Click Shaded Area Tab
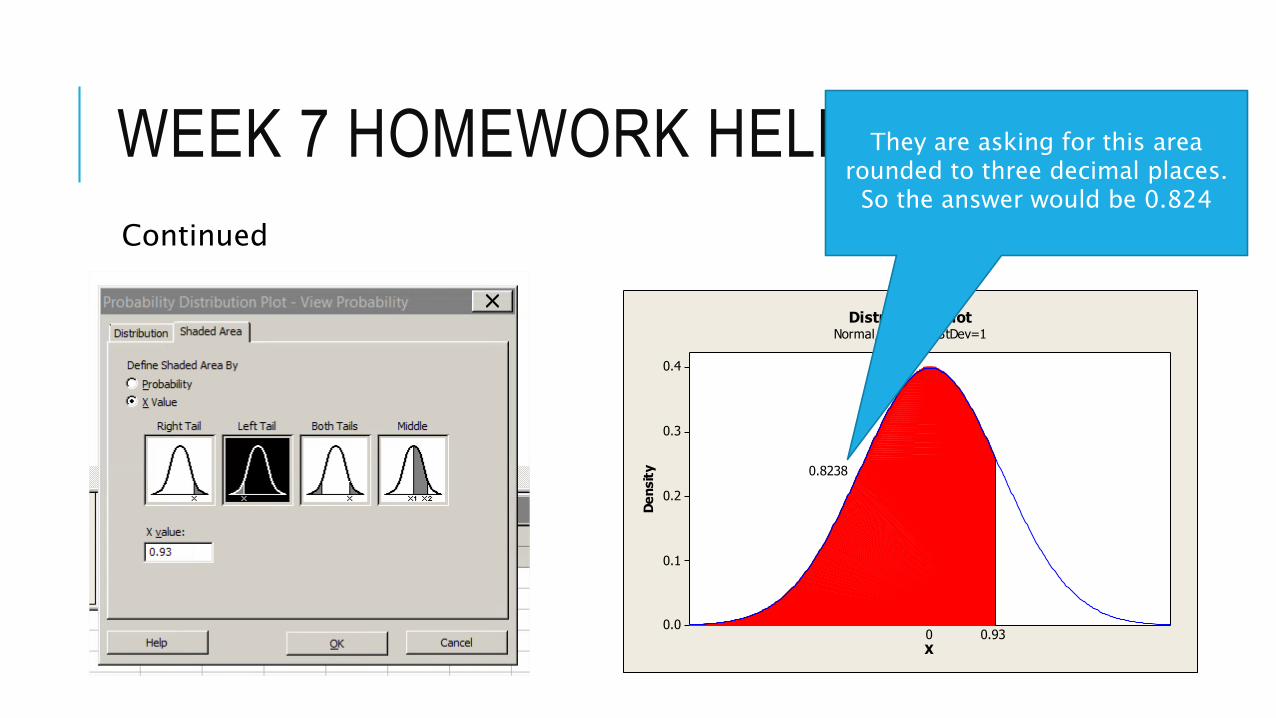
CLICK X VALUE RADIAL BUTTON, LEFT TAIL, ENTER VALUE FOR STANDARDIZED TEST STATISTIC
WEEK 7 HOMEWORK HELP (MORE)
Continued
0.4
0.3
0.2
0.1
0.0
XD
en
sit
y0.93
0.8238
0
Distribution PlotNormal, Mean=0, StDev=1
They are asking for this area rounded to three decimal places.
So the answer would be 0.824
WEEK 7 HOMEWORK HELP (MORE)
Continued
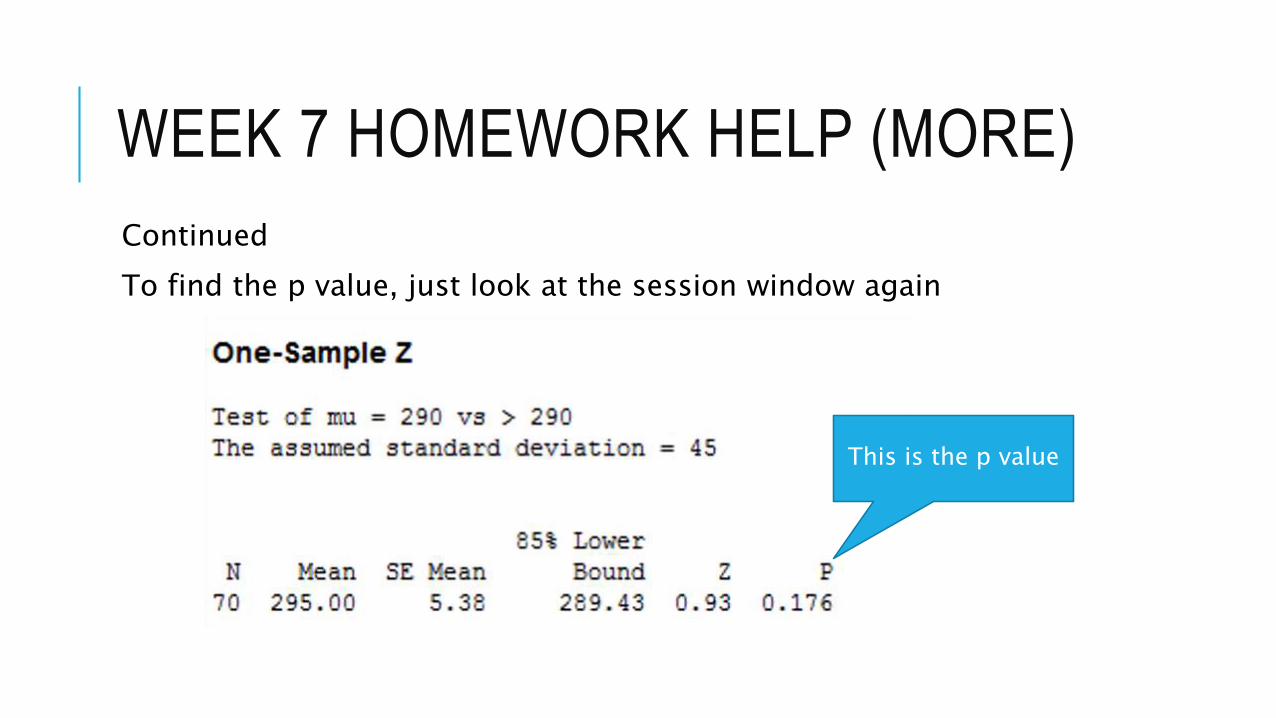
To find the p value, just look at the session window again
This is the p value
WEEK 7 HOMEWORK HELP (MORE)
Continued
This can get confusing. But Minitab sorts it out… If you chose the correct values for the hypothesis when using Minitab, it gives you the correct p value.
H0: µ ≤ 290
Ha: µ > 290
The example shows you subtracting the area from 1 or 1 – 0.824 = 0.176 (this is the same p value in your session window).
.
WEEK 7 HOMEWORK HELP (MORE)
Continued
Now compare your p value to your α.
p = 0.176 > α = 0.15
So “p is not less than alpha” - If p is not less than alpha, we do NOT reject.
If “p is less than alpha” – If p is less than alpha, pLess or Please Reject.
That’s the way I remember it…
.
WEEK 7 HOMEWORK HELP (MORE)
Continued
Our final conclusion is that we Fail to Reject and say there is not enough evidence to accept our claim. Remember the claim for this one was the alternative because of the wording.
H0: µ ≤ 290
Ha: µ > 290 (claim)
.