


γλώσσες
Σελίδες
Νομικός

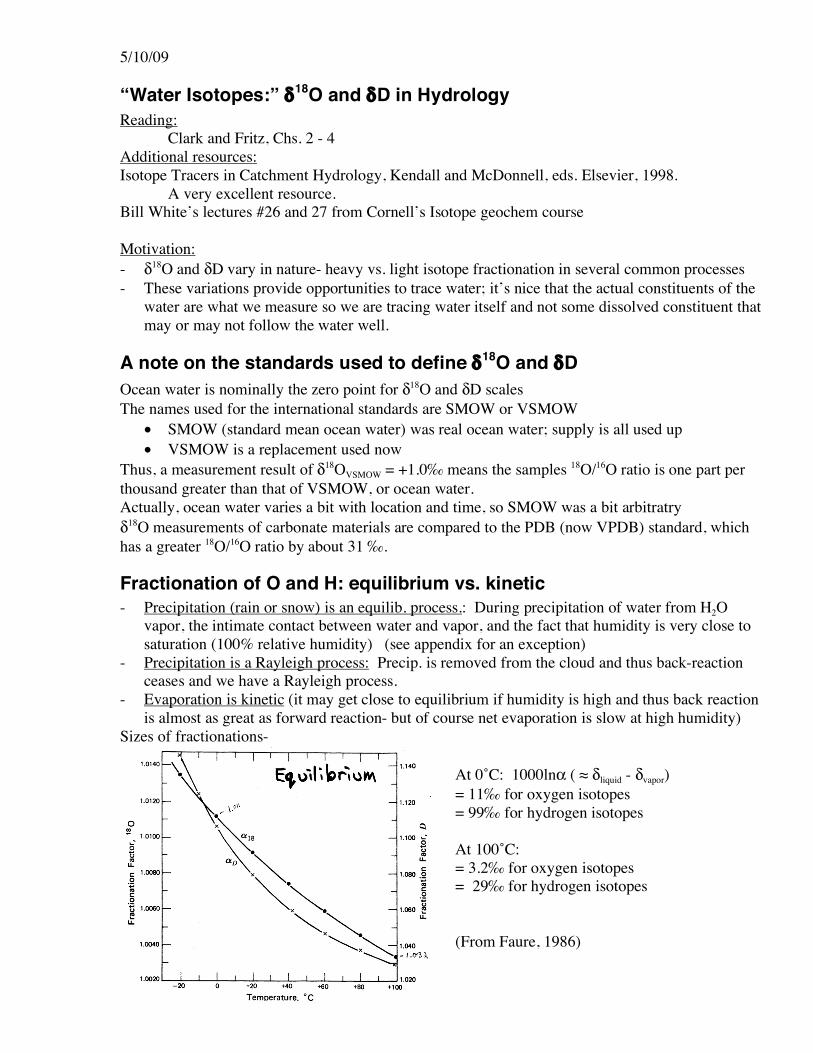
5/10/09
“Water Isotopes:” δ18O and δD in Hydrology Reading:
Clark and Fritz, Chs. 2 - 4 Additional resources: Isotope Tracers in Catchment Hydrology, Kendall and McDonnell, eds. Elsevier, 1998.
A very excellent resource. Bill White’s lectures #26 and 27 from Cornell’s Isotope geochem course Motivation: - δ18O and δD vary in nature- heavy vs. light isotope fractionation in several common processes - These variations provide opportunities to trace water; it’s nice that the actual constituents of the
water are what we measure so we are tracing water itself and not some dissolved constituent that may or may not follow the water well.
A note on the standards used to define δ18O and δD Ocean water is nominally the zero point for δ18O and δD scales The names used for the international standards are SMOW or VSMOW
• SMOW (standard mean ocean water) was real ocean water; supply is all used up • VSMOW is a replacement used now
Thus, a measurement result of δ18OVSMOW = +1.0‰ means the samples 18O/16O ratio is one part per thousand greater than that of VSMOW, or ocean water. Actually, ocean water varies a bit with location and time, so SMOW was a bit arbitratry δ18O measurements of carbonate materials are compared to the PDB (now VPDB) standard, which has a greater 18O/16O ratio by about 31 ‰.
Fractionation of O and H: equilibrium vs. kinetic - Precipitation (rain or snow) is an equilib. process.: During precipitation of water from H2O
vapor, the intimate contact between water and vapor, and the fact that humidity is very close to saturation (100% relative humidity) (see appendix for an exception)
- Precipitation is a Rayleigh process: Precip. is removed from the cloud and thus back-reaction ceases and we have a Rayleigh process.
- Evaporation is kinetic (it may get close to equilibrium if humidity is high and thus back reaction is almost as great as forward reaction- but of course net evaporation is slow at high humidity)
Sizes of fractionations-
At 0˚C: 1000lnα ( ≈ δliquid - δvapor) = 11‰ for oxygen isotopes = 99‰ for hydrogen isotopes At 100˚C: = 3.2‰ for oxygen isotopes = 29‰ for hydrogen isotopes (From Faure, 1986)
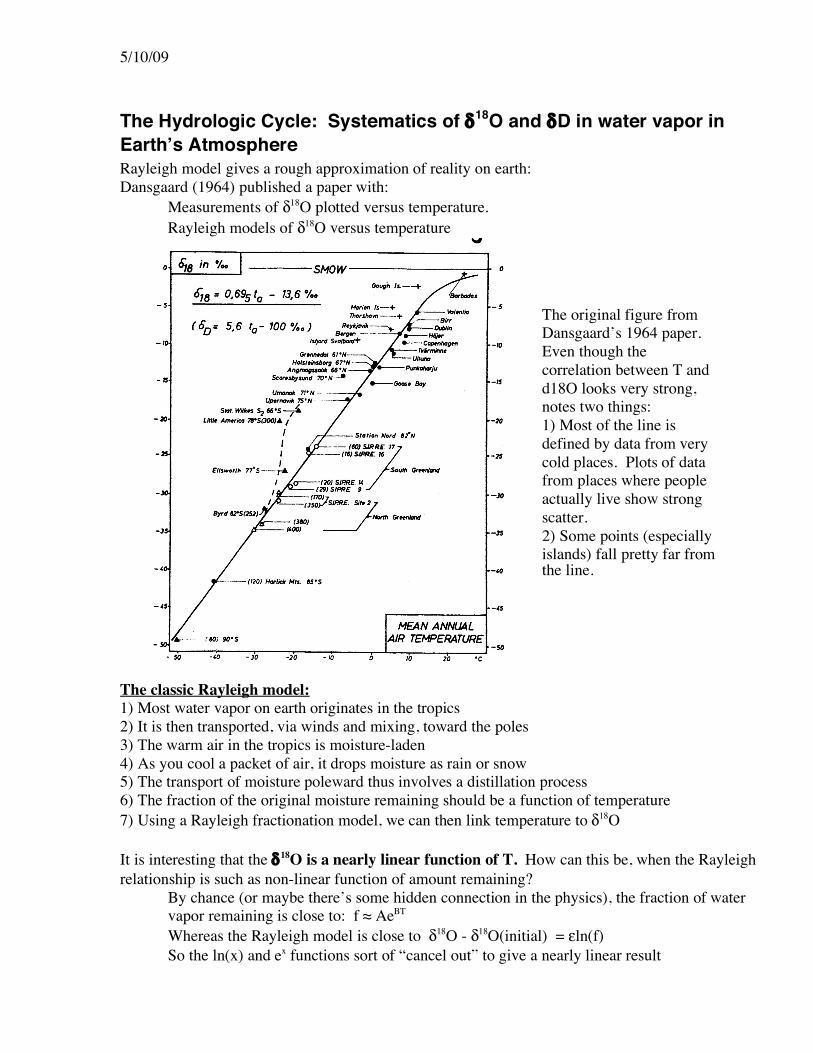
5/10/09
The Hydrologic Cycle: Systematics of δ18O and δD in water vapor in Earthʼs Atmosphere Rayleigh model gives a rough approximation of reality on earth: Dansgaard (1964) published a paper with:
Measurements of δ18O plotted versus temperature. Rayleigh models of δ18O versus temperature
The classic Rayleigh model: 1) Most water vapor on earth originates in the tropics 2) It is then transported, via winds and mixing, toward the poles 3) The warm air in the tropics is moisture-laden 4) As you cool a packet of air, it drops moisture as rain or snow 5) The transport of moisture poleward thus involves a distillation process 6) The fraction of the original moisture remaining should be a function of temperature 7) Using a Rayleigh fractionation model, we can then link temperature to δ18O It is interesting that the δ18O is a nearly linear function of T. How can this be, when the Rayleigh relationship is such as non-linear function of amount remaining?
By chance (or maybe there’s some hidden connection in the physics), the fraction of water vapor remaining is close to: f ≈ AeBT
Whereas the Rayleigh model is close to δ18O - δ18O(initial) = εln(f) So the ln(x) and ex functions sort of “cancel out” to give a nearly linear result
The original figure from Dansgaard’s 1964 paper. Even though the correlation between T and d18O looks very strong, notes two things: 1) Most of the line is defined by data from very cold places. Plots of data from places where people actually live show strong scatter. 2) Some points (especially islands) fall pretty far from the line.
5/10/09 Reality is more complicated 1) Poleward vapor transport is more like diffusion than advection. Rayleigh models assume closed systems (e.g., a packet of air moving from high T to low T; no mixing with other air masses; rain/snow allowed to leave the air, no other gain/losses)
This assume water moves poleward mostly via advection But in reality, there’s much mixing between air masses
An alternative model: Transport is mostly by random mixing of air masses, which is NOT advection. It is much closer to diffusion “Eddy diffusion” is the term used to describe this process Eddy diffusion model gives differen slope to the isotope/temperature plot. Hendricks et al. (2000) [Global Biogeochem. Cycles, Vol. 14, pp. 851-861]
2) Air masses can gain H2O from local sources. This will tend to alter the δ18O of the air mass, unless by chance the new vapor matches the exisiting vapor.
- oceans (after the air leaves the tropics) Local ocean water is about 0‰; vapor derived only from local ocean water
would give rain close to 0‰ even at low T (in reality the vapor is not all local) so coastal and island areas may have δ18O vs. T relationships that differ from
the normal one (δ18O shifted upward; see island on plot above) - lakes, rivers, soils, too
3) Orographic effects: 1. Mountain ranges have strong rainout 2. As a results δ18O is more negative on the downwind side 3. Also, the air is warm because of the latent heat it gained as rainout occurs over the
mountains (e.g., Nevada is hot in part because of strong rainout over the Sierra Nevada)
4. This alters the classic delta vs. T relationship 5. How big is this effect? 1.0 to 3.1‰ per km of elevation increase
This has been used to find elevation of mountain ranges in the past • clay minerals in the downwind are record rainout changes as the
mountains grow • See: Chamberlain and Poage, 2000, Geology 28, 115-118
4) The “amount” effect: altitude gradients in δ18O, and re-equilibration or evaporation of rain as it falls It has been observed that, all other things being equal, more intense rain means lighter isotopic composition. This is attributed to a few different effects. Fortunately, they all tend to make heavier rains lighter: - Light rains can re-evaporate in the lower atmosphere, making them heavier - Water vapor is lighter with increasing altitude; rain starting high up is thus relatively light. But if
it falls slowly (smaller drops; lighter rain) it requilibrates with vapor at lower altitude and becomes heavier. Intense rain means large drops that do not re-equilibrate and thus retain lighter isotopic composition from high altitude.
- Rain moving from high levels to lower makes the vapor at lower altitude lighter, which in turn allows rain to stay lighter as it partially re-equilibrates with lower air. This effect is stronger for heavier rains
- Heavy rains are more likely to wring large amounts of moisture from the air, to the point where the vapor remaining toward the end is shifted to more negative values.
- Reference: “Amount effect” of water isotopes and quantitative analysis of post-condensation processes. J.-E. Lee and I. Fung, Hydrol. Process. (2007)
- The amount effect is not seen with snow; re-requilibration and sublimation are minor
5/10/09 End result of all these complications: - DO USE your general knowledge of how temperature and other factors affect the isotopic
composition of precipitation to predict general patterns you might use to your advantage. - But don’t use the global relationship between T and δ18O blindly; there may be deviations for
various places, times, and precipitation events. There are often differences with time in a single storm.
Relationship between δD and δ18O on earth: “Meteoric water lines” and how to detect evaporation or water-rock interaction.
-140
-120
-100
-80
-60
-40
-20
0
20
40
60
-16 -12 -8 -4 0 4
delta 18O
delt
a D
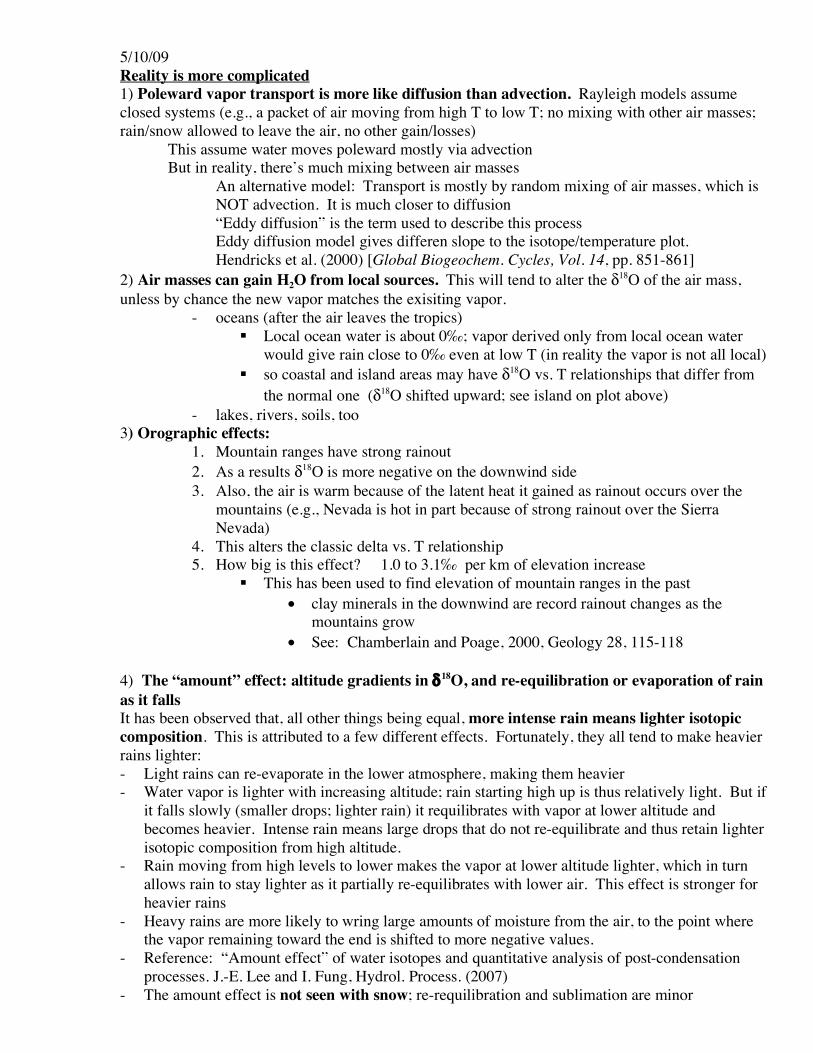
1) Evaporation and precipitation effects combine to give us the observed array of precipitation
on a plot of δD vs. δ18O a) seawater plots at the origin b) Evaporation of that water produces vapor plotting at roughly (-11, -90) c) The first precipitation from this vapor would be fractionated back toward lower
values d) However, precipitation is not an exact reversal of evaporation, and the first rain
formed from this vapor plots above the seawater point. e) Subsequent precipitation causes both O and H to become isotopically heavier, with a
slope of about 8 (varies- see below) i. Example: When 86% of the vapor has rained out, δ18O of the next rain will be
about -20‰.
2) The solid line in plot above gives the approximate compositions of rain/snow on earth. This is known as the Global Meteoric Water Line (GMWL). δD =(7.96) δ18O + (8.86) (Ronzanski et al., 1993)
3) Evaporation from lake/river/puddle/ocean surfaces. The dotted line gives the trajectory
followed (approximately) by a mass of water (e.g., a lake) as a large fraction of it is evaporated away.
a) Why is the slope different? Kinetic fractionation during evaporation is a very different process from equilibrium fractionation during precipitation. Recall how kinetic and equilibrium effects are controlled by different things. Because of this difference, the slope (size of hydrogen isotopic fractionation relative to that of oxygen) is different.
Plot of δD vs. δ18O: Close linear relationship between δ18O and δD, as expected, because the relative sizes of the O and D fractionations should be constant (for precipitation; see below for evaporation). The diamond gives the composition of seawater. Vapor derived from seawater plots near (-12, -80); exact values depends on close to Precipitation samples from cooler places plot along the GMWL; colder places are farther to the lower left. The horizontal arrow gives the effect of extensive water-rock interaction (e.g., hot spring waters).
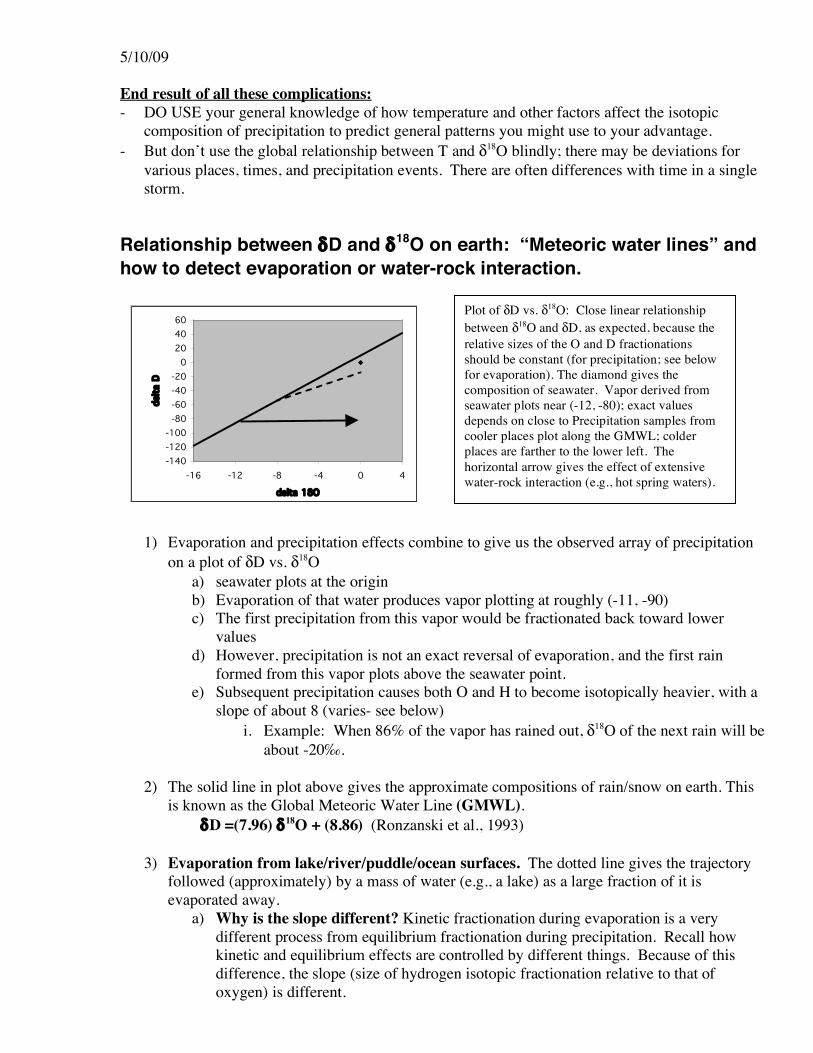
5/10/09 b) The exact slope depends on the humidity
a. Extremely low humidity: slope = 3.9 b. Higher humidity: as h increases, slope becomes closer to the equilibrium slope
-
So... groundwater samples falling to the right side of the line suggest that the water being measured previously lost water vapor via evaporation from a lake/pond/river surface. Hydrologists can use this as a means of quantifying evporation from surface water bodies, or a means of detecting evaporated surface water that has moved into the subsurface.
4) Transpiration and Evaporation From Soils.
- Transpiration: Water uptake by plants is governed by diffusion into roots. That process does not involve much of an isotopic fractionation so the overall transpiration flux must NOT be highly fractionated isotopically, when averaged over days or weeks.
- Leaves DO show enrichment in heavy isotopes relative to the rest of the plant, but the flux of water outward has δ18O that is, on average, equal to that taken in by the roots
- Transpiration is much more important than evaporation directly from soils, except in deserts and other places where plants are not abundant
- Direct evaporation from soils/sands. This induces isotopic fractionation, in a way similar to evaporation from lakes.
In arid places with few plants, large amounts of moisture can be lost from sands/soils. When this happens, remaining soil moisture can be strongly heavy Subsequent recharge is made heavier by mixing with this moisture
4) Deuterium Excess. Departure from the GMWL can be quantified by a parameter known as the “deuterium excess” = d. This is defined as the y-intercept of the line with a slope of 8.0, drawn through a sample’s composition. Example: The GMWL has a d value of +8.86‰. The deuterium excess can be used to: - Infer humidity at the moisture source. If most of the moisture in an air mass was transferred
to the atmosphere under low-humidity conditions, the air mass will have a larger d - Distinguish different moisture sources (different air masses coming into a region) that
produced recharge for old groundwater
5) Local Meteoric Water lines. Every area departs somewhat from the GMWL. So if possible we determine a local meteoric water line (LMWL) and use that for local studies. Variability in LWML’s is caused by:
- Variable d in original vapor sources - Addition of vapor locally via evaporation from, e.g., lakes - Partial evaporation of rain as it falls
5/10/09 6) Snow sublimation/evaporation and snowmelt-induced recharge.
Although loss of H2O from snow via sublimation/evaporation is not very fast, in many places snow stays on the ground for months. It can get fractionated. Also recharge derived from it may be light relative to the snow. - Sublimation favors lighter isotopes (e.g., remaining snow shifted heavier by a few per mil
for a 10% loss) - During spring melting, evaporation occurs. - Snowmelt entering the ground under the snowpack is a few per mil light relative to the
remaining solid- equilibrium fractionation. Early snowmelt is lighter than the initial snow Loss of light water drives remaining snowpack to heavier values Late snowmelt is heavier than the initial snow
7) Effects of high-temperature chemical reaction between groundwater and rock. The horizontal arrow in my graph above shows the effects of extensive water-rock interaction at high temperatures. This happens because the water exchanges oxygens with the host rock, which has relatively heavy oxygen isotope ratios. Hydrogen is affected little by this process, because there’s so much more hydrogen in water than in rock.
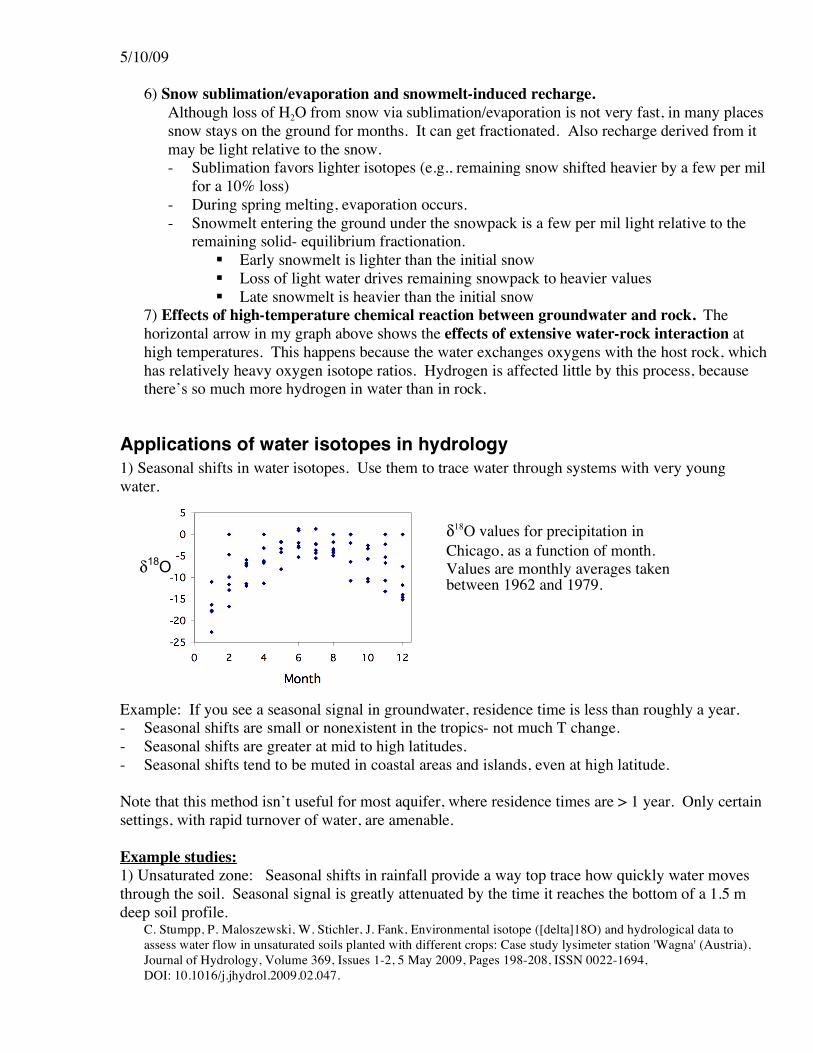
Applications of water isotopes in hydrology 1) Seasonal shifts in water isotopes. Use them to trace water through systems with very young water.
Example: If you see a seasonal signal in groundwater, residence time is less than roughly a year. - Seasonal shifts are small or nonexistent in the tropics- not much T change. - Seasonal shifts are greater at mid to high latitudes. - Seasonal shifts tend to be muted in coastal areas and islands, even at high latitude. Note that this method isn’t useful for most aquifer, where residence times are > 1 year. Only certain settings, with rapid turnover of water, are amenable. Example studies: 1) Unsaturated zone: Seasonal shifts in rainfall provide a way top trace how quickly water moves through the soil. Seasonal signal is greatly attenuated by the time it reaches the bottom of a 1.5 m deep soil profile.
C. Stumpp, P. Maloszewski, W. Stichler, J. Fank, Environmental isotope ([delta]18O) and hydrological data to assess water flow in unsaturated soils planted with different crops: Case study lysimeter station 'Wagna' (Austria), Journal of Hydrology, Volume 369, Issues 1-2, 5 May 2009, Pages 198-208, ISSN 0022-1694, DOI: 10.1016/j.jhydrol.2009.02.047.
δ18O
δ18O values for precipitation in Chicago, as a function of month. Values are monthly averages taken between 1962 and 1979.
5/10/09 2) Tracing water from individual rain events through catchments. Hydrograph separation:
There is a long history of studies attempting to determine the “plumbing” of forested and agricultural catchments. This has important applications in flood forecasting, surface water resource availability forecasting, and contaminant transport prediction (e.g., nitrate from agriculture). Each catchment has a characteristic response to rainfall events. Streams have certain “rise time” as streamflow increases to a peak. Then they usually have a roughly exponential decrease in flow: Q = Q0 x e-Bt until that gets interrupted by later events. This exponential form makes sense in a very general way. If the rate of flow out of the catchment is roughly proportional to the storage of water in the catchment
Q = !dS
dt " S
we naturally get an exponential function as a solution to this governing equation. The lesser flow levels that are clearly supported by stored groundwater during dry periods are called base flow or simple “old water”. The pulses of greater flow that occur after rainfall are called new water, storm runoff, event water, etc. Small stream in hilly to mountainous areas respond fairly quickly to rainfall. After a heavy rain begins, flow in streams increases within a few hours in many cases. In early interpretations of this, hydrologists concluded there must be a large component of “overland flow” that ran across the earth surface and moved to stream within hours. Problem: When people tried to document overland flow, they could not find it. People argued about the validity of theses studies for years. Water isotopes used for hydrograph separation. Studies using water isotopes helped settle the issue. In several studies, storm water with different δ18O than stored water in the catchments was traced. The changes in the stream δ18O values were observed as the new water comes through. Little new water from a storm was observed in most streams during and immediately after storms.
More recent studies have become more sophisticated and have attempted to develop mathematical models for the response of watersheds to events, instead of merely trying to separate old water from new water. One goal is to develop better predictive models for catchments that do not have stream gauges. So rather than using old hydrographs to determine the hydrological response characteristics, one uses topography, geology and soils data. Water isotope studies are helping to test these models and better develop our understanding of catchment “plumbing” that the models are built on. Again, this approach is useful only in small catchments where at least some storm water moves through quickly. - Each storm could be different from water already in the ground. For example, the first warm
rain of the spring may have δ18O = -2‰, and this falls on a catchment filled with winter precipitation with an average δ18O of -10‰.
The stream water starts at -10‰ at the beginning of storm When “new water” comes through to the stream, δ18O shifts to less negative values
3) Detecting water recharge during the last glaciation - Presumably most recharge was from melting of ice - Glaciers were from far north- light precip.
5/10/09 4) Determining amount of evaporation from a lake/pond, etc. - I suspect there’s not much need to use isotopes to determine evaporation from the surface of a
modern lake (other ways to do it; isotope method is more work). - However, lake sediments are an important record of climate in the past. Ocean sediments have
gotten the most attention, but they do not tell us about continental interiors. Lake sediment cores are one type of continental paleoclimate record. We need to know how evaporation affects the isotopic compositions of lakes.
Quantitative determination can be somewhat complex because of inflow+ outflow and partial equilibration with atmospheric moisture.
1. Simple evaporation-only case with no water inflow and low humidity. - Lake/pond was filled at some time the the past;
input has ceased, there’s no output, and the air is very dry a. Rayleigh model works for this b. e.g., for 68% loss with ε = -10‰, the shift would be +10‰
2. Same case, but with high humidity: a. Rayleigh model fails because there’s back-reaction; H2O leave the lake via
evaporation, BUT some vapor goes “backward” and becomes liquid again b. This limits the increase in δ18O and δD; as the remaining water becomes very
heavy, the back reaction tends to pull it back toward isotopic equilibrium somewhat
c. At high humidity, the lake will merely evolve toward isotopic equilibrium with the air above
3. Lake with inflow but no outflow; low humidity a. All inflow water must leave as evaporation b. Evolves toward a steady state, with the lake water heavier than inflow c. As it approaches steady state, the tendency for evaporation to drive isotopes to
greater values becomes balanced by the tendency for inflow to drive them lower
d. Also, the vapor leaving must balance the inflow e. This requires that the lake be shifted heavier by an amount equal to the
fractionation occurring via evaporation (δevap_flux – δwater). 4. Same case, but with higher humidity.
a. Back-reaction occurs and δevap_flux – δwater depends on δatmos, the value of the vapor in the air
b. This effect increases as humidity increases c. If humidity is very high, the lake tends to evolve toward isotopic equilibrium
with the vapor in the air i. Quite possibly, this would give almost no evaporative effect
ii. Note that on average, the lake water will be not far from isotopic equilibrium with the local vapor (maybe somewhat lighter)
5. Lake with inflow and outflow: a. Key controlling variable: f = water lost to evap. / total water loss b. Clearly,as f approaches 0, there’s no isotopic shift
i. This happens for deep lakes with short residence times, slow evap c. As f approaches 1, the situation approaches that of 3) above.
i. This happens for lakes with strong evap and thus little outflow d. Model/equation given by Gonfiantini (1986)
5/10/09 Paleohydrology and extraction of hydrologic info from minerals precipitated by water Sometimes, we would like to know what past conditions were like in a groundwater system. For example, was groundwater flow in a certain area much greater during glacial periods? The earlier water is gone, so our only option to learn about past conditions is to look at minerals left behind. A record of the water isotopes can be stored in minerals precipitated from ancient waters. Most common examples:
- δ18O in calcite reflects δ18O in water a. Carbonate minerals (e.g., CaCO3, Calcite) are VERY common in soils and
saturated zone aquifers/rocks b. YOU MUST account for equilibrium fractionation
i. δ18Ocalcite - δ18Owater ≈ +30‰ at 10°C ii. decreases with increasing T
iii. So you must know T to reconstruct δ18Owater from δ18Ocalcite c. Obviously, there’s no H in calcite so we cannot reconstruct δD
- δD in clays and some hydrous oxides (Goethite?) reflects δD in water a. I don’t know many details, but I think interpreting δD clays is tricky b. Probably the T-dependent fractionation factors depend on composition
Practical Example: Yucca Mtn.; candidate site for nuclear waste burial
- Legal framework: need to demonstrate lack of leakage of radionuclides to the accessible environment
- Very thick unsaturated zone; in general, flow is very slow- GOOD - Is water table much higher during wetter climates- ice ages? - recently killed by political actions; maybe not dead forever? - Europeans have their own sites- also doing paleohydrology work
Goal is to use the past behavior of the system as a key to the future - Some claimed that carbonate minerals in fractures were caused by periodic upwelling of
hot water or huge rise of water table during wet climates- BAD for a repository - Others claimed the deposits were created by evaporating rainwater as it descended
The carbonate minerals may hold a record of past conditions in their O and C isotopes See Figures from: National Research Council (1992) Ground Water at Yucca Mountain
Local soil water differs from regional groundwater, which is recharged at high elevation Calcites derived from the two water types would be distinct In this case, it looks like the calcite deposits match those expected for surface-generated, downward migrating waters. Upwelling waters are not 100% precluded, but they seem very unlikely.
Top Related