


γλώσσες
Σελίδες
Νομικός

1
Visual Performance
• Resolution Limit• Pattern Detection• Pattern Recognition• Contrast Level• Color• Temporal Response
• Illumination• Monocular vs. Binocular• Distance• On-axis vs. Off-axis• Single or multiple targets• Literacy & Verbal ability
Aspects Conditions
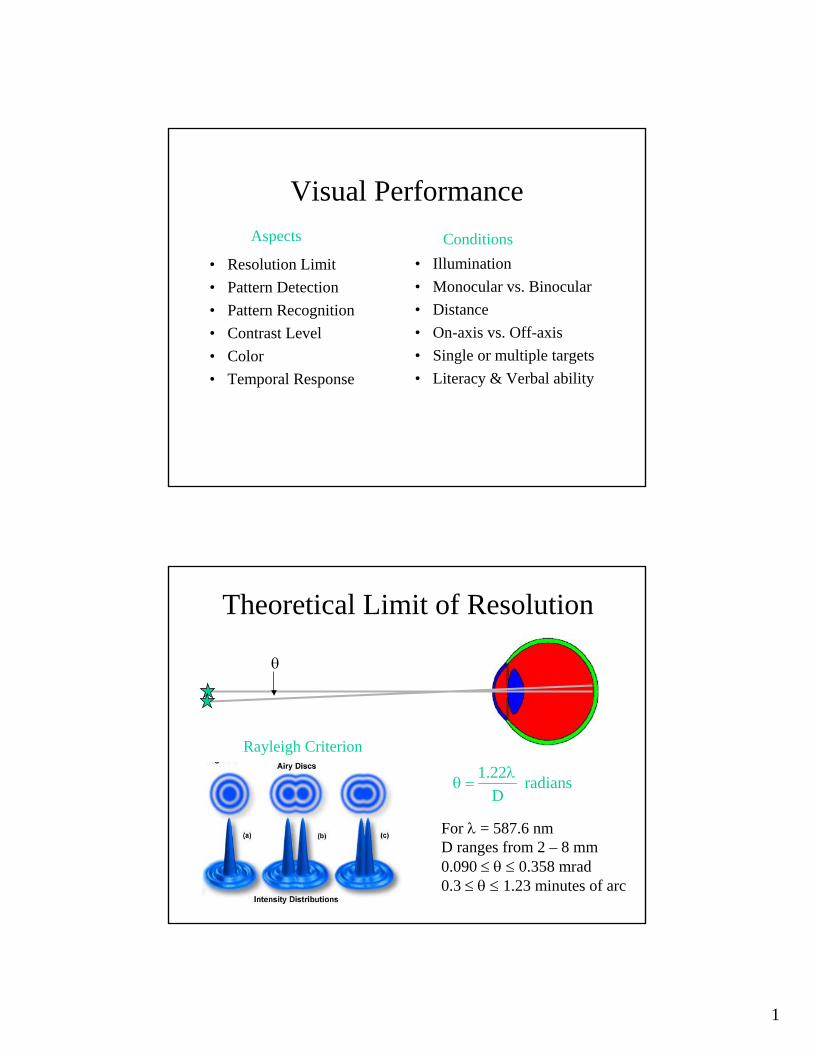
Theoretical Limit of Resolution
θ
radians D22.1 λ
=θ
For λ = 587.6 nmD ranges from 2 – 8 mm0.090 ≤ θ ≤ 0.358 mrad0.3 ≤ θ ≤ 1.23 minutes of arc
Rayleigh Criterion
2
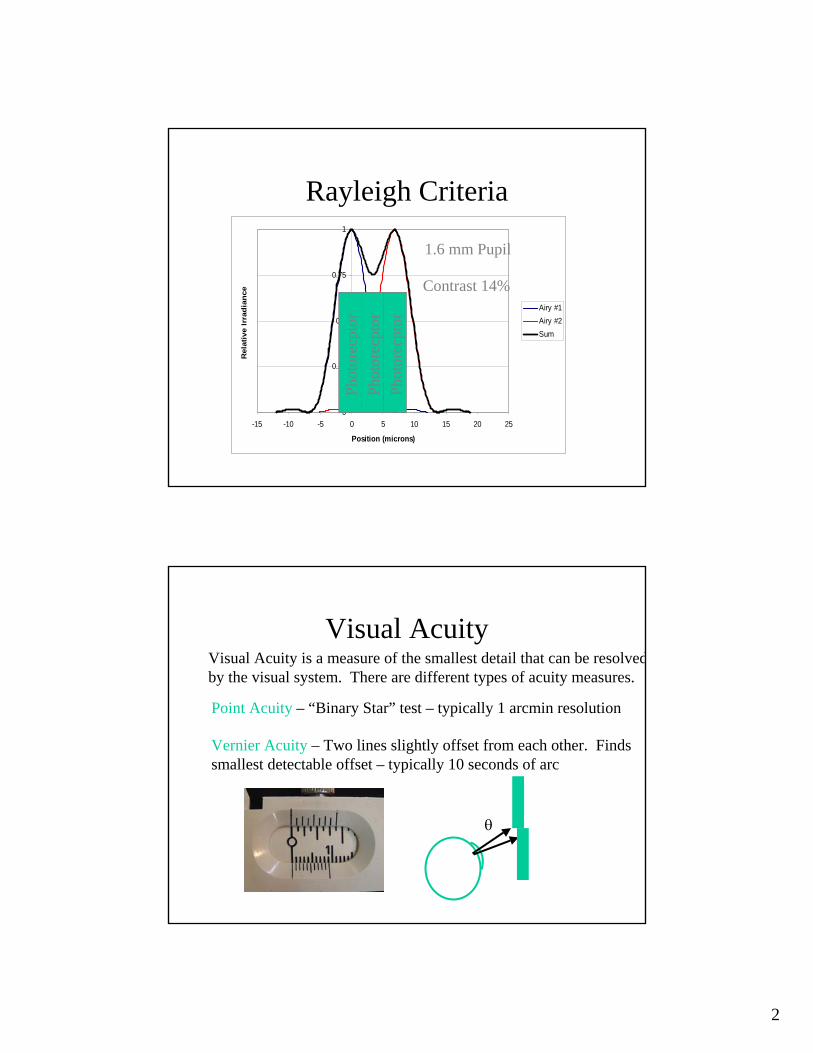
Rayleigh Criteria
0
0.25
0.5
0.75
1
-15 -10 -5 0 5 10 15 20 25
Position (microns)
Rel
ativ
e Ir
radi
ance
Airy #1Airy #2Sum
1.6 mm Pupil
Phot
orec
ptor
Phot
orec
ptor
Phot
orec
ptor
Contrast 14%
Visual AcuityVisual Acuity is a measure of the smallest detail that can be resolvedby the visual system. There are different types of acuity measures.
Point Acuity – “Binary Star” test – typically 1 arcmin resolution
Vernier Acuity – Two lines slightly offset from each other. Finds smallest detectable offset – typically 10 seconds of arc
θ
3
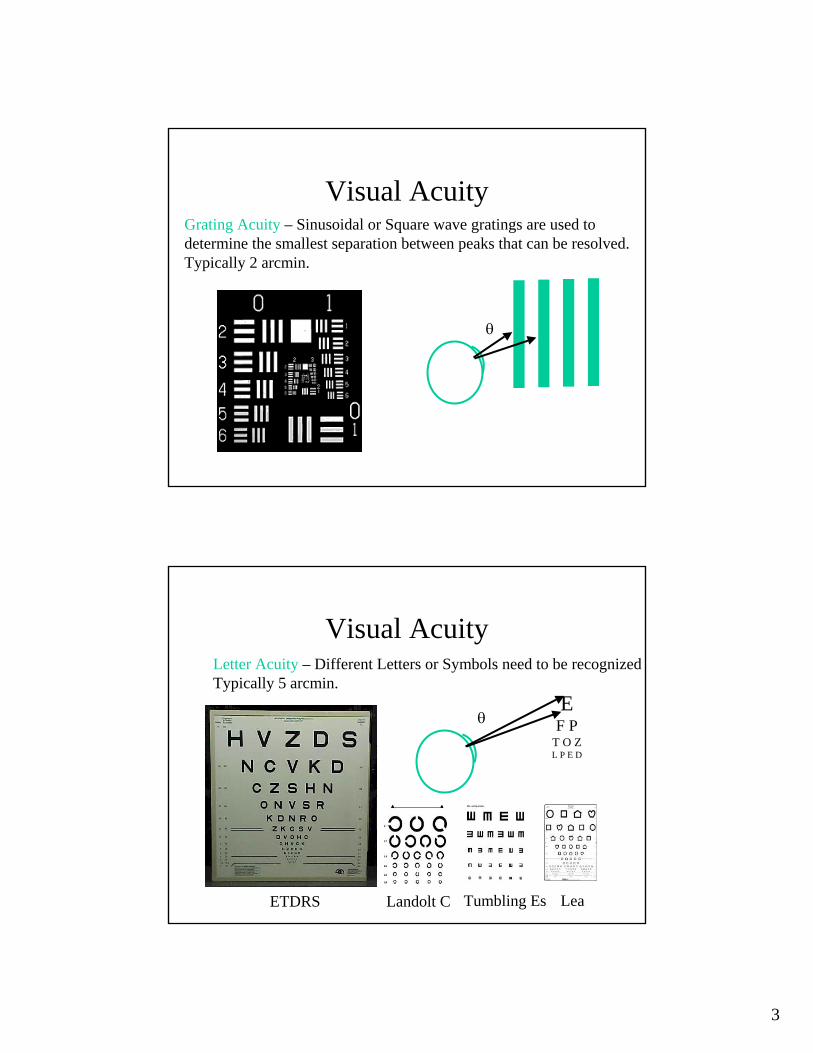
Visual AcuityGrating Acuity – Sinusoidal or Square wave gratings are used to determine the smallest separation between peaks that can be resolved.Typically 2 arcmin.
θ
Visual AcuityLetter Acuity – Different Letters or Symbols need to be recognizedTypically 5 arcmin.
θE
F PT O ZL P E D
ETDRS Landolt C Tumbling Es Lea
4
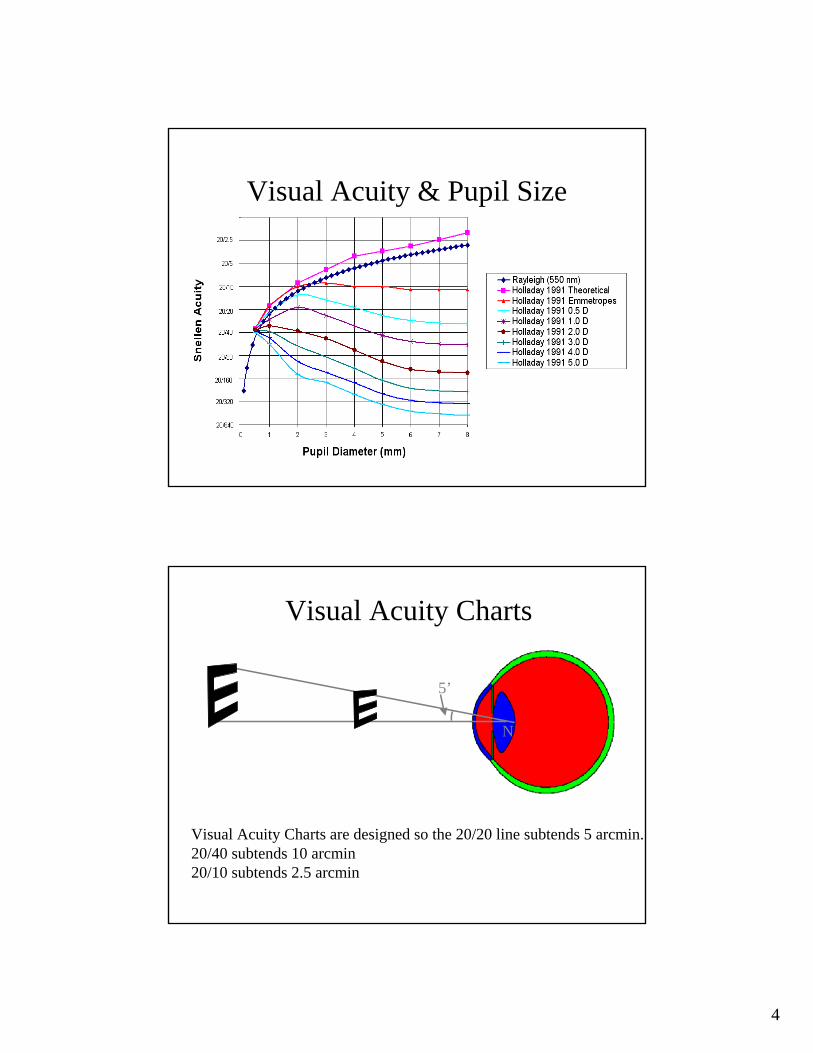
Visual Acuity & Pupil Size
Visual Acuity Charts
N
5’
Visual Acuity Charts are designed so the 20/20 line subtends 5 arcmin.20/40 subtends 10 arcmin20/10 subtends 2.5 arcmin
5
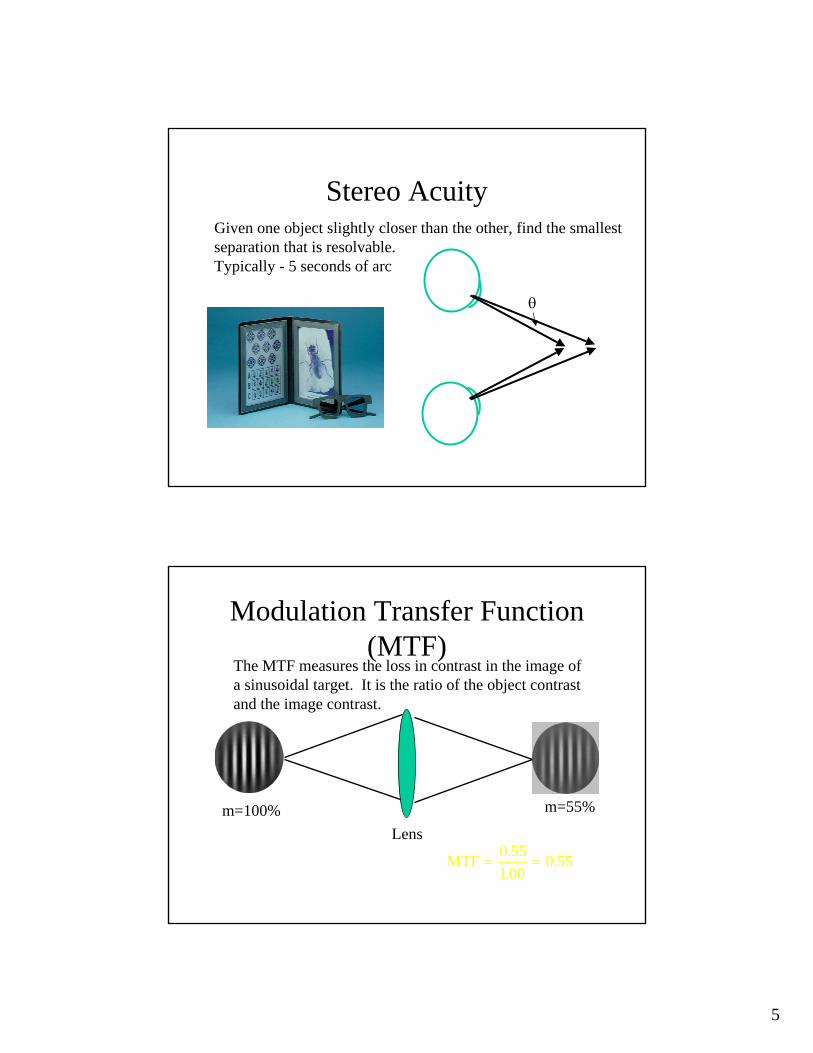
Stereo AcuityGiven one object slightly closer than the other, find the smallest separation that is resolvable.Typically - 5 seconds of arc
θ
Modulation Transfer Function (MTF)
Lens
The MTF measures the loss in contrast in the image of a sinusoidal target. It is the ratio of the object contrastand the image contrast.
m=100% m=55%
MTF = =0 551 00
0 55..
.
6
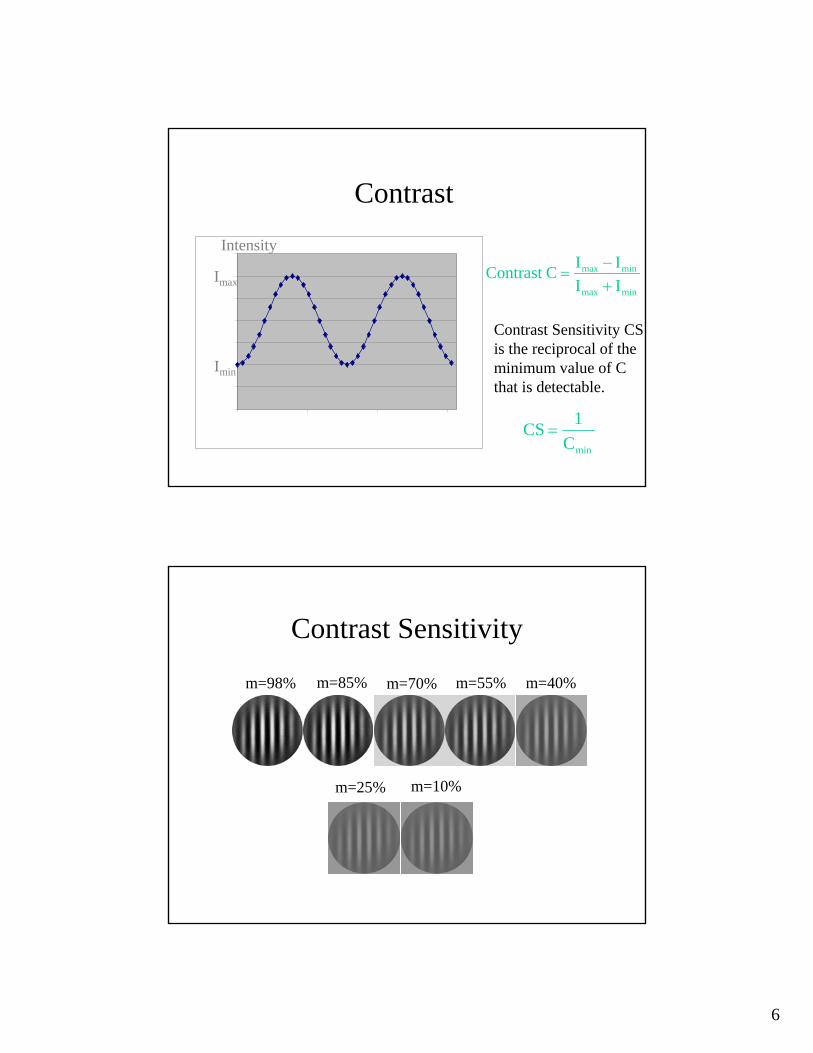
Contrast
Imin
Imax
Intensity
minmax
minmax
IIIIC Contrast
+−
=
Contrast Sensitivity CSis the reciprocal of theminimum value of C that is detectable.
minC1CS =
Contrast Sensitivity
m=98% m=85% m=70% m=55% m=40%
m=25% m=10%
7
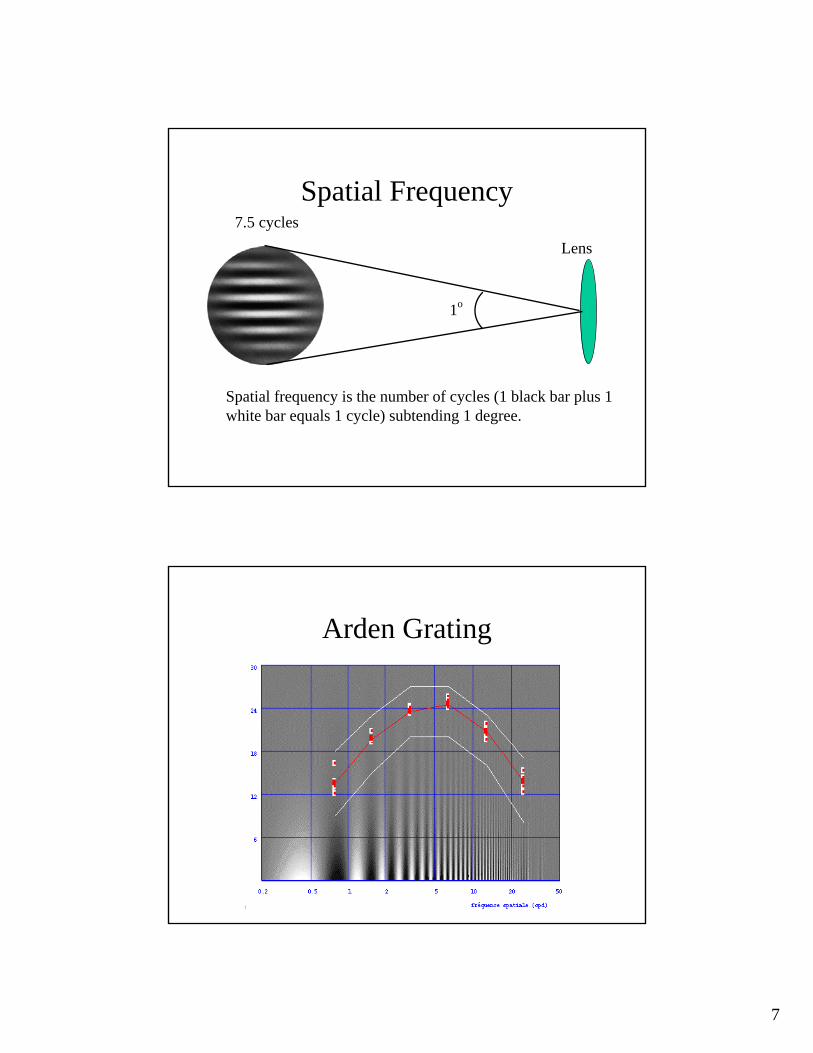
Spatial Frequency
Spatial frequency is the number of cycles (1 black bar plus 1white bar equals 1 cycle) subtending 1 degree.
1o
Lens7.5 cycles
Arden Grating
8
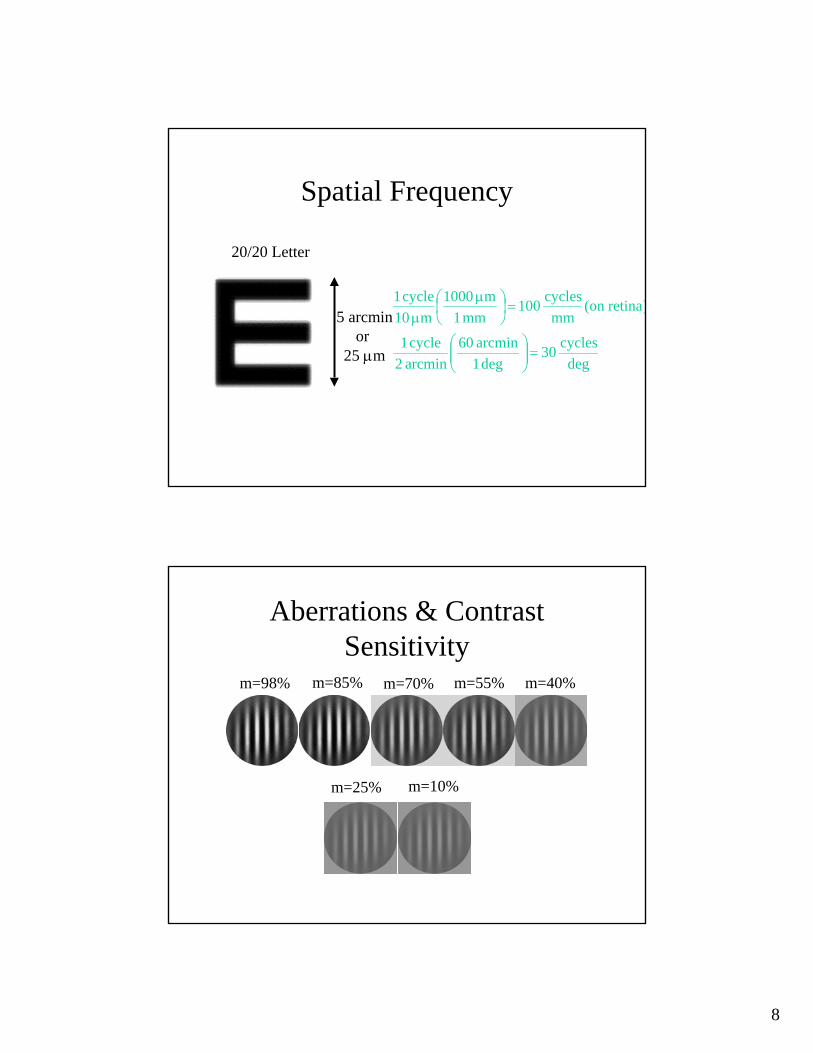
Spatial Frequency
20/20 Letter
5 arcminor
25 μm degcycles 30
deg 1arcmin 60
arcmin 2cycle 1
)retina on(mm
cycles 100mm 1
m 1000m 10
cycle 1
=⎟⎟⎠
⎞⎜⎜⎝
⎛
=⎟⎠⎞
⎜⎝⎛ μ
μ
Aberrations & Contrast Sensitivity
m=98% m=85% m=70% m=55% m=40%
m=25% m=10%
9
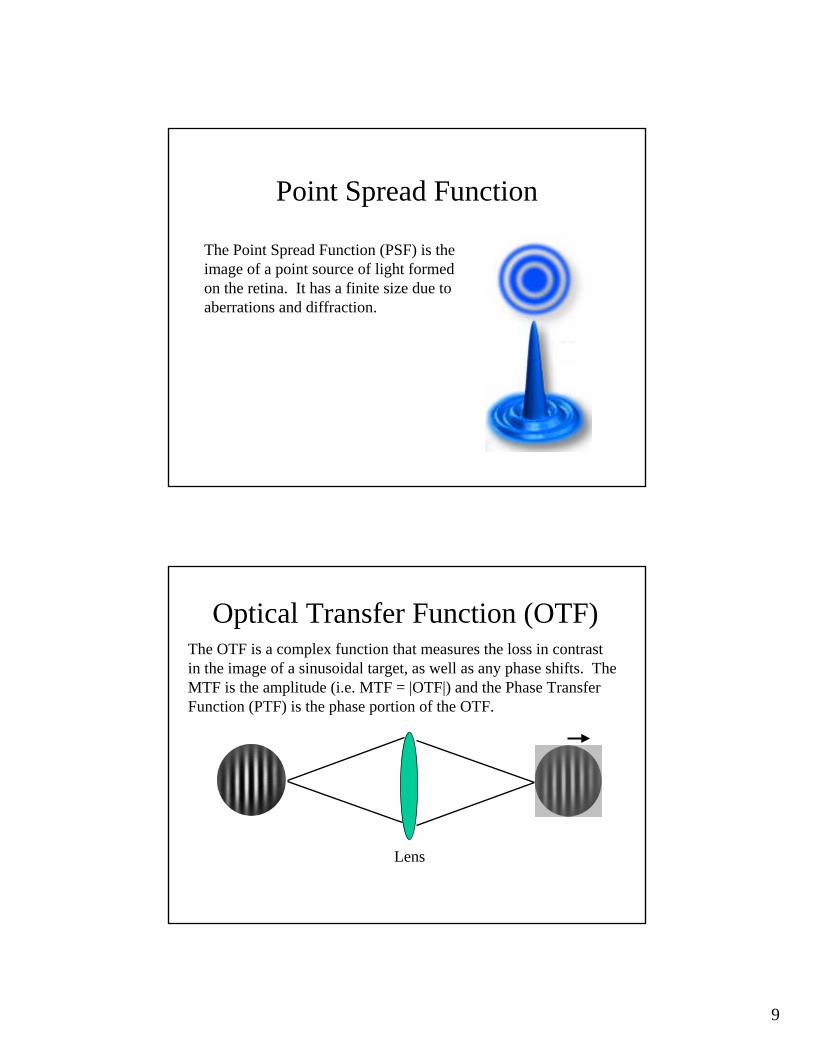
Point Spread Function
The Point Spread Function (PSF) is the image of a point source of light formedon the retina. It has a finite size due to aberrations and diffraction.
Optical Transfer Function (OTF)The OTF is a complex function that measures the loss in contrastin the image of a sinusoidal target, as well as any phase shifts. The MTF is the amplitude (i.e. MTF = |OTF|) and the Phase Transfer Function (PTF) is the phase portion of the OTF.
Lens
10
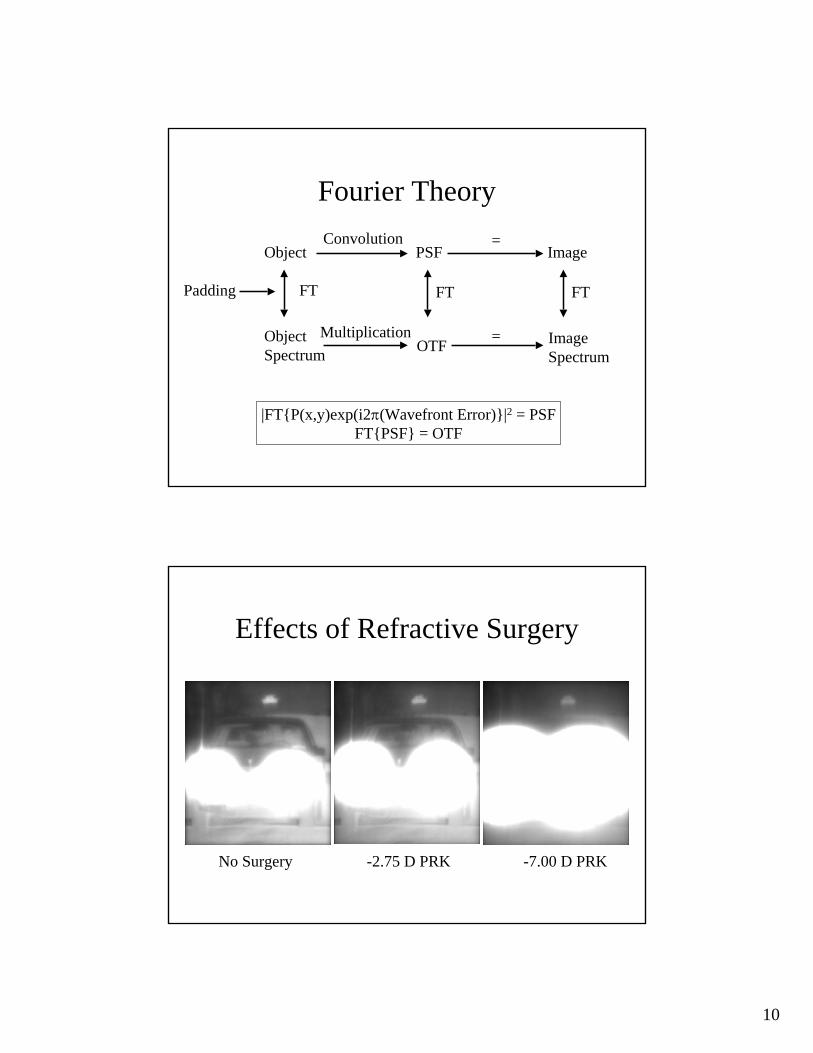
Fourier Theory
Object PSF Image
ObjectSpectrum OTF Image
Spectrum
Convolution =
=Multiplication
FT FT FTPadding
|FT{P(x,y)exp(i2π(Wavefront Error)}|2 = PSFFT{PSF} = OTF
Effects of Refractive Surgery
No Surgery -2.75 D PRK -7.00 D PRK
11
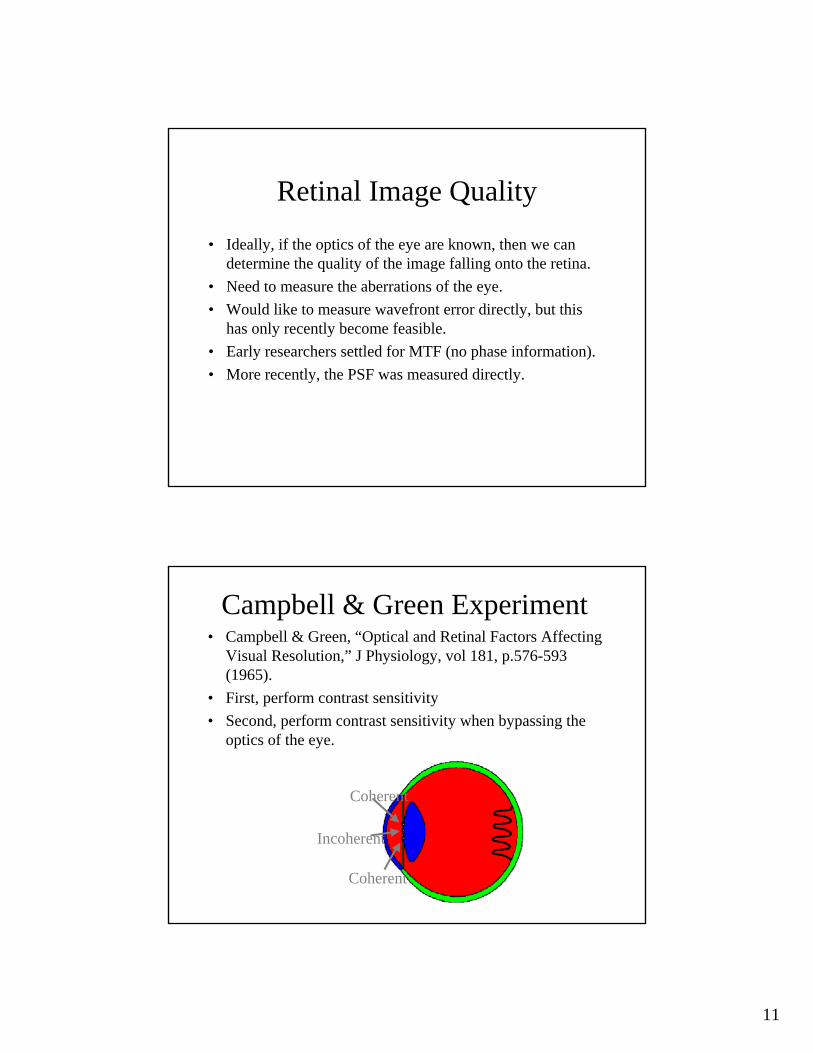
Retinal Image Quality
• Ideally, if the optics of the eye are known, then we can determine the quality of the image falling onto the retina.
• Need to measure the aberrations of the eye.• Would like to measure wavefront error directly, but this
has only recently become feasible.• Early researchers settled for MTF (no phase information).• More recently, the PSF was measured directly.
Campbell & Green Experiment• Campbell & Green, “Optical and Retinal Factors Affecting
Visual Resolution,” J Physiology, vol 181, p.576-593 (1965).
• First, perform contrast sensitivity• Second, perform contrast sensitivity when bypassing the
optics of the eye.
Coherent
Coherent
Incoherent
12
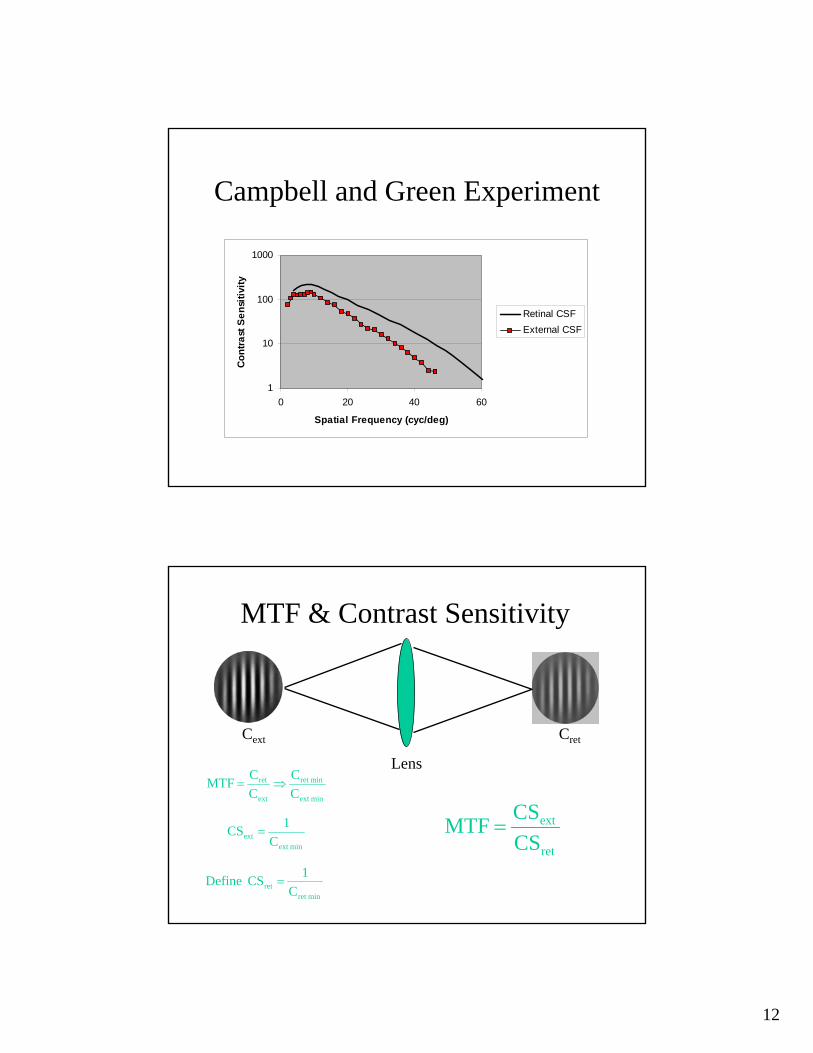
Campbell and Green Experiment
1
10
100
1000
0 20 40 60
Spatial Frequency (cyc/deg)
Con
trast
Sen
sitiv
ity
Retinal CSFExternal CSF
MTF & Contrast Sensitivity
Lens
Cext Cret
min ext
min ret
ext
ret
CC
CCMTF ⇒=
min extext C
1CS =
min retret C
1CS Define =
ret
ext
CSCSMTF =
13
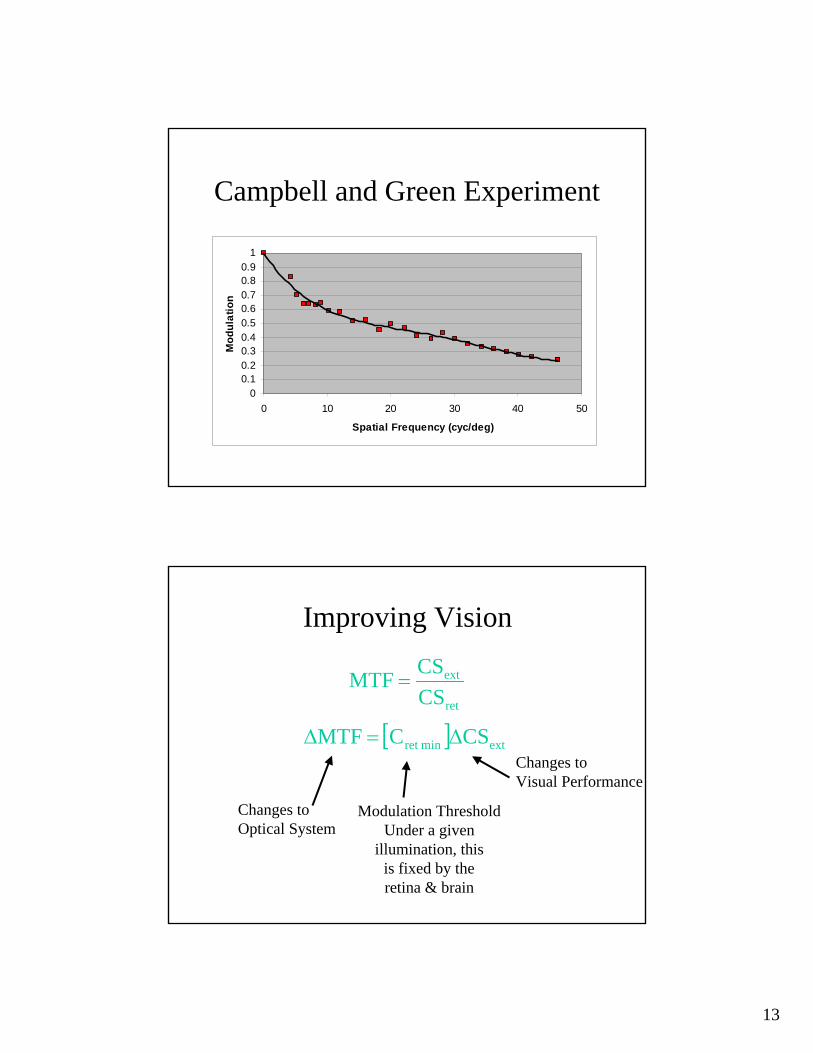
Campbell and Green Experiment
00.10.20.30.40.50.60.70.80.9
1
0 10 20 30 40 50
Spatial Frequency (cyc/deg)
Mod
ulat
ion
Improving Vision
ret
ext
CSCSMTF =
[ ] extmin ret CSCMTF Δ=Δ
Changes toOptical System
Modulation ThresholdUnder a given
illumination, thisis fixed by theretina & brain
Changes toVisual Performance
14
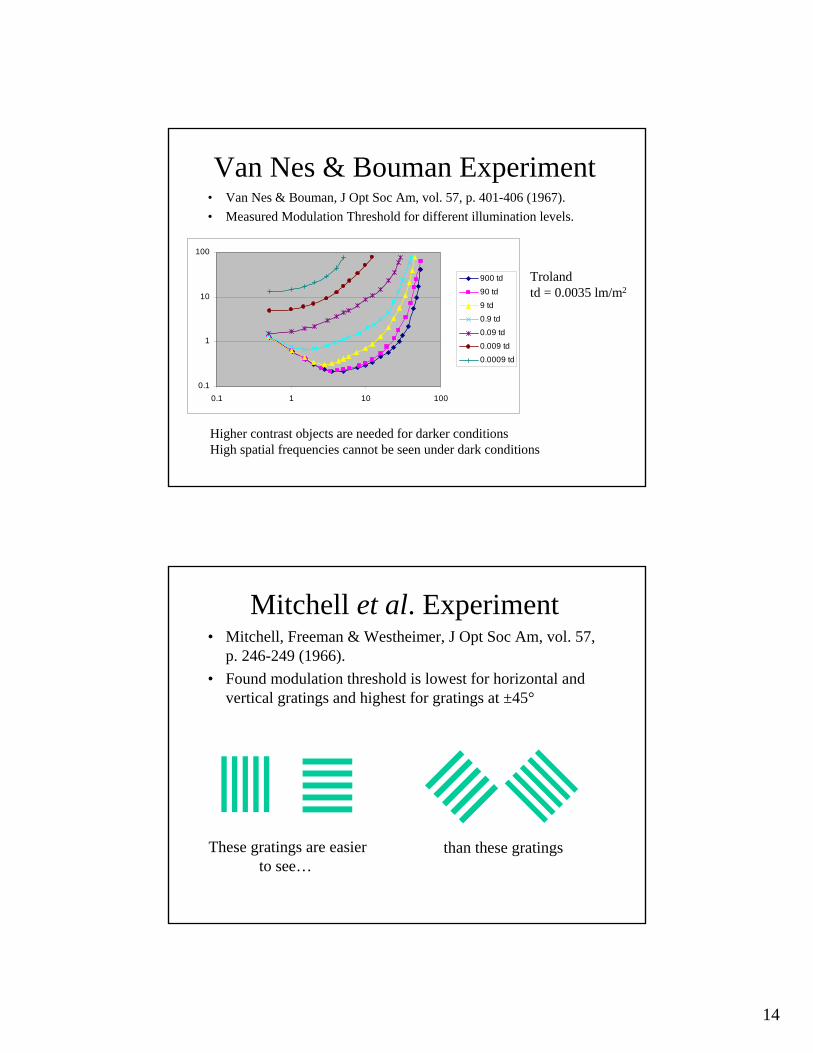
Van Nes & Bouman Experiment• Van Nes & Bouman, J Opt Soc Am, vol. 57, p. 401-406 (1967).• Measured Modulation Threshold for different illumination levels.
0.1
1
10
100
0.1 1 10 100
900 td
90 td
9 td
0.9 td
0.09 td
0.009 td
0.0009 td
Trolandtd = 0.0035 lm/m2
Higher contrast objects are needed for darker conditionsHigh spatial frequencies cannot be seen under dark conditions
Mitchell et al. Experiment• Mitchell, Freeman & Westheimer, J Opt Soc Am, vol. 57,
p. 246-249 (1966).• Found modulation threshold is lowest for horizontal and
vertical gratings and highest for gratings at ±45°
These gratings are easierto see…
than these gratings
15
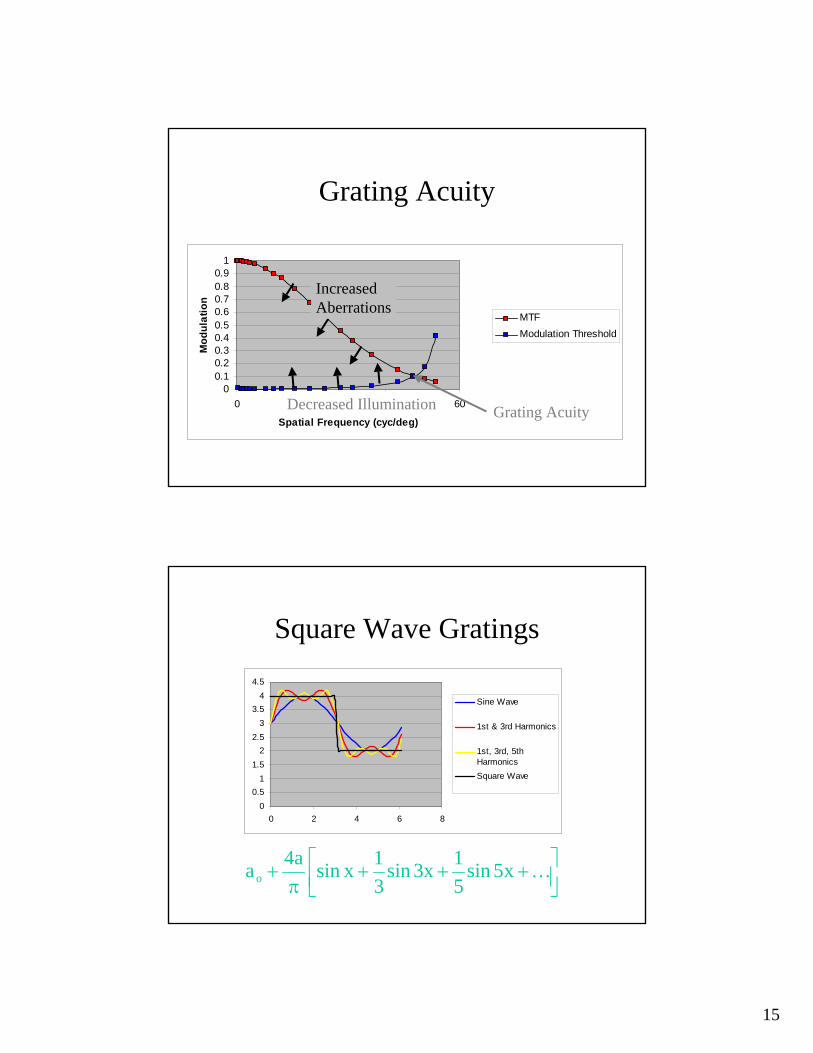
Grating Acuity
00.10.20.30.40.50.60.70.80.9
1
0 20 40 60
Spatial Frequency (cyc/deg)
Mod
ulat
ion
MTFModulation Threshold
Increased Aberrations
Decreased Illumination Grating Acuity
Square Wave Gratings
00.5
11.5
22.5
33.5
44.5
0 2 4 6 8
Sine Wave
1st & 3rd Harmonics
1st, 3rd, 5thHarmonicsSquare Wave
⎥⎦⎤
⎢⎣⎡ +++
π+ Kx5sin
51x3sin
31xsina4ao
16
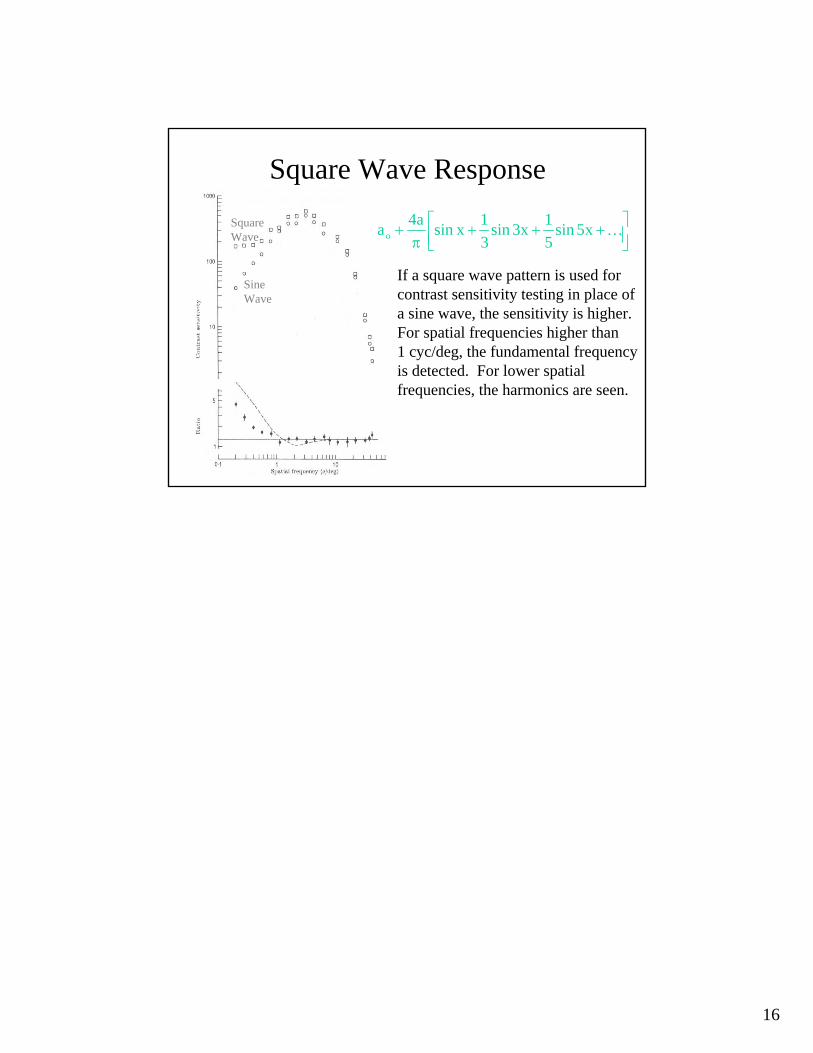
Square Wave Response
⎥⎦⎤
⎢⎣⎡ +++
π+ Kx5sin
51x3sin
31xsina4ao
SquareWave
SineWave
If a square wave pattern is used forcontrast sensitivity testing in place ofa sine wave, the sensitivity is higher.For spatial frequencies higher than1 cyc/deg, the fundamental frequency is detected. For lower spatial frequencies, the harmonics are seen.
Top Related