


γλώσσες
Σελίδες
Νομικός

1. IntroductionQuartz is an abundant mineral in the upper crust, comprising a large volume fraction of rocks with felsic or granitic compositions. Quartz's viscoplastic yield strength is therefore an important factor controlling con-tinental deformation, especially in orogenic belts (Gleason & Tullis, 1995; Lowry & Pérez-Gussinyé, 2011; Peng & Redfern, 2013; Stünitz et al., 2017). Typically, deformation experiments on quartz single crys-tals or quartz aggregates are performed at high temperatures (475–900°C; (Morrison-Smith et al., 1976), 250–500°C; (Balderman, 1974), 900–1,100°C; (Gleason & Tullis, 1995)) and high confining pressures (0.3–1.25 GPa; (Hirth & Tullis, 1994), 0.3 GPa; (Morrison-Smith et al., 1976), 0.3 GPa; (Hobbs et al., 1972)) though some data is available at atmospheric pressure. These experiments are able to investigate and parameterize rheology under conditions where crystal plasticity is favored and yield flow laws that may be extrapolated to lower temperatures (e.g., Blacic & Christie, 1984; Hirth et al., 2001; Tokle et al., 2019). However, in addition to the inherent uncertainty and model dependence of temperature extrapolation, there is little data within the α−quartz stability field at conditions relevant to low-temperature plasticity (Kirby, 1977; Ohno, 1995; Peng & Redfern, 2013). Therefore, determining the strength of quartz at shallow conditions and near the brittle-viscous transition is a persistent challenge (Gleason & Tullis, 1995; Hirth & Tullis, 1994; Richter et al., 2018).
Abstract Quartz is an abundant mineral in Earth's crust whose mechanical behavior plays a significant role in the deformation of the continental lithosphere. However, the viscoplastic rheology of quartz is difficult to measure experimentally at low temperatures without high confining pressures due to the tendency of quartz (and other geologic materials) to fracture under these conditions. Instrumented nanoindentation experiments inhibit cracking even at ambient conditions, by imposing locally high mean stress, allowing for the measurement of the viscoplastic rheology of hard materials over a wide range of temperatures. Here we measure the indentation hardness of four synthetic quartz specimens and one natural quartz specimen with varying water contents over a temperature range of 23°C to 500°C. Yield stress, which is calculated from hardness but is model dependent, is fit to a constitutive flow law for low-temperature plasticity to estimate the athermal Peierls stress of quartz. Below 500°C, the yield stresses presented here are lower than those obtained by extrapolating a flow law constrained by experiments at higher temperatures irrespective of the applied model. Indentation hardness and yield stress depend weakly on crystallographic orientation but show no dependence on water content.
Plain Language Summary Quartz is an important mineral in the Earth's crust whose strength can be affected both by temperature and the amount of water contained in its crystal structure. At low temperatures, it is often difficult to measure the strength of quartz because many minerals tend to fracture without high confining pressure. Here we report measurements of the strength of quartz at temperatures between 23°C to 500°C using a nanometer scale diamond tip which prevents the sample from cracking during deformation. We explore several models for determining the yield stress of quartz at these temperatures and report flow laws, which can be used to describe the mechanical behavior of quartz at low-temperature and high-stress conditions. We find that quartz strength in these experiments does not depend on the amount of water in the crystal structure but does depend on crystallographic orientation. Increasing temperature results in weakening of quartz.
STROZEWSKI ET AL.
© 2021. American Geophysical Union. All Rights Reserved.
Viscoplastic Rheology of α-Quartz Investigated by NanoindentationBenjamin Strozewski1,2 , Michael K. Sly1, Katharine M. Flores3,4, and Philip Skemer1
1Department of Earth and Planetary Sciences, Washington University in Saint Louis, Saint Louis, MO, USA, 2Now at Seismological Laboratory, California Institute of Technology, Pasadena, CA, USA, 3Institute of Materials Science and Engineering, Washington University in Saint Louis, Saint Louis, MO, USA, 4Department of Mechanical Engineering and Materials Science, Washington University in Saint Louis, Saint Louis, MO, USA
Key Points:• Indentation hardness of quartz is
determined by more than 2,200 nanoindentation measurements between 23°C and 500°C
• Indentation hardness and calculated yield stress decrease with temperature and show no dependence on water content
• The athermal yield stress of quartz is constrained by a flow law for low-temperature plasticity
Correspondence to:B. Strozewski,[email protected]
Citation:Strozewski, B., Sly, M. K., Flores, K. M., & Skemer, P. (2021). Viscoplastic rheology of α-quartz investigated by nanoindentation. Journal of Geophysical Research: Solid Earth, 126, e2021JB022229. https://doi.org/10.1029/2021JB022229
Received 13 APR 2021Accepted 25 AUG 2021
10.1029/2021JB022229RESEARCH ARTICLE
1 of 14

Journal of Geophysical Research: Solid Earth
STROZEWSKI ET AL.
10.1029/2021JB022229
2 of 14
Nanoindentation is a common method in the materials sciences and can enable ductile deformation even at low homologous temperatures (T/Tm < 0.3) (C. Fischer-Cripps, 2011; Hardiman et al., 2016; Oliver & Pharr, 2004). Recently, several studies have successfully used instrumented nanoindentation for the study of geologic materials (Ceccato et al., 2021 (in review); Goldsby et al., 2004; Kranjc et al., 2016; Kumamoto et al., 2017; Sly et al., 2020; C. Thom et al., 2019; C. A. hom et al., 2018; Wheeler, 2021). The primary advan-tage of nanoindentation is that it provides self-confined deformation because the geometry of the indenter tip inhibits cracking even at low temperatures (Oliver & Pharr, 1992). Therefore, it is possible to observe viscoplastic deformation at conditions that are normally accessible only in a triaxial press that can apply large isostatic pressure (Balderman, 1974; Gleason & Tullis, 1995).
Previous studies have revealed anisotropic creep strength of quartz (Linker et al., 1984 and references therein) with samples compressed parallel to 0001E demonstrating greater resistance to creep than those compressed normal to m, parallel to <10 10E >. Compression parallel to 0001E results in slip along several low-index planes at angles inclined to both the crystallographic “a” and “c” axes. Compression parallel to <10 10E > primarily activates slip along m faces in a direction parallel to a crystallographic “a” axis. In a Berk-ovich indentation geometry the stress state beneath the indenter tip is complex and will activate multiple slip systems, possibly reducing the orientation dependence of creep strength relative to what is observed during uniaxial compression tests. Nevertheless, anisotropic strength in quartz is still expected due to the activation of different primary slip systems.
In this study we measure the indentation hardness and modulus of four synthetic and one natural quartz specimens with varying water concentrations. Indents are performed parallel to 0001E and 1010E to ex-amine the effects of sample orientation. Yield stress is calculated from hardness and modulus data using several models following the methodology described in Sly et al. (2020).
2. Materials and Methods2.1. Sample Details
Four synthetic quartz specimens were provided by Dr. Jun Muto of Tohoku University and grown by Nip-pon Denpa Kogyo (Ltd.). Synthetic specimen three is described in detail by Muto et al. (2011). The synthetic specimens were grown under different conditions and have varying amounts of water present, both as mi-cron-scale fluid inclusions and as hydrogen defects in the crystal lattice. One natural quartz sample, an op-tically clear, prismatic single crystal from Hot Springs, Arkansas, was also tested. To investigate the possible influence of water content on yield stress (D. Griggs, 1967; D. T. Griggs & Blacic, 1965; Stünitz et al., 2017), we measured the concentration ratio of OH and Si ([OH]/[Si]) for each specimen using secondary ion mass spectrometry (SIMS). SIMS analyses were conducted using the Cameca IMS 7f-Geo at Washington Univer-sity in St Louis. Measurements were compared to a known anhydrous silica standard for calibration.
The crystallographic orientation of each specimen was determined by Electron Backscatter Diffraction (EBSD) using the Oxford Symmetry EBSD detector in either a JEOL 7001 LVF field emission scanning electron microscope or a Thermofisher Quattro S environmental scanning electron microscope. Operat-ing conditions were low vacuum (30 Pa) with an accelerating voltage of 20 kV and a working distance of 19–20 mm. Samples were sectioned in selected orientations from each specimen, polished to 1 um grit, and finished by polishing in a colloidal silica solution to a final thickness of approximately 5 mm. To the extent possible, indents were performed away from visible scratches and fluid inclusions.
2.2. Nanoindentation
Nanoindentation experiments were performed using a Hysitron TI-950 Triboindenter. The TI-950 has a nominal load resolution of <1 nN and a displacement resolution of <0.02 nm. We use a triangular pyram-idal Berkovich tip, which produces an axisymmetric indent. Temperature was controlled using an xSol-800 heated stage, which can achieve a maximum temperature of 800°C by heating the specimen between two parallel plates. A narrow opening accommodates the indenter tip. We performed at least 20 indents parallel to [0001] in each of the five specimens at each temperature between 23°C to 500°C, with temperature incre-ments of approximately 50°C. Indents were also performed parallel to [10 10E ] in synthetic specimen 2 using
Journal of Geophysical Research: Solid Earth
STROZEWSKI ET AL.
10.1029/2021JB022229
3 of 14
the same temperature increments. In total, the mechanical data in this study are based on over 2,200 indents with the same maximum load of 8 mN. Additional indentation experiments were performed to examine the effect of indent size by varying the applied load at room temperature.
To mitigate the effects of thermal drift, we bring the indenter tip close to the sample as the stage is heating, and then bring the tip into contact with the specimen for at least 20 min to allow the tip and specimen to equilibrate (see Kranjc et al., 2016; Sly et al., 2020). For tests at temperatures above 300°C, a mixture of ar-gon and hydrogen gas is flowed over the sample to ensure that the sample remains dry and that the indenter tip does not oxidize. Indents are performed with a maximum load of 8 mN in all cases. The tip is loaded at a rate of 1 mN s−1 to the maximum load. The maximum load is maintained for 2 s before unloading occurs at 1 mN s−1. Indents are excluded from analysis only if the corresponding load-displacement curve demon-strates clear problems such as an incomplete load function or a retraction of the tip during an indent. These issues are most common if the tip is not thermally equilibrated with the sample before testing at elevated temperature.
The load and displacement data for each indent are used to determine indentation hardness, reduced elastic modulus, contact area, and strain rate. In indentation tests, hardness is the resistance to plastic deforma-tion of the material and is calculated as the maximum applied load, Pmax, per unit contact area (C. Fis-cher-Cripps, 2011; Oliver & Pharr, 1992):
max
c
PHA
(1)
The contact area of the indenter tip, Ac, is determined by calibrating a polynomial relationship between contact area and contact depth using a fused silica standard with known properties. This calibration helps compensate for the change in sharpness of a tip after repeated testing (Oliver & Pharr, 2004). A maximum load of 8 mN was chosen to ensure all tests achieve a depth at which this area function is applicable.
Analysis of load-displacement curves in instrumented indentation has previously been discussed (C. Fis-cher-Cripps, 2011; Oliver & Pharr, 1992, 2004) in addition to considerations for geologic materials (Kranjc et al., 2016; Kumamoto et al., 2017; Sly et al., 2020). Here it is noted that the relevant parameters for determi-nation of yield stress are the indentation hardness (Equation 1) and a Young's modulus Es calculated from the reduced modulus, Er, returned by the instrument:
2 21 1 1s i
r s i
v vE E E
(2)
where the subscript s refers to a sample value and a subscript i to the indenter value. E and v represent a modulus and Poisson's ratio, respectively. The Young's modulus of the indenter tip (Ei) is 1,140 GPa and its Poisson's ratio (vi) is 0.07.
Indentation strain rate is calculated from the last 20 nm of the unloading portion of the load-displacement curve:
i
dh
dt h
1 (3)
where h is the depth of penetration. A uniaxial strain rate ( uE ) calculated using u i /3.
Following the method outlined in Sly et al., 2020 we apply four different models (Evans & Goetze, 1979; Ginder et al., 2018; Johnson, 1970; Mata & Alcalá, 2003) for converting nanoindentation data to values of yield stress, suitable for comparison with data from other experimental methods. Values of yield stress are fit to a flow law for low-temperature plasticity limited by lattice resistance (Equation 2.12, Frost & Ashby, 1982):
2exp 1
qpy
yp
HART
(4)
where E is strain rate, A is a pre-exponential factor, R is the gas constant, T is temperature, σy is the yield stress, and H* is the activation enthalpy. Exponents p and q are dimensionless quantities dependent on the energy barriers to dislocation motion and take values 0E p 1, 1 2E q (Frost & Ashby, 1982). These
Journal of Geophysical Research: Solid Earth
STROZEWSKI ET AL.
10.1029/2021JB022229
4 of 14
empirical flow law fits provide values for the Peierls stress at 0 K ( pE ) and the prefactor (A) for each speci-men. Henceforth, the Peierls stress at 0 K will be referred to as the “athermal Peierls stress” in keeping with the terminology used in the presentation of this flow law by Frost and Ashby (1982).
3. Results3.1. Nanoindentation Hardness
Strain rate is calculated during each indentation test using Equation 3 and is on the order of 10−2 s−1–10−1 s−1 for every indent. The average uniaxial strain rate across specimens and temperatures is 0.013 s−1. Aver-age indentation depths and contact areas range from 1.26 ± 0.12 × 10⁻⁷ m and 7.65 ± 0.9 × 10⁻¹³ m2 at 23°C to 1.51 ± 0.12 × 10⁻⁷ m and 5.42 ± 0.5 × 10⁻¹³ m2 at 500°C.
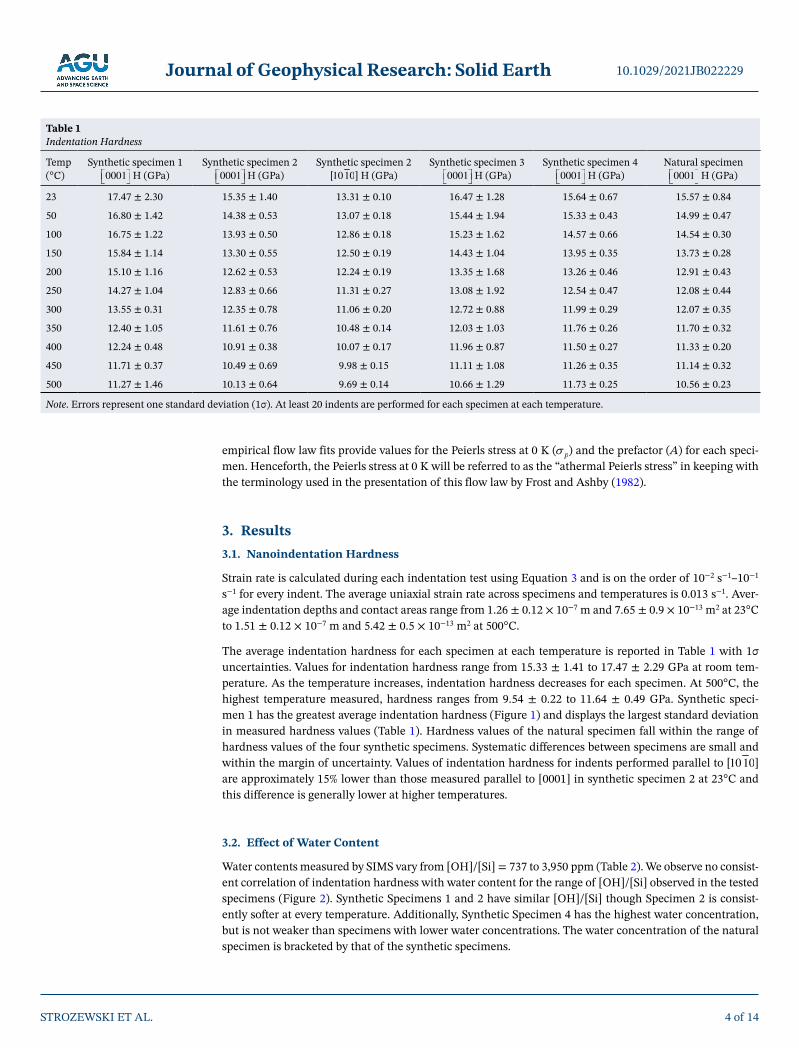
The average indentation hardness for each specimen at each temperature is reported in Table 1 with 1σ uncertainties. Values for indentation hardness range from 15.33 ± 1.41 to 17.47 ± 2.29 GPa at room tem-perature. As the temperature increases, indentation hardness decreases for each specimen. At 500°C, the highest temperature measured, hardness ranges from 9.54 ± 0.22 to 11.64 ± 0.49 GPa. Synthetic speci-men 1 has the greatest average indentation hardness (Figure 1) and displays the largest standard deviation in measured hardness values (Table 1). Hardness values of the natural specimen fall within the range of hardness values of the four synthetic specimens. Systematic differences between specimens are small and within the margin of uncertainty. Values of indentation hardness for indents performed parallel to [10 10E ] are approximately 15% lower than those measured parallel to [0001] in synthetic specimen 2 at 23°C and this difference is generally lower at higher temperatures.
3.2. Effect of Water Content
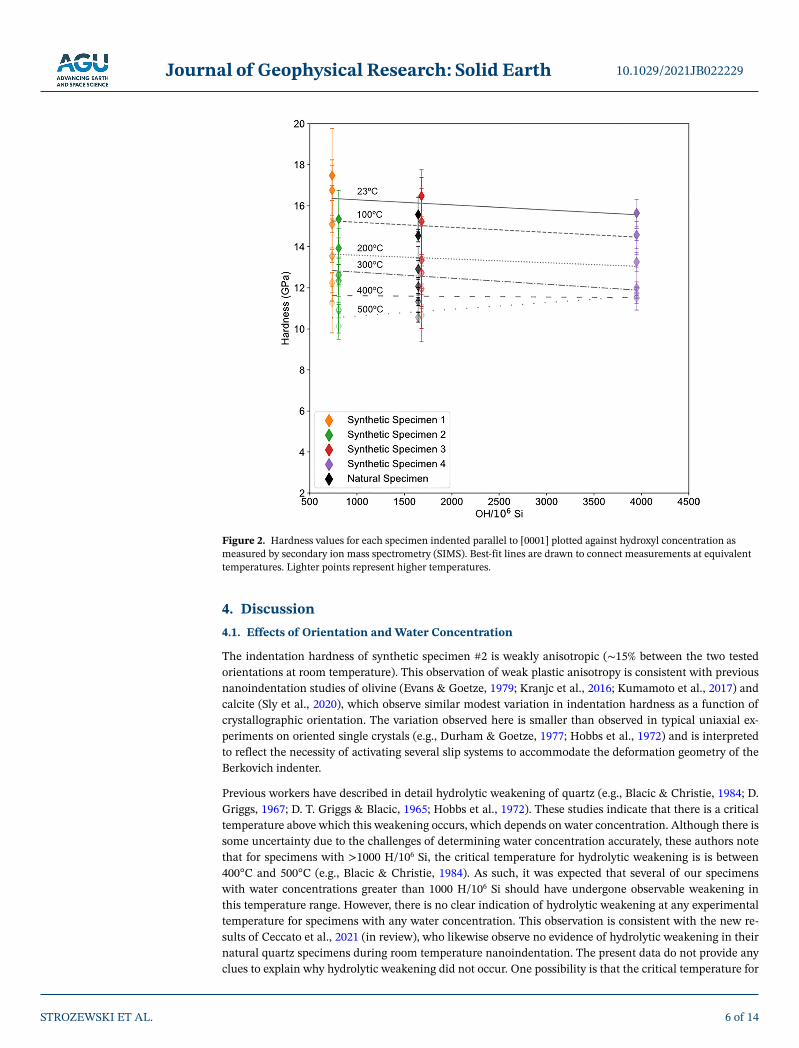
Water contents measured by SIMS vary from [OH]/[Si] = 737 to 3,950 ppm (Table 2). We observe no consist-ent correlation of indentation hardness with water content for the range of [OH]/[Si] observed in the tested specimens (Figure 2). Synthetic Specimens 1 and 2 have similar [OH]/[Si] though Specimen 2 is consist-ently softer at every temperature. Additionally, Synthetic Specimen 4 has the highest water concentration, but is not weaker than specimens with lower water concentrations. The water concentration of the natural specimen is bracketed by that of the synthetic specimens.
Temp (°C)
Synthetic specimen 1 0001E H (GPa)
Synthetic specimen 2 0001E H (GPa)
Synthetic specimen 2 [1010E ] H (GPa)
Synthetic specimen 3 0001E H (GPa)
Synthetic specimen 4 0001E H (GPa)
Natural specimen0001E H (GPa)
23 17.47 ± 2.30 15.35 ± 1.40 13.31 ± 0.10 16.47 ± 1.28 15.64 ± 0.67 15.57 ± 0.84
50 16.80 ± 1.42 14.38 ± 0.53 13.07 ± 0.18 15.44 ± 1.94 15.33 ± 0.43 14.99 ± 0.47
100 16.75 ± 1.22 13.93 ± 0.50 12.86 ± 0.18 15.23 ± 1.62 14.57 ± 0.66 14.54 ± 0.30
150 15.84 ± 1.14 13.30 ± 0.55 12.50 ± 0.19 14.43 ± 1.04 13.95 ± 0.35 13.73 ± 0.28
200 15.10 ± 1.16 12.62 ± 0.53 12.24 ± 0.19 13.35 ± 1.68 13.26 ± 0.46 12.91 ± 0.43
250 14.27 ± 1.04 12.83 ± 0.66 11.31 ± 0.27 13.08 ± 1.92 12.54 ± 0.47 12.08 ± 0.44
300 13.55 ± 0.31 12.35 ± 0.78 11.06 ± 0.20 12.72 ± 0.88 11.99 ± 0.29 12.07 ± 0.35
350 12.40 ± 1.05 11.61 ± 0.76 10.48 ± 0.14 12.03 ± 1.03 11.76 ± 0.26 11.70 ± 0.32
400 12.24 ± 0.48 10.91 ± 0.38 10.07 ± 0.17 11.96 ± 0.87 11.50 ± 0.27 11.33 ± 0.20
450 11.71 ± 0.37 10.49 ± 0.69 9.98 ± 0.15 11.11 ± 1.08 11.26 ± 0.35 11.14 ± 0.32
500 11.27 ± 1.46 10.13 ± 0.64 9.69 ± 0.14 10.66 ± 1.29 11.73 ± 0.25 10.56 ± 0.23
Note. Errors represent one standard deviation (1σ). At least 20 indents are performed for each specimen at each temperature.
Table 1 Indentation Hardness
Journal of Geophysical Research: Solid Earth
STROZEWSKI ET AL.
10.1029/2021JB022229
5 of 14
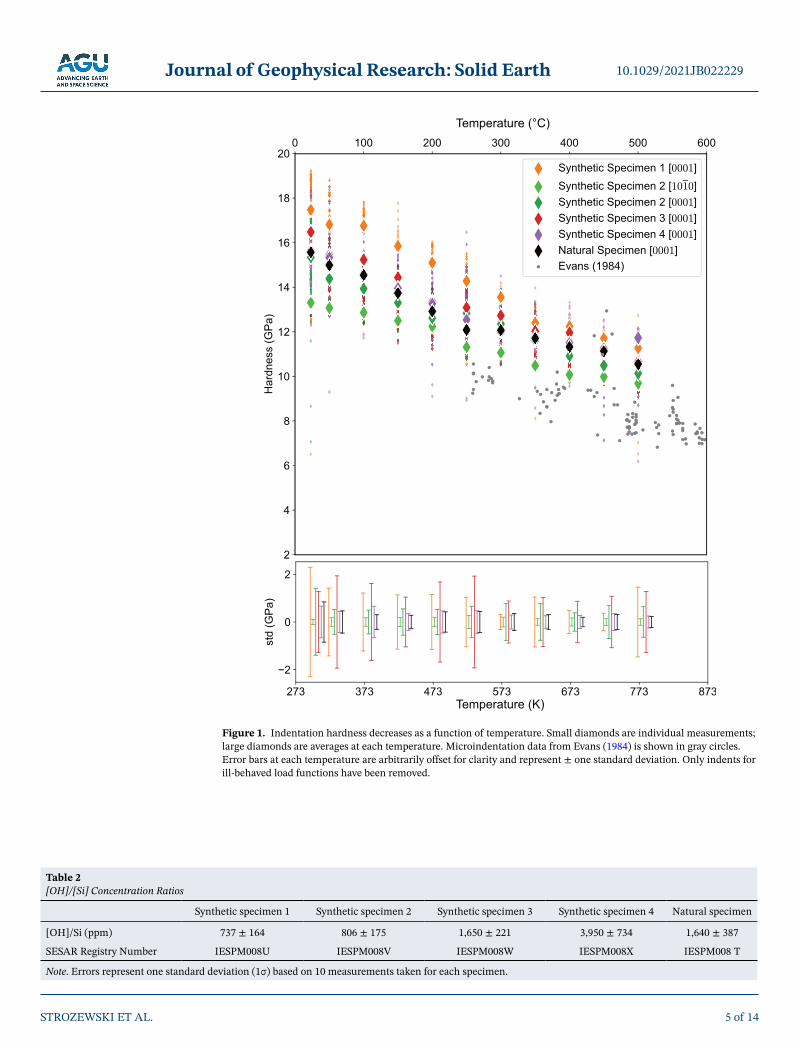
Figure 1. Indentation hardness decreases as a function of temperature. Small diamonds are individual measurements; large diamonds are averages at each temperature. Microindentation data from Evans (1984) is shown in gray circles. Error bars at each temperature are arbitrarily offset for clarity and represent ± one standard deviation. Only indents for ill-behaved load functions have been removed.
Synthetic specimen 1 Synthetic specimen 2 Synthetic specimen 3 Synthetic specimen 4 Natural specimen
[OH]/Si (ppm) 737 ± 164 806 ± 175 1,650 ± 221 3,950 ± 734 1,640 ± 387
SESAR Registry Number IESPM008U IESPM008V IESPM008W IESPM008X IESPM008 T
Note. Errors represent one standard deviation (1σ) based on 10 measurements taken for each specimen.
Table 2 [OH]/[Si] Concentration Ratios
Journal of Geophysical Research: Solid Earth
STROZEWSKI ET AL.
10.1029/2021JB022229
6 of 14
4. Discussion4.1. Effects of Orientation and Water Concentration
The indentation hardness of synthetic specimen #2 is weakly anisotropic (∼15% between the two tested orientations at room temperature). This observation of weak plastic anisotropy is consistent with previous nanoindentation studies of olivine (Evans & Goetze, 1979; Kranjc et al., 2016; Kumamoto et al., 2017) and calcite (Sly et al., 2020), which observe similar modest variation in indentation hardness as a function of crystallographic orientation. The variation observed here is smaller than observed in typical uniaxial ex-periments on oriented single crystals (e.g., Durham & Goetze, 1977; Hobbs et al., 1972) and is interpreted to reflect the necessity of activating several slip systems to accommodate the deformation geometry of the Berkovich indenter.
Previous workers have described in detail hydrolytic weakening of quartz (e.g., Blacic & Christie, 1984; D. Griggs, 1967; D. T. Griggs & Blacic, 1965; Hobbs et al., 1972). These studies indicate that there is a critical temperature above which this weakening occurs, which depends on water concentration. Although there is some uncertainty due to the challenges of determining water concentration accurately, these authors note that for specimens with >1000 H/106 Si, the critical temperature for hydrolytic weakening is is between 400°C and 500°C (e.g., Blacic & Christie, 1984). As such, it was expected that several of our specimens with water concentrations greater than 1000 H/106 Si should have undergone observable weakening in this temperature range. However, there is no clear indication of hydrolytic weakening at any experimental temperature for specimens with any water concentration. This observation is consistent with the new re-sults of Ceccato et al., 2021 (in review), who likewise observe no evidence of hydrolytic weakening in their natural quartz specimens during room temperature nanoindentation. The present data do not provide any clues to explain why hydrolytic weakening did not occur. One possibility is that the critical temperature for
Figure 2. Hardness values for each specimen indented parallel to [0001] plotted against hydroxyl concentration as measured by secondary ion mass spectrometry (SIMS). Best-fit lines are drawn to connect measurements at equivalent temperatures. Lighter points represent higher temperatures.
Journal of Geophysical Research: Solid Earth
STROZEWSKI ET AL.
10.1029/2021JB022229
7 of 14
hydrolytic weakening is strain-rate or stress dependent, and at these experimental conditions diffusion of the necessary hydrogen defects cannot keep up with the rate of dislocation glide.
An additional question to consider is the if water may have been lost during the experimental process, yield-ing samples with lower water concentrations. However, appreciable changes in OH concentration in the deformed volume are not expected during a set of indentations at the temperatures of experiments reported here. A diffusion length of oxygen in quartz comparable to an average indentation depth of 1.5 × 10⁻⁷ m at this temperature over a typical experimental run time of two hours would require a diffusivity of ap-proximately 1.6 × 10⁻¹⁰ m2/s. This value is three orders of magnitude greater than published values of the diffusivity of oxyen in α-quartz at this temperature (Giletti & Yund, 1984). The diffusion length over a time of 2 h (the duration that specimens were at the maximum experimental temperature) using published diffusivities is approximately 4.3 × 10⁻⁹ m. Comparison to the average indentation depth of 1.5 × 10⁻⁷ m at this temperature indicates that diffusional loss of OH is only possible from the shallowest portion of the deformed volume and unlikely to have a significant effect on mechanical properties for these experiments. However, this consideration will likely be important for future nanoindentation experiments on quartz at lower strain-rates and at higher temperatures due to the higher diffusivity of oxygen in β-quartz at 700°C (D ∼ 1 × 10⁻¹⁰ m2/s; Giletti & Yund,, 1984).
4.2. Determination of Yield Stress From Nanoindentation Hardness
A common method for determining yield stress from indentation hardness is based on Tabor's law, which states that yield stress is linearly related to indentation hardness through a constraint factor at some charac-teristic strain (typically ε = 0.08) as shown in Equation 5 (Atkins & Tabor, 1965):
H C (5)where C is the non-dimensional constraint factor and σ is the yield stress. Lower constraint factors corre-spond to a more elastic material. The minimum possible value of C is at the elastic limit where C = 1.1, and the maximum possible value of C is the plastic limit where C = 3.0. A value between 2.7 and 3.0 is common-ly assumed for rigid-plastic materials (Evans & Goetze, 1979; Hutchings, 2009; Matthews, 1980).
The conversion of indentation hardness measurements to uniaxial yield stress is not straightforward for geologic materials (Regenauer-Lieb & Yuen, 2006; Sly et al., 2020) because of the relatively high strength of geologic materials in comparison to typical engineered materials. This study follows the procedure of Sly et al. (2020) in applying several models to determine yield stress from nanoindentation hardness. Quartz has a low ratio of elastic modulus to yield stress (Evans, 1984; Regenauer-Lieb & Yuen, 2006) and could therefore be close to the elastic limit of Equation 5. This is different from olivine, calcite, and other rheo-logically important minerals, which are weaker at experimental conditions and exhibit constraint factors close to 3.0 (Evans, 1984). As the yield stress of α−quartz at low temperature is not well constrained by other methods (Regenauer-Lieb & Yuen, 2006), there is no basis for elevating one model above the others. As such, all will be reported here.
The models applied here are: (i) Johnson (1970), (ii) Evans and Goetze (1979), (iii) Mata et al., (2002) and Mata and Alcalá (2003) and (iv) Ginder et al., (2018). Model (i) presents the first mechanical assessment of the problem in the context of an elastic-plastic solid and provides the basis for the modified approaches of (ii) and (iii). Model (iv) instead considers a power-law creeping solid.
The theoretical assessment of (i) arrives at the relation
4 1 22 13 6 1
y
y
Etan
H ln
(6)
where E is the angle between the indenter tip and the surface. From this relation, it is noted that the ratio between the hardness and yield stress depends on the elastic modulus and Poisson's ratio of the specimen in addition to the geometry of the indenter tip.
Journal of Geophysical Research: Solid Earth
STROZEWSKI ET AL.
10.1029/2021JB022229
8 of 14
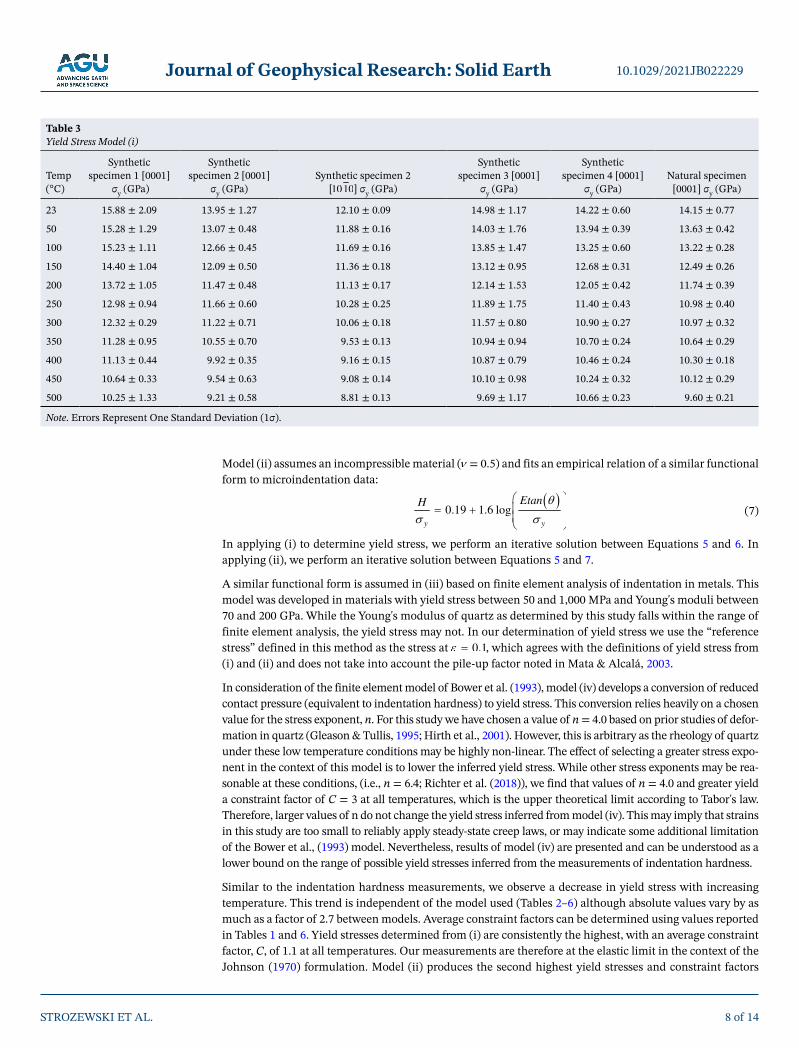
Model (ii) assumes an incompressible material (E = 0.5) and fits an empirical relation of a similar functional form to microindentation data:
0.19 1.6 log
y y
EtanH
(7)
In applying (i) to determine yield stress, we perform an iterative solution between Equations 5 and 6. In applying (ii), we perform an iterative solution between Equations 5 and 7.
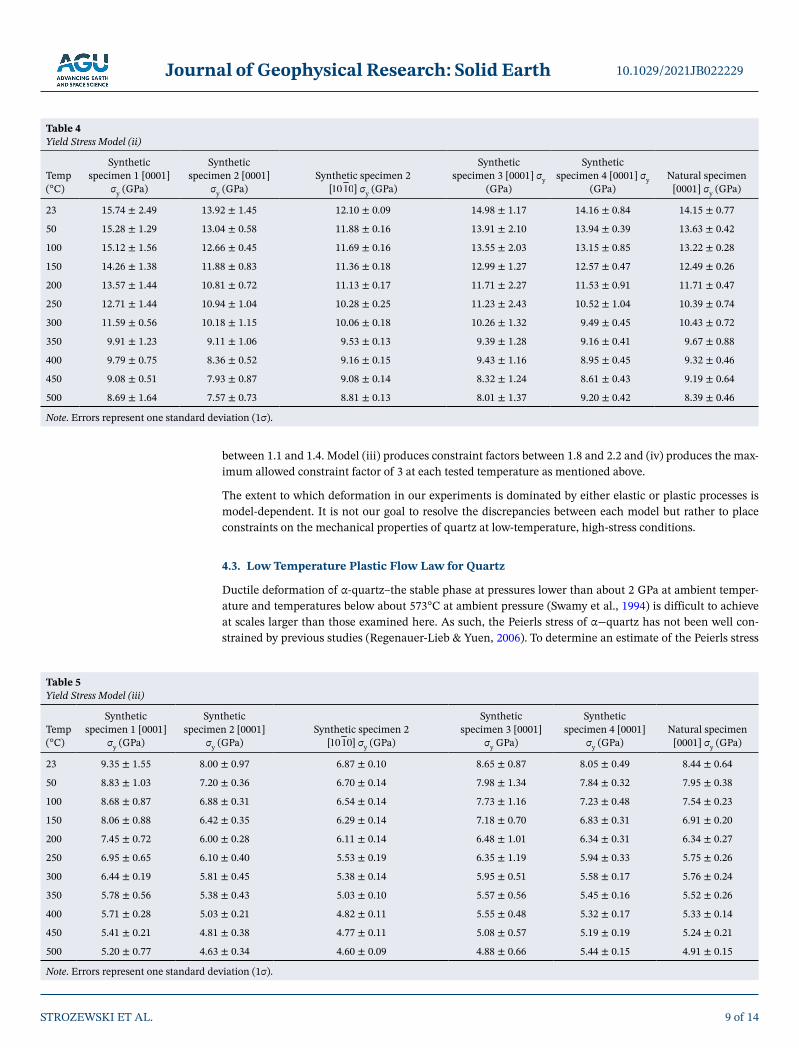
A similar functional form is assumed in (iii) based on finite element analysis of indentation in metals. This model was developed in materials with yield stress between 50 and 1,000 MPa and Young's moduli between 70 and 200 GPa. While the Young's modulus of quartz as determined by this study falls within the range of finite element analysis, the yield stress may not. In our determination of yield stress we use the “reference stress” defined in this method as the stress at 0.1E , which agrees with the definitions of yield stress from (i) and (ii) and does not take into account the pile-up factor noted in Mata & Alcalá, 2003.
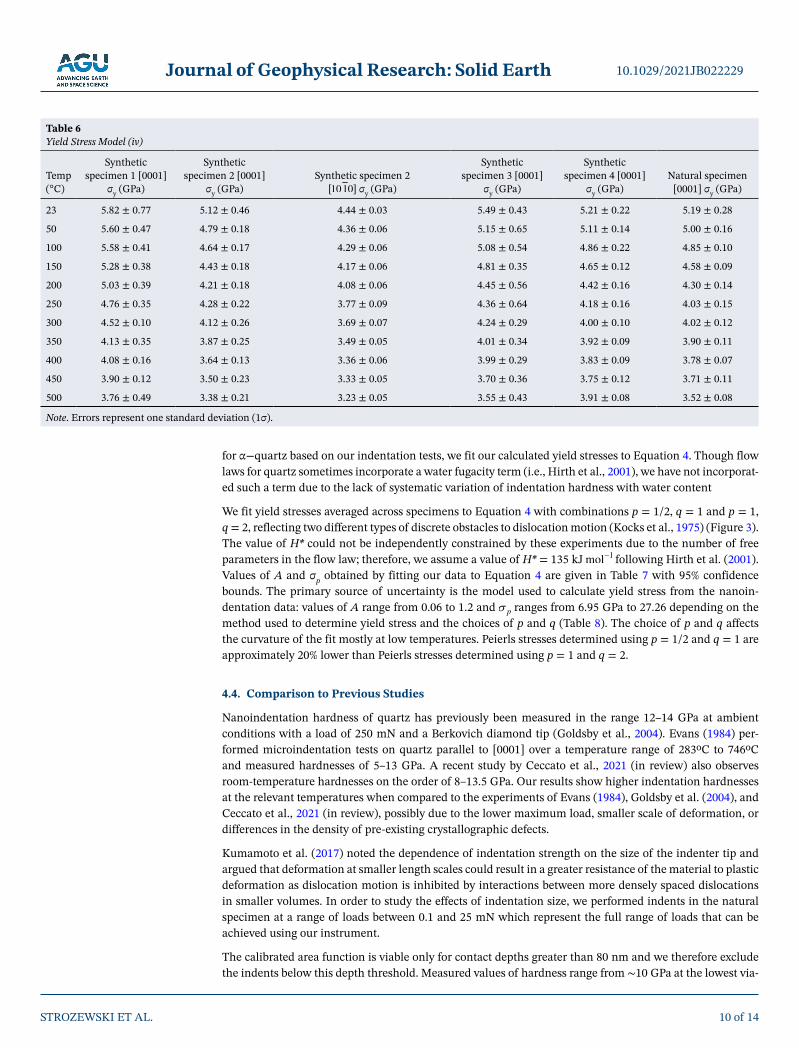
In consideration of the finite element model of Bower et al. (1993), model (iv) develops a conversion of reduced contact pressure (equivalent to indentation hardness) to yield stress. This conversion relies heavily on a chosen value for the stress exponent, n. For this study we have chosen a value of n = 4.0 based on prior studies of defor-mation in quartz (Gleason & Tullis, 1995; Hirth et al., 2001). However, this is arbitrary as the rheology of quartz under these low temperature conditions may be highly non-linear. The effect of selecting a greater stress expo-nent in the context of this model is to lower the inferred yield stress. While other stress exponents may be rea-sonable at these conditions, (i.e., n = 6.4; Richter et al. (2018)), we find that values of n = 4.0 and greater yield a constraint factor of C = 3 at all temperatures, which is the upper theoretical limit according to Tabor's law. Therefore, larger values of n do not change the yield stress inferred from model (iv). This may imply that strains in this study are too small to reliably apply steady-state creep laws, or may indicate some additional limitation of the Bower et al., (1993) model. Nevertheless, results of model (iv) are presented and can be understood as a lower bound on the range of possible yield stresses inferred from the measurements of indentation hardness.
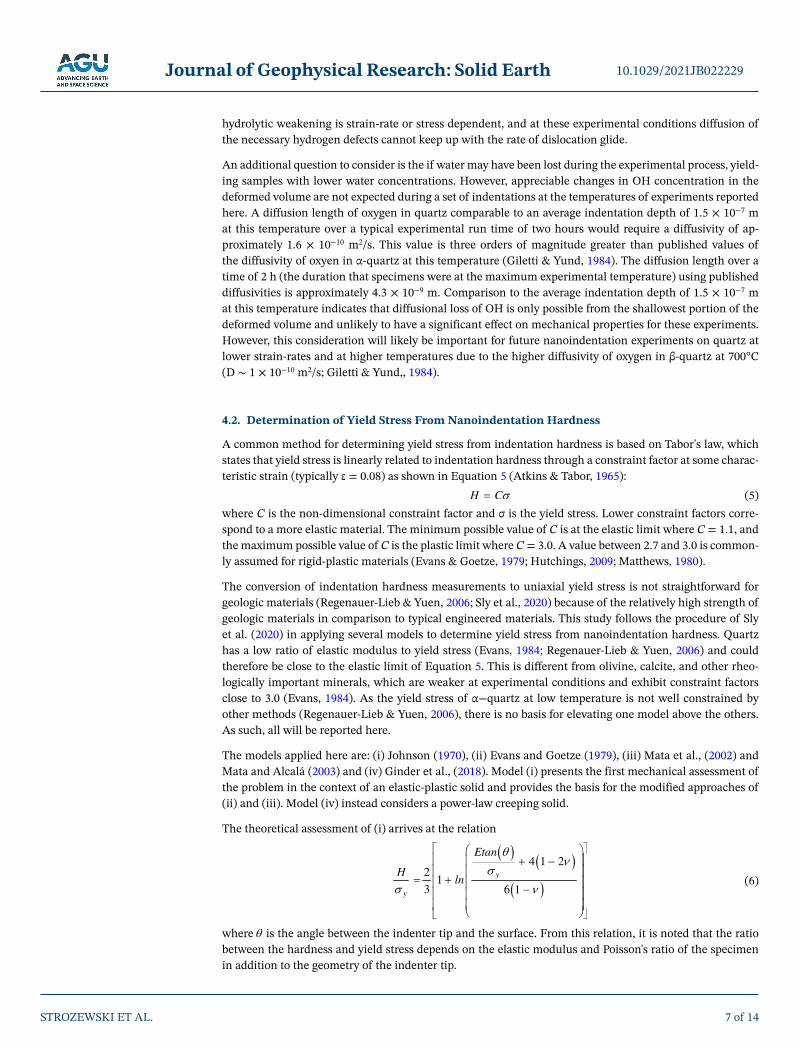
Similar to the indentation hardness measurements, we observe a decrease in yield stress with increasing temperature. This trend is independent of the model used (Tables 2–6) although absolute values vary by as much as a factor of 2.7 between models. Average constraint factors can be determined using values reported in Tables 1 and 6. Yield stresses determined from (i) are consistently the highest, with an average constraint factor, C, of 1.1 at all temperatures. Our measurements are therefore at the elastic limit in the context of the Johnson (1970) formulation. Model (ii) produces the second highest yield stresses and constraint factors
Temp (°C)
Synthetic specimen 1 [0001]
σy (GPa)
Synthetic specimen 2 [0001]
σy (GPa)Synthetic specimen 2
[1010E ] σy (GPa)
Synthetic specimen 3 [0001]
σy (GPa)
Synthetic specimen 4 [0001]
σy (GPa)Natural specimen
[0001] σy (GPa)
23 15.88 ± 2.09 13.95 ± 1.27 12.10 ± 0.09 14.98 ± 1.17 14.22 ± 0.60 14.15 ± 0.77
50 15.28 ± 1.29 13.07 ± 0.48 11.88 ± 0.16 14.03 ± 1.76 13.94 ± 0.39 13.63 ± 0.42
100 15.23 ± 1.11 12.66 ± 0.45 11.69 ± 0.16 13.85 ± 1.47 13.25 ± 0.60 13.22 ± 0.28
150 14.40 ± 1.04 12.09 ± 0.50 11.36 ± 0.18 13.12 ± 0.95 12.68 ± 0.31 12.49 ± 0.26
200 13.72 ± 1.05 11.47 ± 0.48 11.13 ± 0.17 12.14 ± 1.53 12.05 ± 0.42 11.74 ± 0.39
250 12.98 ± 0.94 11.66 ± 0.60 10.28 ± 0.25 11.89 ± 1.75 11.40 ± 0.43 10.98 ± 0.40
300 12.32 ± 0.29 11.22 ± 0.71 10.06 ± 0.18 11.57 ± 0.80 10.90 ± 0.27 10.97 ± 0.32
350 11.28 ± 0.95 10.55 ± 0.70 9.53 ± 0.13 10.94 ± 0.94 10.70 ± 0.24 10.64 ± 0.29
400 11.13 ± 0.44 9.92 ± 0.35 9.16 ± 0.15 10.87 ± 0.79 10.46 ± 0.24 10.30 ± 0.18
450 10.64 ± 0.33 9.54 ± 0.63 9.08 ± 0.14 10.10 ± 0.98 10.24 ± 0.32 10.12 ± 0.29
500 10.25 ± 1.33 9.21 ± 0.58 8.81 ± 0.13 9.69 ± 1.17 10.66 ± 0.23 9.60 ± 0.21
Note. Errors Represent One Standard Deviation (1σ).
Table 3 Yield Stress Model (i)
Journal of Geophysical Research: Solid Earth
STROZEWSKI ET AL.
10.1029/2021JB022229
9 of 14
between 1.1 and 1.4. Model (iii) produces constraint factors between 1.8 and 2.2 and (iv) produces the max-imum allowed constraint factor of 3 at each tested temperature as mentioned above.
The extent to which deformation in our experiments is dominated by either elastic or plastic processes is model-dependent. It is not our goal to resolve the discrepancies between each model but rather to place constraints on the mechanical properties of quartz at low-temperature, high-stress conditions.
4.3. Low Temperature Plastic Flow Law for Quartz
Ductile deformation οf α-quartz–the stable phase at pressures lower than about 2 GPa at ambient temper-ature and temperatures below about 573°C at ambient pressure (Swamy et al., 1994) is difficult to achieve at scales larger than those examined here. As such, the Peierls stress of α−quartz has not been well con-strained by previous studies (Regenauer-Lieb & Yuen, 2006). To determine an estimate of the Peierls stress
Temp (°C)
Synthetic specimen 1 [0001]
σy (GPa)
Synthetic specimen 2 [0001]
σy (GPa)Synthetic specimen 2
[1010E ] σy (GPa)
Synthetic specimen 3 [0001] σy
(GPa)
Synthetic specimen 4 [0001] σy
(GPa)Natural specimen
[0001] σy (GPa)
23 15.74 ± 2.49 13.92 ± 1.45 12.10 ± 0.09 14.98 ± 1.17 14.16 ± 0.84 14.15 ± 0.77
50 15.28 ± 1.29 13.04 ± 0.58 11.88 ± 0.16 13.91 ± 2.10 13.94 ± 0.39 13.63 ± 0.42
100 15.12 ± 1.56 12.66 ± 0.45 11.69 ± 0.16 13.55 ± 2.03 13.15 ± 0.85 13.22 ± 0.28
150 14.26 ± 1.38 11.88 ± 0.83 11.36 ± 0.18 12.99 ± 1.27 12.57 ± 0.47 12.49 ± 0.26
200 13.57 ± 1.44 10.81 ± 0.72 11.13 ± 0.17 11.71 ± 2.27 11.53 ± 0.91 11.71 ± 0.47
250 12.71 ± 1.44 10.94 ± 1.04 10.28 ± 0.25 11.23 ± 2.43 10.52 ± 1.04 10.39 ± 0.74
300 11.59 ± 0.56 10.18 ± 1.15 10.06 ± 0.18 10.26 ± 1.32 9.49 ± 0.45 10.43 ± 0.72
350 9.91 ± 1.23 9.11 ± 1.06 9.53 ± 0.13 9.39 ± 1.28 9.16 ± 0.41 9.67 ± 0.88
400 9.79 ± 0.75 8.36 ± 0.52 9.16 ± 0.15 9.43 ± 1.16 8.95 ± 0.45 9.32 ± 0.46
450 9.08 ± 0.51 7.93 ± 0.87 9.08 ± 0.14 8.32 ± 1.24 8.61 ± 0.43 9.19 ± 0.64
500 8.69 ± 1.64 7.57 ± 0.73 8.81 ± 0.13 8.01 ± 1.37 9.20 ± 0.42 8.39 ± 0.46
Note. Errors represent one standard deviation (1σ).
Table 4 Yield Stress Model (ii)
Temp (°C)
Synthetic specimen 1 [0001]
σy (GPa)
Synthetic specimen 2 [0001]
σy (GPa)Synthetic specimen 2
[1010E ] σy (GPa)
Synthetic specimen 3 [0001]
σy GPa)
Synthetic specimen 4 [0001]
σy (GPa)Natural specimen
[0001] σy (GPa)
23 9.35 ± 1.55 8.00 ± 0.97 6.87 ± 0.10 8.65 ± 0.87 8.05 ± 0.49 8.44 ± 0.64
50 8.83 ± 1.03 7.20 ± 0.36 6.70 ± 0.14 7.98 ± 1.34 7.84 ± 0.32 7.95 ± 0.38
100 8.68 ± 0.87 6.88 ± 0.31 6.54 ± 0.14 7.73 ± 1.16 7.23 ± 0.48 7.54 ± 0.23
150 8.06 ± 0.88 6.42 ± 0.35 6.29 ± 0.14 7.18 ± 0.70 6.83 ± 0.31 6.91 ± 0.20
200 7.45 ± 0.72 6.00 ± 0.28 6.11 ± 0.14 6.48 ± 1.01 6.34 ± 0.31 6.34 ± 0.27
250 6.95 ± 0.65 6.10 ± 0.40 5.53 ± 0.19 6.35 ± 1.19 5.94 ± 0.33 5.75 ± 0.26
300 6.44 ± 0.19 5.81 ± 0.45 5.38 ± 0.14 5.95 ± 0.51 5.58 ± 0.17 5.76 ± 0.24
350 5.78 ± 0.56 5.38 ± 0.43 5.03 ± 0.10 5.57 ± 0.56 5.45 ± 0.16 5.52 ± 0.26
400 5.71 ± 0.28 5.03 ± 0.21 4.82 ± 0.11 5.55 ± 0.48 5.32 ± 0.17 5.33 ± 0.14
450 5.41 ± 0.21 4.81 ± 0.38 4.77 ± 0.11 5.08 ± 0.57 5.19 ± 0.19 5.24 ± 0.21
500 5.20 ± 0.77 4.63 ± 0.34 4.60 ± 0.09 4.88 ± 0.66 5.44 ± 0.15 4.91 ± 0.15
Note. Errors represent one standard deviation (1σ).
Table 5 Yield Stress Model (iii)
Journal of Geophysical Research: Solid Earth
STROZEWSKI ET AL.
10.1029/2021JB022229
10 of 14
for α−quartz based on our indentation tests, we fit our calculated yield stresses to Equation 4. Though flow laws for quartz sometimes incorporate a water fugacity term (i.e., Hirth et al., 2001), we have not incorporat-ed such a term due to the lack of systematic variation of indentation hardness with water content
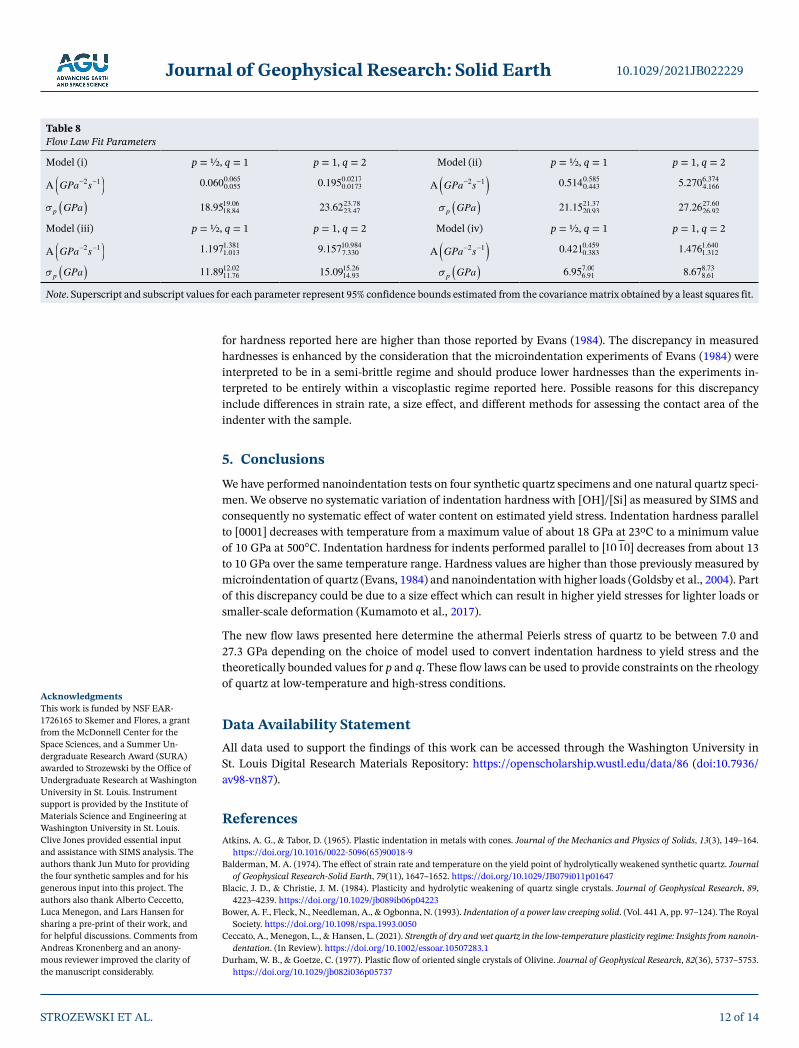
We fit yield stresses averaged across specimens to Equation 4 with combinations p = 1/2, q = 1 and p = 1, q = 2, reflecting two different types of discrete obstacles to dislocation motion (Kocks et al., 1975) (Figure 3). The value of H* could not be independently constrained by these experiments due to the number of free parameters in the flow law; therefore, we assume a value of H* = 135 kJ 1molE following Hirth et al. (2001). Values of A and σp obtained by fitting our data to Equation 4 are given in Table 7 with 95% confidence bounds. The primary source of uncertainty is the model used to calculate yield stress from the nanoin-dentation data: values of A range from 0.06 to 1.2 and pE ranges from 6.95 GPa to 27.26 depending on the method used to determine yield stress and the choices of p and q (Table 8). The choice of p and q affects the curvature of the fit mostly at low temperatures. Peierls stresses determined using p = 1/2 and q = 1 are approximately 20% lower than Peierls stresses determined using p = 1 and q = 2.
4.4. Comparison to Previous Studies
Nanoindentation hardness of quartz has previously been measured in the range 12–14 GPa at ambient conditions with a load of 250 mN and a Berkovich diamond tip (Goldsby et al., 2004). Evans (1984) per-formed microindentation tests on quartz parallel to [0001] over a temperature range of 283ºC to 746ºC and measured hardnesses of 5–13 GPa. A recent study by Ceccato et al., 2021 (in review) also observes room-temperature hardnesses on the order of 8–13.5 GPa. Our results show higher indentation hardnesses at the relevant temperatures when compared to the experiments of Evans (1984), Goldsby et al. (2004), and Ceccato et al., 2021 (in review), possibly due to the lower maximum load, smaller scale of deformation, or differences in the density of pre-existing crystallographic defects.
Kumamoto et al. (2017) noted the dependence of indentation strength on the size of the indenter tip and argued that deformation at smaller length scales could result in a greater resistance of the material to plastic deformation as dislocation motion is inhibited by interactions between more densely spaced dislocations in smaller volumes. In order to study the effects of indentation size, we performed indents in the natural specimen at a range of loads between 0.1 and 25 mN which represent the full range of loads that can be achieved using our instrument.
The calibrated area function is viable only for contact depths greater than 80 nm and we therefore exclude the indents below this depth threshold. Measured values of hardness range from ∼10 GPa at the lowest via-
Temp (°C)
Synthetic specimen 1 [0001]
σy (GPa)
Synthetic specimen 2 [0001]
σy (GPa)Synthetic specimen 2
[1010E ] σy (GPa)
Synthetic specimen 3 [0001]
σy (GPa)
Synthetic specimen 4 [0001]
σy (GPa)Natural specimen
[0001] σy (GPa)
23 5.82 ± 0.77 5.12 ± 0.46 4.44 ± 0.03 5.49 ± 0.43 5.21 ± 0.22 5.19 ± 0.28
50 5.60 ± 0.47 4.79 ± 0.18 4.36 ± 0.06 5.15 ± 0.65 5.11 ± 0.14 5.00 ± 0.16
100 5.58 ± 0.41 4.64 ± 0.17 4.29 ± 0.06 5.08 ± 0.54 4.86 ± 0.22 4.85 ± 0.10
150 5.28 ± 0.38 4.43 ± 0.18 4.17 ± 0.06 4.81 ± 0.35 4.65 ± 0.12 4.58 ± 0.09
200 5.03 ± 0.39 4.21 ± 0.18 4.08 ± 0.06 4.45 ± 0.56 4.42 ± 0.16 4.30 ± 0.14
250 4.76 ± 0.35 4.28 ± 0.22 3.77 ± 0.09 4.36 ± 0.64 4.18 ± 0.16 4.03 ± 0.15
300 4.52 ± 0.10 4.12 ± 0.26 3.69 ± 0.07 4.24 ± 0.29 4.00 ± 0.10 4.02 ± 0.12
350 4.13 ± 0.35 3.87 ± 0.25 3.49 ± 0.05 4.01 ± 0.34 3.92 ± 0.09 3.90 ± 0.11
400 4.08 ± 0.16 3.64 ± 0.13 3.36 ± 0.06 3.99 ± 0.29 3.83 ± 0.09 3.78 ± 0.07
450 3.90 ± 0.12 3.50 ± 0.23 3.33 ± 0.05 3.70 ± 0.36 3.75 ± 0.12 3.71 ± 0.11
500 3.76 ± 0.49 3.38 ± 0.21 3.23 ± 0.05 3.55 ± 0.43 3.91 ± 0.08 3.52 ± 0.08
Note. Errors represent one standard deviation (1σ).
Table 6 Yield Stress Model (iv)

Journal of Geophysical Research: Solid Earth
STROZEWSKI ET AL.
10.1029/2021JB022229
11 of 14
ble loads and contact depths to ∼14 GPa at the highest loads and deepest depths. Following Kumamoto et al. (2017) in using the contact radius as the length scale, the best fit power law has an exponent of 0.42, indicating an increase in hardness with increasing indent size. This is the opposite trend to that observed by Kumamoto et al. (2017) for the scale-dependent strength of olivine. However, the data is not well fit by the power law (R2 = 0.57). We therefore infer that the size of indent does not play a crucial role over the limited range of loads achievable in our experimen-tal setup. As mentioned previously, all indents performed outside of this procedure are conducted with the same load (8 mN) to further mitigate the effect of indent size on the measured hardness. Any difference in hardness in our experiments therefore represents a difference in strength rather than a scale effect.
We calculate the yield stresses for hardness values reported in Ev-ans (1984) using a constraint factor of C = 1.1 as determined in Evans and Goetze (1979). Correcting the strain rate observed in Evans (1984) to the average strain rate observed in our experiments produces yield stresses in the range between 5.6 and 15.0 GPa, plotted in Figure 3. Yield stresses calculated for indents performed in our study bracket those determined from the microindentation experiments of Evans (1984) at comparable temperatures for the models with the closest agreement. However, values
Figure 3. Yield stress is estimated by four different methods to solve for the athermal Peierls stress of quartz. Each flow law is formed by a fit to Equation 4 with H* = 135 kJ mol−1 and strain rate of 0.013 s−1 using yield stresses averaged across specimens for indents performed parallel to [0001]. Labels indicate the model used to calculate the yield stress. The flow law of Hirth et al. (2001) is plotted at the same strain rate. The gray box indicates the range of temperatures in this study.
Temp (°C)
Evans σy (GPa)
Johnson σy (Gpa)
Ginder σy (Gpa)
Mata and Alcala σy (Gpa)
23 14.59 ± 0.66 14.64 ± 0.58 5.37 ± 0.21 8.50 ± 0.44
50 13.96 ± 0.52 13.99 ± 0.46 5.13 ± 0.17 7.96 ± 0.36
100 13.54 ± 0.55 13.64 ± 0.40 5.00 ± 0.15 7.61 ± 0.32
150 12.84 ± 0.42 12.96 ± 0.31 4.75 ± 0.11 7.08 ± 0.25
200 11.87 ± 0.59 12.22 ± 0.40 4.48 ± 0.15 6.52 ± 0.27
250 11.16 ± 0.65 11.78 ± 0.43 4.32 ± 0.16 6.21 ± 0.30
300 10.39 ± 0.40 11.40 ± 0.24 4.18 ± 0.09 5.91 ± 0.16
350 9.45 ± 0.46 10.82 ± 0.31 3.97 ± 0.11 5.53 ± 0.19
400 9.17 ± 0.32 10.53 ± 0.20 3.86 ± 0.07 5.39 ± 0.13
450 8.63 ± 0.36 10.13 ± 0.26 3.71 ± 0.09 5.15 ± 0.15
500 8.37 ± 0.47 9.88 ± 0.38 3.62 ± 0.14 5.01 ± 0.22
Note. Errors represent one standard deviation (1σ).
Table 7 [0001] Yield Stresses Averaged Across Specimens
Journal of Geophysical Research: Solid Earth
STROZEWSKI ET AL.
10.1029/2021JB022229
12 of 14
for hardness reported here are higher than those reported by Evans (1984). The discrepancy in measured hardnesses is enhanced by the consideration that the microindentation experiments of Evans (1984) were interpreted to be in a semi-brittle regime and should produce lower hardnesses than the experiments in-terpreted to be entirely within a viscoplastic regime reported here. Possible reasons for this discrepancy include differences in strain rate, a size effect, and different methods for assessing the contact area of the indenter with the sample.
5. ConclusionsWe have performed nanoindentation tests on four synthetic quartz specimens and one natural quartz speci-men. We observe no systematic variation of indentation hardness with [OH]/[Si] as measured by SIMS and consequently no systematic effect of water content on estimated yield stress. Indentation hardness parallel to [0001] decreases with temperature from a maximum value of about 18 GPa at 23ºC to a minimum value of 10 GPa at 500°C. Indentation hardness for indents performed parallel to [10 10E ] decreases from about 13 to 10 GPa over the same temperature range. Hardness values are higher than those previously measured by microindentation of quartz (Evans, 1984) and nanoindentation with higher loads (Goldsby et al., 2004). Part of this discrepancy could be due to a size effect which can result in higher yield stresses for lighter loads or smaller-scale deformation (Kumamoto et al., 2017).
The new flow laws presented here determine the athermal Peierls stress of quartz to be between 7.0 and 27.3 GPa depending on the choice of model used to convert indentation hardness to yield stress and the theoretically bounded values for p and q. These flow laws can be used to provide constraints on the rheology of quartz at low-temperature and high-stress conditions.
Data Availability StatementAll data used to support the findings of this work can be accessed through the Washington University in St. Louis Digital Research Materials Repository: https://openscholarship.wustl.edu/data/86 (doi:10.7936/av98-vn87).
ReferencesAtkins, A. G., & Tabor, D. (1965). Plastic indentation in metals with cones. Journal of the Mechanics and Physics of Solids, 13(3), 149–164.
https://doi.org/10.1016/0022-5096(65)90018-9Balderman, M. A. (1974). The effect of strain rate and temperature on the yield point of hydrolytically weakened synthetic quartz. Journal
of Geophysical Research-Solid Earth, 79(11), 1647–1652. https://doi.org/10.1029/JB079i011p01647Blacic, J. D., & Christie, J. M. (1984). Plasticity and hydrolytic weakening of quartz single crystals. Journal of Geophysical Research, 89,
4223–4239. https://doi.org/10.1029/jb089ib06p04223Bower, A. F., Fleck, N., Needleman, A., & Ogbonna, N. (1993). Indentation of a power law creeping solid. (Vol. 441 A, pp. 97–124). The Royal
Society. https://doi.org/10.1098/rspa.1993.0050Ceccato, A., Menegon, L., & Hansen, L. (2021). Strength of dry and wet quartz in the low-temperature plasticity regime: Insights from nanoin-
dentation. (In Review). https://doi.org/10.1002/essoar.10507283.1Durham, W. B., & Goetze, C. (1977). Plastic flow of oriented single crystals of Olivine. Journal of Geophysical Research, 82(36), 5737–5753.
https://doi.org/10.1029/jb082i036p05737
Model (i) p = ½, q = 1 p = 1, q = 2 Model (ii) p = ½, q = 1 p = 1, q = 2
A 2 1E GPa s 0.0650.0550.060E 0.0217
0.01730.195E A 2 1E GPa s 0.5850.4430.514E 6.374
4.1665.270E
pE GPa 19.0618.8418.95E 23.78
23.4723.62E pE GPa 21.3720.9321.15E 27.60
26.9227.26E
Model (iii) p = ½, q = 1 p = 1, q = 2 Model (iv) p = ½, q = 1 p = 1, q = 2
A 2 1E GPa s 1.3811.0131.197E 10.984
7.3309.157E A 2 1E GPa s 0.4590.3830.421E 1.640
1.3121.476E
pE GPa 12.0211.7611.89E 15.26
14.9315.09E pE GPa 7.006.916.95E 8.73
8.618.67E
Note. Superscript and subscript values for each parameter represent 95% confidence bounds estimated from the covariance matrix obtained by a least squares fit.
Table 8 Flow Law Fit Parameters
AcknowledgmentsThis work is funded by NSF EAR-1726165 to Skemer and Flores, a grant from the McDonnell Center for the Space Sciences, and a Summer Un-dergraduate Research Award (SURA) awarded to Strozewski by the Office of Undergraduate Research at Washington University in St. Louis. Instrument support is provided by the Institute of Materials Science and Engineering at Washington University in St. Louis. Clive Jones provided essential input and assistance with SIMS analysis. The authors thank Jun Muto for providing the four synthetic samples and for his generous input into this project. The authors also thank Alberto Ceccetto, Luca Menegon, and Lars Hansen for sharing a pre-print of their work, and for helpful discussions. Comments from Andreas Kronenberg and an anony-mous reviewer improved the clarity of the manuscript considerably.
Journal of Geophysical Research: Solid Earth
STROZEWSKI ET AL.
10.1029/2021JB022229
13 of 14
Evans, B. (1984). The effect of temperature and impurity content on indentation hardness of quartz. Journal of Geophysical Research-Solid Earth, 89(86), 4213–4222. https://doi.org/10.1029/JB089iB06p04213
Evans, B., & Goetze, C. (1979). The temperature variation of hardness of olivine and its implication for polycrystalline yield stress. Journal of Geophysical Research: Solid Earth, 84(B10), 5505–5524. https://doi.org/10.1029/JB084iB10p05505
Fischer-Cripps, C. (2011). Nanoindentation. In W. O. Wilner, A. E. Bergles, K. K. Wang, I. Finnie, J. R. Welty, & H. T. Yang (Eds.), (3rd ed.). Springer.
Frost, H. J., & Ashby, M. F. (1982). Deformation mechanism maps: The plasticity and creep of metals and ceramics. Pergamon Press.Giletti, B. J., & Yund, R. A. (1984). Oxygen diffusion in quartz. Journal of Geophysical Research: Solid Earth, 89, 4039–4046. https://doi.
org/10.1029/jb089ib06p04039Ginder, R. S., Nix, W. D., & Pharr, G. M. (2018). A simple model for indentation creep. Journal of the Mechanics and Physics of Solids, 112,
552–562. https://doi.org/10.1016/j.jmps.2018.01.001Gleason, G. C., & Tullis, J. (1995). A flow law for dislocation creep of quartz aggregates determined with the molten salt cell. Tectonophys-
ics, 247(1–4), 1–23. https://doi.org/10.1016/0040-1951(95)00011-BGoldsby, D. L., Rar, A., Pharr, G. M., & Tullis, T. E. (2004). Nanoindentation creep of quartz, with implications for rate- and state-variable
friction laws relevant to earthquake mechanics. Journal of Materials Research, 19(1), 357–365. https://doi.org/10.1557/jmr.2004.19.1.357Griggs, D. (1967). Hydrolytic weakening of quartz and other silicates. Geophysical Journal of the Royal Astronomical Society, 14(1–4),
19–31. https://doi.org/10.1111/j.1365-246X.1967.tb06218.xGriggs, D. T., & Blacic, J. D. (1965). Quartz: Anomalous weakness of synthetic crystals. Science, 147(3655), 292–295. https://doi.org/10.1126/
science.147.3655.292Hardiman, M., Vaughan, T. J., & McCarthy, C. T. (2016). The effects of pile-up, viscoelasticity and hydrostatic stress on polymer matrix
nanoindentation. Polymer Testing, 52, 157–166. https://doi.org/10.1016/j.polymertesting.2016.04.003Hirth, G., Teyssier, C., & Dunlap, W. J. (2001). An evaluation of quartzite flow laws based on comparisons between experimentally and
naturally deformed rocks. International Journal of Earth Sciences, 90(1), 77–87. https://doi.org/10.1007/s005310000152Hirth, G., & Tullis, J. (1994). The brittle-plastic transition in experimentally deformed quartz aggregates. Journal of Geophysical Research,
99(B6). https://doi.org/10.1029/93jb02873Hobbs, B. E., McLaren, A. C., & Paterson, M. S. (1972). Plasticity of single crystals of synthetic quartz. Geophysical Monograph Series (Vol.
16, pp. 29–53). https://doi.org/10.1029/GM016p0029Hutchings, I. M. (2009). The contributions of David Tabor to the science of indentation hardness. Journal of Materials Research, 24,
581–589. https://doi.org/10.1557/jmr.2009.0085Johnson, K. L. (1970). The correlation of indentation experiments. Journal of the Mechanics and Physics of Solids, 18(2), 115–126. https://
doi.org/10.1016/0022-5096(70)90029-3Kirby, S. H. (1977). The effects of the α-β phase transformation on the creep properties of hydrolytically-weakened synthetic quartz. Geo-
physical Research Letters, 4(3), 97–100. https://doi.org/10.1029/GL004i003p00097Kocks, U. F., Argon, A. S., & Ashby, M. (1975). Thermodynamics and kinetics of slip. Pergamon Press.Kranjc, K., Rouse, Z., Flores, K. M., & Skemer, P. (2016). Low-temperature plastic rheology of olivine determined by nanoindentation.
Geophysical Research Letters, 43(1), 176–184. https://doi.org/10.1002/2015GL065837Kumamoto, K. M., Thom, C. A., Wallis, D., Hansen, L. N., Armstrong, D. E. J., Warren, J. M., et al. (2017). Size effects resolve discrepancies
in 40 years of work on low-temperature plasticity in olivine. Science Advances, 3(9), 1–7. https://doi.org/10.1126/sciadv.1701338Linker, M. F., Kirby, S. H., Ord, A., & Christie, J. M. (1984). Effects of compression direction on the plasticity and rheology of hydrolyt-
ically weakened synthetic quartz crystals at atmospheric pressure. Journal of Geophysical Research, 89(B6), 4241–4255. https://doi.org/10.1029/jb089ib06p04241
Lowry, A. R., & Pérez-Gussinyé, M. (2011). The role of crustal quartz in controlling Cordilleran deformation. Nature, 471(7338), 353–357. https://doi.org/10.1038/nature09912
Mata, M., & Alcalá, J. (2003). Mechanical property evaluation through sharp indentations in elastoplastic and fully plastic contact regimes. Journal of Materials Research, 18(7), 1705–1709. https://doi.org/10.1557/JMR.2003.0234
Mata, M., Anglada, M., & Alcalá, J. (2002). Contact deformation regimes around sharp indentations and the concept of the characteristic strain. Journal of Materials Research, 17(5), 964–1839. https://doi.org/10.1080/01418610208235694
Matthews, J. R. (1980). Indentation hardness and hot pressing. Acta Metallurgica, 28(3), 311–318. https://doi.org/10.1016/0001- 6160(80)90166-2
Morrison-Smith, D. J., Paterson, M. S., & Hobbs, B. E. (1976). An electron microscope study of plastic deformation in single crystals of synthetic quartz. Tectonophysics, 33(1–2), 43–79. https://doi.org/10.1016/0040-1951(76)90051-2
Muto, J., Hirth, G., Heilbronner, R., & Tullis, J. (2011). Plastic anisotropy and fabric evolution in sheared and recrystallized quartz single crystals. Journal of Geophysical Research, 116(B2), B02206. https://doi.org/10.1029/2010JB007891
Ohno, I. (1995). Temperature variation of elastic properties of α-quartz up to the α-β transition. Journal of Physics of the Earth, 43(2), 157–169. https://doi.org/10.1007/s00269-005-0008-3
Oliver, W. C., & Pharr, G. M. (1992). An improved technique for determining hardness and elastic modulus using load and displacement sensing indentation experiments. Journal of Materials Research, 7(6), 1564–1583. https://doi.org/10.1557/JMR.1992.1564
Oliver, W. C., & Pharr, G. M. (2004). Measurement of hardness and elastic modulus by instrumented indentation: Advances in understand-ing and refinements to methodology. Journal of Materials Research, 19(1), 3–20. https://doi.org/10.1557/jmr.2004.19.1.3
Peng, Z., & Redfern, S. A. T. (2013). Mechanical properties of quartz at the α-β phase transition: Implications for tectonic and seismic anomalies. Geochemistry, Geophysics, Geosystems, 14(1), 18–28. https://doi.org/10.1029/2012GC004482
Regenauer-Lieb, K., & Yuen, D. A. (2006). Quartz rheology and short-time-scale crustal instabilities. Pure and Applied Geophysics, 163(9), 1915–1932. https://doi.org/10.1007/s00024-006-0104-4
Richter, B., Stünitz, H., & Heilbronner, R. (2018). The brittle-to-viscous transition in polycrystalline quartz: An experimental study. Journal of Structural Geology, 114, 1–21. https://doi.org/10.1016/j.jsg.2018.06.005
Sly, M. K., Thind, A. S., Mishra, R., Flores, K. M., & Skemer, P. (2020). Low-temperature rheology of calcite. Geophysical Journal Interna-tional, 221(1), 129–141. https://doi.org/10.1093/gji/ggz577
Stünitz, H., Thust, A., Heilbronner, R., Behrens, H., Kilian, R., Tarantola, A., & Fitz Gerald, J. D. (2017). Water redistribution in experimen-tally deformed natural milky quartz single crystals—Implications for H2O-weakening processes. Journal of Geophysical Research: Solid Earth, 122(2), 866–894. https://doi.org/10.1002/2016JB013533
Swamy, V., Saxena, S. K., Sundman, B., & Zhang, J. (1994). A thermodynamic assessment of silica phase diagram. Journal of Geophysical Research: Solid Earth, 99(B6), 787–794. https://doi.org/10.1029/93JB02968
Journal of Geophysical Research: Solid Earth
STROZEWSKI ET AL.
10.1029/2021JB022229
14 of 14
Thom, C. A., Carpick, R. W., & Goldsby, D. L. (2018). Constraints on the Physical mechanism of frictional aging from nanoindentation. Geophysical Research Letters, 1, 1–6. https://doi.org/10.1029/2018GL080561
Thom, C. A., Goldsby, D., Thom, C. A., & Goldsby, D. L. (2019). Nanoindentation studies of plasticity and dislocation creep in halite. Geo-sciences, 9(2), 79. https://doi.org/10.3390/geosciences9020079
Tokle, L., Hirth, G., & Behr, W. M. (2019). Flow laws and fabric transitions in wet quartzite. Earth and Planetary Science Letters, 505, 152–161. https://doi.org/10.1016/j.epsl.2018.10.017
Wheeler, J. M. (2021). Mechanical phase mapping of the Taza meteorite using correlated high-speed nanoindentation and EDX. Journal of Materials Research, 36(1), 94–104. https://doi.org/10.1557/s43578-020-00056-7
Top Related