


γλώσσες
Σελίδες
Νομικός

Ventilation of the Equatorial AtlanticP. BrandtR. J. Greatbatch, M. Claus, S.-H. Didwischus, J. HahnGEOMAR Helmholtz Centre for Ocean Research Kiel
1
2
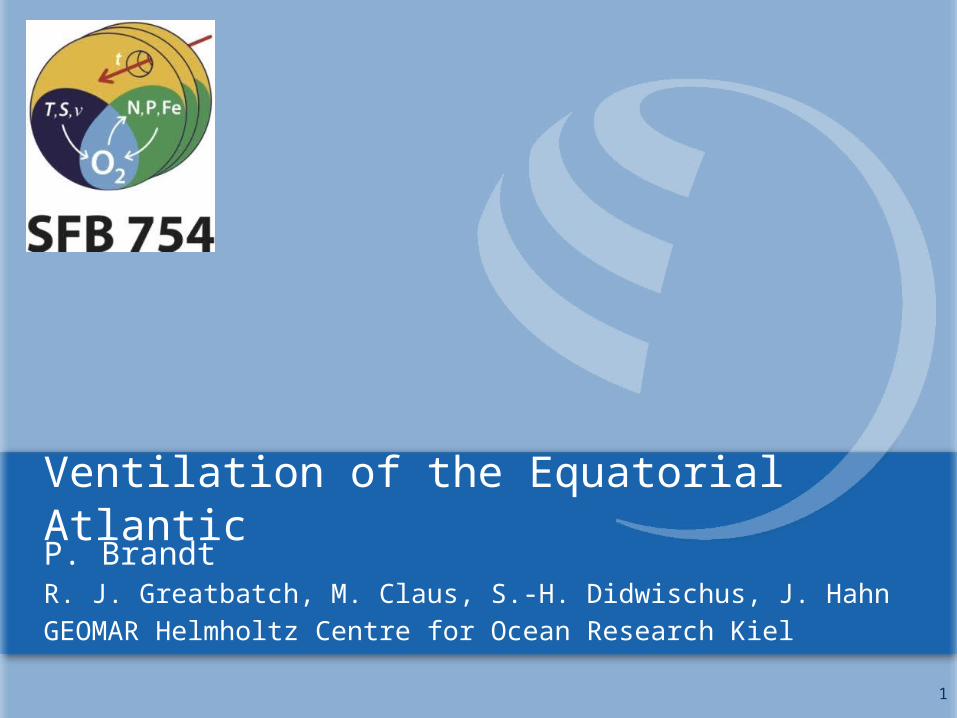
Global Model Simulations
Oschlies, pers. comm. 2013
Annual mean oxygen [μmol/kg] at 300m in observations (WOA) and different state-of-the-art global models
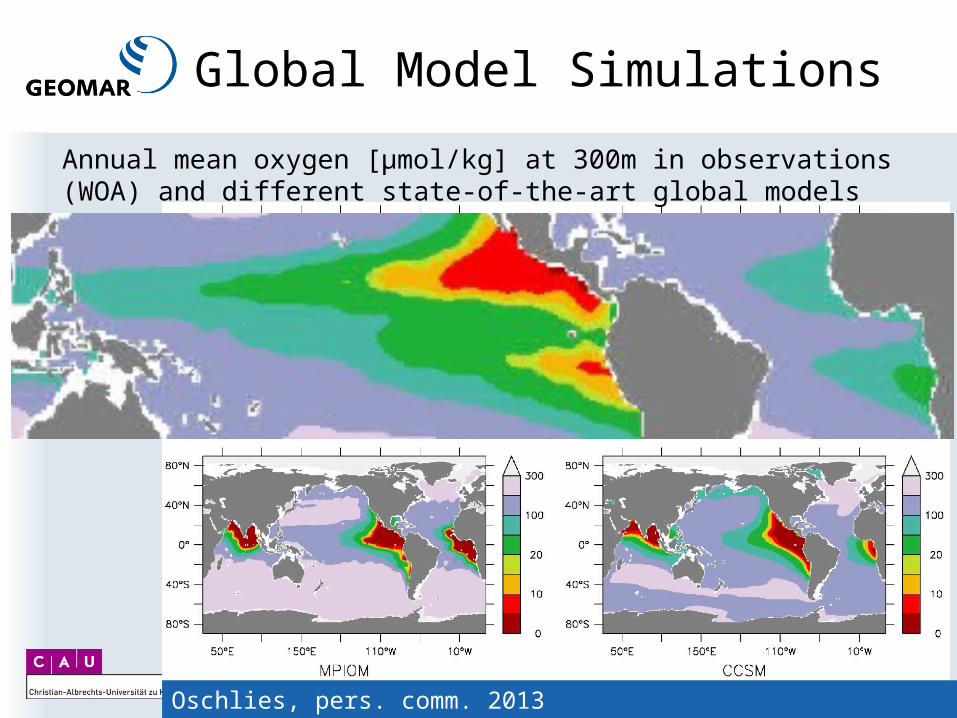
Atlantic Oxygen Distribution
Oxygen distribution at 600m depth as measured during the German Atlantic Meteor expedition 1925-27
Oxygen Minimum Zones (OMZ) in both hemispheres separated by an equatorial oxygen maximum
3Wattenberg 1939
Wyrtki (1962) concluded that the position and distribution of the oxygen minimum layer are determined by circulation
4
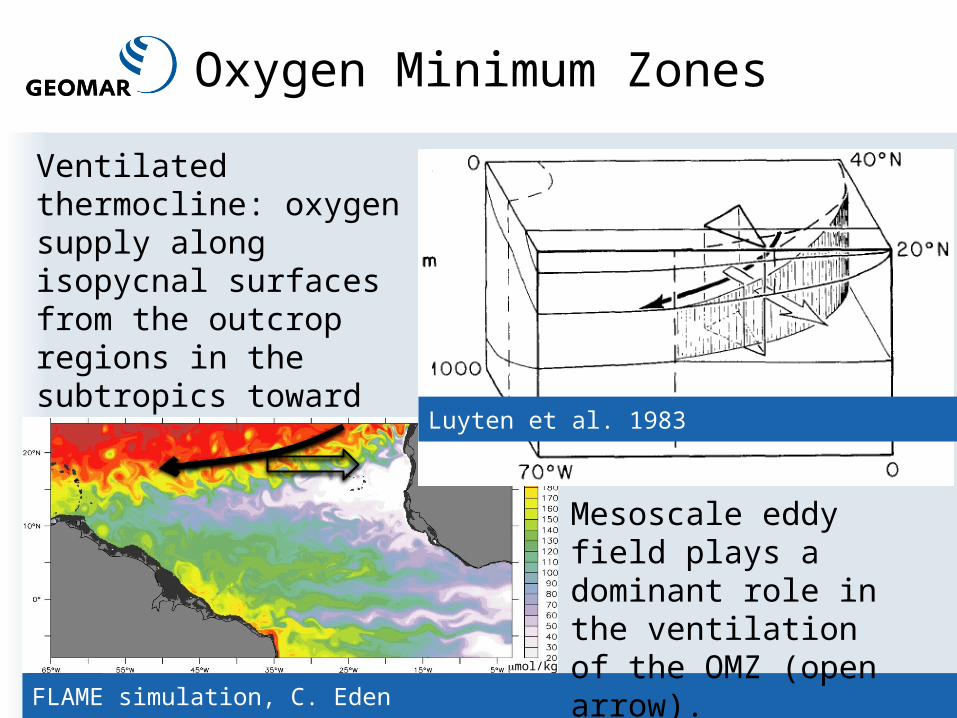
Oxygen Minimum Zones
Ventilated thermocline: oxygen supply along isopycnal surfaces from the outcrop regions in the subtropics toward the equator and the western boundary (solid arrow).
FLAME simulation, C. Eden
mmol/kg
Mesoscale eddy field plays a dominant role in the ventilation of the OMZ (open arrow).
Luyten et al. 1983
5
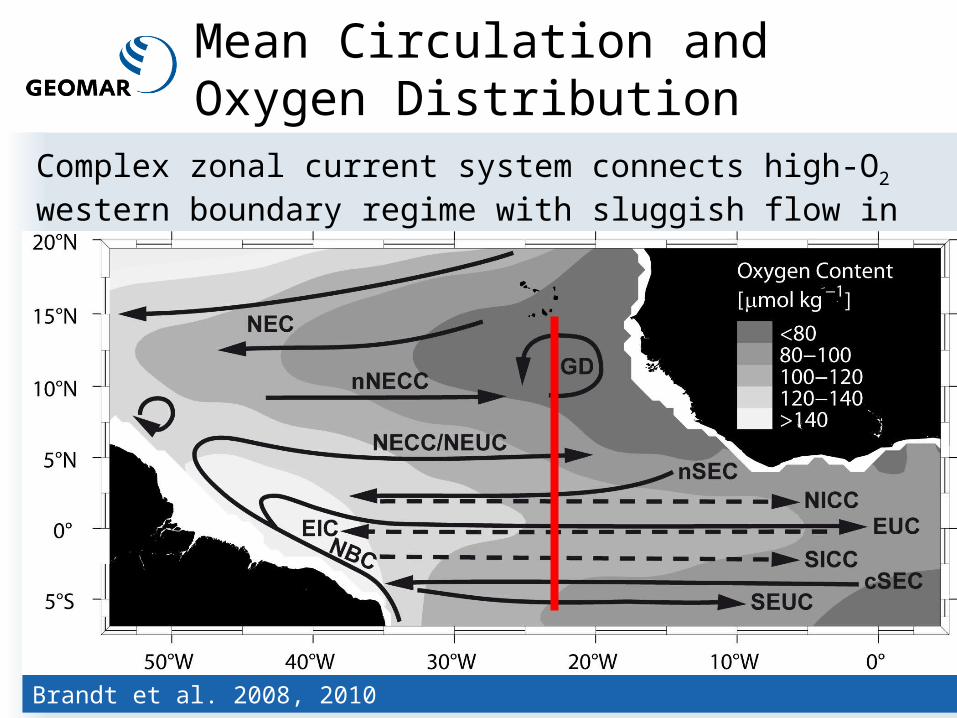
Mean Circulation and Oxygen Distribution
Complex zonal current system connects high-O2 western boundary regime with sluggish flow in the eastern basin.
Brandt et al. 2008, 2010
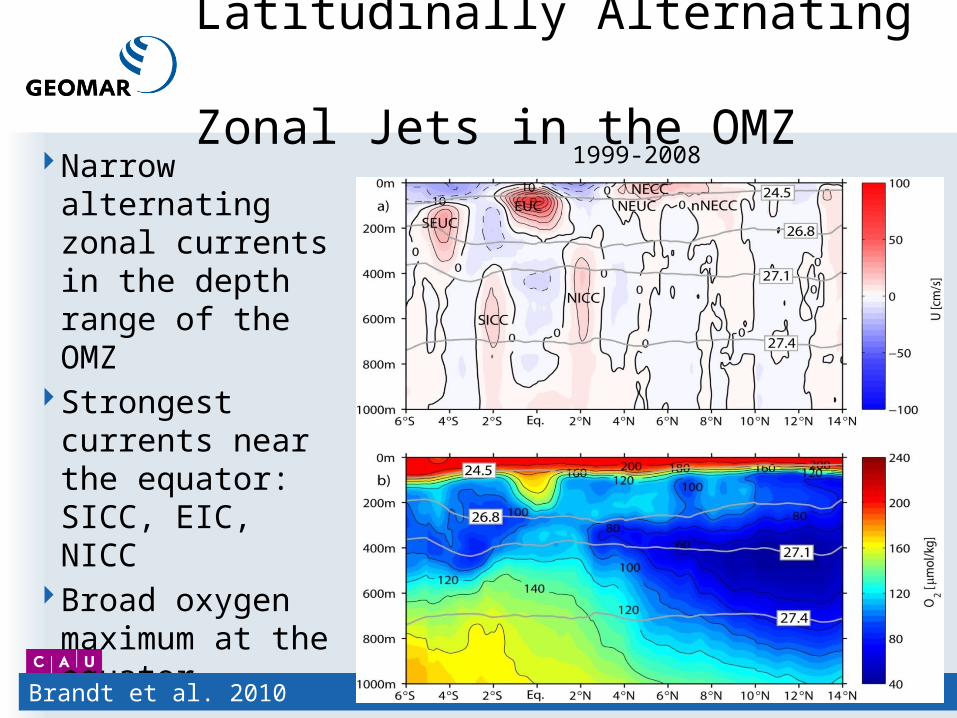
Latitudinally Alternating Zonal Jets in the OMZ
Narrow alternating zonal currents in the depth range of the OMZ
Strongest currents near the equator: SICC, EIC, NICC
Broad oxygen maximum at the equator
6
1999-2008
Brandt et al. 2010
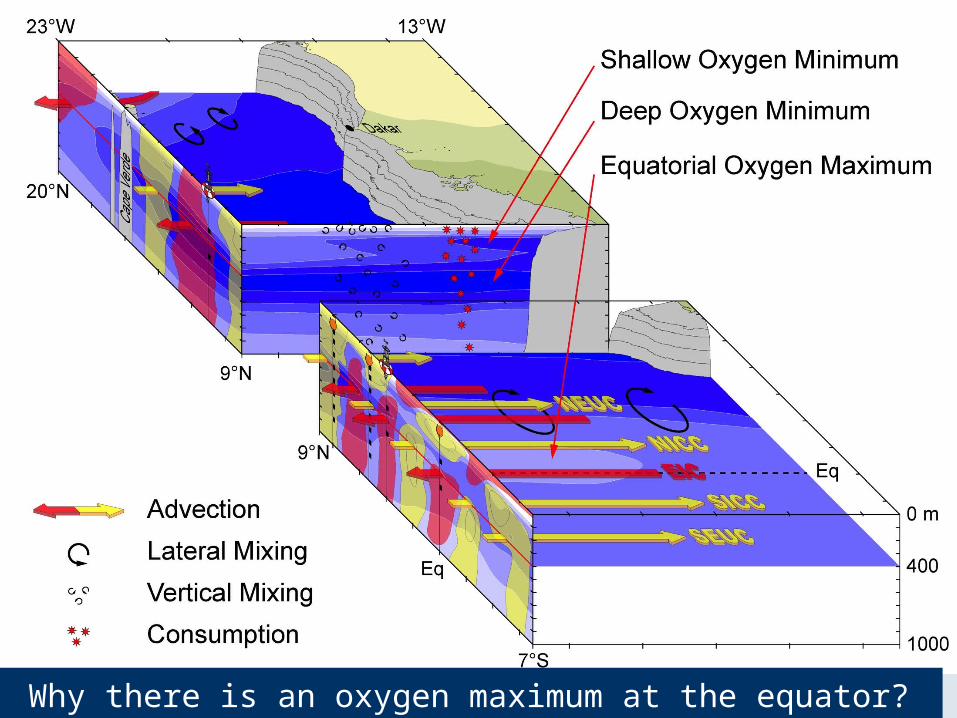
7Why there is an oxygen maximum at the equator?
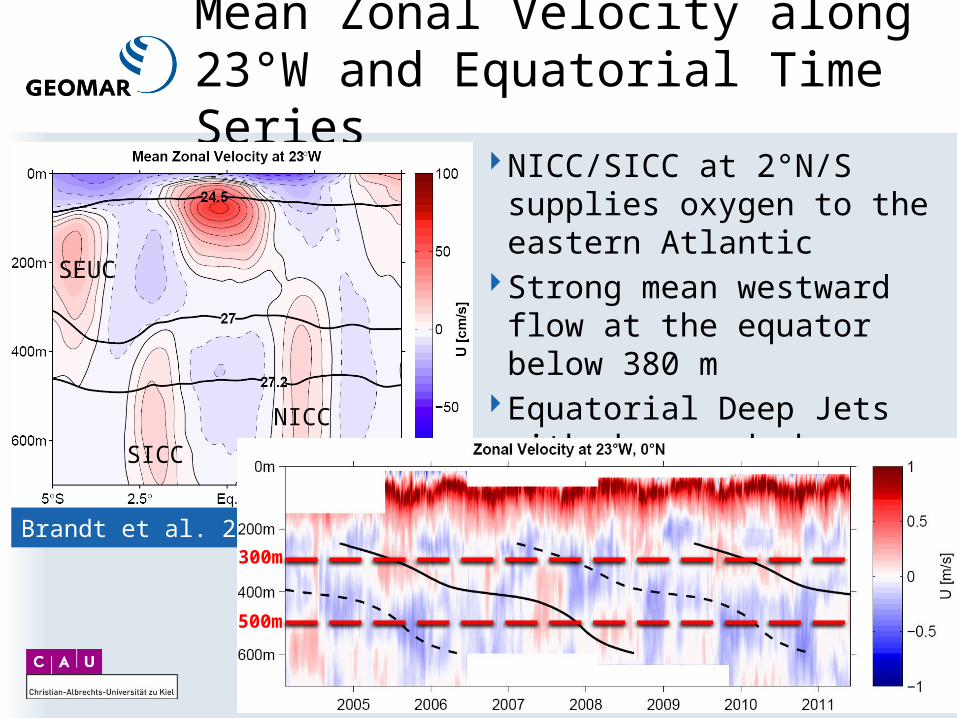
Mean Zonal Velocity along 23°W and Equatorial Time Series
NICC/SICC at 2°N/S supplies oxygen to the eastern Atlantic
Strong mean westward flow at the equator below 380 m
Equatorial Deep Jets with downward phase propagation
Brandt et al. 2012
SICC
NICC
SEUC
300m
500m
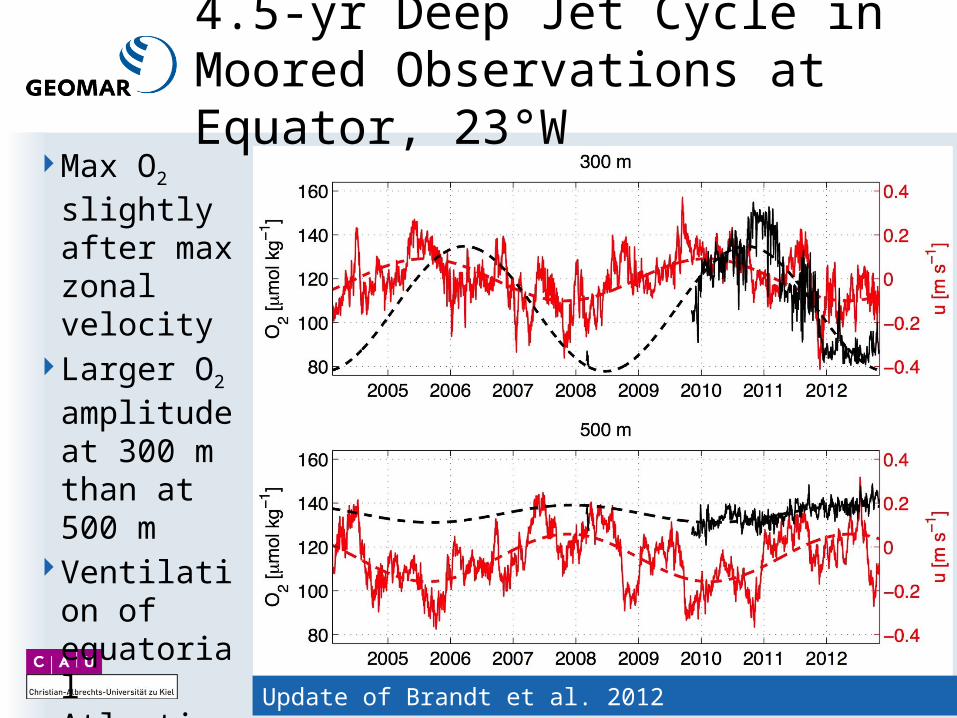
4.5-yr Deep Jet Cycle in Moored Observations at Equator, 23°W
Max O2 slightly after max zonal velocity
Larger O2 amplitude at 300 m than at 500 m
Ventilation of equatorial Atlantic by Deep Jets
9Update of Brandt et al. 2012
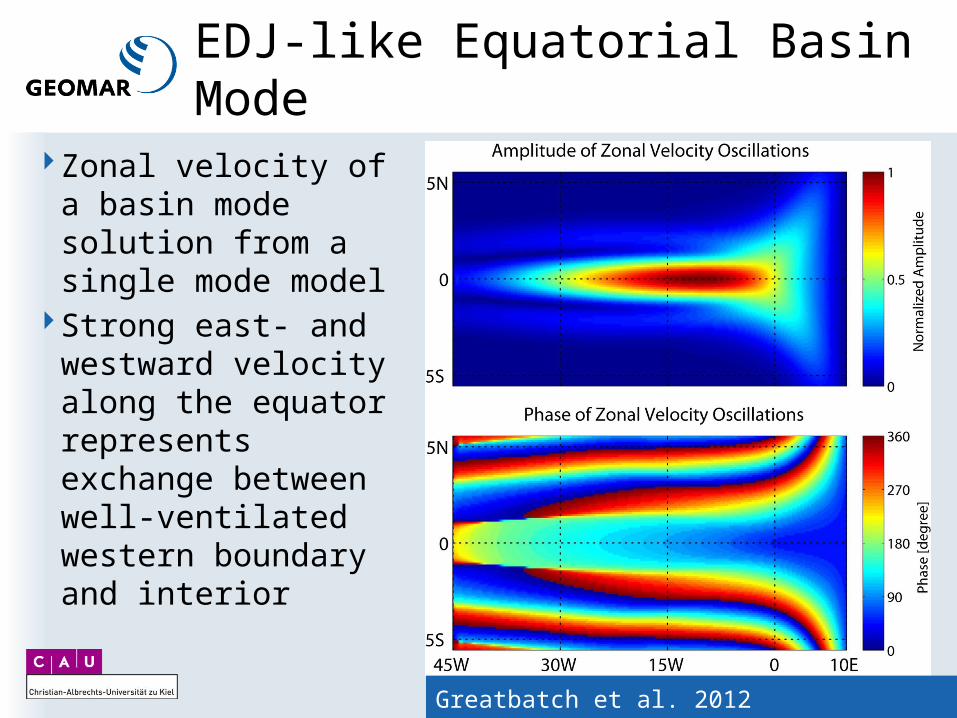
EDJ-like Equatorial Basin Mode
10Greatbatch et al. 2012
Zonal velocity of a basin mode solution from a single mode model
Strong east- and westward velocity along the equator represents exchange between well-ventilated western boundary and interior
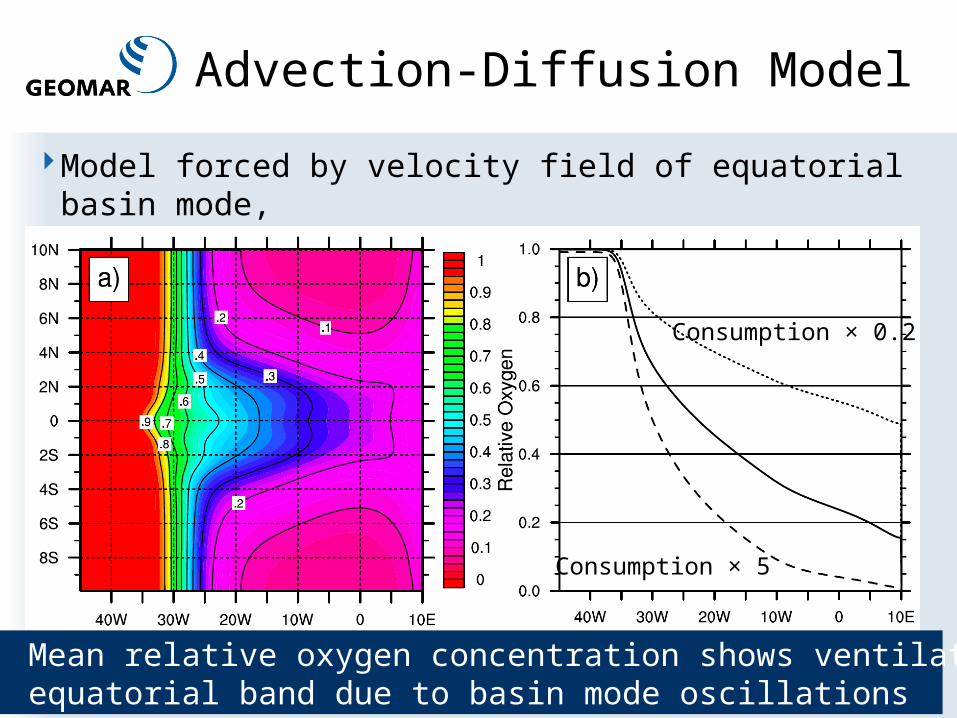
Advection-Diffusion Model
Model forced by velocity field of equatorial basin mode, O2 source at the western boundary layer; O2 consumption
11
Consumption × 0.2
Consumption × 5
Mean relative oxygen concentration shows ventilation of the equatorial band due to basin mode oscillations
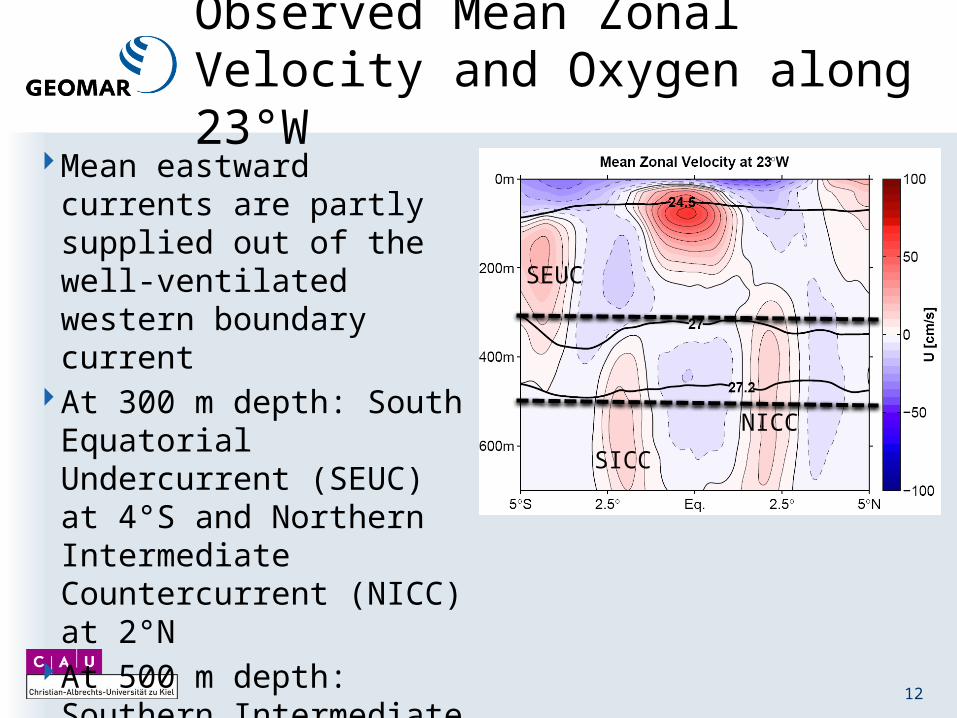
Observed Mean Zonal Velocity and Oxygen along 23°W
Mean eastward currents are partly supplied out of the well-ventilated western boundary current
At 300 m depth: South Equatorial Undercurrent (SEUC) at 4°S and Northern Intermediate Countercurrent (NICC) at 2°N
At 500 m depth: Southern Intermediate Countercurrent (SICC) at 2°S and NICC
12
SICC
NICC
SEUC
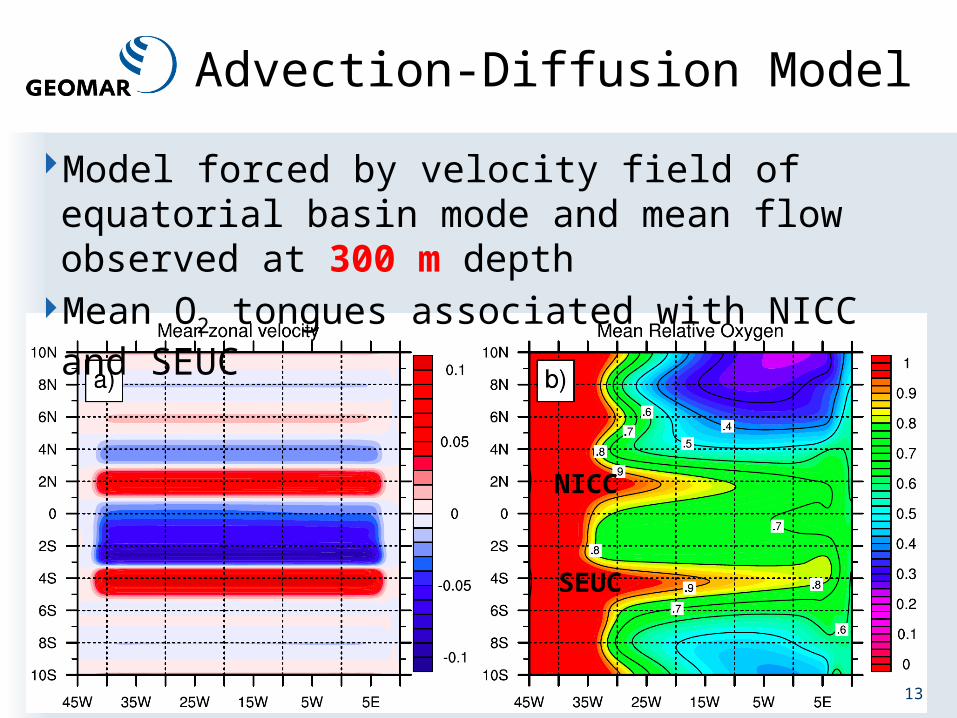
Advection-Diffusion Model
13
Model forced by velocity field of equatorial basin mode and mean flow observed at 300 m depth
Mean O2 tongues associated with NICC and SEUC
NICC
SEUC
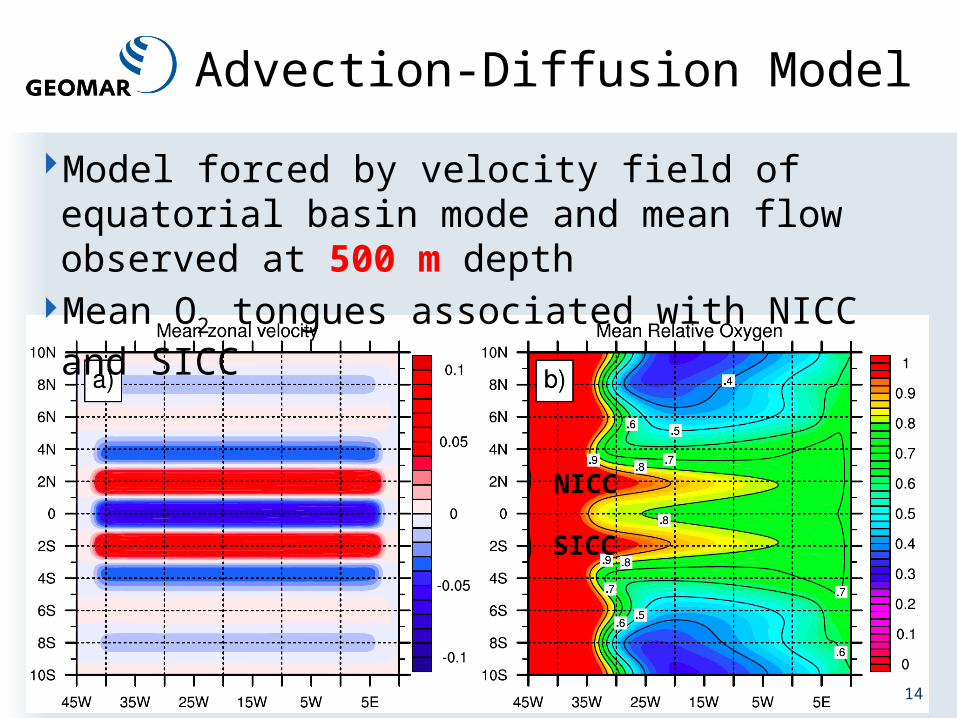
Advection-Diffusion Model
14
Model forced by velocity field of equatorial basin mode and mean flow observed at 500 m depth
Mean O2 tongues associated with NICC and SICC
NICC
SICC
15
Summary
Global models do not correctly capture location and distribution of low-oxygen layer in the tropicsOne obvious reason is the too weak mean and variable intermediate circulation in these simulationsObservations show equatorial oxygen maximum and strong poleward oxygen fluxes toward the OMZs that can be reproduced by idealized simulations with an advection-diffusion modelSimple parameterizations like e.g. extremely increased zonal diffusivities near the equator might help to improve tropical oxygen distribution in global simulations
Acknowledgements
This study was supported by the German Science Foundation (DFG) as part of the Sonderforschungsbereich 754 “Climate-Biogeochemistry Interactions in the Tropical Ocean” and by the German Federal Ministry of Education and Research as part of the co-operative projects “NORDATLANTIK” and “RACE”.
Moored velocity observations were acquired in cooperation with the PIRATA project.
16
Top Related