


γλώσσες
Σελίδες
Νομικός

ENG470-Engineering Honours Thesis
Thesis submitted to the School of Engineering and Information Technology, Murdoch
University, to fulfil the requirements for the degree of Chemical and Metallurgical
Engineering Honours.
The leaching of α-spodumene
Written by: Bryce Martin Albertani
Unit Coordinator(s): Dr Gareth Lee, Professor Parisa Arabzadeh Bahri
Thesis Supervisor: Assoc. Prof. Aleksandar Nikoloski
Co-Supervisor: Dr. Rorie Gilligan

ii
This page was intentionally left blank

iii
Author’s Declaration
I declare that this thesis is my own account of my research and contains as its main content
work which has not previously been submitted for a degree at any tertiary education
institution.
_____________________________________
Bryce Martin Albertani
iv
Acknowledgements
I would like to express my deepest gratitude to my supervisors in Associate Professor
Alexander Nikoloski and Dr Rorie Gilligan for their continuous support and guidance
throughout this project. Their encouragement and willingness to help has enabled me to
learn and develop throughout the entirety of my undergraduate studies. Thank you so much.
I would like to take this opportunity to thanks ALS Metallurgy for providing me the assays
results and knowledge to formulate a thesis of which I am proud of. I would particularly like
to thank Mr Matthew Ameron and Mr Simon Bagas as it was they who enabled this to
happen.
I would also like to thanks Mrs Nasim Khoshdel for her amazing support thought out this
project. Without your knowledge and support I would not have had this wonderful
opportunity, nor had the amazing year I had. Thankyou.
To my friends all I can do is say thank you. Your support, kindness and caring mean the
world to me. I would like to shout out to Mitch, Lia, Chris, Sadie, Brett and Nic for the
constant support throughout my studies, you guys are the best. I would like to give special
thanks to Chris Buhlmann for the constant supply of coffee and support. You are the best!
Lastly to my family, for their love and support throughout my whole life, thank you.
v
Abstract
An investigation into the direct leaching of α-spodumene has being warranted due to
increasing societal interest in lithium-ion battery technology. The direct leaching of α-
spodumene utilising a caustic autoclave process was investigated, in aspirations of leaching
significant quantities of lithium from the silicate matrix of α-spodumene. The influence of
reagent dosage, temperature, reaction time and particle size on the extraction efficiency of
lithium were investigated. From the investigations conducted it became evident that the
leaching efficiency of α-spodumene was consistently greater than 40.00% under the optimal
conditions. The optimal conditions evaluated throughout the investigation were found to
occur at 573.15 kelvin, 14 molar NaOH, a 6 hour residence time and a P80 of 325 µm.
The lithium recovered to solution is present as a hydroxide species, of which is in significant
demand within the lithium-ion battery production industry. Sodium silicate or ‘water glass’
was also found to be present within the leach products adding a potential valuable by-product
to the process investigated.
vi
Table of Contents Author’s Declaration ........................................................................................................... iii
Acknowledgements .............................................................................................................. iv
Abstract .................................................................................................................................. v
List of Figures .................................................................................................................... viii
List of Tables ......................................................................................................................... x
1. Introduction .................................................................................................................... 1
1.1 Research aim and objectives ................................................................................... 1
2. Literature review ............................................................................................................ 2
2.1 Introduction ............................................................................................................. 2
2.2 Mineralogical aspects of lithium ............................................................................. 3
2.2.1 Geological overview of spodumene ................................................................ 4
2.2.1 Crystal chemistry of spodumene ..................................................................... 6
2.3 Processing of spodumene ........................................................................................ 9
2.3.1 Sulfation process ........................................................................................... 10
2.3.2 Alkaline process ............................................................................................ 12
2.3.3 Chlorination process ...................................................................................... 14
2.3.4 Fluorination process ...................................................................................... 16
2.4 Downstream processing of lithium ....................................................................... 19
2.4.1 Electro refining for the production of lithium metal ..................................... 20
2.4.2 Thermochemical reduction of lithium compounds ........................................ 23
2.4.3 The direct electrolysis of lithium carbonate to produce lithium metal .......... 25
2.4.4 Lithium ion batteries ...................................................................................... 27
2.5 Technological advances in lithium extraction from spodumene .......................... 30
2.5.1 High pressure leaching .................................................................................. 30
2.5.2 Lithium Australia’s SiLeach® ....................................................................... 33
2.6 Summary and concluding remarks ....................................................................... 35
3. Experimental summary ................................................................................................ 36
3.1 Experimental material ........................................................................................... 37
3.1.1 Ore characterisation ....................................................................................... 37
3.1.2 Reagents ........................................................................................................ 39
3.2 Equipment ............................................................................................................. 41
3.2.1 Autoclave ....................................................................................................... 41
3.3 Test work methodology ........................................................................................ 42
3.3.1 Sample preparation ........................................................................................ 42
vii
3.3.2 Leaching methodology .................................................................................. 43
3.4 Analytical analysis techniques .............................................................................. 44
3.4.1 Elemental assays ............................................................................................ 44
3.4.2 X-ray diffraction analysis .............................................................................. 44
3.4.3 Scanning electron microscopy ....................................................................... 45
4. Results .......................................................................................................................... 46
4.1 Leaching of α-spodumene ..................................................................................... 47
4.1.1 Effect of reagent dosage ................................................................................ 47
4.1.2 Effect of temperature ..................................................................................... 49
4.1.3 Effect of residence time ................................................................................. 51
4.1.4 Effect of particle size ..................................................................................... 53
4.2 Analysis of leach residue ...................................................................................... 56
4.2.1 X-ray diffraction analysis .............................................................................. 56
4.2.2 Scanning electron microscope ....................................................................... 64
5. General discussion........................................................................................................ 66
5.1 Leaching of α-spodumene ..................................................................................... 66
5.2 Geo-polymorphs of silica ...................................................................................... 67
6. Conclusion and recommendations ............................................................................... 69
References ........................................................................................................................... 70
Appendices .......................................................................................................................... 74
Appendix A - Literature review ....................................................................................... 74
Appendix A1 - Relevant tables .................................................................................... 74
Appendix A2 - Relevent figures................................................................................... 78
Appendix A3 - Lithium ion batteries ........................................................................... 80
Appendix B - Supporting experimental material ............................................................. 82
Appendix B1 - Supporting equipment ......................................................................... 82
Appendix B2 - Supporting results section.................................................................... 89
Appendix B3 - Supporting calculations ..................................................................... 100
Appendix B4 - Supporting grind establishment data ................................................. 103
Appendix B5 - Pictures .............................................................................................. 105
viii
List of Figures Figure 1: Global lithium demand for end uses in 2011 ......................................................... 2
Figure 2: Locations of lithium deposits worldwide ............................................................... 3
Figure 3: Mineralogical zonation of the Greenbushes Pegmatite ......................................... 6
Figure 4: Crystal structure of α-Spodumene and β-Spodumene ........................................... 8
Figure 5: Ellingham diagram for the phase transformation of α to β-Spodumene .............. 10
Figure 6: Eh-p.H diagram for the Li-S-H2O system at 298.15 K ....................................... 11
Figure 7: Eh- pH diagram for a Li-C-H2O system at 298.15 K .......................................... 13
Figure 8: Equilibrium composition of the system Si-Al-Li-O-Cl ....................................... 15
Figure 9: Eh-pH diagram for a Li-Cl-H2O system at 298.15 K .......................................... 16
Figure 10: Eh-pH diagram for a Li-F-H2O system at 298.15 K .......................................... 17
Figure 11: Types of lithium resources, reserves, products and applications ....................... 19
Figure 12: Electrowinning cell utilised for the production of metallic lithium ................... 21
Figure 13: Standard decomposition potential vs temperature of Li refining ...................... 22
Figure 14: Partial pressures of O2 vs H2 and corresponding lithium stability diagram, ...... 22
Figure 15: Electrolytic cell setup......................................................................................... 26
Figure 16: A summation schematic of Lithium Australia’s SiLeach® ............................... 34
Figure 17: Project’s test work flowsheet . ........................................................................... 36
Figure 18: XRD analysis on the spodumene concentrate utilised throughout this project.. 39
Figure 19: Particle size analysis conducted ........................................................................ 39
Figure 20: Depiction of the nucleophilic dissolution mechanism for quartz in water ....... 40
Figure 21: NaOH dosage vs lithium extraction ................................................................... 48
Figure 22: NaOH dosage vs silicon dissolution .................................................................. 48
Figure 23: NaOH dosage vs sodium substitution ................................................................ 49
Figure 24: Temperature vs lithium extraction ..................................................................... 50
Figure 25: Temperature vs silicon dissolution .................................................................... 50
Figure 26: Temperature vs sodium substitution .................................................................. 51
Figure 27: Residence time vs lithium extraction ................................................................. 52
Figure 28: Residence time vs silicon dissolution ................................................................ 53
Figure 29: Residence time vs sodium substitution .............................................................. 53
Figure 30: Particle size vs lithium extraction ...................................................................... 54
Figure 31: Particle size vs silicon dissolution ..................................................................... 54
Figure 32: Particle size vs sodium substitution ................................................................... 55
Figure 33: XRD analysis on the 8M, 12M and 14M leach residues .................................. 60
ix
Figure 34: XRD analysis on the 533.15 K, 553.15K and 573.15K leach residues ............. 61
Figure 35: XRD analysis on the 1, 3 and 6 hour leach residues .......................................... 62
Figure 36: XRD analysis on the leach residues for the 32, 106 and 325µm material ......... 63
Figure 37: SEM image of the 325µm spodumene concentrate ........................................... 64
Figure 38: SEM image of the specified leach residue ......................................................... 65
Figure 39: SEM image of the specified leach pit at point A in Figure 29 .......................... 65
Figure 40: Feed vs residue comparison ............................................................................... 67
Figure 41: Image of the washate from test 3 ....................................................................... 68
Figure 43: Arrhenius plot for the chlorination of β-Spodumen ........................................... 78
Figure 44: Eh-pH diagram of Li-S-H2O system at 1373.15 K ............................................ 78
Figure 45: Eh-pH diagram of Li-C-H2O system at 1373.15 K ............................................ 79
Figure 46: Eh-pH diagram for a Li-Cl-H2O system at 1023.15 K ...................................... 79
Figure 47: eH-pH diagram for a Li-Cl-H2O system at 1373.15 K ...................................... 80
Figure 48: Schematic of a battery displaying the flow of ions ............................................ 81
Figure 49: Parr instruments 4523 general purpose reactor system ...................................... 82
Figure 50: TPS’s WP-80 pH- MV- Temperature meter. ..................................................... 83
Figure 51: Ionode’s IH-40C pH probe ............................................................................... 83
Figure 52: Feed vs residue comparison ............................................................................. 98
Figure 53: Laser sizing curve displaying the P80 is 106µm ............................................... 103
Figure 54: Laser sizing curve displaying the P80 is 32µm ................................................. 104
Figure 55: Picture captured of test 3’s wash solution ........................................................ 105
Figure 56: Picture of test 3’s filtrate once dried ................................................................ 106
Figure 57: Leach residue for test 3 .................................................................................... 107
x
List of Tables
Table 1: Mineralogical characteristics of Spodumene .......................................................... 7
Table 2: Elemental assay results for the spodumene concentrate ...................................... 38
Table 3: Summary table of the leaching variables investigated and their respective lithium
extraction and accountability ............................................................................................... 46
Table 4: Assay results on the grab samples conducted ....................................................... 68
Table 5: Lithium based minerals structural formulae and theoretical lithium contents. ..... 74
Table 6: Reported methods and their experimental profiles for the extraction of lithium
from β-spodumene. .............................................................................................................. 75
Table 7: Thermodynamic data of spodumene, and lithium products at STP conditions. .... 76
Table 8: Solubility of lithium products at variating temperatures . ................................... 77
Table 9: Product specifications of TPS’s IH-40C probe. .................................................... 83
Table 10: Summary table of the leaching variables investigated and their respective lithium
extraction, silicon dissolution and sodium reformation with corresponding accountabilities
............................................................................................................................................. 90
Table 11: Summary table of relevant operating variables and measured pH, specific gravity
and feed moistures. .............................................................................................................. 91
Table 12:ICP-MS results conducted on the feed material in this project ............................ 92
Table 13: Analysis and balance on test 1- 8M NaOH leach conducted .............................. 93
Table 14: Analysis and balance on test 2- 12M NaOH leach conducted ............................ 93
Table 15:Analysis and balance on test 3- 14M NaOH leach conducted ............................. 94
Table 16: Analysis and balance on test 4- 533.15 K leach conducted ................................ 94
Table 17: Analysis and balance on test 5- 553.15 K leach conducted ................................ 95
Table 18: Analysis and balance on test 6- 1hour residence time leach conducted .............. 95
Table 19: Analysis and balance on test 7- 6 hour residence time leach conducted ............. 96
Table 20: Analysis and balance on test 8- 32 µm P80 leach conducted ............................... 96
Table 21: Analysis and balance on test 9- 106 µm P80 leach conducted ............................ 97
Table 22: Analysis and balance on test 10- CO2 leach conducted ...................................... 97
Table 23: ICP MS results for test 3’s grab sample .............................................................. 99
Table 24: Grind establishing conducted on spodumene concentrate to achieve P80 of
106µm ................................................................................................................................ 103
Table 25: Grind establishment conducted on spodumene concentrate to achieve P80 of 32
µm ...................................................................................................................................... 104
1
1. Introduction The societal push towards renewable technologies has resulted in a rapid expansion of the
lithium-ion battery (LIB) industry (Vikström et al. 2013). As the name suggests lithium is a
fundamental component of LIB’s and hence the processing and refining of lithium
compounds has attracted lots of attention in recent years.
Spodumene (LiAlSi2O6) naturally exists as an insoluble alumino-silicate with a significant
theoretical lithium contents of 8.03% (Brown 2016). The relatively high abundance of
spodumene compared to other hard rock sources has seen it become the dominant
mineralogical source of lithium worldwide. Current extraction techniques utilised in the
processing of spodumene utilise a series of calcination, roasting and consequential water
leach systems to efficiently recovery economical quantities of lithium (Meshram et al. 2014).
Due to the intrinsic drawbacks associated with these processing methods, investigations into
simplifying and reducing the constraints associated with the processing of spodumene is a
subject worthy of detailed investigation.
Lithium hydroxide (LiOH) has been identified as a key material in the production of LIB’s
cathodic and electrolytic components (Gains et al. 2011). The current world market for
refined lithium compounds is dominated by the production of lithium carbonate (Li2CO3).
Current technologies enable lithium carbonate to be readily converted to lithium hydroxide,
however investigations into the direct production of lithium hydroxide are warranted in
aspirations of creating a simplified and environmentally friendly process.
1.1 Research aim and objectives The aim of this research project was to study the direct leaching of α-spodumene in different
alkaline media by addressing the following research objectives:
1. Investigate and quantify the influence of key process parameters on the leaching
system including the following:
i. The effect of reagent dosage
ii. The effect of residence time
iii. The effect of particle size
iv. The effect of temperature.
2. Analyse and interpret the collected results and propose directions for further
research.
2
2. Literature review
2.1 Introduction
The increasing demand for the production of lithium has been on the rise since the
introduction of the lithium-ion battery. The global desire to reduce carbon emissions by
embracing renewable technologies is driving society towards the development of electronic
vehicles and enhanced energy storage devices. Lithium has been identified as a source of
interest due to its significant energy density and high electrochemical potential (3.045 V)
(Meshram et al. 2014). The Deutsche Bank estimated the global consumption of Lithium
Carbonate Equivalent will increase from 181 kilo tonnes in 2015 to 535 kilo tonnes by 2025,
due to the expected expansion of the LIB industry (Hocking et al. 2016). Lithium is the
critical element within the chemistry of lithium ion batteries, hence the demand appears
certain. Major applications of lithium are present in the aeronautical and ceramic industries,
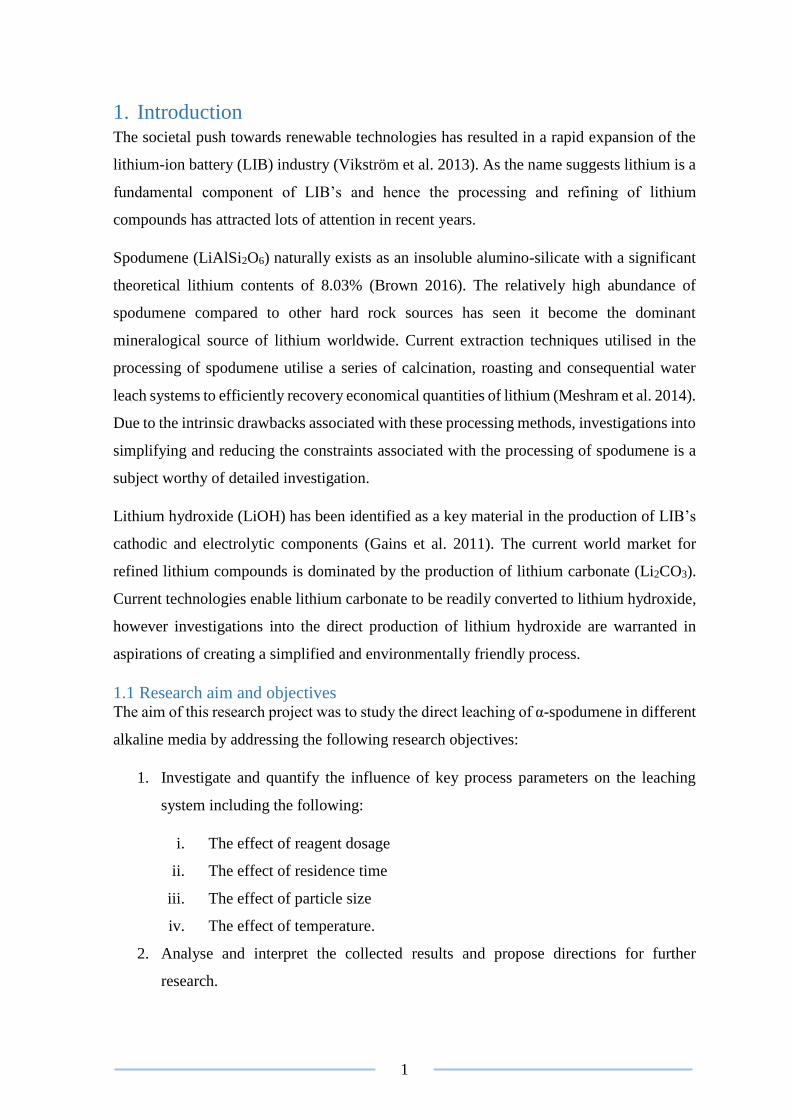
of which further encouraging lithium’s growing demand (Wanhill 2014) (Figure 1). By 2025
the Association of Mining and Exploration Companies (AMEC) estimate the net worth of
the lithium resource sector to be in excess of $ 2 trillion dollars (USD), with the LIB industry
holding a primary stake over the market (AMEC 2018).
Figure 1: Global lithium demand for end uses in 2011, adopted from Jaskula (2017)
In order to satisfy the growing demand for lithium, investigations into alternative sources
and refined processing techniques are warranted. Spodumene is a hard rock mineralogical
source of lithium that has attracted significant amounts of attention in recent years, due to
its relatively high grade (Meshram et al. 2014). Current commercial extraction techniques
often require sophisticated and energy intense processes in order to produce marketable
3
quantities of lithium from spodumene ore (Meshram et al. 2014, Choubey et al. 2016). In
order to understand the benefits and constraints of the current spodumene market, a literature
review has been conducted. The literature review developed a baseline of knowledge,
directed towards understanding the global supply of spodumene as well as understanding
the various extraction techniques currently utilised in the production of saleable lithium
products. The downstream processing that is utilised in the production of metallic lithium
and lithium ion batteries was also assessed. This was conducted in an attempt to understand
key attributes of lithium products, and is used to identify points of potential improvement in
the earlier extraction phases. From the analysis conducted relevant technological advances
are discussed and areas of potential improvement were identified in a concluding summary.
2.2 Mineralogical aspects of lithium
Lithium exists in various natural resources such as clays, salt lakes, brine reserves and hard
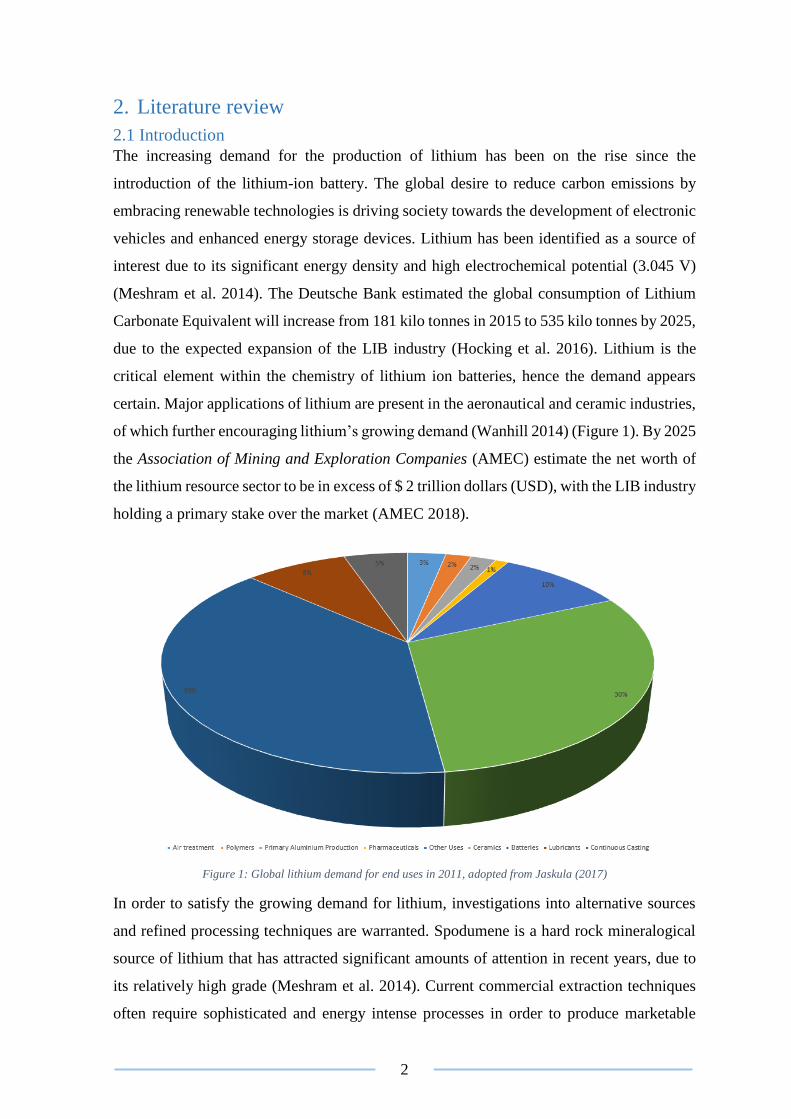
rock minerals. The worlds current primary source of lithium exist as salt brines, of which
are geographically concentrated in South America (Grosjean et al. 2012) (Figure 2). When
assessing the geographical distribution of lithium deposits, Grosjean et al highlighted how
existing brine deposits are “geo-strategically and geo-economically” restricted. The
constraints associated with the brine deposits limit the amount of lithium that these sources
can produce, encouraging investigation into alternative sources such as spodumene.
Figure 2: Locations of lithium deposits worldwide, adopted from (Brown 2016)
4
2.2.1 Geological overview of spodumene
Spodumene (LiAlSi2O6 or Li2O.Al2O3.(SiO2)4) is the primary hard rock mineralogical
source of lithium worldwide (Brown 2016). This is due to spodumene having a high
theoretical lithium content (8.03% Li2O) in comparison to other lithium bearing minerals
such as lepidolite (3.58%), zinnwaldite (1.59%) and amblygonite (3.44%) (Table 5). The
mineralogical characteristics of spodumene has been associated with the pegmatite
mineralogical family. London (2014) identified these mineralogical characteristics and
categorised spodumene as being an igneous rock formation of granitic composition. London
concluded that the extremely coarse and variable grain-size with the abundance of crystal
growth allowed for spodumene to be distinguished from other igneous ores. Spodumene is
often associated with gangue minerals such as quartz and feldspar (Zelikman et al. 1996).
As often associated with such deposits, the highly siliceous composition of spodumene
indicates that it derives from a felsic igneous origin (Brown 2016, University of Minnesota
2010).
The formation of pegmatitic deposits occur under high temperature and pressure, where the
slow cooling of magmatic fluids provides optimal conditions for silicate formation
(University of Minnesota). Spodumene is understood to form as intrusive veins under 250-
300 MPa and 438-538 K in pegmatitic deposits, coring itself towards the interior of the
silicate vein, where the thermal diffusivity of the magmatic material is slowest (London
2014). Ferrous (Fe2+) and manganese (Mn) material can be substituted into the formation of
spodumene, resulting in impurities in the crystal lattice structure (Souza et al. 2004). The
presence of these impurities are one of the reasons why various existing lithium deposits are
not economically viable to recover, with few containing a significant lithium content able to
produce economical amounts of lithium product. One of the few economically viable
pegmatite’s discovered is the Greenbushes deposit owned by Talison Lithium Pty Ltd
(Talison Pty Ltd 2018).
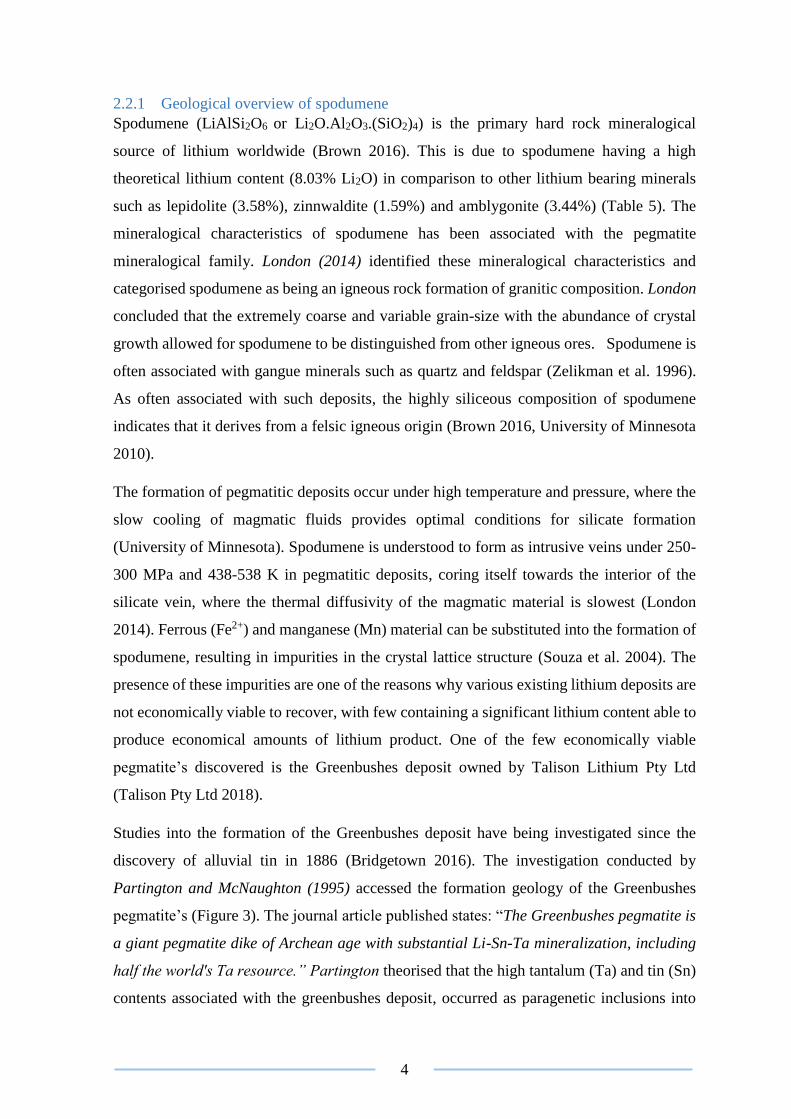
Studies into the formation of the Greenbushes deposit have being investigated since the
discovery of alluvial tin in 1886 (Bridgetown 2016). The investigation conducted by
Partington and McNaughton (1995) accessed the formation geology of the Greenbushes
pegmatite’s (Figure 3). The journal article published states: “The Greenbushes pegmatite is
a giant pegmatite dike of Archean age with substantial Li-Sn-Ta mineralization, including
half the world's Ta resource.” Partington theorised that the high tantalum (Ta) and tin (Sn)
contents associated with the greenbushes deposit, occurred as paragenetic inclusions into
5
the pegmatite ore during early formation. Research conducted by Thomas and Davidson
(2016) further suggests that pegmatite mineralisation occurs at 1023 K and 500 MPa.
Thomas and Davidson also identified that when pegmatite is cooled to 893 K Ta/Sn
mineralisation occurs simultaneously within the pegmatitic material, allowing for the
intrusion of magmatic material to occur prior to spodumene crystallisation. Zircon (ZrSiO4)
growth has been associated with Ta/Sn mineralisation, allowing for isotropic age dating to
be conducted for greater formation assessments (Wang et al. 2007, Partington and
McNaughton 1995).
A recent report conducted by Ingham et al. (2011) was released to the Toronto Stock
Exchange (TSX) in June of 2011, regarding the current regional geology of the Greenbushes
deposit. The report surmised by the British Geological Survey (Brown 2016) states that the
“pegmatite orebody is approximately five kilometres in length and three hundred meters in
width. It lies within the Donnybrook-Bridgetown Shear Zone and intrudes rocks of the
Balingup Metamorphic Belt in the south of the Yilgarn Craton.” It is understood that
deposits located within this region are often obscured by tertiary sediments and laterites at
depths up to forty meters (Partington and McNaughton 1995). This provides unique
challenges when mining such deposits, often having to be classified into distinct groups to
undergo economically viable processing (Ingham et al. 2011). The distinct groups of
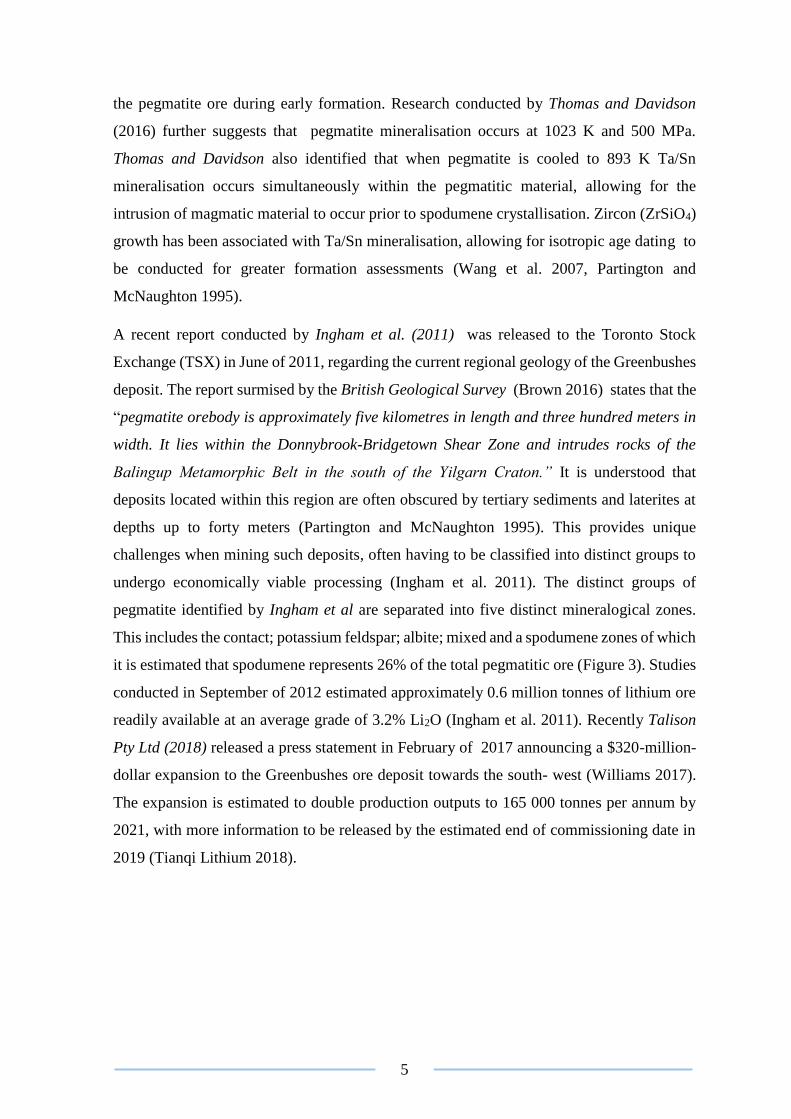
pegmatite identified by Ingham et al are separated into five distinct mineralogical zones.
This includes the contact; potassium feldspar; albite; mixed and a spodumene zones of which
it is estimated that spodumene represents 26% of the total pegmatitic ore (Figure 3). Studies
conducted in September of 2012 estimated approximately 0.6 million tonnes of lithium ore
readily available at an average grade of 3.2% Li2O (Ingham et al. 2011). Recently Talison
Pty Ltd (2018) released a press statement in February of 2017 announcing a $320-million-
dollar expansion to the Greenbushes ore deposit towards the south- west (Williams 2017).
The expansion is estimated to double production outputs to 165 000 tonnes per annum by
2021, with more information to be released by the estimated end of commissioning date in
2019 (Tianqi Lithium 2018).
6
Figure 3: Greenbushes pegmatite (A) with (B) displaying the mineralogical zonation of the region, adopted from
Partington and McNaughton (1995)
2.2.1 Crystal chemistry of spodumene
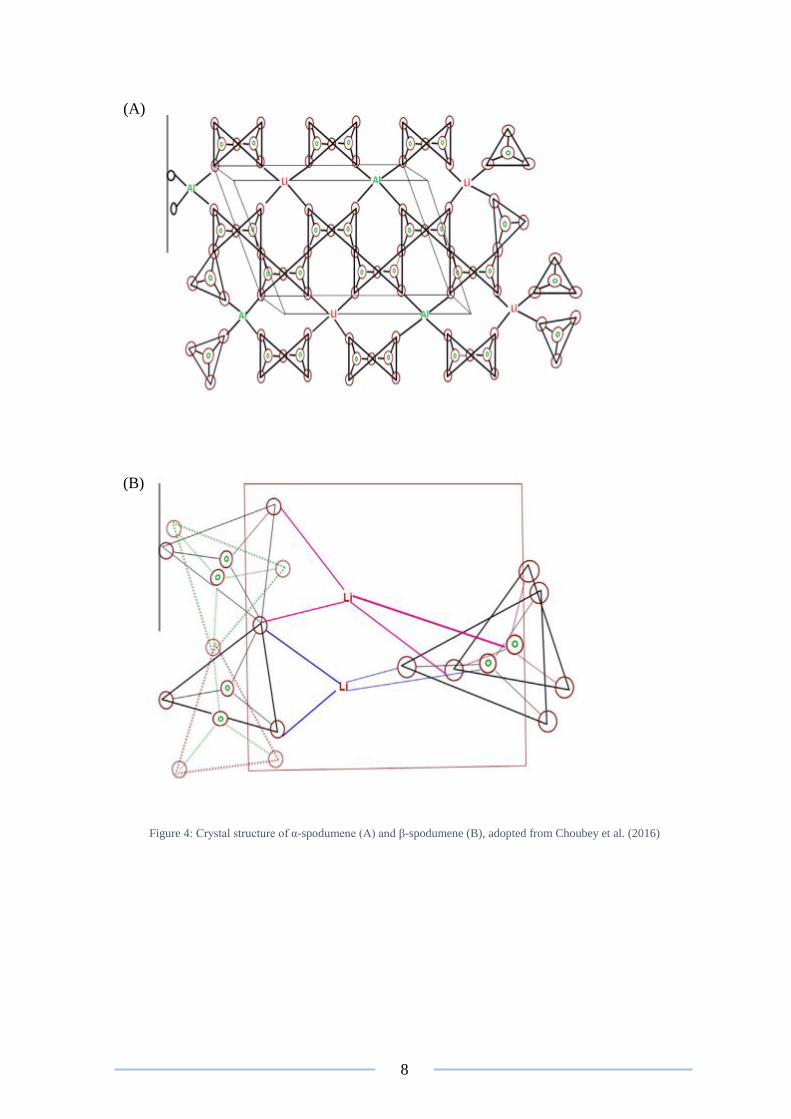
The crystal structure of spodumene is transparent and composes of 8.03% Li2O, 27.4%
Al2O3 and 64.6 % SiO2 (Hurlbut 1971). Naturally α-spodumene exists as a silicate ([SiO3]2)
in a tetrahedral coordination (Figure 4a). An investigation conducted by Moon and Douglas
(2003) surmised the crystallography of spodumene. In the article spodumene is understood
to contain two distinctive regions of interstitial cations, of which the smaller aluminium ion
(Al3+) and larger lithium ion (Li+) exist within the silicate structure. The aluminium ions
exist within the silicate structure in an octahedral coordination with six oxygen atoms (two
non-bridging basal oxygen atoms plus four apical oxygen atoms). The lithium contained
within spodumene is arranged in an irregular octahedral coordination with six oxygen atoms
(two non-bridging basal oxygen’s, two bridging basal oxygen’s and two apical oxygen’s),
due to its small size. This explanation satisfies Pauling's (1932) principle on
electroneutrality, as the strength of electrostatic bonds become 1/6 for the lithium ion in
octahedral coordination with the oxygen atoms, 1/2 for the aluminium ion in octahedral
coordination with the oxygen atoms and one for the silicon atom at the centre of silicate
tetrahedra (Moon and Douglas 2003, Pauling's 1932, Hazen and Finger 1984). The lateral
7
bonding of the silicate chains occurs due to the ionic bonds that exist between the lithium
and aluminium ions, leading to the cell formula of LiAlSi2O6.
Spodumene with its monoclinic crystal structure indicates that it belongs to the
clinopyroxene subgroup of the pyroxene family (University of Minnesota 2010) (Figure
4A). The formation conditions of pyroxene (pegmatitic conditions) allows for the
substitution of aluminium and lithium ions with transitional elements such as manganese
(Mn), iron (Fe) and chromium (Cr). The potential substitutions that can occur, can lead to
polymorphs of spodumene forming. This includes kunzite (LiAlSi2O6) of which due to its
high manganese content contains pink hues and hiddenite (LiAlSi2O6) of which contains a
significant chrome content giving the silicate crystal a green tinge. Larger mineralogical
substitutions such as the formation of ferromagnesian minerals are likely to occur in the
place of spodumene formation (Souza et al. 2004). Such minerals include clinoferrosilite
(Fe2+SiO3), jadeite (Na (Al, Fe3+) Si2O6) and johannsenite (CaMn2+Si2O6) (Hurlbut 1971).
The most common impurities associated with spodumene are feldspars
(KAlSi3O8 – NaAlSi3O8 – CaAl2Si2O8), quartz (SiO2) and micas ((AB2-3) (X, Si)4O10 (O, F,
OH)2) of which are gangue minerals and are not included in elemental substitution reactions
that occur with spodumene.
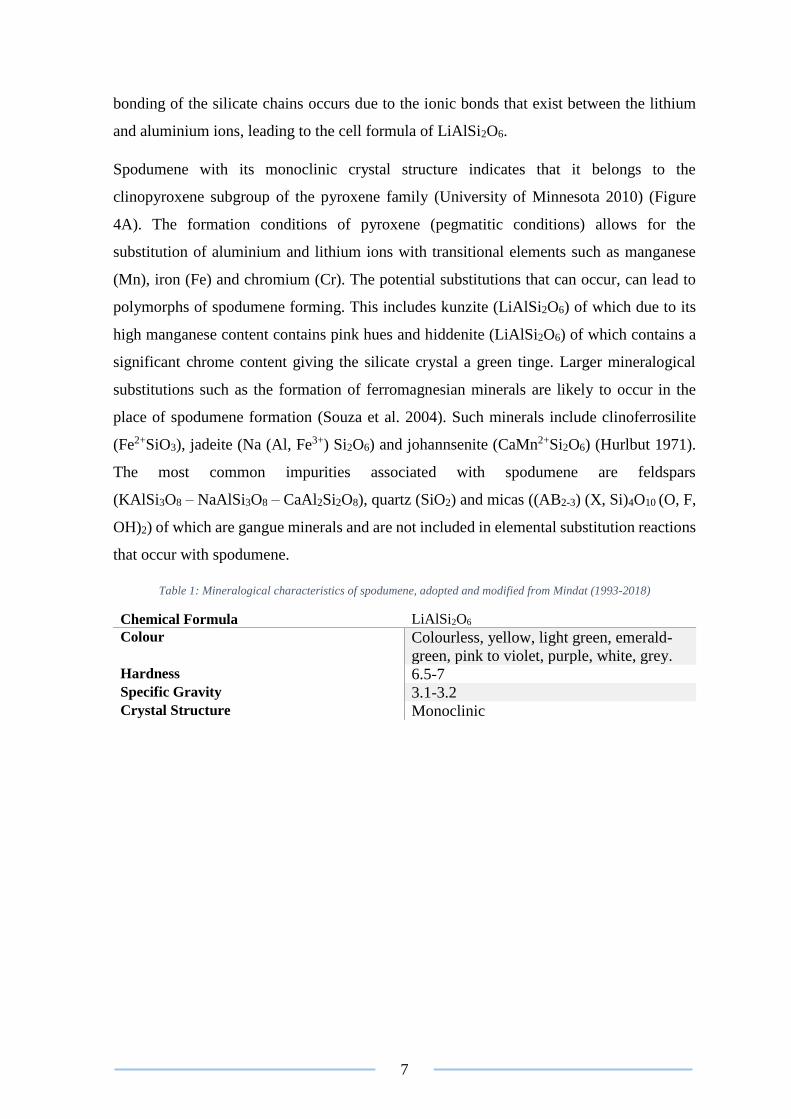
Table 1: Mineralogical characteristics of spodumene, adopted and modified from Mindat (1993-2018)
Chemical Formula LiAlSi2O6
Colour Colourless, yellow, light green, emerald-
green, pink to violet, purple, white, grey. Hardness 6.5-7 Specific Gravity 3.1-3.2
Crystal Structure Monoclinic
8
Figure 4: Crystal structure of α-spodumene (A) and β-spodumene (B), adopted from Choubey et al. (2016)
(A)
(B)
9
2.3 Processing of spodumene
Spodumene naturally exists as an insoluble monoclinic aluminium silicate, referred to as α-
spodumene (Brown 2016). The molecular arrangement of α-spodumene consists of a sixfold
tetrahedra of silicon atoms, centralised around aluminium and lithium ions (Botto 1985,
Salakjani et al. 2016) (Figure 4A). It has been found that due to the highly siliceous nature
of the mineral, numerous difficulties arise when trying to extract valuable constituents
(Meshram et al. 2014, Kuang et al. 2018). Currently the most efficient extraction techniques
utilise an energy intensive calcination step prior to leaching. The calcination of α-spodumene
promotes a physical transformation to occur resulting in a reactive polymorph forming
known as β-spodumene. When calcination occurs the sixfold coordination of the silicon
atoms become five membered rings of (Si, Al) O4 (Botto 1985, Salakjani et al. 2016) (Figure
4B). The transformation provides a passage for the liberation of lithium to occur, by
thermally weakening the intermolecular bonds that exist between Li - (Si, Al) O4 atoms
(Salakjani et al. 2016). The consequential volumetric expansion (by 30%) and decrease in
specific gravity (from 3.15 g/cm3 to 2.40 g/cm3) assists in allowing external reagents to
penetrate the β-spodumene and liberate the lithium present (Salakjani et al. 2016, Rosales et
al. 2014).
Thermodynamic studies based around the conversion of spodumene has been extensively
researched and Gibbs energy diagrams established (Choubey et al. 2016, Munoz 1969,
Konar et al. 2018). Choubey et al. (2016) identified that the conversion of α to β-spodumene
at standard ambient conditions was not feasible. However, the thermodynamic data
collected suggested that conversion could be achieved at elevated temperatures as displayed
in equations (1) and (2) below:
α-spodumene ∆𝐺1073 𝐾=−0.45 𝑘𝑐𝑎𝑙→ β-spodumene (1)
α-spodumene ∆𝐺298 𝐾=4.63 𝑘𝑐𝑎𝑙
← β-spodumene (2)
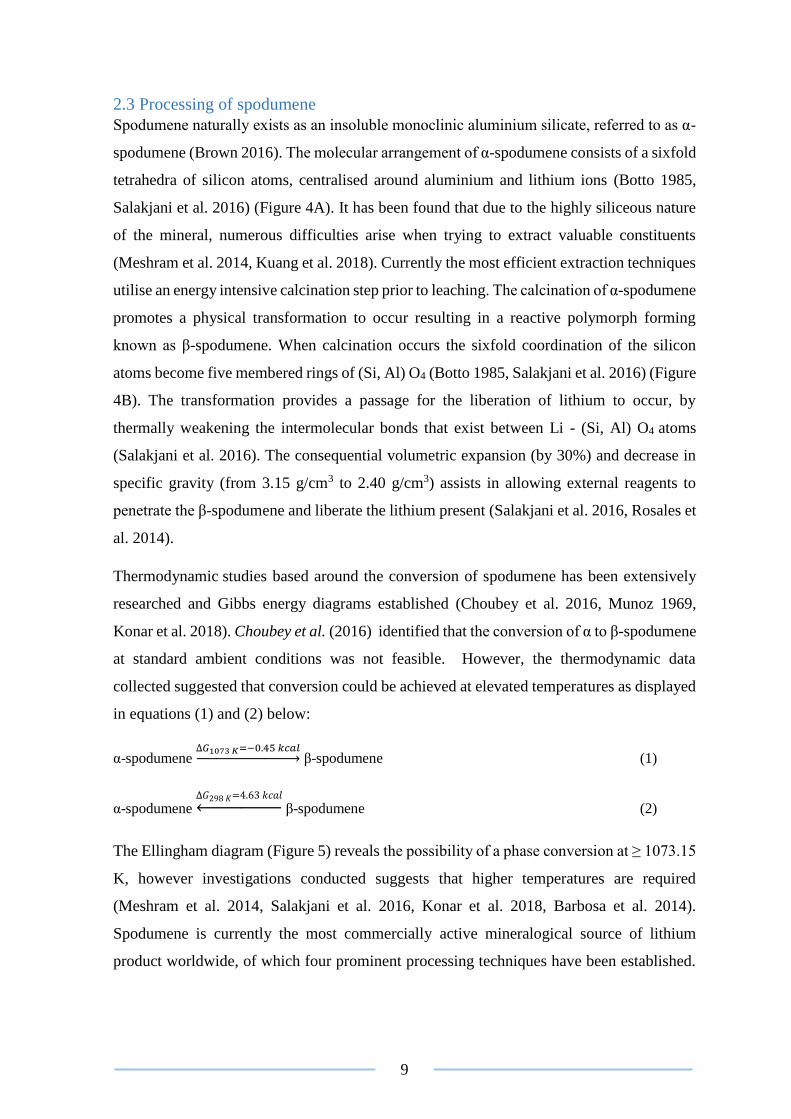
The Ellingham diagram (Figure 5) reveals the possibility of a phase conversion at ≥ 1073.15
K, however investigations conducted suggests that higher temperatures are required
(Meshram et al. 2014, Salakjani et al. 2016, Konar et al. 2018, Barbosa et al. 2014).
Spodumene is currently the most commercially active mineralogical source of lithium
product worldwide, of which four prominent processing techniques have been established.
10
The four techniques include sulfation, chlorination, fluorination and alkaline processing
(Meshram et al. 2014) of which are surmised in Table 6 and discussed in detail below.
Figure 5: Ellingham diagram for the phase transformation of α to β-spodumene, adopted from Choubey et al. (2016)
2.3.1 Sulfation process
The sulfation process is the most common technique utilised in the extraction of lithium
from spodumene, and is currently in commercial application with Galaxy Resources Ltd
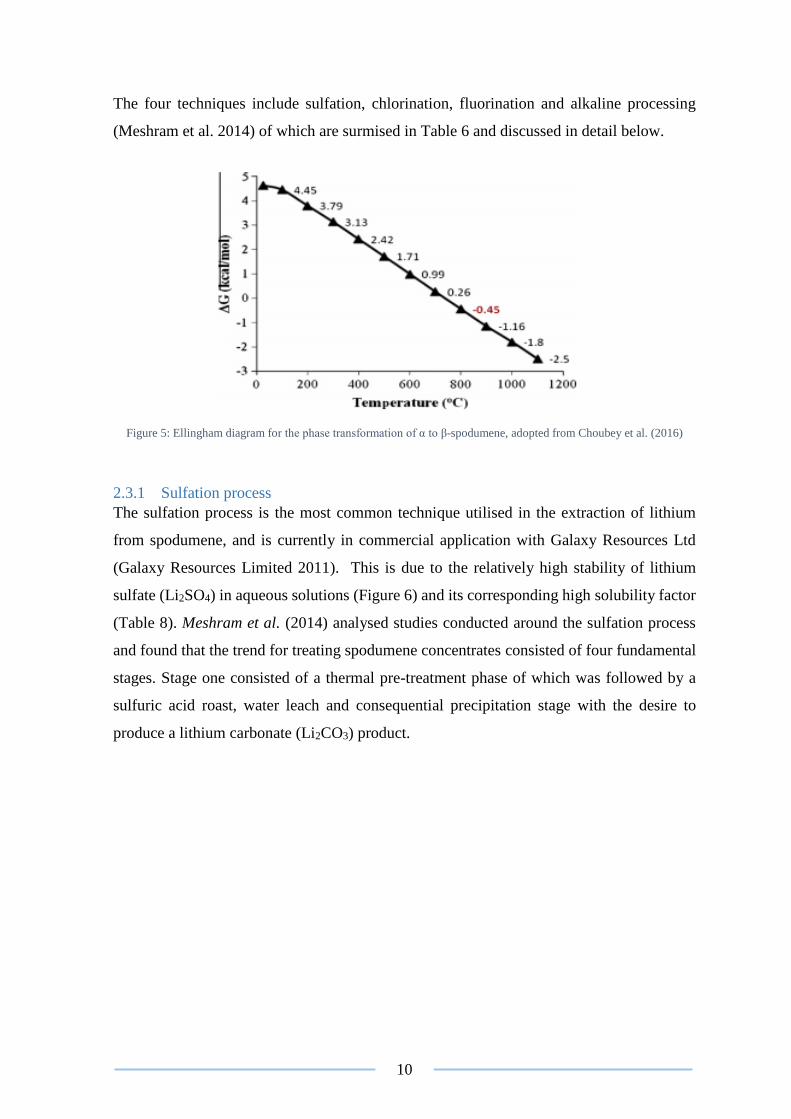
(Galaxy Resources Limited 2011). This is due to the relatively high stability of lithium
sulfate (Li2SO4) in aqueous solutions (Figure 6) and its corresponding high solubility factor
(Table 8). Meshram et al. (2014) analysed studies conducted around the sulfation process
and found that the trend for treating spodumene concentrates consisted of four fundamental
stages. Stage one consisted of a thermal pre-treatment phase of which was followed by a
sulfuric acid roast, water leach and consequential precipitation stage with the desire to
produce a lithium carbonate (Li2CO3) product.
11
Figure 6: Eh-p.H diagram for the Li-S-H2O system at 298.15 K, adopted form OutoTec (2017)
The calcination of α-spodumene at 1273.15-1373.15 K for approximately 1 hour, converts
the α-spodumene to its more reactive β phase (Salakjani et al. 2016, Kuang et al. 2018). Post
calcination, the material is cooled and then mixed with concentrated sulfuric acid (H2SO4).
The mixture is then roasted at 483.15 K where a cation exchange occurs between the
spodumene and the sulfuric acid (Choubey et al. 2016). From this reaction a roast product
containing lithium sulfate (Li2SO4) is produced, represented by equation (3) below:
β-LiAlSi2O6 (s)+H2SO4 (conc)
∆G483 Ko =−375.28 kcal
→ Li2SO4 (s)+Al2O3.4SiO2 (s)+H2O (g) (3)
The roast product is then screened at ± 150 µm with the oversize reporting to a regrind stage
(Ellestad and Leute 1950). The undersize is subjected to a water leach in order to produce
an aqueous lithium sulfate product (Meshram et al. 2014, Kuang et al. 2018, Ellestad and
Leute 1950). The extent of leaching is controlled by the addition of limestone (CaCO3), of
which is utilised to neutralise the excess sulfuric acid (Kuang et al. 2018). The operating
temperature of the leaching vessel is approximated around 448.15-498.15 K allowing for
the complete dissolution of lithium sulfate to occur as represented in equation (4) below
(Ellestad and Leute 1950).
Li2SO4 (s)+Al2O3.4SiO2 (s)+H2O (aq) ∆𝐺498 𝐾
𝑜 =−0.71 𝑘𝑐𝑎𝑙→ Li2SO4 (aq) +Al2O3.4SiO2 (s)+H2O (aq) (4)
Lithium carbonate (Li2CO3) can be recovered by the addition of sodium carbonate (Na2CO3)
to the leach solution (Nicholson 1946). This is completed by the precipitation reaction
below:
12
Li2SO4 (aq) + Na2CO3 (aq) ∆𝐺298 𝐾
𝑜 =−48.88 kcal→ Li2CO3 (s) + Na2SO4 (aq) (5)
Further downstream processing can be implemented to maximise the recovery of lithium.
This is achieved by implementing a closed loop re-leach circuit post the lithium carbonate
precipitation stage (Kuang et al. 2018). Doing so does have respective drawbacks such as
increased capital costs, intense energy requirements and complicated running conditions
(Kuang et al. 2018).
2.3.2 Alkaline process
The process of producing lithium chloride (LiCl) in alkaline conditions is conducted in a
two-step process: 1) calcination of the α-spodumene, and 2) a water leach for lithium
chloride production (Meshram et al. 2014). Averill and Olson (1978) reported that the
recovery of this method is approximately 85-90% efficient. The drawbacks on the process
involve a complex reagent scheme and a high reagent expenditure. Furthermore the costs
associated with constructing corrosion resistant equipment are much greater than that of
alternative processes (Kuang et al. 2018).
The calcination of α-spodumene into its reactive β phase is conducted at 1098.15-1323.15
K in the presence of limestone (CaCO3). A product containing lithium oxide (β-Li2O) is
formed under alkaline conditions outlined by equation (6) below:
(α)-LiAlSi2O6 (s) + CaCO3 (aq) ∆𝐺1323 𝐾
𝑜 =−63.52 𝑘𝑐𝑎𝑙 → (β)-Li2O (s)+ CaAlSi2O6 (s) +CO2 (g) (6)
The resulting calcine (β-Li2O) is crushed, milled and leached in water to yield aqueous
lithium hydroxide, as displayed by equation (7), below. The lithium hydroxide is then
converted to lithium chloride (LiCl) by reacting with hydrochloric acid (HCl) (8).
β-Li2O (s) +H2O (aq) ∆𝐺298 𝐾
𝑜 =−19.01 𝑘𝑐𝑎𝑙→ 2LiOH (aq) (7)
LiOH (aq) +HCl (aq)
∆𝐺298 𝐾𝑜 =−12.60 𝑘𝑐𝑎𝑙
→ LiCl (aq) + H2O (aq) (8)
Post lithium chloride production the lithium bearing eluate is sent for further downstream
processing, to be utilised in the production of lithium metal (Brown 2016) (refer to section
2.4.1 for more information).
Archambault and Olivier (1968) proposed an alternative alkaline process by utilising sodium
carbonate (Na2CO3) as a cationic exchange lixiviant. The recovery of the process is reported
13
to be 75% efficient at producing a lithium carbonate product. The drawbacks associated with
the process involve a complex reagent scheme and high capital/operating expenditures due
to the requirement of corrosion resistant materials of construction.
Archambault and Olivier (1968) reported that the calcination of α-Spodumene to its reactive
β phase was conducted at 1272.15 K. The β-spodumene was then mixed with sodium
carbonate and roasted at 848.15-948.15 K represented in equation (9) below:
2β-LiAlSi2O6 (s)+ Na2CO3 (s) ∆𝐺948 𝐾
𝑜 = −450.32 𝑘𝑐𝑎𝑙→ Li2CO3 (s) + 2NaAlSi2O6 (s) (9)
The roast product was then subjected to a warm water leach, where the injection of carbon
dioxide (CO2) promotes the formation of lithium bicarbonate (LiHCO3).
Li2CO3 (s) + CO2 (g) + H2O (aq) ∆𝐺298 𝐾
𝑜 =−8.48 𝑘𝑐𝑎𝑙→ 2LiHCO3 (s) (10)
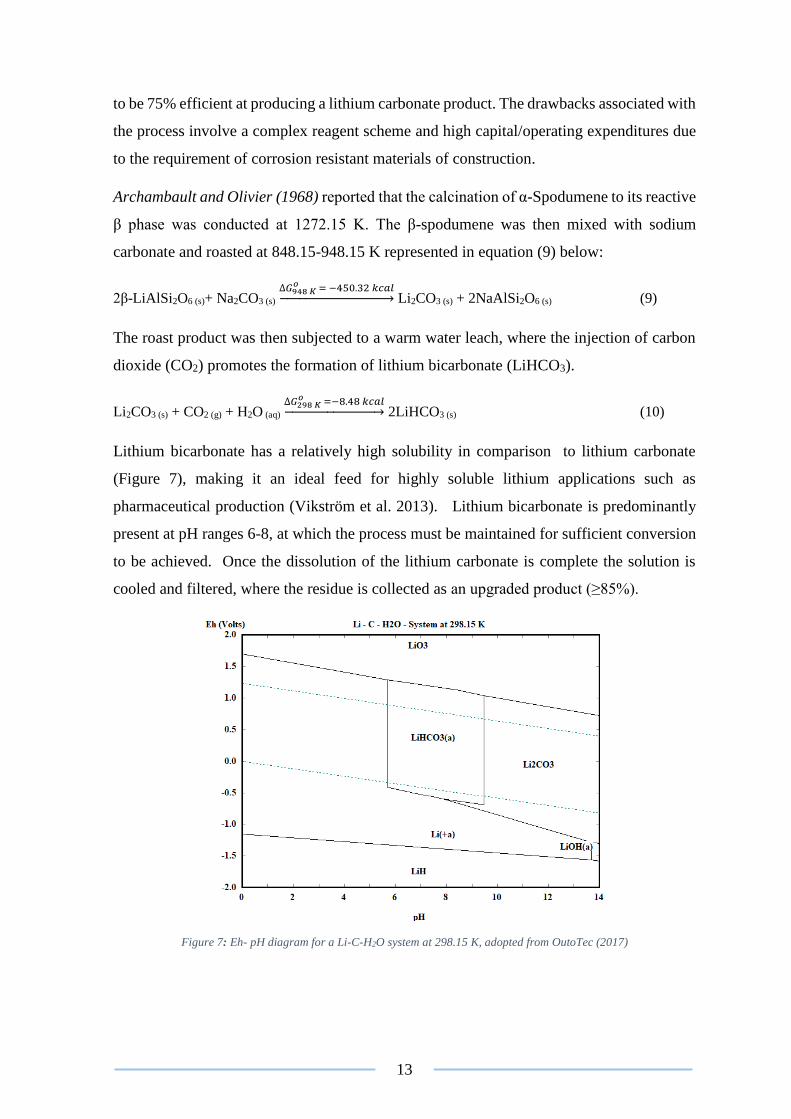
Lithium bicarbonate has a relatively high solubility in comparison to lithium carbonate
(Figure 7), making it an ideal feed for highly soluble lithium applications such as
pharmaceutical production (Vikström et al. 2013). Lithium bicarbonate is predominantly
present at pH ranges 6-8, at which the process must be maintained for sufficient conversion
to be achieved. Once the dissolution of the lithium carbonate is complete the solution is
cooled and filtered, where the residue is collected as an upgraded product (≥85%).
Figure 7: Eh- pH diagram for a Li-C-H2O system at 298.15 K, adopted from OutoTec (2017)
14
2.3.3 Chlorination process
The chlorination of β-spodumene utilising chlorine based additives was investigated in detail
by Zelikman et al. (1996). The research conducted indicated that the chlorination process
was 98% efficient at producing lithium chloride crystals via a chloride roast and subsequent
water leach. It was suggested that the efficiency of the process was due to the high reactivity
of chloride gas with the metal oxides and silicates resulting in the formation of water soluble
chloride complexes (Choubey et al. 2016). The current drawbacks identified with this
treatment include the requirement for corrosion resistant materials of construction, high
reagent expenditures and the intrinsic dangers associated with utilising chlorine gas
(Barbosa et al. 2014).
The sintering of spodumene with a combination of ammonium chloride (NH4Cl) and
calcium chloride (CaCl2) was conducted at 1023.15 K. It was found that 98% of the lithium
contained within the spodumene was converted to lithium chloride (LiCl) within the sinter
product, as displayed by equation (11) below:
β-LiAlSi2O6 (s) + 4CaCO3 (s) + 2NH4Cl (s) ∆𝐺1023 𝐾
𝑜 =−179.15 𝑘𝑐𝑎𝑙→ 2LiCl (s) + 4CaSiO3 (s) + Al2O3 (s) +
4CO2 (g) + 2NH3 (g) + H2O (aq) (11)
Zelikman et al. (1996) later investigated the leaching of the sinter product and found that it
was water soluble. The leach liquor obtained from the water leach upgraded the purity of
the lithium chloride eluate, justifying a re-leach.
LiCl (s)+CaAlSi2O8 (s)+Al2O3 (s)+H2O (aq)
∆𝐺298 𝐾 𝑜 =−2.74 𝑘𝑐𝑎𝑙
→ LiCl (aq)+CaAlSi2O8 (s)+Al2O3 (s)+H2O (aq)
(12)
The liquor from the water leach is filtered and separated from the solid residue. The solution
is then evaporated allowing for the crystallisation of lithium chloride to occur, resulting in a
98% pure lithium chloride product (Meshram et al. 2014, Zelikman et al. 1996). The
crystallised product is sent for further downstream processing, to be utilised in the
production of lithium metal (Brown 2016) (refer to section 2.4.1 for more information).
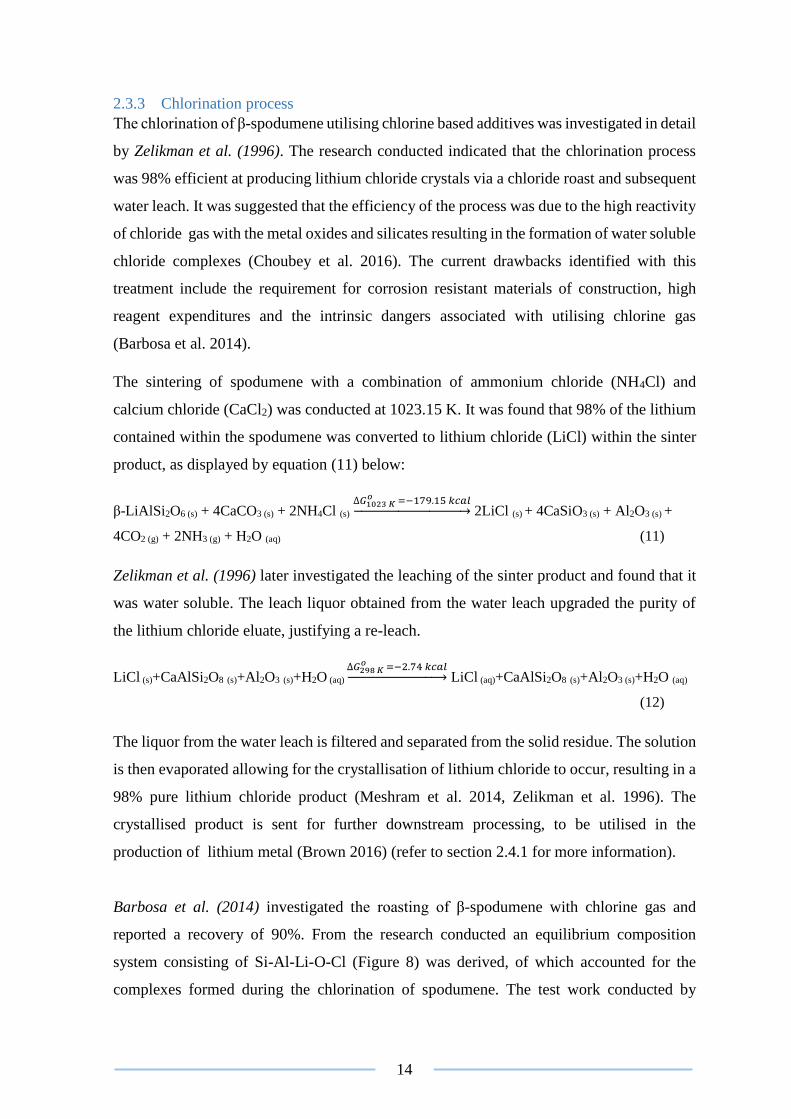
Barbosa et al. (2014) investigated the roasting of β-spodumene with chlorine gas and
reported a recovery of 90%. From the research conducted an equilibrium composition
system consisting of Si-Al-Li-O-Cl (Figure 8) was derived, of which accounted for the
complexes formed during the chlorination of spodumene. The test work conducted by
15
Barbosa et al established that the optimal conditions for chlorinating spodumene occurred
a 1323.15-1373.15 K for approximately 2.5 hours, of which is represented by equation (13)
below:
β-LiAlSi2O6 (s)+ 1
2 Cl (g)
∆𝐺1373 𝐾 𝑜 =−202.00 𝑘𝑐𝑎𝑙
→ LiCl (aq) + 1
6 Al6Si2O13 (s)+
1
4 O2 (g) (13)
The chlorination process resulted in an overall mass reduction of the feed material,
indicating the formation of lithium chloride complexes. The rate of formation for the lithium
chloride was evaluated to increase with increasing temperatures, as displayed by in Figure
8 (Barbosa et al. 2014, OutoTec 2017). The formation of solid by-products such as mullite
(Al6Si2O13) and cristobalite (SiO2) assisted in distinguishing the efficiency of the process.
This is more evident at temperature in excess of 1273.15 K, as lithium chloride becomes
preferentially concentrated in an aqueous phase above 453.15 K (Figure 8). The elimination
of iron-based impurities was found to occur below 1273.15 K, with other impurities
requiring removal via distillation (Habashi 1986). From the results gathered the activation
energy for the chlorination process was determined to be 85.80 kcal/mol (please refer to
Figure 42) (Barbosa et al. 2014).
Figure 8: Equilibrium composition of the system Si-Al-Li-O-Cl, as a function of temperature, adopted from Barbosa et
al. (2014)
16
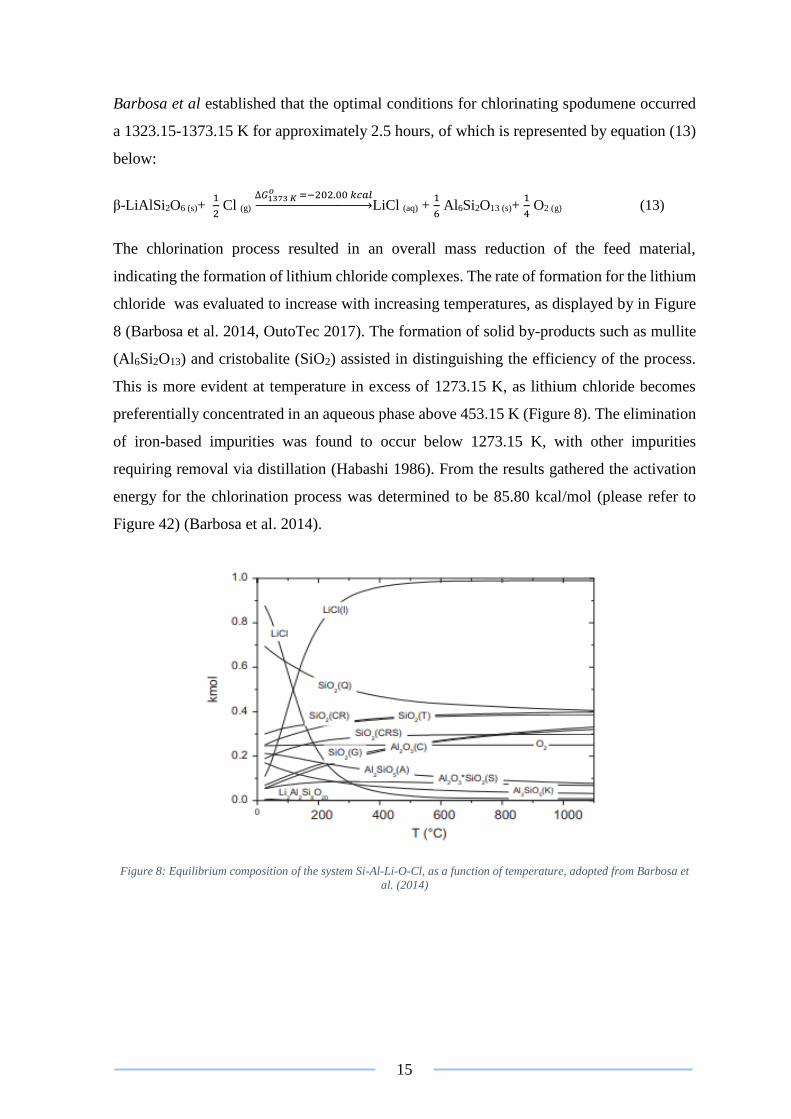
Figure 9: Eh-pH diagram for a Li-Cl-H2O system at 298.15 K, adopted from OutoTec (2017)
2.3.4 Fluorination process
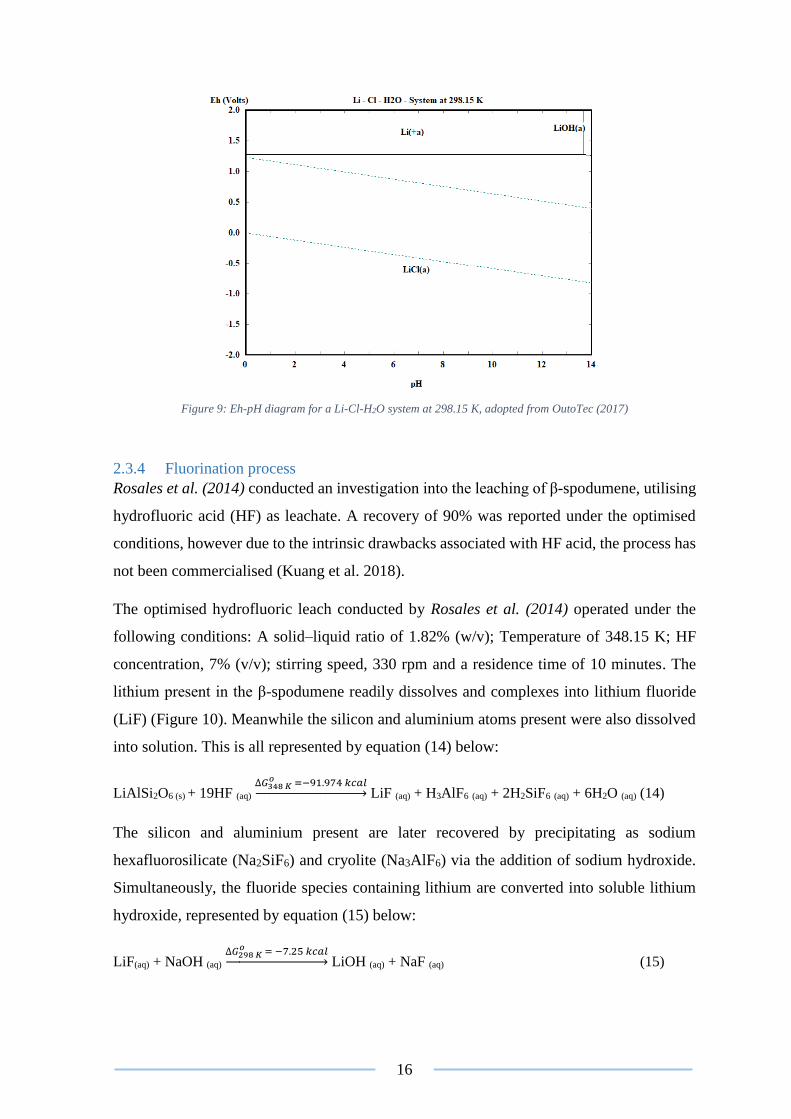
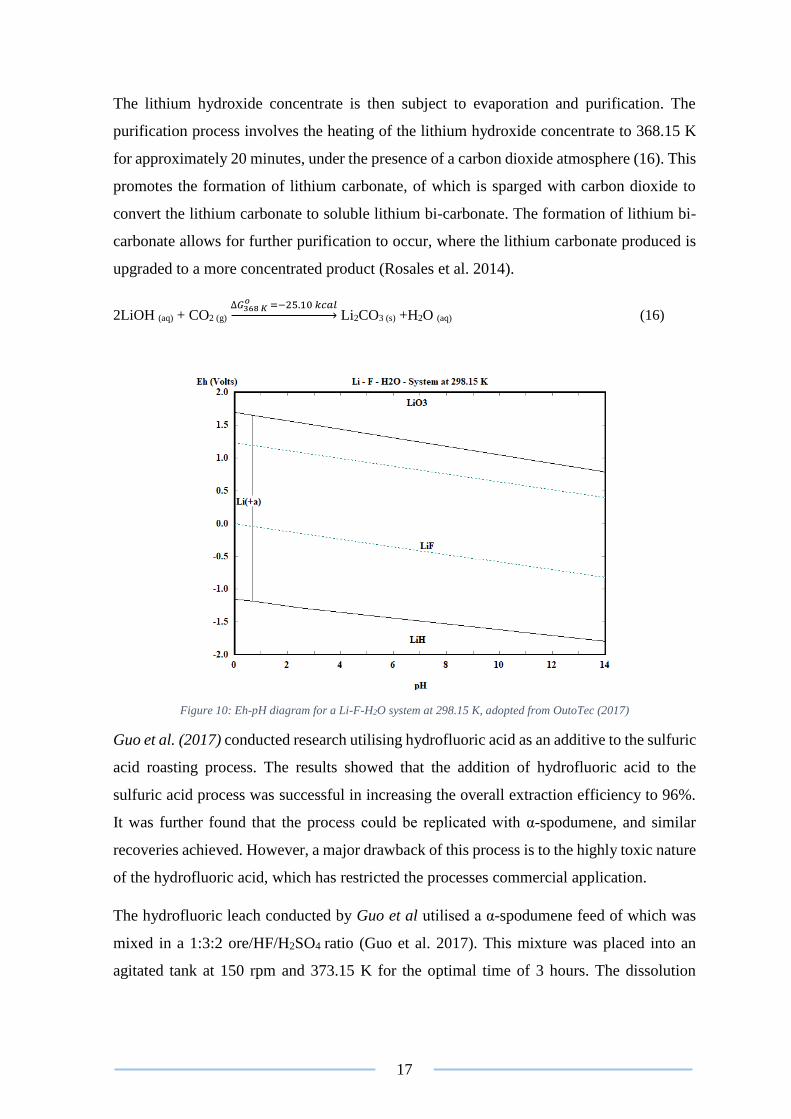
Rosales et al. (2014) conducted an investigation into the leaching of β-spodumene, utilising
hydrofluoric acid (HF) as leachate. A recovery of 90% was reported under the optimised
conditions, however due to the intrinsic drawbacks associated with HF acid, the process has
not been commercialised (Kuang et al. 2018).
The optimised hydrofluoric leach conducted by Rosales et al. (2014) operated under the
following conditions: A solid–liquid ratio of 1.82% (w/v); Temperature of 348.15 K; HF
concentration, 7% (v/v); stirring speed, 330 rpm and a residence time of 10 minutes. The
lithium present in the β-spodumene readily dissolves and complexes into lithium fluoride
(LiF) (Figure 10). Meanwhile the silicon and aluminium atoms present were also dissolved
into solution. This is all represented by equation (14) below:
LiAlSi2O6 (s) + 19HF (aq) ∆𝐺348 𝐾
𝑜 =−91.974 𝑘𝑐𝑎𝑙→ LiF (aq) + H3AlF6 (aq) + 2H2SiF6 (aq) + 6H2O (aq) (14)
The silicon and aluminium present are later recovered by precipitating as sodium
hexafluorosilicate (Na2SiF6) and cryolite (Na3AlF6) via the addition of sodium hydroxide.
Simultaneously, the fluoride species containing lithium are converted into soluble lithium
hydroxide, represented by equation (15) below:
LiF(aq) + NaOH (aq) ∆𝐺298 𝐾
𝑜 = −7.25 𝑘𝑐𝑎𝑙→ LiOH (aq) + NaF (aq) (15)
17
The lithium hydroxide concentrate is then subject to evaporation and purification. The
purification process involves the heating of the lithium hydroxide concentrate to 368.15 K
for approximately 20 minutes, under the presence of a carbon dioxide atmosphere (16). This
promotes the formation of lithium carbonate, of which is sparged with carbon dioxide to
convert the lithium carbonate to soluble lithium bi-carbonate. The formation of lithium bi-
carbonate allows for further purification to occur, where the lithium carbonate produced is
upgraded to a more concentrated product (Rosales et al. 2014).
2LiOH (aq) + CO2 (g) ∆𝐺368 𝐾
𝑜 =−25.10 𝑘𝑐𝑎𝑙→ Li2CO3 (s) +H2O (aq) (16)
Figure 10: Eh-pH diagram for a Li-F-H2O system at 298.15 K, adopted from OutoTec (2017)
Guo et al. (2017) conducted research utilising hydrofluoric acid as an additive to the sulfuric
acid roasting process. The results showed that the addition of hydrofluoric acid to the
sulfuric acid process was successful in increasing the overall extraction efficiency to 96%.
It was further found that the process could be replicated with α-spodumene, and similar
recoveries achieved. However, a major drawback of this process is to the highly toxic nature
of the hydrofluoric acid, which has restricted the processes commercial application.
The hydrofluoric leach conducted by Guo et al utilised a α-spodumene feed of which was
mixed in a 1:3:2 ore/HF/H2SO4 ratio (Guo et al. 2017). This mixture was placed into an
agitated tank at 150 rpm and 373.15 K for the optimal time of 3 hours. The dissolution
18
reaction of the α-spodumene and formation of lithium sulfate are represented by equation
(17) below:
2α-LiAlSi2O6 (s) + 24HF (aq) + 4H2SO4 (aq) ∆𝐺373 𝐾
𝑜 =−206.61 𝑘𝑐𝑎𝑙→ LiSO4 (aq) + Al2(SO4)3 (aq) + 4H2SiF6 (aq)
+ 12H2O (aq) (17)
The aqueous product from the leach contains lithium sulfate, aluminium sulfate (Al2(SO4)3)
and hexafluorosilicic acid (H2SiF6). The aqueous species produced then undergo a
purification process which consists of a water leach where the addition of sodium carbonate
promotes the precipitation of lithium carbonate (18). The product from the water leach is
then filtered, to recover the solid residue which contains ≥96% lithium carbonate (Guo et al.
2017).
Li2SO4 (aq) + Na2CO3 (aq) ∆𝐺323 𝐾
𝑜 =−48.88 𝑘𝑐𝑎𝑙→ Li2CO3 (s) + Na2SO4 (aq} (18)
19
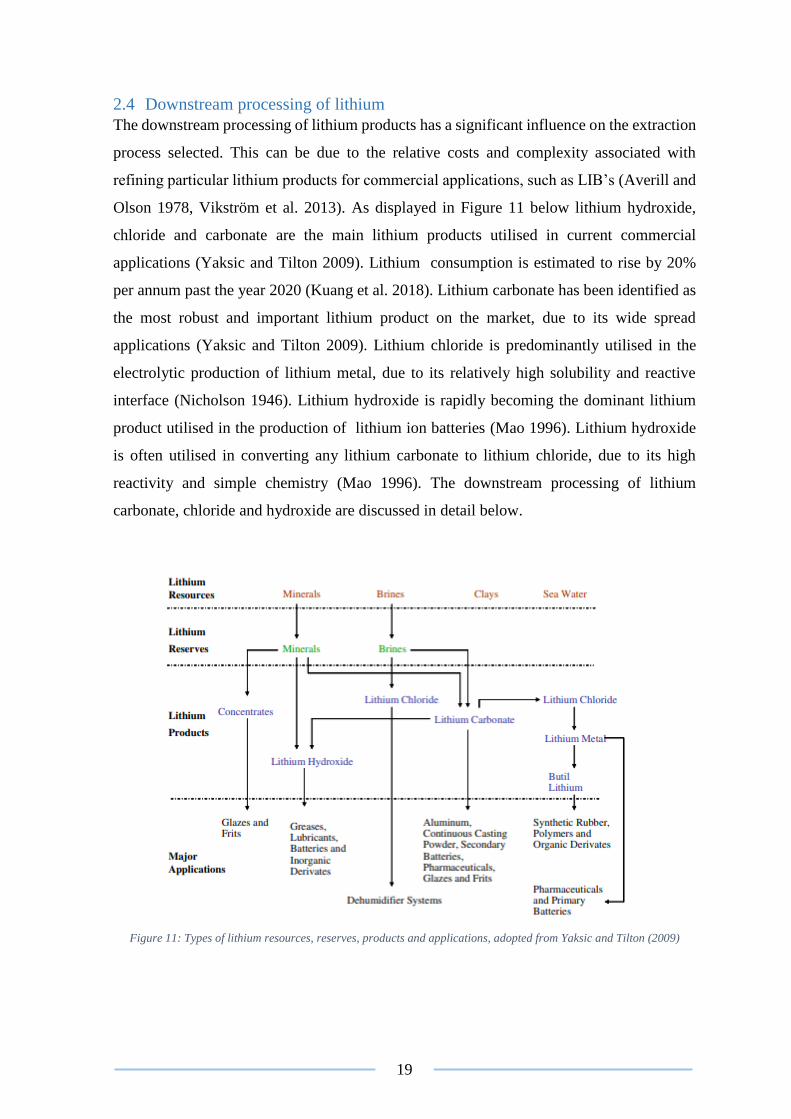
2.4 Downstream processing of lithium
The downstream processing of lithium products has a significant influence on the extraction
process selected. This can be due to the relative costs and complexity associated with
refining particular lithium products for commercial applications, such as LIB’s (Averill and
Olson 1978, Vikström et al. 2013). As displayed in Figure 11 below lithium hydroxide,
chloride and carbonate are the main lithium products utilised in current commercial
applications (Yaksic and Tilton 2009). Lithium consumption is estimated to rise by 20%
per annum past the year 2020 (Kuang et al. 2018). Lithium carbonate has been identified as
the most robust and important lithium product on the market, due to its wide spread
applications (Yaksic and Tilton 2009). Lithium chloride is predominantly utilised in the
electrolytic production of lithium metal, due to its relatively high solubility and reactive
interface (Nicholson 1946). Lithium hydroxide is rapidly becoming the dominant lithium
product utilised in the production of lithium ion batteries (Mao 1996). Lithium hydroxide
is often utilised in converting any lithium carbonate to lithium chloride, due to its high
reactivity and simple chemistry (Mao 1996). The downstream processing of lithium
carbonate, chloride and hydroxide are discussed in detail below.
Figure 11: Types of lithium resources, reserves, products and applications, adopted from Yaksic and Tilton (2009)
20
2.4.1 Electrorefining for the production of lithium metal
The electrowinning of lithium chloride is the dominant refining method utilised in the
production of lithium metal (Kipouros and Sadoway 1998). The process has been utilised in
the lithium refining industry for many years with the first commercial production of lithium
metal occurring in 1923 by Metallgesellschaft AG, formerly one of Germany’s largest
industrial conglomerates (Rio Tinto 2014). The process operates with an efficiency ≥ 98%,
however significant drawbacks and hazards are present in the process, especially the dangers
associated around the evolution of chlorine gas at the anode. Chlorine gas is a corrosive
substance, of which can lead to respiratory problems in people (U.S. Department of Health
and Human Services 2004). Mitigating the potential risks associated with the corrosive
nature of the process is the most significant cost to the refining process. Research into
alternative refining methods have been investigated, however the lithium chloride
electrorefining method remains the most economically viable process to date.
The most dominant lithium species utilised in the production of metallic lithium is lithium
chloride (Hampel 1972). This is due to lithium chloride having the largest deposition
potential of all lithium products, suggesting that it has the greatest potential for being
reduced (Takeda et al. 2014). A method for converting lithium carbonate to lithium chloride
has been found to be economically viable within the constraints of the electrorefining
process (Kipouros and Sadoway 1998, DeYoung 1991). Lithium carbonate is initially
converted to lithium hydroxide by the addition of calcium hydroxide (Ca(OH)2). The lithium
hydroxide produced is then converted to lithium chloride by the addition of a chlorination
agent such as hydrochloric acid (DeYoung 1991). The respective lithium hydroxide and
lithium chloride conversions are represented by equations (19) and (20) below.
Li2CO3 (s) + Ca(OH)2 (aq)
∆𝐺298 𝐾𝑜 =−0.41 𝑘𝑐𝑎𝑙
→ 2LiOH (aq) + CaCO3 (s) (19)
LiOH (aq) + HCl (aq) ∆𝐺298 𝐾
𝑜 =−12.60 𝑘𝑐𝑎𝑙→ LiCl (aq) + H2O (aq) (20)
The electrorefining of lithium chloride is conducted between a central cathode composed of
stainless steel and two anodes consisting of pure graphite (DeYoung 1991). The
electrorefining process produces liquid lithium which agglomerates above the stainless steel
cathode. A bell-shaped structure positioned above the cathode collects the rising liquid
product and prevents it from reacting with the chlorine off gas (Figure 12). The evolution of
chlorine gas at the anode provides an oxidative reaction, allowing for the reduction to lithium
metal at the cathode.
21
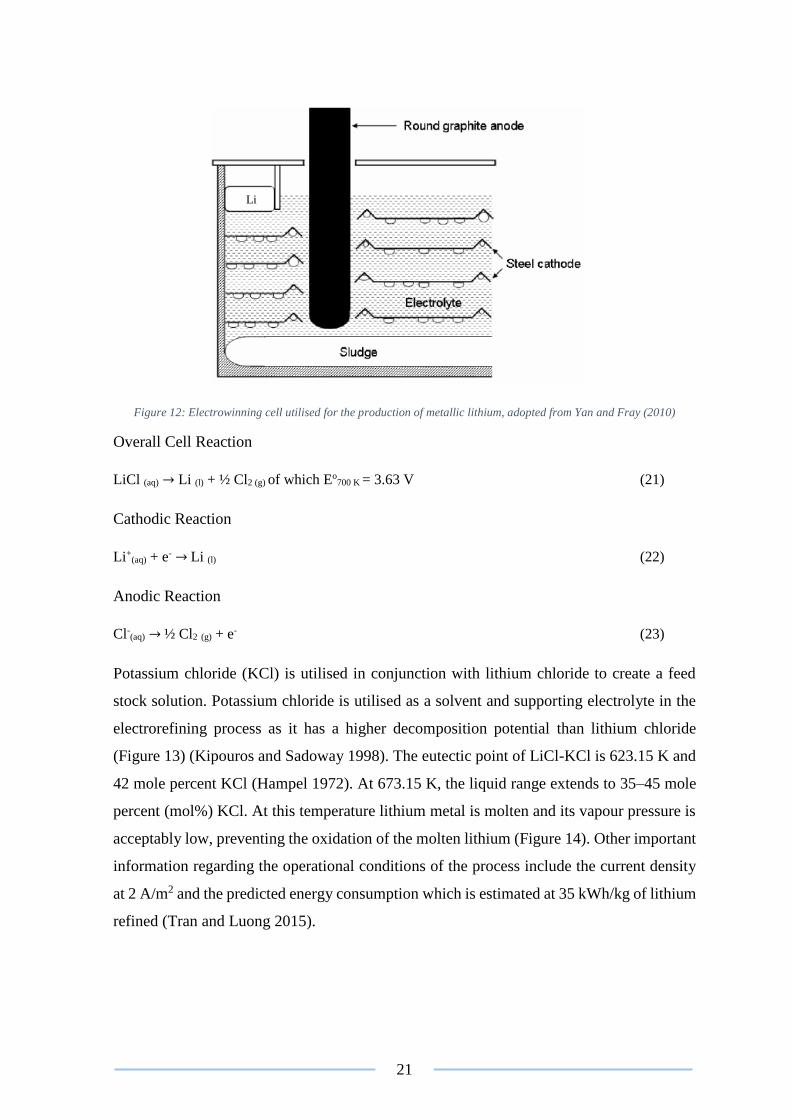
Figure 12: Electrowinning cell utilised for the production of metallic lithium, adopted from Yan and Fray (2010)
Overall Cell Reaction
LiCl (aq) → Li (l) + ½ Cl2 (g) of which Eo700 K = 3.63 V (21)
Cathodic Reaction
Li+(aq) + e- → Li (l) (22)
Anodic Reaction
Cl-(aq) → ½ Cl2 (g) + e- (23)
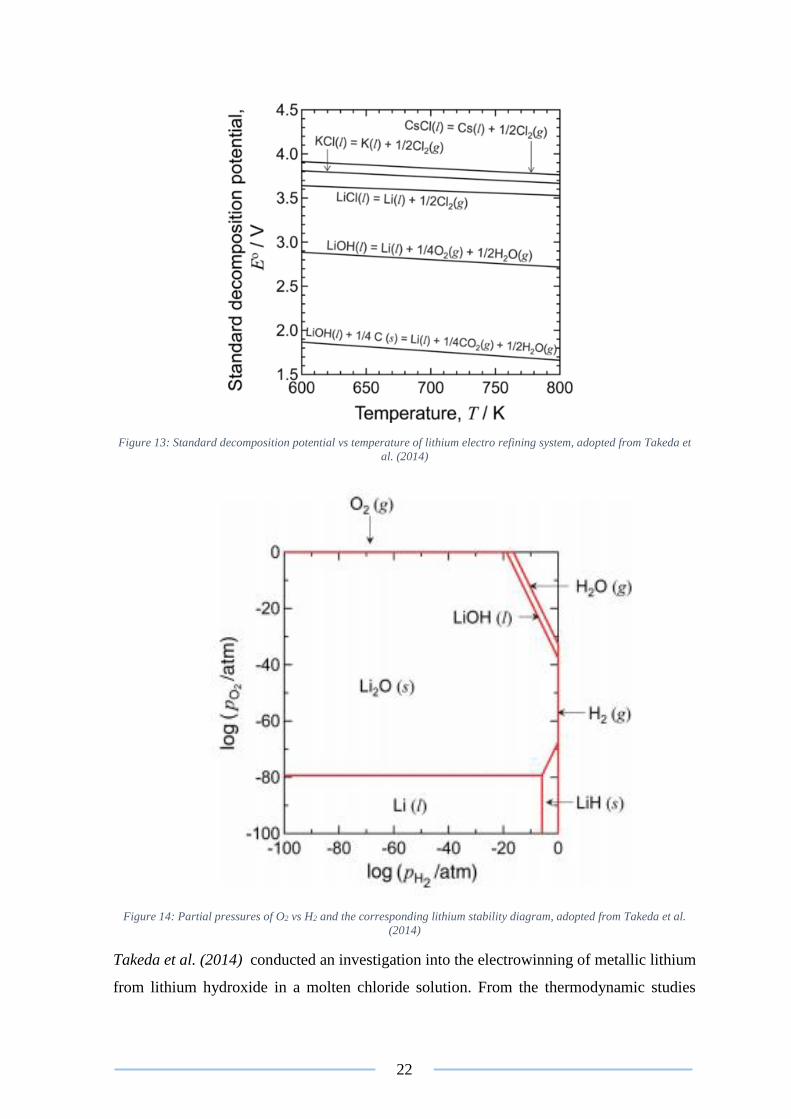
Potassium chloride (KCl) is utilised in conjunction with lithium chloride to create a feed
stock solution. Potassium chloride is utilised as a solvent and supporting electrolyte in the
electrorefining process as it has a higher decomposition potential than lithium chloride
(Figure 13) (Kipouros and Sadoway 1998). The eutectic point of LiCl-KCl is 623.15 K and
42 mole percent KCl (Hampel 1972). At 673.15 K, the liquid range extends to 35–45 mole
percent (mol%) KCl. At this temperature lithium metal is molten and its vapour pressure is
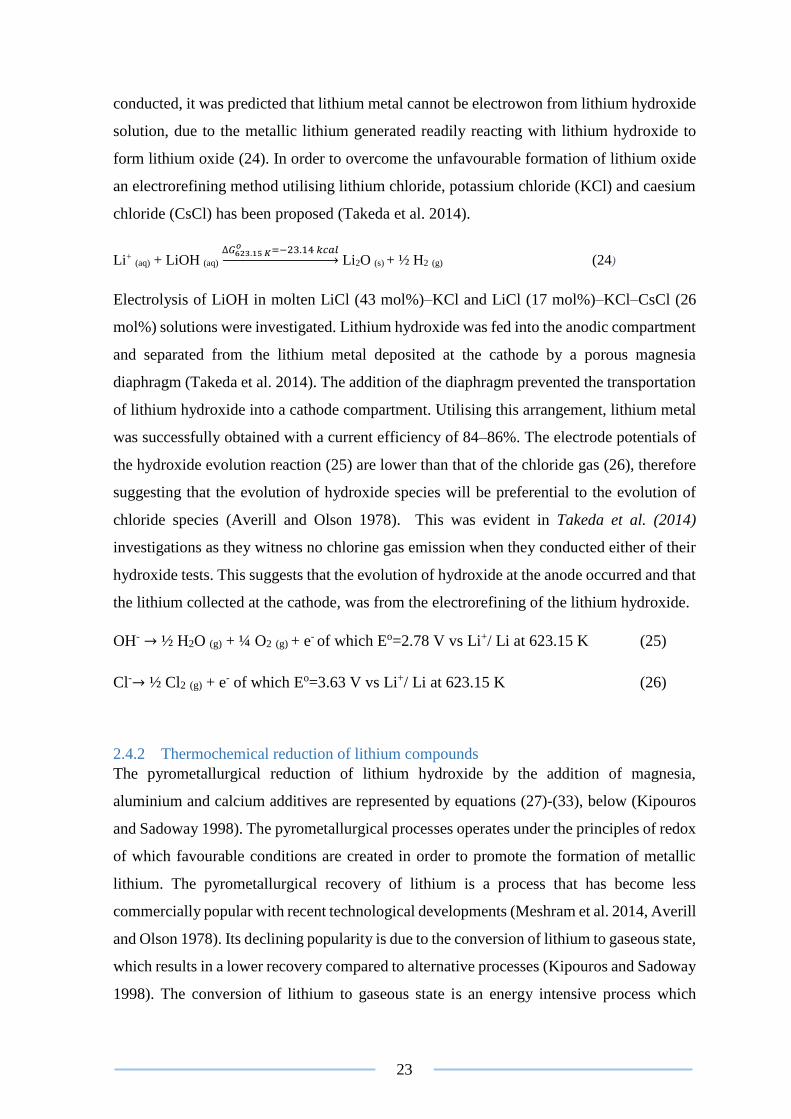
acceptably low, preventing the oxidation of the molten lithium (Figure 14). Other important
information regarding the operational conditions of the process include the current density
at 2 A/m2 and the predicted energy consumption which is estimated at 35 kWh/kg of lithium
refined (Tran and Luong 2015).
Li
22
Figure 13: Standard decomposition potential vs temperature of lithium electro refining system, adopted from Takeda et
al. (2014)
Figure 14: Partial pressures of O2 vs H2 and the corresponding lithium stability diagram, adopted from Takeda et al.
(2014)
Takeda et al. (2014) conducted an investigation into the electrowinning of metallic lithium
from lithium hydroxide in a molten chloride solution. From the thermodynamic studies
23
conducted, it was predicted that lithium metal cannot be electrowon from lithium hydroxide
solution, due to the metallic lithium generated readily reacting with lithium hydroxide to
form lithium oxide (24). In order to overcome the unfavourable formation of lithium oxide
an electrorefining method utilising lithium chloride, potassium chloride (KCl) and caesium
chloride (CsCl) has been proposed (Takeda et al. 2014).
Li+ (aq) + LiOH (aq) ∆𝐺623.15 𝐾
𝑜 =−23.14 𝑘𝑐𝑎𝑙→ Li2O (s) + ½ H2 (g) (24)
Electrolysis of LiOH in molten LiCl (43 mol%)–KCl and LiCl (17 mol%)–KCl–CsCl (26
mol%) solutions were investigated. Lithium hydroxide was fed into the anodic compartment
and separated from the lithium metal deposited at the cathode by a porous magnesia
diaphragm (Takeda et al. 2014). The addition of the diaphragm prevented the transportation
of lithium hydroxide into a cathode compartment. Utilising this arrangement, lithium metal
was successfully obtained with a current efficiency of 84–86%. The electrode potentials of
the hydroxide evolution reaction (25) are lower than that of the chloride gas (26), therefore
suggesting that the evolution of hydroxide species will be preferential to the evolution of
chloride species (Averill and Olson 1978). This was evident in Takeda et al. (2014)
investigations as they witness no chlorine gas emission when they conducted either of their
hydroxide tests. This suggests that the evolution of hydroxide at the anode occurred and that
the lithium collected at the cathode, was from the electrorefining of the lithium hydroxide.
OH- → ½ H2O (g) + ¼ O2 (g) + e- of which Eo=2.78 V vs Li+/ Li at 623.15 K (25)
Cl-→ ½ Cl2 (g) + e- of which Eo=3.63 V vs Li+/ Li at 623.15 K (26)
2.4.2 Thermochemical reduction of lithium compounds
The pyrometallurgical reduction of lithium hydroxide by the addition of magnesia,
aluminium and calcium additives are represented by equations (27)-(33), below (Kipouros
and Sadoway 1998). The pyrometallurgical processes operates under the principles of redox
of which favourable conditions are created in order to promote the formation of metallic
lithium. The pyrometallurgical recovery of lithium is a process that has become less
commercially popular with recent technological developments (Meshram et al. 2014, Averill
and Olson 1978). Its declining popularity is due to the conversion of lithium to gaseous state,
which results in a lower recovery compared to alternative processes (Kipouros and Sadoway
1998). The conversion of lithium to gaseous state is an energy intensive process which
24
requires the utilisation of a condenser in order to capture the lithium gas (Kipouros and
Sadoway 1998). With present technological capabilities, the recovery of lithium by
pyrometallurgical processes is estimated to be between 80%-95% efficient (Tran and Luong
2015). Recent studies have identified three methods of thermochemical reduction that have
displayed the most promise for the extraction of lithium. The carbothermic, oxide and
hydroxide reduction processes have been discussed and surmised below (Kipouros and
Sadoway 1998).
Carbothermic reduction utilises carbon as a reducing agent in order to produce gaseous
lithium (Halmann et al. 2012). The process is conducted in a furnace at a temperature range
between 1000-2100 K. The lithium gas produced is captured by a condensing system that is
operated in conjunction with the furnace. The carbothermic process has been identified to
work on both lithium oxide and lithium hydroxide feeds, represented by equations 27-29
below.
Li2O (s) + C (s) ∆𝐺2000 𝐾
𝑜 =−2.57 𝑘𝑐𝑎𝑙→ 2Li (g) + CO (g) (27)
6LiOH (aq) + 2C (s) ∆𝐺1600 𝐾
𝑜 =−0.65 𝑘𝑐𝑎𝑙→ 2Li (g) + 2Li2CO3 (s) + 3H2 (g) (28)
3LiOH (aq) + FeC2 (s) ∆𝐺2173 𝐾
𝑜 =−19.55 𝑘𝑐𝑎𝑙→ 3Li (g) + Fe (s) + 3/2H2 (g) + CO (g) + CO2 (g) (29)
Oxide reduction also known as the pigeon process, reduces lithium to the gaseous phase by
introducing calcium, silicon and aluminium additives as reducing agents (Pidgeon and
Touguri 1962). The formation of calcium silicate under reducing conditions (1500 K-1773
K) is preferential over the formation of solid lithium products, as displayed in equations 30
and 31 below. Therefore, lithium tends to be converted to gaseous state which reports to the
downstream condensing system.
2Li2O (s) + 2CaO (s) + Si (s) ∆𝐺1773𝐾
𝑜 =−2.81 𝑘𝑐𝑎𝑙→ 4Li (g) + Ca2SiO4 (s) (30)
3Li2O (s) + 2Al (s) ∆𝐺1673 𝐾
𝑜 =−9.19 𝑘𝑐𝑎𝑙→ 6Li (g) + Al2O3 (s) (31)
Hydroxide reduction utilises manganese and aluminium additives to reduce lithium to its
gaseous state (Kulifeev et al. 2007). This is conducted at temperatures ranging 353K – 1103
25
K. The process is conducted in a furnace of which the off gas is collected in a condenser and
metallic lithium recovered, as displayed by equations (32) and (33) below.
3LiOH (aq) + 2Mg (s) ∆𝐺353 𝐾
𝑜 =−0.633 𝑘𝑐𝑎𝑙→ 2Li (g) + 2MgO (s) + H2 (g) (32)
2LiOH (aq) + Al (s) ∆𝐺1103 𝐾
𝑜 =−0.455 𝑘𝑐𝑎𝑙→ Li (g) + LiAlO2 (s) (33)
Di et al. (2013) investigated the roasting of lithium carbonate under the influence of a
vacuumed atmosphere. Calcium oxide and aluminium oxide were added to the roasting
process as reducing agents. The feed mixture was initially roasted at 1073.15 K for 2 hours.
The roasted product consisted of a lithium aluminate calcine which was then pressure
briquetted and mixed with aluminate powder (34). This product was further roasted at
1423.15 K for approximately 3 hours, promoting the liberation of gaseous lithium (35). The
vacuum alumina-thermic reduction process liberated 95% of the lithium present which is
collected by a downstream condenser (Di et al. 2013).
Li2CO3 (s) + Al2O3 (s)
∆𝐺1073 𝐾𝑜 =−13.73 𝑘𝑐𝑎𝑙
→ 2LiAlO2 (s) + CO2 (g) (34)
3LiAlO2 (s) + 2CaO (s) + Al (s) →2[CaO.Al2O3] (s) + 3Li (g) (35)
Furthermore, Di et al. (2013) proposed a scheme utilising a coarse ferrosilicon-aluminium
alloy containing 28.83% aluminium and 41.10% silicon as a reductant to extract lithium
from lithium oxide (Tran and Luong 2015). It was reported that 95.26% of the total lithium
present was extracted, under the optimised conditions of 1273.15 K over the course of 3
hours (Di et al. 2013).
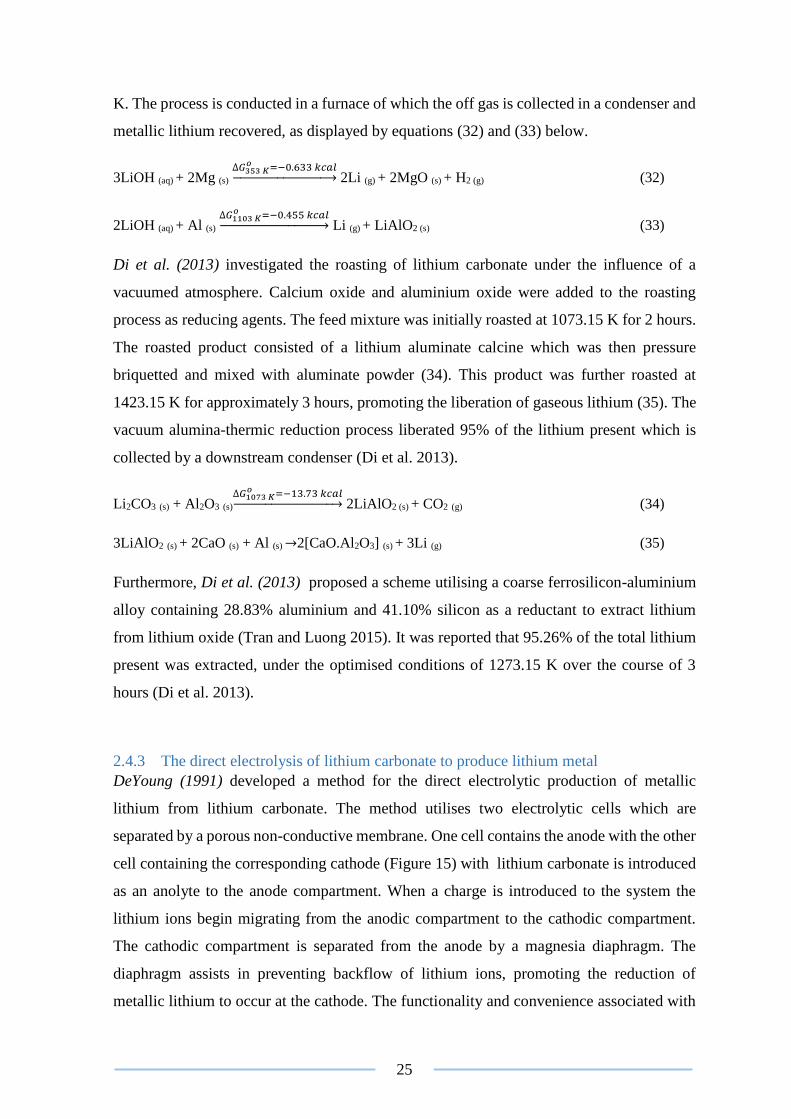
2.4.3 The direct electrolysis of lithium carbonate to produce lithium metal
DeYoung (1991) developed a method for the direct electrolytic production of metallic
lithium from lithium carbonate. The method utilises two electrolytic cells which are
separated by a porous non-conductive membrane. One cell contains the anode with the other
cell containing the corresponding cathode (Figure 15) with lithium carbonate is introduced
as an anolyte to the anode compartment. When a charge is introduced to the system the
lithium ions begin migrating from the anodic compartment to the cathodic compartment.
The cathodic compartment is separated from the anode by a magnesia diaphragm. The
diaphragm assists in preventing backflow of lithium ions, promoting the reduction of
metallic lithium to occur at the cathode. The functionality and convenience associated with
26
this refining method are the main constraints of the process, as only small quantities of
lithium can be efficiently refined.
Figure 15: Electrolytic cell setup for the direct production of lithium metal from lithium carbonate, adopted and altered
from DeYoung (1991)
DeYoung achieved a current efficiency of 89.09%, with the respective yield near 99.3% for
the test work conducted. Mitigating the formation of lithium oxide and carbon are essential
if the process is to be run efficiently. Both lithium oxide and carbon are present as by-
products in the electrolytic production of lithium metal (36). They exist as insoluble sludge
that forms in the cathodic cell, causing the efficiency of the process to decrease. DeYoung’s
utilisation of the magnesium diaphragm assisted in preventing the formation of sludge by
restricting the undesirable backflow of the lithium ions from the cathodic compartment.
Li+(aq) +Li2CO3 (s) →3Li2O (s) + C(s) (36)
The lithium carbonate present within the anolyte composed of 0.5 - 10 weight % of the
anolyte solution. Upon receiving a charge, the ions in solution begin migrating from the
anode towards the cathode. The anode consists of pure graphite which assists in promoting
the evolution of carbon dioxide at the anodic interface (38). The cathode utilised was made
from stainless steel, allowing for the deposition of metallic lithium to occur. This is
represented by equation (39) below.
Overall Cell reaction
2Li2CO3 (s) + C→ 4Li+ (s) + 3CO2 (g) of which Eo= 1.85 V (37)
27
Anodic reaction
2CO32-
(aq) + C (s) →3CO2 (g) + 4e- (38)
Cathodic Reaction
4Li+ (aq) + 4e- →4Li (s) (39)
The decomposition voltage for pure lithium carbonate is estimated to be 1.85 volts which
when diluted to a 1% standard solution becomes 2.2 volts. Lithium chloride deposition
comparatively is 3.46 volts at 923.15 K which is significantly higher than that of the
carbonate production method. As lithium carbonate is depleted in the cell, the cell voltage
will tend to rise. As a result, by monitoring the cell voltage one may obtain an indication of
whether the lithium carbonate concentration in the anolyte is within the desired range.
DeYoung (1991) electrolysis tests were optimised at 923 K and 140.26 Ampere’s for
approximately 6.05 hours. 32.36 grams of pure (>99.95%) lithium metal was recovered
from solution of which contained minor traces of impurities.
2.4.4 Lithium ion batteries
The cathode and electrolyte utilised in lithium ion batteries are considered fundamental
components. These components utilise three different lithium products, as a means to allow
redox flow within the battery to occur. The most common lithium products utilised in the
manufacturing of cathodic material are lithium cobalt oxide (LiCoO2) and lithium nickel
manganese cobalt oxide (Li0.33Ni0.33Mn0.33CoO2 or NMC) (Gains et al. 2011). The refining
process undertaken to produce these cathodic materials from lithium sources is discussed
below.
Cho et al. (2000) surmised the synthesising process that is undertaken to produce cathodic
battery grade material. The process identified by Cho et al outlined how lithium cobalt oxide
contains an energy dense medium which is capable of high functioning energy storage. The
synthesis of lithium cobalt oxide was originally developed by Gummow et al. (1992),
however as the market for LIB’s has expanded in recent years so too has the research into
refining lithium cobalt oxide. Cho et al outlines a refining method that is commercially
utilised in the direct production of lithium cobalt oxide from lithium hydroxide. Cho et al
explains that lithium cobalt oxide is produced by conducting a roast at 1173.15 K for 24
hours. The feed to the roast consists of a 1:1.05 ratio between lithium hydroxide and cobalt
28
oxide (Co3O4) (Cho et al. 2000). Lithium carbonate can be substituted into the roast in place
of lithium hydroxide, however it has been found to produce a lower grade product (Gains et
al. 2011). The roast product is then pulverised and screened to -63µm which is then
compressed into pellets at 4500 lb/inch. The reacted pellets are then re crushed, ground and
heated a second time under the presence of flowing oxygen at 1023.15 K for 16 hours. The
product is then pulverised and screened over -32 µm, of which it is then combined with
various binding agents to create the paste that covers the reactive face cathode (refer to
Appendix A3 – Lithium Ion Batteries).
The primary process for producing NMC cathodic material was surmised by Julien et al.
(2000). The ideal NMC cathodic material identified by Julien et al was formed via a
precipitation technique utilising metal acetates and lithium hydroxide as raw feed material.
This precipitate is then neutralized to a pH range of 5-6 with sodium hydroxide (NaOH) and
the solid/aqueous phases separated by filtration. The final refining step involves collecting
the solid residue from the filtration process and roasting it at 1173.15 K for approximately
3 hours. The roast product is then collected and pulverised to -32µm, which it is then
combined with various binding agents (refer to Appendix A3-Lithium Ion Batteries).
The other main component of lithium ion batteries that it utilises lithium products is the
electrolyte of which consists of a super saturated lithium hexafluorophosphate (LiPF6)
solution (Mayer 1999). Mao (1996) developed a simplified method for the synthesis of
LiPF6. Mao’s process utilises lithium hydride (LiH) and ammonium hexafluorophosphate
(NH4PF6) as reactants, of which are combined with solvents that consists of chain esters and
cyclic ester functional groups (refer to Appendix A3- Lithium Ion Batteries). In order to
produce lithium hydride, aqueous lithium hydroxide must first be combined with
magnesium power and heated to 823.15 K. This promotes the reaction represented by
equation (40) to occur (Alexander 1947).
LiOH (aq) + Mg (s) ∆𝐺823 𝐾
𝑜 =−43.04 𝑘𝑐𝑎𝑙→ MgO (s) + LiH (aq) (40)
The lithium hydride produced is then filtered, where the aqueous solution is collected and
combined with the ammonium hexafluorophosphate (Mao 1996). The mixture containing
the reactants is then combined with diethyl carbonate (DEC) and ethylene carbonate (EC)
solvents. The resulting solution is heated to 323.15 K which promotes the reaction
represented by equation (41). The electrolyte produced can be sparged with inert gasses
such as helium (He) as a means to drive off residual ammonia (Mao 1996). The resulting
29
electrolyte is suitable for use in lithium ion batteries without the need for additional
processing.
NH4PF6 (aq) + LiH (aq) 𝑠𝑜𝑙𝑣𝑒𝑛𝑡𝑠→ LiPF6 (aq) + NH3 (g) + H2 (g) (41)
30
2.5 Technological advances in lithium extraction from spodumene
Research into the more efficient extraction processes from hard rock lithium minerals has
been of much industrial interest since the commercial rise of LIB batteries (Kuang et al.
2018). A study conducted by Vikström et al. (2013) identified the rapid expansion of the
lithium market, with Jaskula (2017) confirming a 40% to 60% rise in the spot prices of
lithium carbonate worldwide, in 2015 alone . In order to capitalise on this growing industry,
research has been conducted into improving the efficiency of extracting lithium from
spodumene. The two most promising developments to date are the applications of high
pressure leaching and Lithium Australia’s SiLeach® (Lithium Australia 2016), which are
discussed in detail below.
2.5.1 High pressure leaching
The application of high pressure leaching conditions has been found to promote the
formation of valuable lithium products (Munoz 1969). This is achieved by the increased rate
of reaction induced by the high pressure environment (Free 2013). The improved physio-
chemical interactions and preferential thermodynamic conditions of the high pressure
environment, allows for the selective formation of desirable products to be achieved. The
mineralogical decomposition of the leach reactants occurs with respect to each minerals
redox potential (Fuerstenau and Han 2003). Often the cathodic portion of redox reactions
occur with respect to the oxygen present under the following conditions:
4H+ + 4e- + O2 ↔ 2H2O (Acidic pH) (42)
2H2O + 4e- + O2 ↔ 4OH (Alkaline pH) (43)
Thus mineral decomposition is often increased with increasing oxygen pressure. This
increased oxygen pressure further stimulates the reaction by increasing the rate of reaction,
by raising the activation energy (Free 2013). Investigations conducted by Nicholson (1946),
Chen et al. (2011) and Kuang et al. (2018) were found to successfully produce a lithium
product from a high pressure leach. These methods were derived around reducing the high
energy expenditure of current processing techniques, mitigating the use of toxic reagents
and simplifying sophisticated recovery schemes. An in-depth analysis of each process is
discussed in detail below.
31
2.5.1.1 Lithium hydroxide production utilising an alkaline pressurised digestion process
Nicholson (1946) investigated the pressurised leaching of β-spodumene under alkaline
conditions. An extraction of 84% lithia from β-spodumene was registered, with an overall
recovery of 1-4% lithium hydroxide reported. The process Nicholson derived was patented
in 1946, and is current utilised as a foundation for current lithium based research (Choubey
et al. 2016, Meshram et al. 2014).
Nicholson’s process highlights how a β-spodumene concentrate that is treated in a water
leach, with the addition of lime at 478.15 K and 17.27 Barr is able to produce a lithium
hydroxide product (44) (Nicholson 1946).
4β-LiAlSi2O6 (s)+2CaO (s)+9H2O (aq) ∆𝐺478 𝐾
𝑜 = −47.50 𝑘𝑐𝑎𝑙→ 4LiOH(aq)+2CaO.2Al2O3.8SiO2 (s) +7H2O (aq)
(44)
The leach product is then subject to filtration where the filtrate is collected, containing 1-4%
lithium hydroxide (Nicholson 1946). The filtrate is then evaporated to concentrate the
solution which is then sparged with carbon dioxide to precipitate lithium carbonate. The
product produced consists of 97.8 5 lithium carbonate (Choubey et al. 2016).
2.5.1.2 Lithium Carbonate Production Utilising Sodium Carbonate Autoclave Process
Chen et al. (2011) investigated the production of lithium carbonate utilising a sodium
carbonate additive. The reported process resulted in a 94% lithium carbonate conversion
efficiency, obtained under optimal operational conditions. The drawbacks of the process
involve the complexity and strict operational parameters preventing the process becoming
robust enough for commercial application (Kuang et al. 2018). This includes a complex and
expensive reagent scheme which needs to be addressed or simplified before commercial
application becomes viable (Guo et al. 2017).
α-spodumene in its natural inert state is converted to its reactive β phase in a muffle furnace
at 1323.15 K for 30 minutes (Chen et al. 2011). This is represent by equation 45 below.
α-Li2AlSi2O6 (s)
∆𝐺1323𝐾𝑜 =−0.45 𝑘𝑐𝑎𝑙
→ β-LiAlSi2O6 (s) (45)
The calcined β-spodumene is placed into the autoclave at a liquid/solid (L/S) ratio of 4 and
sodium/lithium ratio of 1.25 and heated at 278.15 K/min up to the operating temperature of
498.15 K. During the pressure leaching lithium carbonate (Li2CO3) and analcime
(NaAlSi2O6) slurry is formed (46) (Meshram et al. 2014, Chen et al. 2011).
32
2β-LiAlSi2O6 (s) + Na2CO3 (s) + 2H2O (aq) ∆𝐺498 𝐾
𝑜 =−6.17 𝑘𝑐𝑎𝑙→ Li2CO3 (s) + 2NaAlSi2O6.H2O (aq)
(46)
The slurry produced has its L/S ratio adjusted to 8 as it is leached in water and sparged with
carbon dioxide (CO2) at 0.5 L/min for 120 minutes. The resulting bicarbonate solution is
filtered and washed with dilute sulfuric acid and deionized water (DI). The lithium
bicarbonate filtrate is heated to 363.15 K for 120 minutes to drive off excess CO2. The
resulting slurry is re-filtered and lithium carbonate is recovered (Chen et al. 2011).
Li2CO3 (s) + CO2 (g) + H2O (aq) ∆𝐺298 𝐾
𝑜 =−8.48 𝑘𝑐𝑎𝑙→ 2LiHCO3 (aq) (47)
2LiHCO3 (aq) ∆𝐺363 𝐾
𝑜 = −1.25 𝑘𝑐𝑎𝑙→ Li2CO3 (s) + CO2 (g)+ H2O (aq) (48)
2.5.1.3 Lithium Sulfate Production Utilising Sodium Sulfate Additive in Autoclave Process
Kuang et al. (2018) investigated the production of lithium carbonate (Li2CO3), utilising a
sodium sulfate (Na2SO4) solution under high pressure leaching (HPL) conditions. The
addition of calcium oxide (CaO) and sodium hydroxide (NaOH) as leaching additives, and
their corresponding effect on the formation of lithium sulfate (Li2SO4) is also analysed.
Under the optimal conditions tested, Kuang et al determined that the highest lithium
extraction efficiency for CaO and NaOH was 93.30% and 90.70% respectively. The
drawbacks on the process involve the complex operating conditions and the high capital
expenditure required for the construction of downstream processing circuit, to produce a
lithium carbonate product.
The initial conversion of α-spodumene to its reactive β phase is conducted via calcination at
1373.15 K for approximately 1 hour (Kuang et al. 2018).
α-Li2AlSi2O6 (s)
∆𝐺1373 𝐾𝑜 =−0.45 𝑘𝑐𝑎𝑙
→ β-LiAlSi2O6 (s) (49)
Under the optimal conditions tested by Kuang the calcined β spodumene is leached in an
autoclave at: Na2SO4: Additive: ore mass ratio of 9:0.4:20, leaching temperature of 503.15
K, leaching time of 3 hours, liquid/ solid ratio of 7.5 mL/g and a particle size of 39.23 µm.
It was found that analcime residue (NaAlSi2O6) formed as a by product of the lithium sulfate
(Li2SO4) production (50).
2β-LiAlSi2O6 (s) + Na2SO4 (s) + 2H2O (aq) ∆𝐺503 𝐾
𝑜 = −1.61 𝑘𝑐𝑎𝑙→ 2NaAlSi2O6.H2O (s) + Li2SO4 (aq) (50)
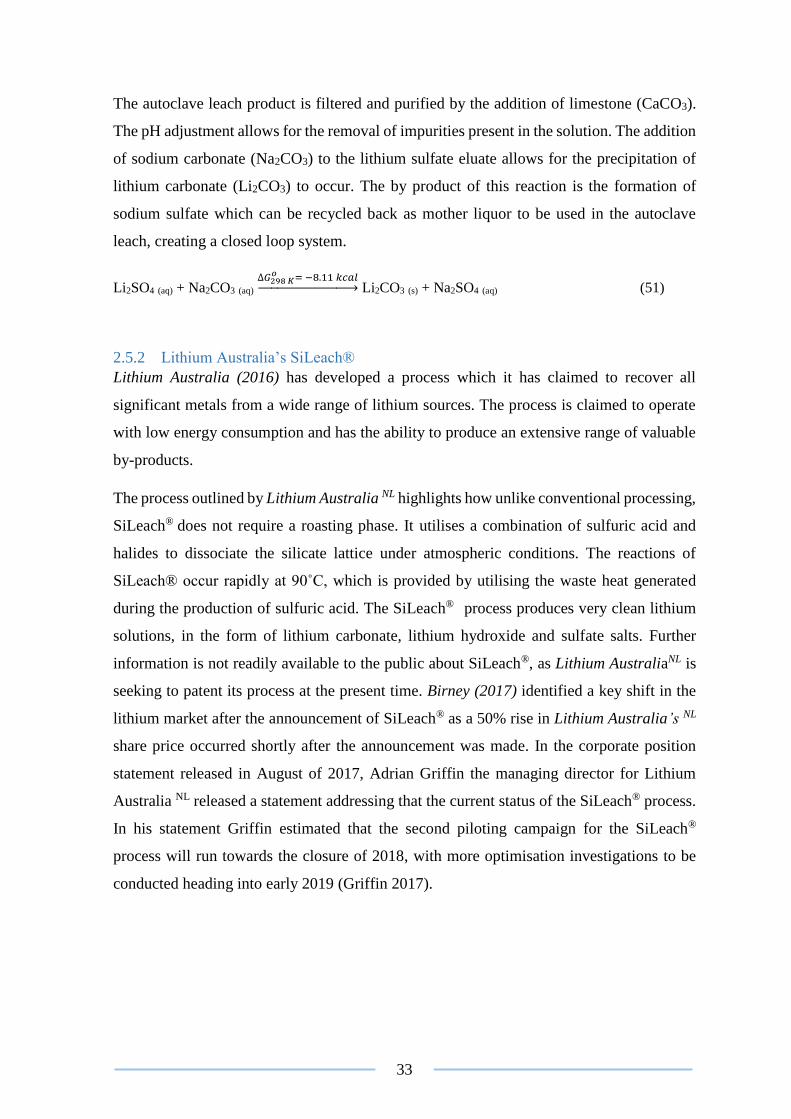
33
The autoclave leach product is filtered and purified by the addition of limestone (CaCO3).
The pH adjustment allows for the removal of impurities present in the solution. The addition
of sodium carbonate (Na2CO3) to the lithium sulfate eluate allows for the precipitation of
lithium carbonate (Li2CO3) to occur. The by product of this reaction is the formation of
sodium sulfate which can be recycled back as mother liquor to be used in the autoclave
leach, creating a closed loop system.
Li2SO4 (aq) + Na2CO3 (aq) ∆𝐺298 𝐾
𝑜 = −8.11 𝑘𝑐𝑎𝑙→ Li2CO3 (s) + Na2SO4 (aq) (51)
2.5.2 Lithium Australia’s SiLeach®
Lithium Australia (2016) has developed a process which it has claimed to recover all
significant metals from a wide range of lithium sources. The process is claimed to operate
with low energy consumption and has the ability to produce an extensive range of valuable
by-products.
The process outlined by Lithium Australia NL highlights how unlike conventional processing,
SiLeach® does not require a roasting phase. It utilises a combination of sulfuric acid and
halides to dissociate the silicate lattice under atmospheric conditions. The reactions of
SiLeach® occur rapidly at 90˚C, which is provided by utilising the waste heat generated
during the production of sulfuric acid. The SiLeach® process produces very clean lithium
solutions, in the form of lithium carbonate, lithium hydroxide and sulfate salts. Further
information is not readily available to the public about SiLeach®, as Lithium AustraliaNL is
seeking to patent its process at the present time. Birney (2017) identified a key shift in the
lithium market after the announcement of SiLeach® as a 50% rise in Lithium Australia’s NL
share price occurred shortly after the announcement was made. In the corporate position
statement released in August of 2017, Adrian Griffin the managing director for Lithium
Australia NL released a statement addressing that the current status of the SiLeach® process.
In his statement Griffin estimated that the second piloting campaign for the SiLeach®
process will run towards the closure of 2018, with more optimisation investigations to be
conducted heading into early 2019 (Griffin 2017).
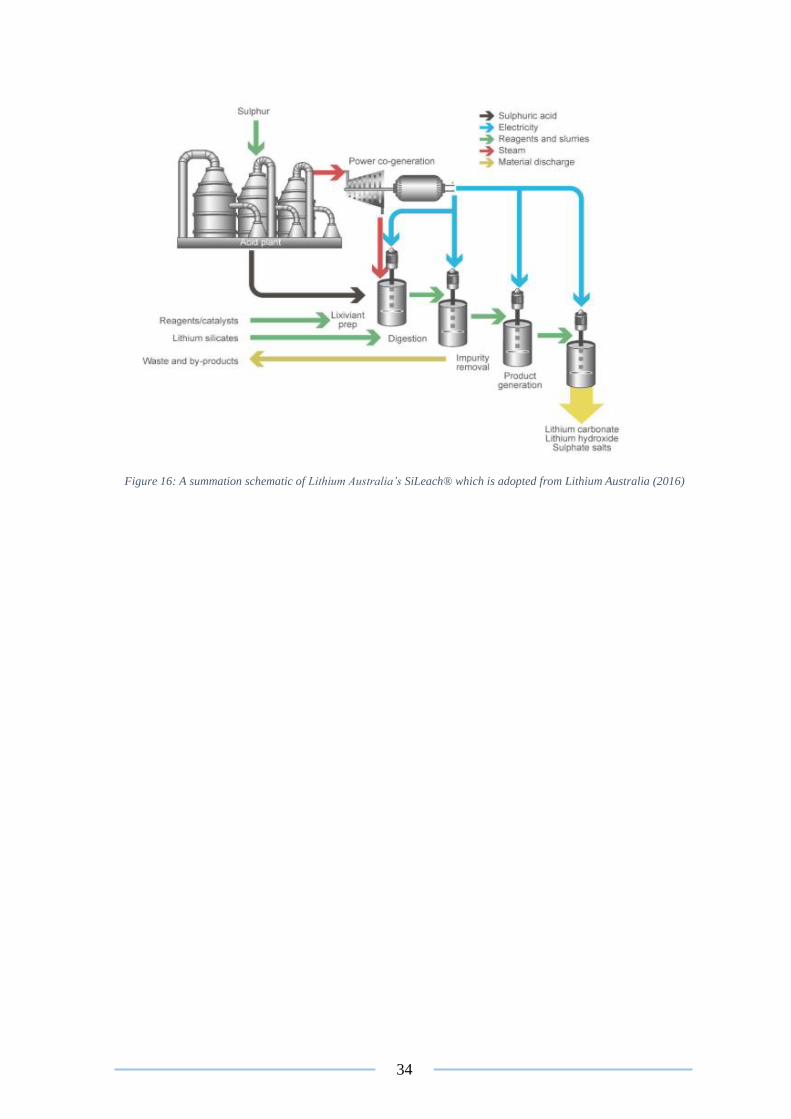
34
Figure 16: A summation schematic of Lithium Australia’s SiLeach® which is adopted from Lithium Australia (2016)
35
2.6 Summary and concluding remarks
The literature review conducted assisted in identifying key areas of interest with regards to
improving the efficiency of extracting lithium compounds from spodumene. The current
commercial practises of sulfation, carbonation and chlorination all contain intrinsic
drawbacks such as toxic operational environments, high reagent expenditures and complex
processing steps (Kuang et al. 2018). All processes utilise the energy intensive calcination
step of converting α-spodumene to its reactive β phase, of which if mitigated could provide
a means to produce more economical quantities of lithium products (Meshram et al. 2014).
Companies such as Lithium AustraliaNL (Griffin 2017) have recognised this and have already
began developing processing techniques that mitigate the utilisation of energy intense
processes.
The investigation of increasing the leaching efficiency of spodumene with hydrofluoric acid
provided promising results. The dissolution of α and β spodumene due to the influence of
hydrofluoric acid proved to be an efficient way of extracting lithium from the interlocking
silicate structures. However as often found when utilising hydrofluoric acid, the toxic nature
of the process limits its ability to become commercially applicable.
Lithium hydroxide appears to be the domain lithium product utilised in the production of
lithium ion batteries (Mao 1996, Walker 2015). Therefore, refinement and simplification of
extraction processes towards developing lithium hydroxide appear to be most appealing to
the lithium market moving forward. Lithium carbonate is still the most robust of the lithium
compounds in current commercial production. However, in foresight the mitigation of
carbon dioxide produced by processing lithium carbonate has to be addressed sufficiently,
if it is to remain a sustainable option moving in the renewables future.
Recent technological advances regarding the Lithium AustraliaNL SiLeach® display a lot of
promise based off the marketing statements made (Griffin 2017). The actual efficiency of
the process isn’t fully accessible until the patent is approved and released to the public
domain. The application of high pressure systems appears to be area worthy of further
research, with the journal articles assessed in this literature review producing promising
results. The application of a high pressure system promotes unique leaching kinetics, which
has the potential to address the limitations of current processes for extracting all of the
valuable metals that exist in spodumene ores.
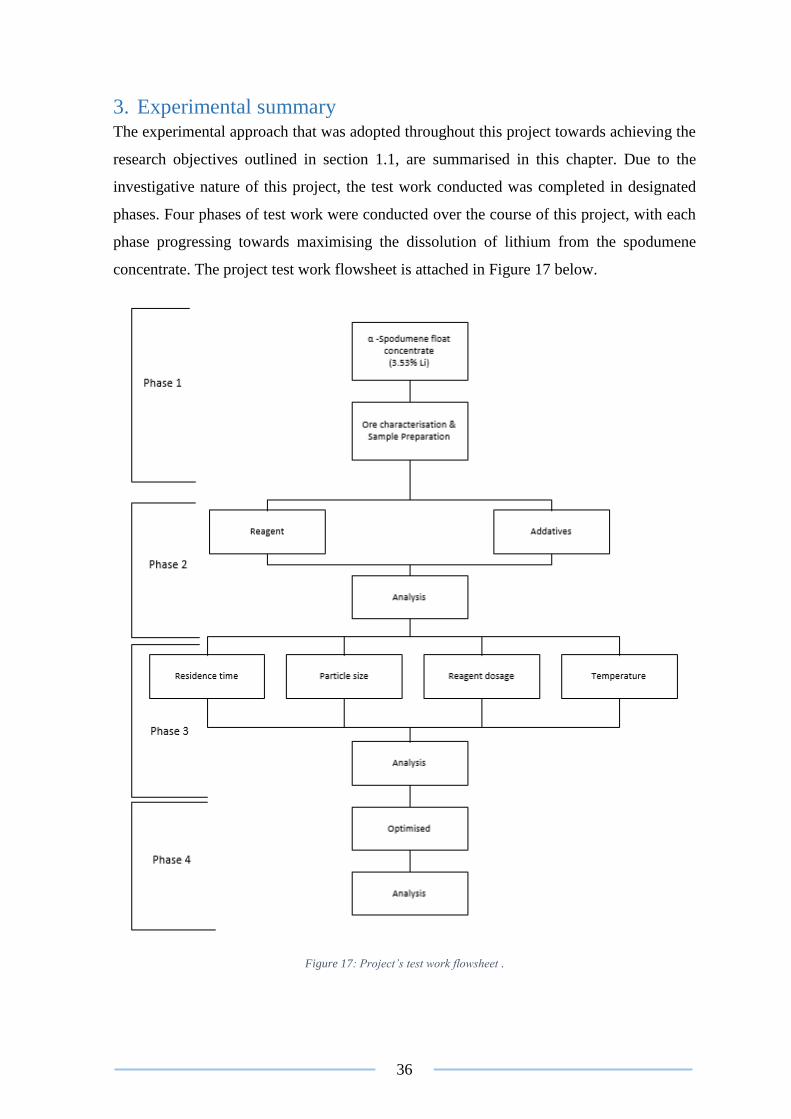
36
3. Experimental summary The experimental approach that was adopted throughout this project towards achieving the
research objectives outlined in section 1.1, are summarised in this chapter. Due to the
investigative nature of this project, the test work conducted was completed in designated
phases. Four phases of test work were conducted over the course of this project, with each
phase progressing towards maximising the dissolution of lithium from the spodumene
concentrate. The project test work flowsheet is attached in Figure 17 below.
Figure 17: Project’s test work flowsheet .
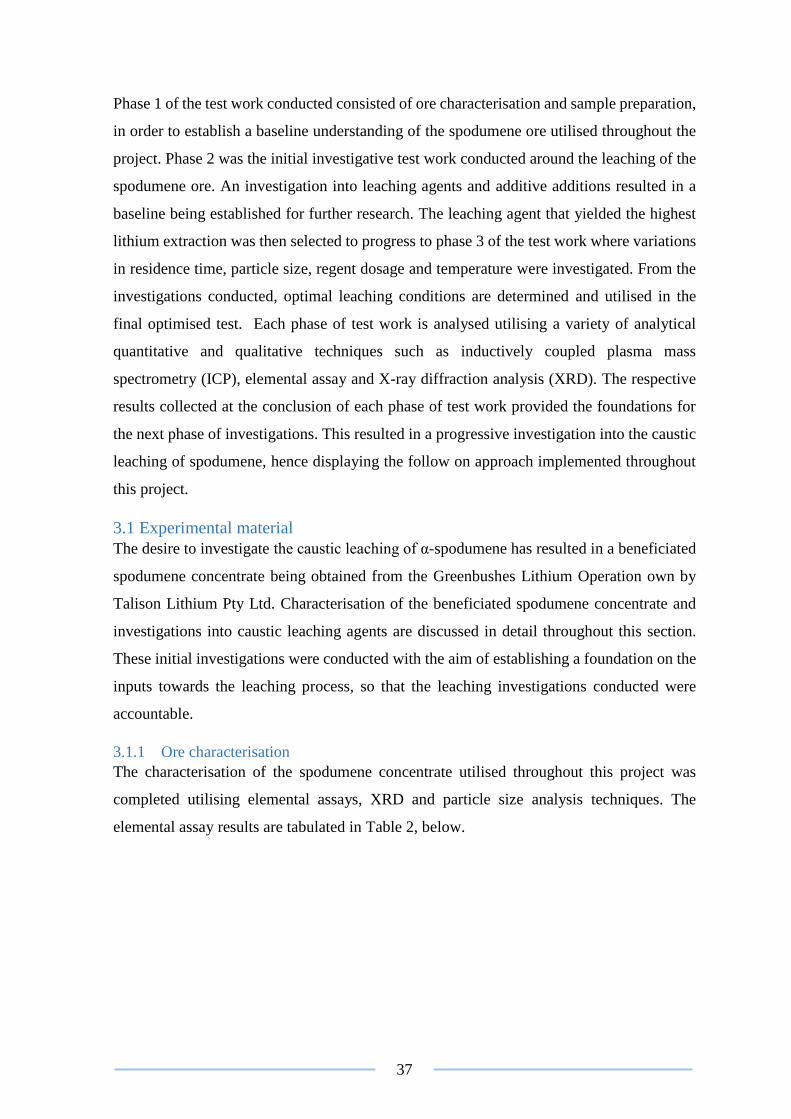
37
Phase 1 of the test work conducted consisted of ore characterisation and sample preparation,
in order to establish a baseline understanding of the spodumene ore utilised throughout the
project. Phase 2 was the initial investigative test work conducted around the leaching of the
spodumene ore. An investigation into leaching agents and additive additions resulted in a
baseline being established for further research. The leaching agent that yielded the highest
lithium extraction was then selected to progress to phase 3 of the test work where variations
in residence time, particle size, regent dosage and temperature were investigated. From the
investigations conducted, optimal leaching conditions are determined and utilised in the
final optimised test. Each phase of test work is analysed utilising a variety of analytical
quantitative and qualitative techniques such as inductively coupled plasma mass
spectrometry (ICP), elemental assay and X-ray diffraction analysis (XRD). The respective
results collected at the conclusion of each phase of test work provided the foundations for
the next phase of investigations. This resulted in a progressive investigation into the caustic
leaching of spodumene, hence displaying the follow on approach implemented throughout
this project.
3.1 Experimental material
The desire to investigate the caustic leaching of α-spodumene has resulted in a beneficiated
spodumene concentrate being obtained from the Greenbushes Lithium Operation own by
Talison Lithium Pty Ltd. Characterisation of the beneficiated spodumene concentrate and
investigations into caustic leaching agents are discussed in detail throughout this section.
These initial investigations were conducted with the aim of establishing a foundation on the
inputs towards the leaching process, so that the leaching investigations conducted were
accountable.
3.1.1 Ore characterisation
The characterisation of the spodumene concentrate utilised throughout this project was
completed utilising elemental assays, XRD and particle size analysis techniques. The
elemental assay results are tabulated in Table 2, below.
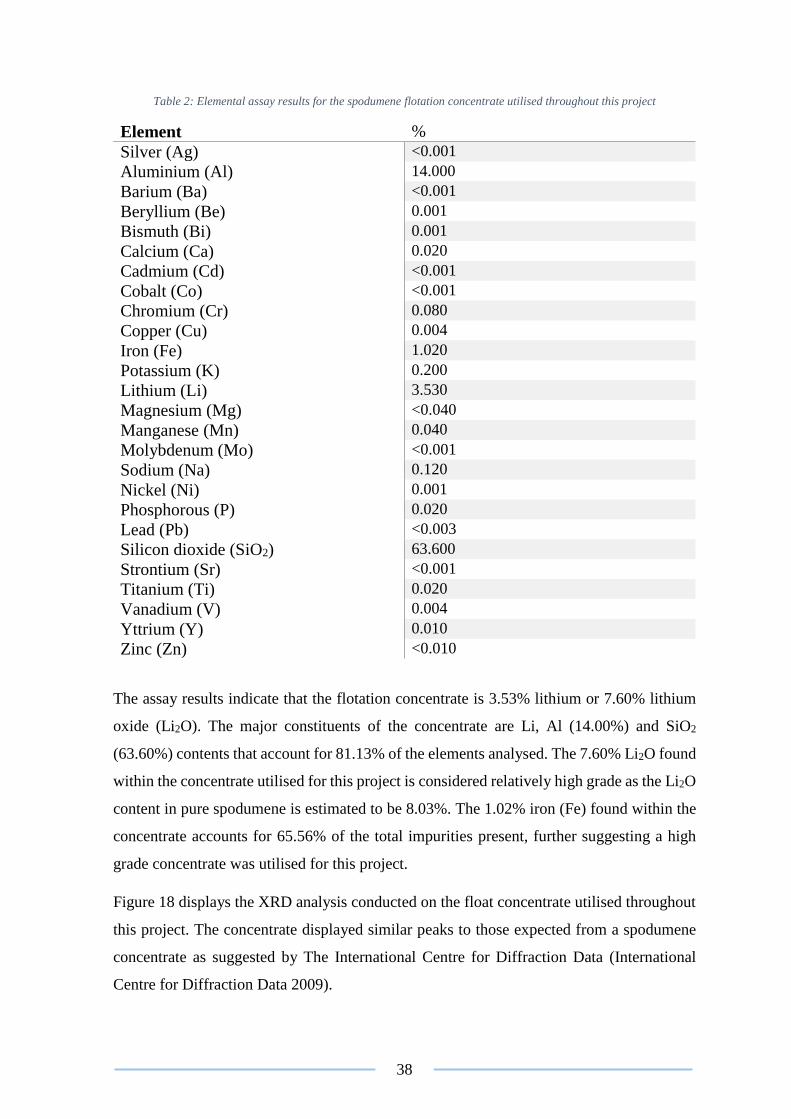
38
Table 2: Elemental assay results for the spodumene flotation concentrate utilised throughout this project
Element %
Silver (Ag) <0.001
Aluminium (Al) 14.000
Barium (Ba) <0.001
Beryllium (Be) 0.001
Bismuth (Bi) 0.001
Calcium (Ca) 0.020
Cadmium (Cd) <0.001
Cobalt (Co) <0.001
Chromium (Cr) 0.080
Copper (Cu) 0.004
Iron (Fe) 1.020
Potassium (K) 0.200
Lithium (Li) 3.530
Magnesium (Mg) <0.040
Manganese (Mn) 0.040
Molybdenum (Mo) <0.001
Sodium (Na) 0.120
Nickel (Ni) 0.001
Phosphorous (P) 0.020
Lead (Pb) <0.003
Silicon dioxide (SiO2) 63.600
Strontium (Sr) <0.001
Titanium (Ti) 0.020
Vanadium (V) 0.004
Yttrium (Y) 0.010
Zinc (Zn) <0.010
The assay results indicate that the flotation concentrate is 3.53% lithium or 7.60% lithium
oxide (Li2O). The major constituents of the concentrate are Li, Al (14.00%) and SiO2
(63.60%) contents that account for 81.13% of the elements analysed. The 7.60% Li2O found
within the concentrate utilised for this project is considered relatively high grade as the Li2O
content in pure spodumene is estimated to be 8.03%. The 1.02% iron (Fe) found within the
concentrate accounts for 65.56% of the total impurities present, further suggesting a high
grade concentrate was utilised for this project.
Figure 18 displays the XRD analysis conducted on the float concentrate utilised throughout
this project. The concentrate displayed similar peaks to those expected from a spodumene
concentrate as suggested by The International Centre for Diffraction Data (International
Centre for Diffraction Data 2009).
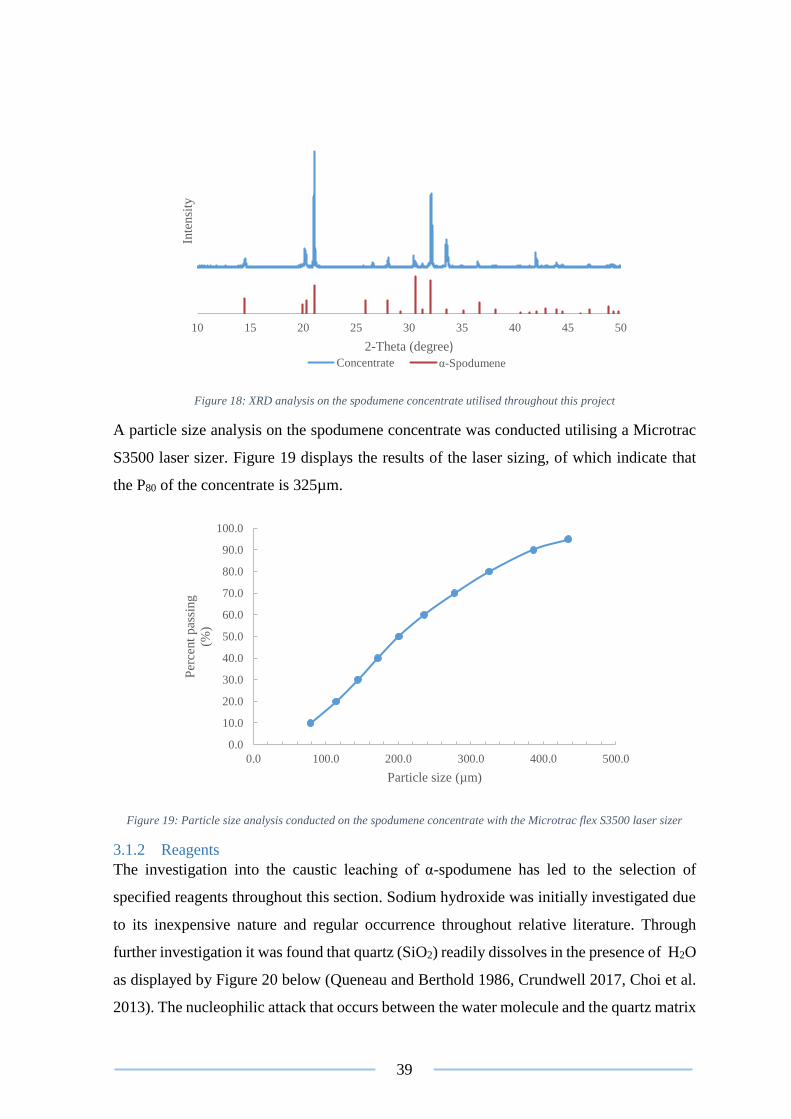
39
Figure 18: XRD analysis on the spodumene concentrate utilised throughout this project
A particle size analysis on the spodumene concentrate was conducted utilising a Microtrac
S3500 laser sizer. Figure 19 displays the results of the laser sizing, of which indicate that
the P80 of the concentrate is 325µm.
Figure 19: Particle size analysis conducted on the spodumene concentrate with the Microtrac flex S3500 laser sizer
3.1.2 Reagents
The investigation into the caustic leaching of α-spodumene has led to the selection of
specified reagents throughout this section. Sodium hydroxide was initially investigated due
to its inexpensive nature and regular occurrence throughout relative literature. Through
further investigation it was found that quartz (SiO2) readily dissolves in the presence of H2O
as displayed by Figure 20 below (Queneau and Berthold 1986, Crundwell 2017, Choi et al.
2013). The nucleophilic attack that occurs between the water molecule and the quartz matrix
10 15 20 25 30 35 40 45 50
Inte
nsi
ty
2-Theta (degree)Concentrate α-Spodumene
0.0
10.0
20.0
30.0
40.0
50.0
60.0
70.0
80.0
90.0
100.0
0.0 100.0 200.0 300.0 400.0 500.0
Per
cent
pas
sing
(%)
Particle size (µm)
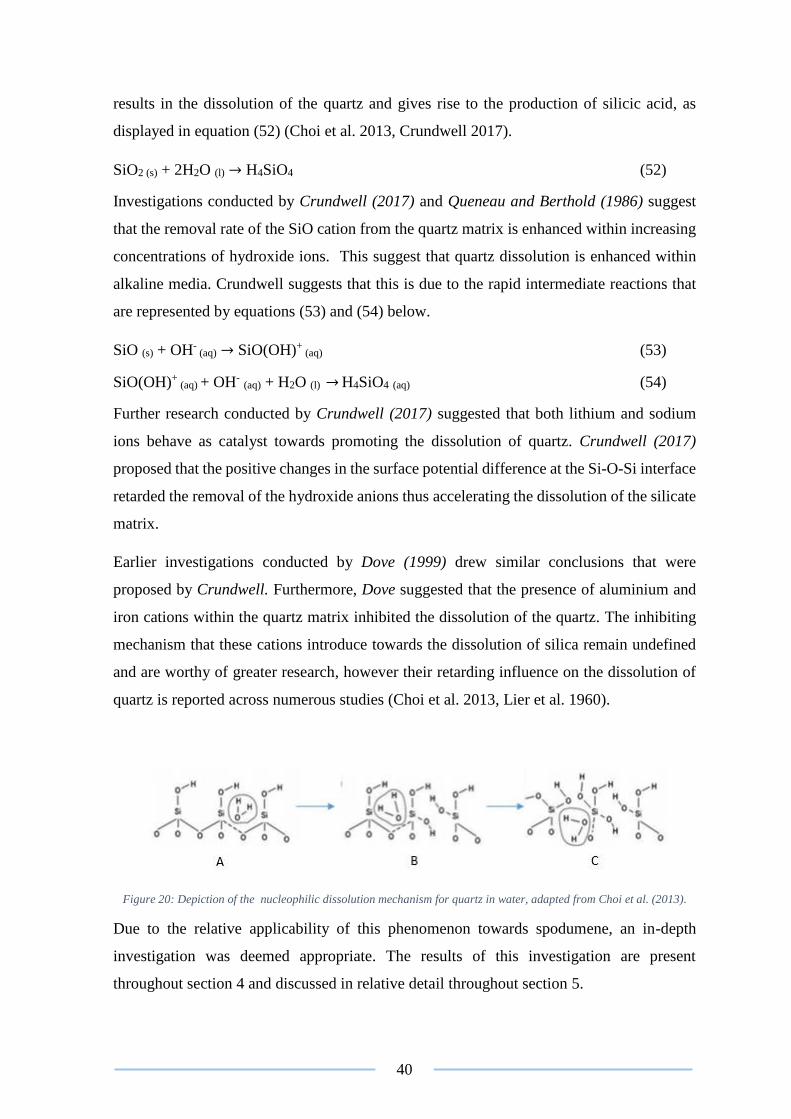
40
results in the dissolution of the quartz and gives rise to the production of silicic acid, as
displayed in equation (52) (Choi et al. 2013, Crundwell 2017).
SiO2 (s) + 2H2O (l) → H4SiO4 (52)
Investigations conducted by Crundwell (2017) and Queneau and Berthold (1986) suggest
that the removal rate of the SiO cation from the quartz matrix is enhanced within increasing
concentrations of hydroxide ions. This suggest that quartz dissolution is enhanced within
alkaline media. Crundwell suggests that this is due to the rapid intermediate reactions that
are represented by equations (53) and (54) below.
SiO (s) + OH- (aq) → SiO(OH)+
(aq) (53)
SiO(OH)+ (aq) + OH- (aq) + H2O (l) → H4SiO4 (aq) (54)
Further research conducted by Crundwell (2017) suggested that both lithium and sodium
ions behave as catalyst towards promoting the dissolution of quartz. Crundwell (2017)
proposed that the positive changes in the surface potential difference at the Si-O-Si interface
retarded the removal of the hydroxide anions thus accelerating the dissolution of the silicate
matrix.
Earlier investigations conducted by Dove (1999) drew similar conclusions that were
proposed by Crundwell. Furthermore, Dove suggested that the presence of aluminium and
iron cations within the quartz matrix inhibited the dissolution of the quartz. The inhibiting
mechanism that these cations introduce towards the dissolution of silica remain undefined
and are worthy of greater research, however their retarding influence on the dissolution of
quartz is reported across numerous studies (Choi et al. 2013, Lier et al. 1960).
Figure 20: Depiction of the nucleophilic dissolution mechanism for quartz in water, adapted from Choi et al. (2013).
Due to the relative applicability of this phenomenon towards spodumene, an in-depth
investigation was deemed appropriate. The results of this investigation are present
throughout section 4 and discussed in relative detail throughout section 5.
41
3.1.2.1 Sodium hydroxide
Sodium hydroxide (NaOH), also known as caustic soda is an inorganic hydroscopic
compound that consists of a sodium cation (Na+) and hydroxide anion (OH-). Due to the
highly soluble nature of the compound, it is often utilised as a strong caustic base within the
pharmaceutical, manufacturing and mining industries (Zumdahl 2013). Sodium hydroxide
reacts exothermically when it comes into contact with water. The exothermic reaction that
occurs is due to the dissociation of the sodium and hydroxide ions, resulting in an alkaline
solution.
ThermoFisher Scientific’s Ajax Finechem sodium hydroxide mini pearls were utilised as
leaching agents throughout this project. Manufactured for analytical purposes the individual
assays for each of the 500g containers utilised throughout this project guaranteed a minimum
purity of 97% NaOH (ThermoFisher 2015). The significant impurities included sodium
carbonate (1.5%), potassium (0.1%) and phosphate (0.05%) species all of which were
maintained below their specified maximum quantities.
3.2 Equipment
The leaching component of this project was conducted utilising an autoclave so that
pressurised leaching conditions could be investigated. Solid-liquid separation of the leach
product is conducted utilising a Buchner funnel that operates under the influence of vacuum.
Relevant solid and liquid samples are collected for analysis and storage. Supporting
equipment utilised throughout this project including relevant meters, probes and ancillary
equipment are discussed in greater detail in Appendix B1-equipment.
3.2.1 Autoclave
A Parr® series 4523 stirred reactor was utilised as the leaching vessel for the entirety of this
project. The autoclave setup consisted of two main components that consisted of a one litre
autoclave with an Alloy 400 lining and a fixed reactor head that held the cooling coil,
magnetic stirrer and sealing gasket. The Alloy 400 clave-lining consists of two-thirds nickel
and one-third copper that is high resistant to caustic environments (Parr Instrument
Company 2009). The Polytetrafluoroethylene (PTFE) gasket that seals the clave to the fixed
reactor head allowed for leaching operations to be conducted at a maximum operating
threshold of 623.15 K and 20,000 kPa, hence providing a means to investigate volatile
leaching systems.
A Parr® 4848 modular PID controller was utilised to control the operating temperature,
pressure and stirring rate of the autoclave. The 4848 controller utilised throughout the project
42
managed to maintain the operating temperature of the autoclave within ± 5 K of the set point.
The magnetic stirrer was maintained at a constant 300 rpm to ensure sufficient mixing
conditions and minimise vortexing. The operating pressure of the system was directly
proportional to the operating temperature and hence was directly influenced by the
temperature controller. Safety equipment such as the burst disk line and the pressure dead
head node were isolated and operated as independent systems in order to ensure a relativity
safer operating environment for the technicians. A diagram of the 4523 reactor and 4848
controller utilised throughout this project can be seen in Figure 48, found in Appendix B.
3.3 Test work methodology
The project was initially broken down into four phases of test work as illustrated in Figure
17, above. The sample preparation and ore characterisation of the spodumene concentrate
utilised as feed material for the leaching operation was initially investigated before any leach
tests were conducted. The characterisation of the spodumene concentrate included a 26
element assay suite, an XRD analysis and a particle size analysis of which can be evaluated
in section 3.1.
Once characterised the spodumene concentrate was quantitatively riffle split into 13
representative sub samples ready to be utilised as feed material for the leaching
investigation. The methodology for the leaching test work conducted is summarised in
section 3.3.2. The respective solid residues and leach liquors for each leach conducted were
collected and sub sampled for analysis. The analysis of the leach products included:
elemental assays, XRD analysis of the solids residues, ICP analysis of the leach solutions
and SEM imaging, of which is all discussed in section 4.
Throughout the life of the project the relative success of the investigations conducted were
based around the overall accountability of the results collected, with the extraction efficiency
of the lithium a targeted objective rather than an indicator for success.
3.3.1 Sample preparation
The concentrate utilised throughout the project was a 1.5-kilogram charge of spodumene
concentrate, that consisted of 3.53% lithium. A 1-kilogram charge was initially riffle split
into 13 separate 80 gram charges. These 80 gram charges were utilised as the feed material
for the leaching process. An initial sizing analysis was conducted utilising a Microtrac flex
S3500 laser sizer, recording a P80 of 325µm, of which was directly utilised as feed material
to the leaching process.
43
Two of the 80-gram flotation concentrates were milled to a P80 of 106µm and 32µm
respectively. These chargers were utilised to investigate the influence of particle size on the
extraction of lithium under the specified leaching conditions. All charges were then stored
in the laboratory at ambient temperature, ready for the leaching operation. A 80-gram sub
sample of the remaining concentrate was riffled out from the remaining sample and analysed
for its moisture content. The moisture analysis was conducted in duplicate to establish a
moisture content of the concentrate ore utilised as feed material for the life of the project.
The feed moisture analysis was conducted in a commercial laboratory where a weighed (to
four decimal places) quantity of concentrate was placed in a sealed container and left in a
343.15 K oven for 72 hours. The sample was removed after the 72-hour period and a post
mass collected, accounting for any excess water that may have existed within silicate lattice
the concentrate.
3.3.2 Leaching methodology
A Parr® series 4523 stirred reactor was utilised as the leaching vessel throughout this project.
Prior to the leaching operation commencing a pre-check and pressure test were conducted
on all the relevant leaching equipment, as to ensure the vessel was safe for operation.
The autoclave was initially charged with NaOH solution and α-spodumene concentrate with
the resulting slurry having its mass, pH and Eh recorded. Once charged the autoclave was
fixed to the reactor head and pressurised to 1000 kPa with a BOC gas cylinder (Linde Group
2018). The warm up sequence was initiated once the vessel had stabilised at 1000 kPa. The
heating sequence occurs at 278.15 K/ min to the specified operating temperature, of which
the 4848 PID controller utilised maintains within a ± 5 K operating range. The system was
allowed to operate under constant temperature and pressure over the course of a range of
specified residence times. At the end of the experiment, the autoclave was cooled to 323.15
K by recirculating cooled water through the cooling coil and the contents of the autoclave is
discharged.
The post weight of the clave was recorded prior to the contents of the autoclave being filtered
via a Buchner filter. Two WhatmanTM grade 1 filter papers are utilised throughout the
filtration process. The filtrate collected during the initial filtration process had its density,
pH and Eh values recorded and a sub sample was collected for solution assay. The solids are
then washed two times with 1 litre of de-ionised water (DI) in order to wash away any excess
alkali. A sub sample of the wash solution is collected and the remaining is discarded. After
the two DI washes the solids are collected, dried and weighed prior to being blended,

44
homogenised and split for analysis. A test work flowsheet displaying the steps taken during
a leach test is attached in Appendix B1.
3.4 Analysis techniques
Throughout the life of this project, analytical techniques were utilised to qualitatively
analyse the spodumene concentrate and leaching products. A combination of a peroxide
fusion digest and ICP-MS were utilised for elemental analysis. X-ray powder diffraction
(XRD) was deemed appropriate for mineralogical analysis due to the crystalline nature of
the leach materials. SEM scanning was conducted in order to characterise the leach feed and
residues while forming conclusions on the leaching mechanisms that occurred throughout
the process.
3.4.1 Elemental assays
Elemental assays were conducted on all feed material and leach products that were utilised
throughout this project. The ICP-MS data was then converted to standardised data and
implemented in relevant calculations that assessed the extraction efficiency of the leach
process. The resulting data is displayed throughout section 4 with the relevant tabulated data
and process methodology found in Appendix B2.
3.4.1.1 Solid residue assays
A peroxide fusion digest was conducted prior to being analysed by inductive coupled plasma
mass spectrometry. The peroxide fusion was conducted utilising a sodium peroxide (Na2O2)
flux and a ventilated furnace. Once the sample underwent heat treatment it was allowed to
cool. The product from the fusion process was then dissolved in dilute acidic solution at a
5:100 ratio and applied directly the ICP-MS for elemental analysis. The elements analysed
throughout this project include: lithium, potassium, silicon and sodium with two of the
optimised tests also incorporating a copper and aluminium analysis.
3.4.1.2 Solution assays
All the leach liquors throughout this project were analysed via direct spray dilution applied
directly to an ICP-MS machine. The solution assays were analysed for lithium, silicon,
sodium and potassium contents, with the optimised tests also incorporating a copper and
aluminium analysis.
3.4.2 X-ray diffraction analysis
X-Ray powder diffraction analysis was utilised to characterise the spodumene concentrate
and leach residues. XRD evaluates the electromagnetic backscatter collected off crystalline
compounds at specific angles of incidence and various electromagnetic intensities
45
(International Union of Crystallography 1999). The diffraction pattern generated by the
crystalline powders is unique to specific compounds inter atomic molecular arrangements,
allowing for identification to occur when compared to certified reference patterns. The
ICDD’s data base was utilised as the reference material for this project, with the results
generated displayed in section 4.2.1 and discussed in detail throughout section 5.
The XRD analysis utilised a 10° to 50° range of analysis as it was evaluated that most of the
prominent ‘peaks’ of spodumene and relevant lithium compounds occurred within this range
(Botto 1985, International Centre for Diffraction Data 2009). The operational methodology
utilised for this phase of the test work is discussed in further detail in Appendix B1-
Supporting equipment section.
3.4.3 Scanning electron microscopy
Scanning electron microscopy (SEM) was utilised to visually analyse the spodumene
concentrate and selected leach residues throughout this project. The external morphology,
orientation and crystalline structures of the specific samples were analysed and compared
against literature sources with the objective of further understanding the physical alterations
that have occurred within the leaching process.
A bench top JEOL JCM-6000 SEM was utilised to complete this task, where samples were
set in a carbon coated holders prior to SEM analysis. These samples were observed in the
secondary electron mode with an acceleration voltage of 5 kV. A comparative analysis on
the images collected against various sources of literature is discussed in detail throughout
section 4.2 and 5.
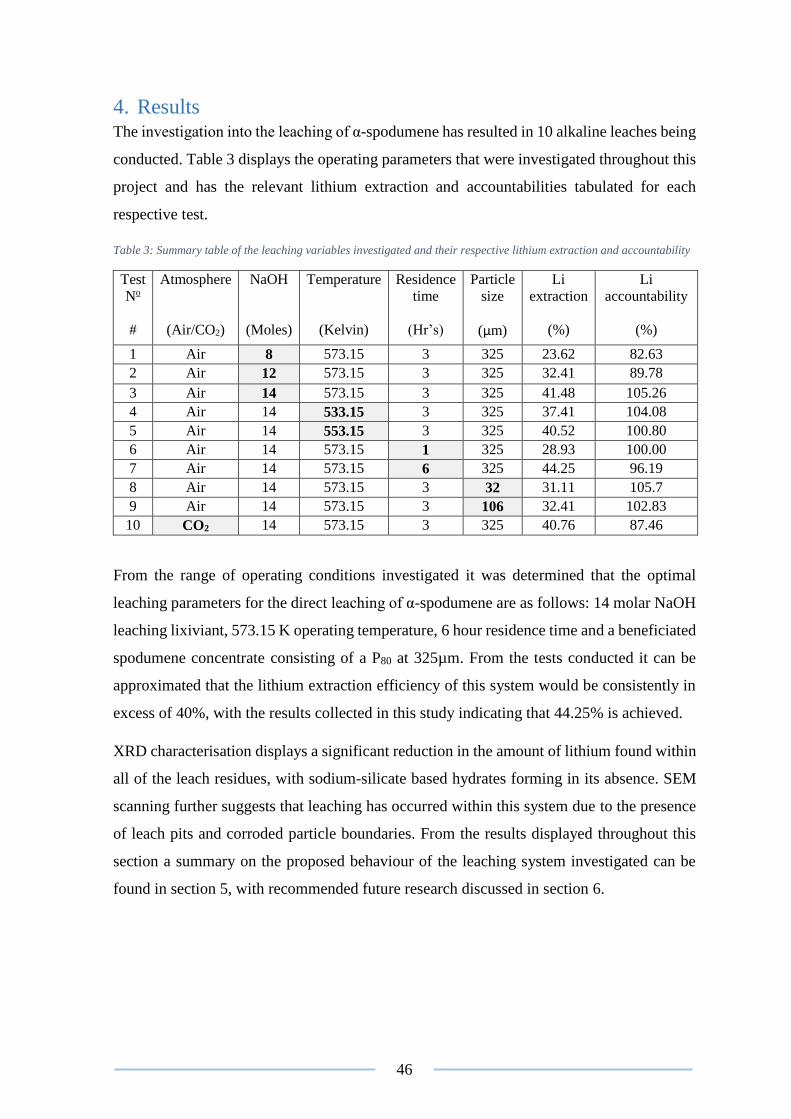
46
4. Results The investigation into the leaching of α-spodumene has resulted in 10 alkaline leaches being
conducted. Table 3 displays the operating parameters that were investigated throughout this
project and has the relevant lithium extraction and accountabilities tabulated for each
respective test.
Table 3: Summary table of the leaching variables investigated and their respective lithium extraction and accountability
Test
No
#
Atmosphere
(Air/CO2)
NaOH
(Moles)
Temperature
(Kelvin)
Residence
time
(Hr’s)
Particle
size
(µm)
Li
extraction
(%)
Li
accountability
(%)
1 Air 8 573.15 3 325 23.62 82.63
2 Air 12 573.15 3 325 32.41 89.78
3 Air 14 573.15 3 325 41.48 105.26
4 Air 14 533.15 3 325 37.41 104.08
5 Air 14 553.15 3 325 40.52 100.80
6 Air 14 573.15 1 325 28.93 100.00
7 Air 14 573.15 6 325 44.25 96.19
8 Air 14 573.15 3 32 31.11 105.7
9 Air 14 573.15 3 106 32.41 102.83
10 CO2 14 573.15 3 325 40.76 87.46
From the range of operating conditions investigated it was determined that the optimal
leaching parameters for the direct leaching of α-spodumene are as follows: 14 molar NaOH
leaching lixiviant, 573.15 K operating temperature, 6 hour residence time and a beneficiated
spodumene concentrate consisting of a P80 at 325µm. From the tests conducted it can be
approximated that the lithium extraction efficiency of this system would be consistently in
excess of 40%, with the results collected in this study indicating that 44.25% is achieved.
XRD characterisation displays a significant reduction in the amount of lithium found within
all of the leach residues, with sodium-silicate based hydrates forming in its absence. SEM
scanning further suggests that leaching has occurred within this system due to the presence
of leach pits and corroded particle boundaries. From the results displayed throughout this
section a summary on the proposed behaviour of the leaching system investigated can be
found in section 5, with recommended future research discussed in section 6.
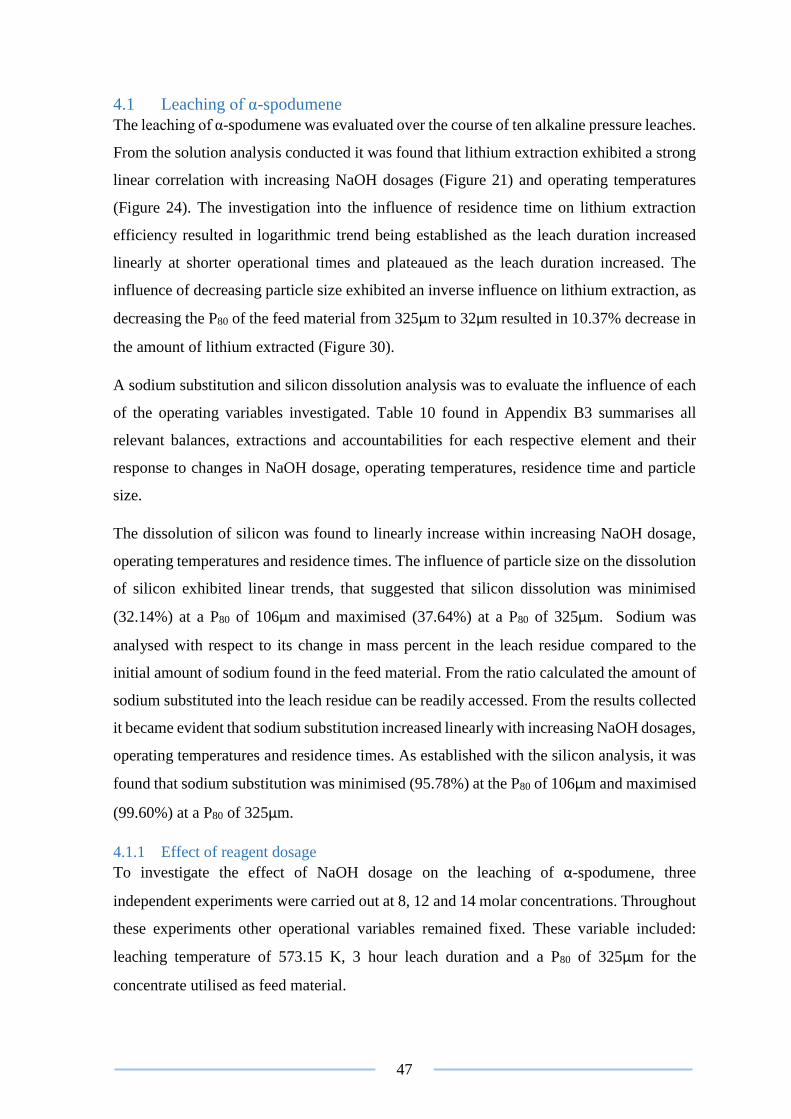
47
4.1 Leaching of α-spodumene
The leaching of α-spodumene was evaluated over the course of ten alkaline pressure leaches.
From the solution analysis conducted it was found that lithium extraction exhibited a strong
linear correlation with increasing NaOH dosages (Figure 21) and operating temperatures
(Figure 24). The investigation into the influence of residence time on lithium extraction
efficiency resulted in logarithmic trend being established as the leach duration increased
linearly at shorter operational times and plateaued as the leach duration increased. The
influence of decreasing particle size exhibited an inverse influence on lithium extraction, as
decreasing the P80 of the feed material from 325µm to 32µm resulted in 10.37% decrease in
the amount of lithium extracted (Figure 30).
A sodium substitution and silicon dissolution analysis was to evaluate the influence of each
of the operating variables investigated. Table 10 found in Appendix B3 summarises all
relevant balances, extractions and accountabilities for each respective element and their
response to changes in NaOH dosage, operating temperatures, residence time and particle
size.
The dissolution of silicon was found to linearly increase within increasing NaOH dosage,
operating temperatures and residence times. The influence of particle size on the dissolution
of silicon exhibited linear trends, that suggested that silicon dissolution was minimised
(32.14%) at a P80 of 106µm and maximised (37.64%) at a P80 of 325µm. Sodium was
analysed with respect to its change in mass percent in the leach residue compared to the
initial amount of sodium found in the feed material. From the ratio calculated the amount of
sodium substituted into the leach residue can be readily accessed. From the results collected
it became evident that sodium substitution increased linearly with increasing NaOH dosages,
operating temperatures and residence times. As established with the silicon analysis, it was
found that sodium substitution was minimised (95.78%) at the P80 of 106µm and maximised
(99.60%) at a P80 of 325µm.
4.1.1 Effect of reagent dosage
To investigate the effect of NaOH dosage on the leaching of α-spodumene, three
independent experiments were carried out at 8, 12 and 14 molar concentrations. Throughout
these experiments other operational variables remained fixed. These variable included:
leaching temperature of 573.15 K, 3 hour leach duration and a P80 of 325µm for the
concentrate utilised as feed material.
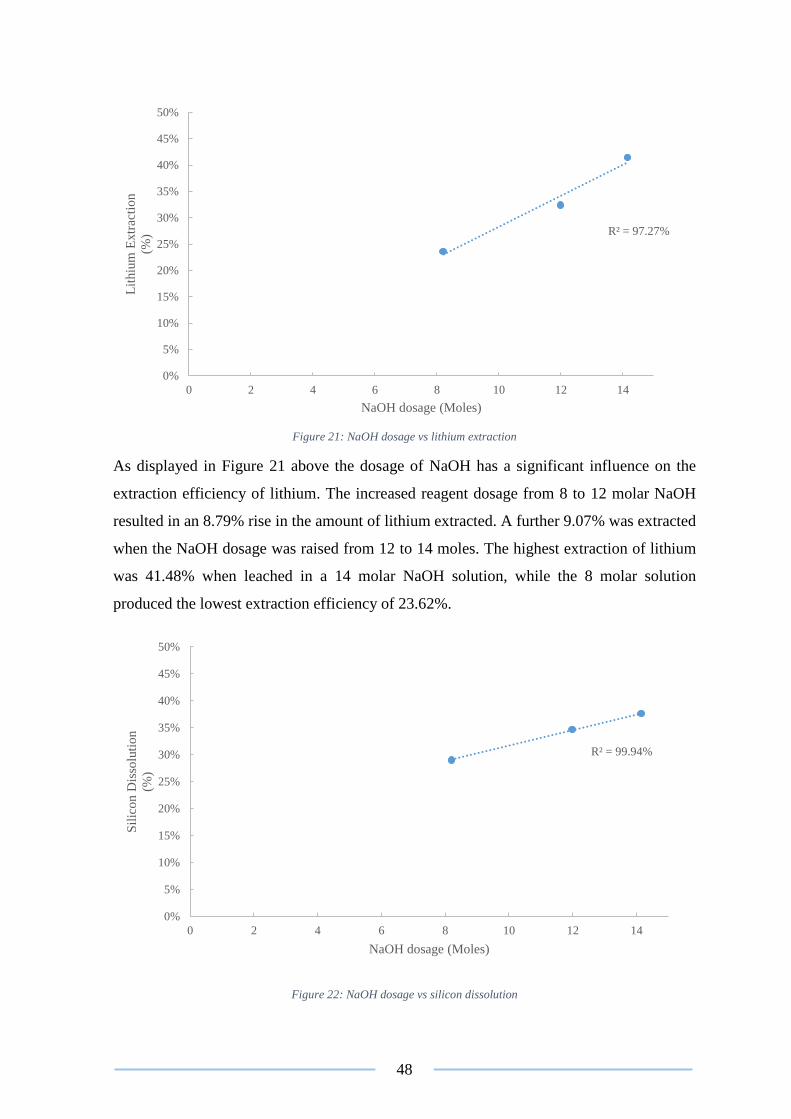
48
Figure 21: NaOH dosage vs lithium extraction
As displayed in Figure 21 above the dosage of NaOH has a significant influence on the
extraction efficiency of lithium. The increased reagent dosage from 8 to 12 molar NaOH
resulted in an 8.79% rise in the amount of lithium extracted. A further 9.07% was extracted
when the NaOH dosage was raised from 12 to 14 moles. The highest extraction of lithium
was 41.48% when leached in a 14 molar NaOH solution, while the 8 molar solution
produced the lowest extraction efficiency of 23.62%.
Figure 22: NaOH dosage vs silicon dissolution
R² = 97.27%
0%
5%
10%
15%
20%
25%
30%
35%
40%
45%
50%
0 2 4 6 8 10 12 14
Lit
hiu
m E
xtr
acti
on
(%)
NaOH dosage (Moles)
R² = 99.94%
0%
5%
10%
15%
20%
25%
30%
35%
40%
45%
50%
0 2 4 6 8 10 12 14
Sil
ico
n D
isso
luti
on
(%)
NaOH dosage (Moles)
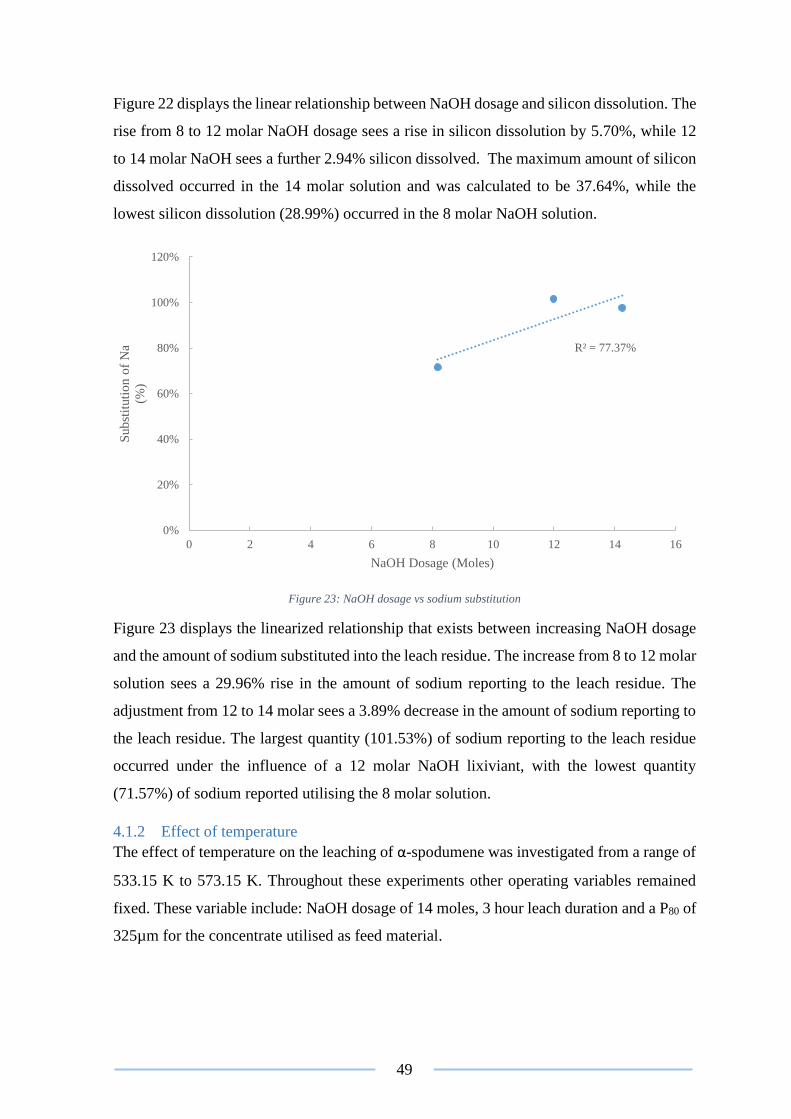
49
Figure 22 displays the linear relationship between NaOH dosage and silicon dissolution. The
rise from 8 to 12 molar NaOH dosage sees a rise in silicon dissolution by 5.70%, while 12
to 14 molar NaOH sees a further 2.94% silicon dissolved. The maximum amount of silicon
dissolved occurred in the 14 molar solution and was calculated to be 37.64%, while the
lowest silicon dissolution (28.99%) occurred in the 8 molar NaOH solution.
Figure 23: NaOH dosage vs sodium substitution
Figure 23 displays the linearized relationship that exists between increasing NaOH dosage
and the amount of sodium substituted into the leach residue. The increase from 8 to 12 molar
solution sees a 29.96% rise in the amount of sodium reporting to the leach residue. The
adjustment from 12 to 14 molar sees a 3.89% decrease in the amount of sodium reporting to
the leach residue. The largest quantity (101.53%) of sodium reporting to the leach residue
occurred under the influence of a 12 molar NaOH lixiviant, with the lowest quantity
(71.57%) of sodium reported utilising the 8 molar solution.
4.1.2 Effect of temperature
The effect of temperature on the leaching of α-spodumene was investigated from a range of
533.15 K to 573.15 K. Throughout these experiments other operating variables remained
fixed. These variable include: NaOH dosage of 14 moles, 3 hour leach duration and a P80 of
325µm for the concentrate utilised as feed material.
R² = 77.37%
0%
20%
40%
60%
80%
100%
120%
0 2 4 6 8 10 12 14 16
Sub
stit
uti
on o
f N
a
(%)
NaOH Dosage (Moles)
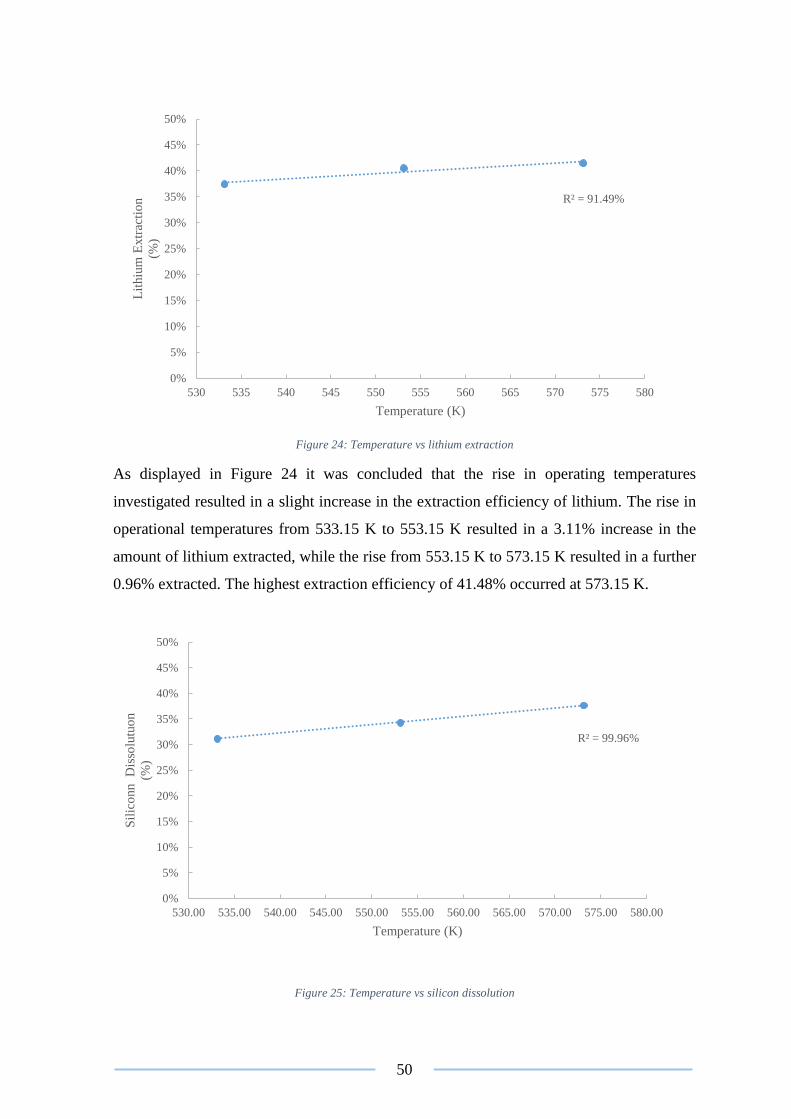
50
Figure 24: Temperature vs lithium extraction
As displayed in Figure 24 it was concluded that the rise in operating temperatures
investigated resulted in a slight increase in the extraction efficiency of lithium. The rise in
operational temperatures from 533.15 K to 553.15 K resulted in a 3.11% increase in the
amount of lithium extracted, while the rise from 553.15 K to 573.15 K resulted in a further
0.96% extracted. The highest extraction efficiency of 41.48% occurred at 573.15 K.
Figure 25: Temperature vs silicon dissolution
R² = 91.49%
0%
5%
10%
15%
20%
25%
30%
35%
40%
45%
50%
530 535 540 545 550 555 560 565 570 575 580
Lit
hiu
m E
xtr
acti
on
(%)
Temperature (K)
R² = 99.96%
0%
5%
10%
15%
20%
25%
30%
35%
40%
45%
50%
530.00 535.00 540.00 545.00 550.00 555.00 560.00 565.00 570.00 575.00 580.00
Sil
ico
nn
Dis
solu
tuo
n
(%)
Temperature (K)
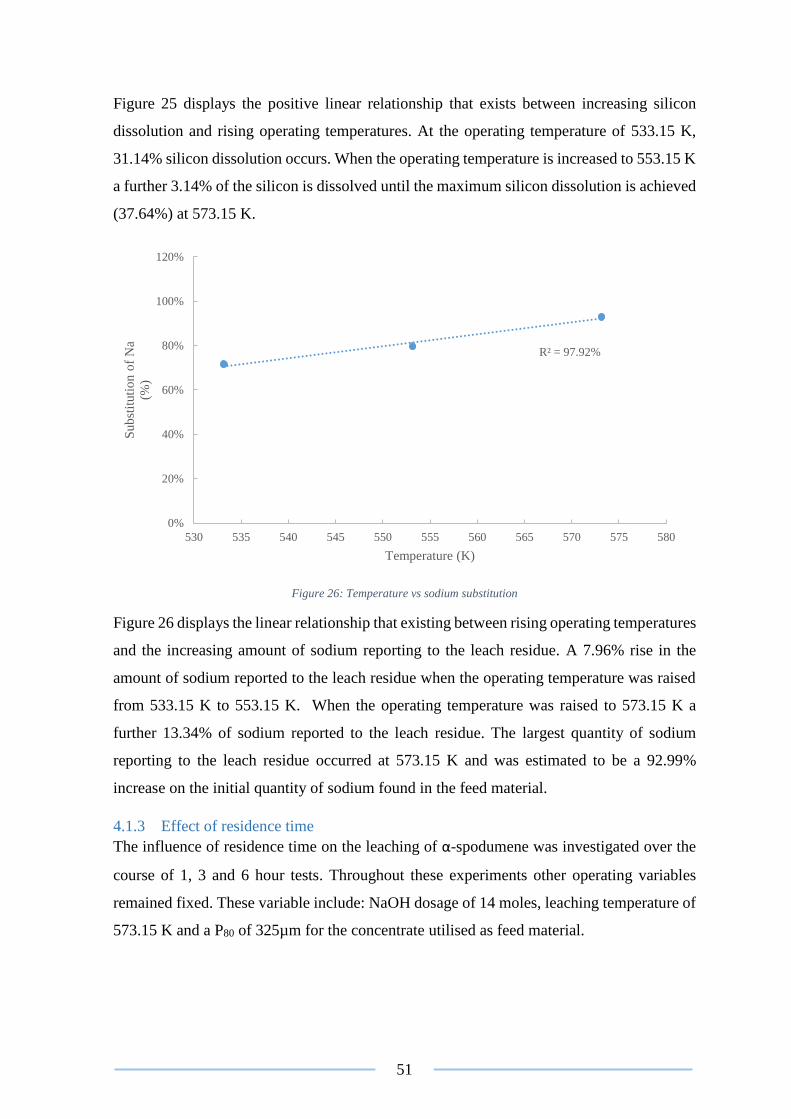
51
Figure 25 displays the positive linear relationship that exists between increasing silicon
dissolution and rising operating temperatures. At the operating temperature of 533.15 K,
31.14% silicon dissolution occurs. When the operating temperature is increased to 553.15 K
a further 3.14% of the silicon is dissolved until the maximum silicon dissolution is achieved
(37.64%) at 573.15 K.
Figure 26: Temperature vs sodium substitution
Figure 26 displays the linear relationship that existing between rising operating temperatures
and the increasing amount of sodium reporting to the leach residue. A 7.96% rise in the
amount of sodium reported to the leach residue when the operating temperature was raised
from 533.15 K to 553.15 K. When the operating temperature was raised to 573.15 K a
further 13.34% of sodium reported to the leach residue. The largest quantity of sodium
reporting to the leach residue occurred at 573.15 K and was estimated to be a 92.99%
increase on the initial quantity of sodium found in the feed material.
4.1.3 Effect of residence time
The influence of residence time on the leaching of α-spodumene was investigated over the
course of 1, 3 and 6 hour tests. Throughout these experiments other operating variables
remained fixed. These variable include: NaOH dosage of 14 moles, leaching temperature of
573.15 K and a P80 of 325µm for the concentrate utilised as feed material.
R² = 97.92%
0%
20%
40%
60%
80%
100%
120%
530 535 540 545 550 555 560 565 570 575 580
Sub
stit
uti
on
of
Na
(%)
Temperature (K)

52
Figure 27: Residence time vs lithium extraction
Figure 27 displays that the residence time of the leaching operation had a significant
influence on the extraction efficiency of lithium. Lithium extraction increased proportionally
as the leach duration increased, with the 1 to 3 hour interval resulting in a 12.55% increase
in the amount of lithium extracted. The 3 to 6-hour leach interval resulted in a further 2.77%
lithium being extracted, with a final lithium extraction of 44.25% achieved. The trend of the
graph displays a logarithmic relationship between increasing residence time and relative
extraction efficiencies of lithium.
R² = 79.65%
0%
5%
10%
15%
20%
25%
30%
35%
40%
45%
50%
0 1 2 3 4 5 6 7
Lit
hiu
m E
xtr
acti
on
(% )
Residence time (Hours)
R² = 57.23%
0%
5%
10%
15%
20%
25%
30%
35%
40%
45%
50%
0 1 2 3 4 5 6 7
Sil
ico
n D
iso
olu
tio
n
(% )
Residence time (Hours)
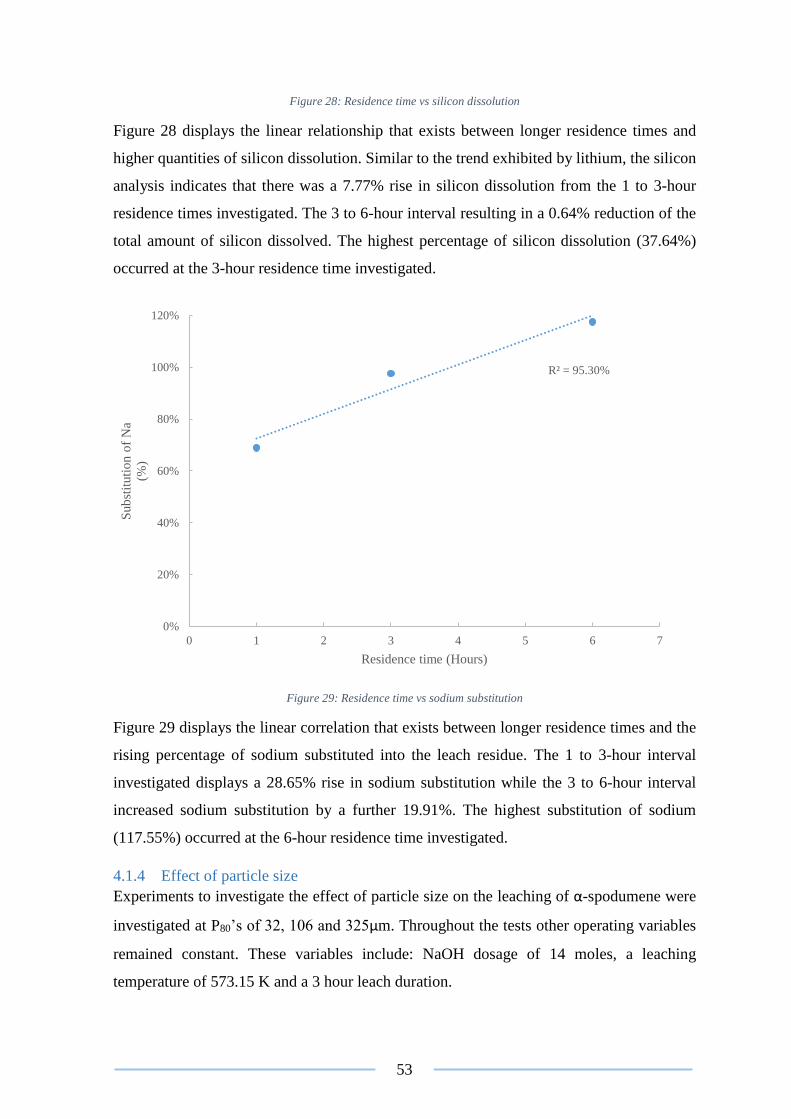
53
Figure 28: Residence time vs silicon dissolution
Figure 28 displays the linear relationship that exists between longer residence times and
higher quantities of silicon dissolution. Similar to the trend exhibited by lithium, the silicon
analysis indicates that there was a 7.77% rise in silicon dissolution from the 1 to 3-hour
residence times investigated. The 3 to 6-hour interval resulting in a 0.64% reduction of the
total amount of silicon dissolved. The highest percentage of silicon dissolution (37.64%)
occurred at the 3-hour residence time investigated.
Figure 29: Residence time vs sodium substitution
Figure 29 displays the linear correlation that exists between longer residence times and the
rising percentage of sodium substituted into the leach residue. The 1 to 3-hour interval
investigated displays a 28.65% rise in sodium substitution while the 3 to 6-hour interval
increased sodium substitution by a further 19.91%. The highest substitution of sodium
(117.55%) occurred at the 6-hour residence time investigated.
4.1.4 Effect of particle size
Experiments to investigate the effect of particle size on the leaching of α-spodumene were
investigated at P80’s of 32, 106 and 325µm. Throughout the tests other operating variables
remained constant. These variables include: NaOH dosage of 14 moles, a leaching
temperature of 573.15 K and a 3 hour leach duration.
R² = 95.30%
0%
20%
40%
60%
80%
100%
120%
0 1 2 3 4 5 6 7
Sub
stit
uti
on o
f N
a
(%)
Residence time (Hours)

54
Figure 30: Particle size vs lithium extraction
Figure 30 displays the inverse relationship that was established between particle size and the
extraction efficiency of lithium throughout this project. It was evaluated that at a P80 of
325µm the corresponding lithium extraction was 41.48 %, while at a P80 of 32µm the
extraction was reduced to 31.11%. From the results collected it is suggested that the highest
extraction efficiency (41.48%) of lithium occurs at a P80 of 325µm.
Figure 31: Particle size vs silicon dissolution
R² = 98.20%
0%
5%
10%
15%
20%
25%
30%
35%
40%
45%
50%
0 50 100 150 200 250 300 350
Lit
hiu
m E
xtr
acti
on
(%)
Particle size (µm)
R² = 20.15%
0%
5%
10%
15%
20%
25%
30%
35%
40%
45%
50%
0 50 100 150 200 250 300 350
Sil
ico
n
Dis
solu
tio
n
(%)
Particle size (µm)
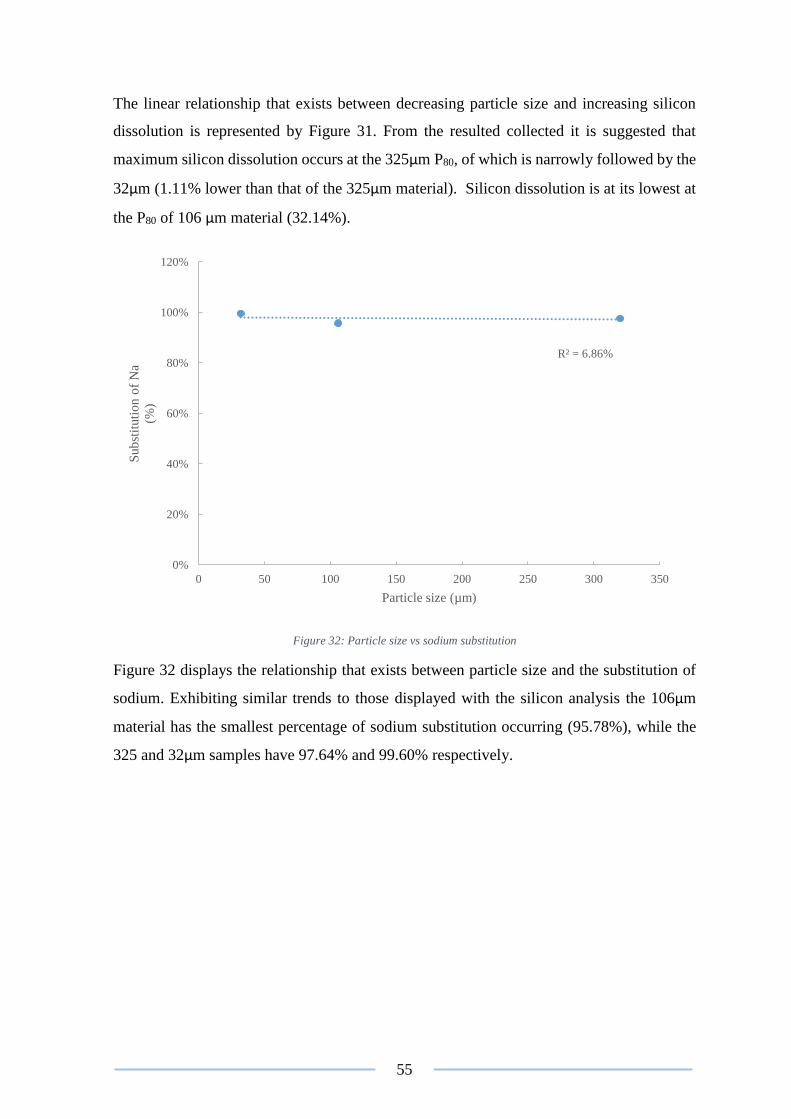
55
The linear relationship that exists between decreasing particle size and increasing silicon
dissolution is represented by Figure 31. From the resulted collected it is suggested that
maximum silicon dissolution occurs at the 325µm P80, of which is narrowly followed by the
32µm (1.11% lower than that of the 325µm material). Silicon dissolution is at its lowest at
the P80 of 106 µm material (32.14%).
Figure 32: Particle size vs sodium substitution
Figure 32 displays the relationship that exists between particle size and the substitution of
sodium. Exhibiting similar trends to those displayed with the silicon analysis the 106µm
material has the smallest percentage of sodium substitution occurring (95.78%), while the
325 and 32µm samples have 97.64% and 99.60% respectively.
R² = 6.86%
0%
20%
40%
60%
80%
100%
120%
0 50 100 150 200 250 300 350
Sub
stit
uti
on o
f N
a
(%)
Particle size (µm)
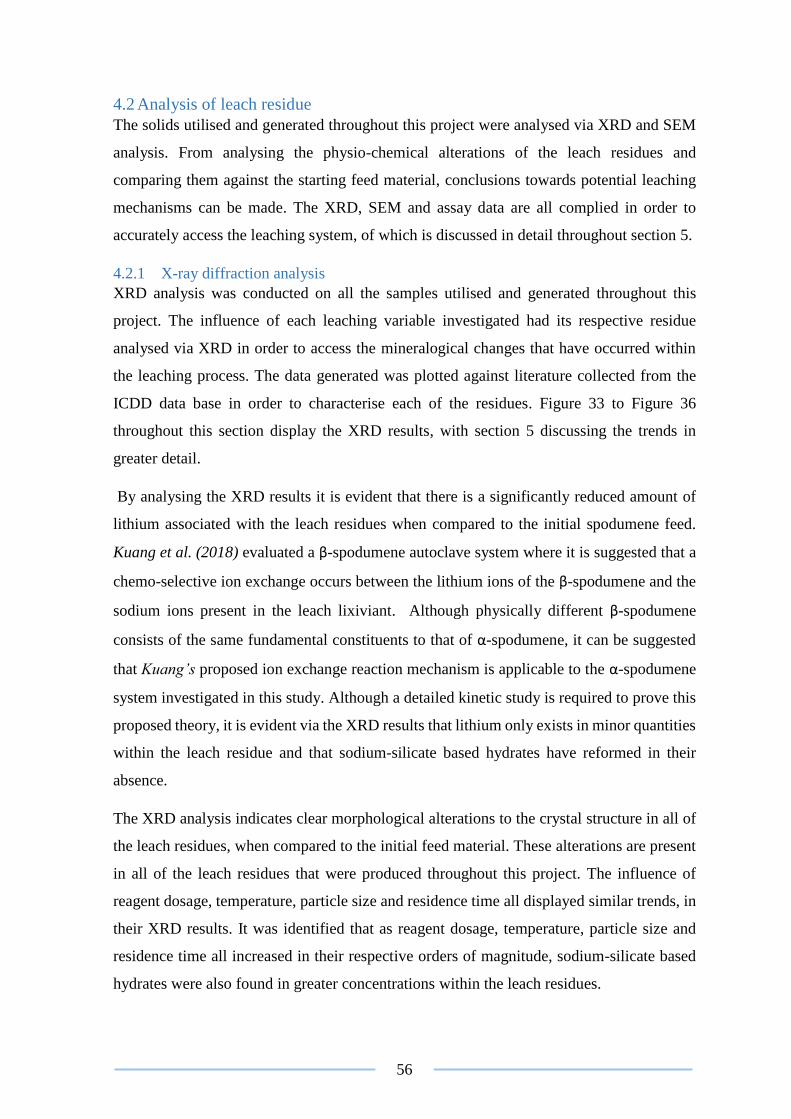
56
4.2 Analysis of leach residue
The solids utilised and generated throughout this project were analysed via XRD and SEM
analysis. From analysing the physio-chemical alterations of the leach residues and
comparing them against the starting feed material, conclusions towards potential leaching
mechanisms can be made. The XRD, SEM and assay data are all complied in order to
accurately access the leaching system, of which is discussed in detail throughout section 5.
4.2.1 X-ray diffraction analysis
XRD analysis was conducted on all the samples utilised and generated throughout this
project. The influence of each leaching variable investigated had its respective residue
analysed via XRD in order to access the mineralogical changes that have occurred within
the leaching process. The data generated was plotted against literature collected from the
ICDD data base in order to characterise each of the residues. Figure 33 to Figure 36
throughout this section display the XRD results, with section 5 discussing the trends in
greater detail.
By analysing the XRD results it is evident that there is a significantly reduced amount of
lithium associated with the leach residues when compared to the initial spodumene feed.
Kuang et al. (2018) evaluated a β-spodumene autoclave system where it is suggested that a
chemo-selective ion exchange occurs between the lithium ions of the β-spodumene and the
sodium ions present in the leach lixiviant. Although physically different β-spodumene
consists of the same fundamental constituents to that of α-spodumene, it can be suggested
that Kuang’s proposed ion exchange reaction mechanism is applicable to the α-spodumene
system investigated in this study. Although a detailed kinetic study is required to prove this
proposed theory, it is evident via the XRD results that lithium only exists in minor quantities
within the leach residue and that sodium-silicate based hydrates have reformed in their
absence.
The XRD analysis indicates clear morphological alterations to the crystal structure in all of
the leach residues, when compared to the initial feed material. These alterations are present
in all of the leach residues that were produced throughout this project. The influence of
reagent dosage, temperature, particle size and residence time all displayed similar trends, in
their XRD results. It was identified that as reagent dosage, temperature, particle size and
residence time all increased in their respective orders of magnitude, sodium-silicate based
hydrates were also found in greater concentrations within the leach residues.
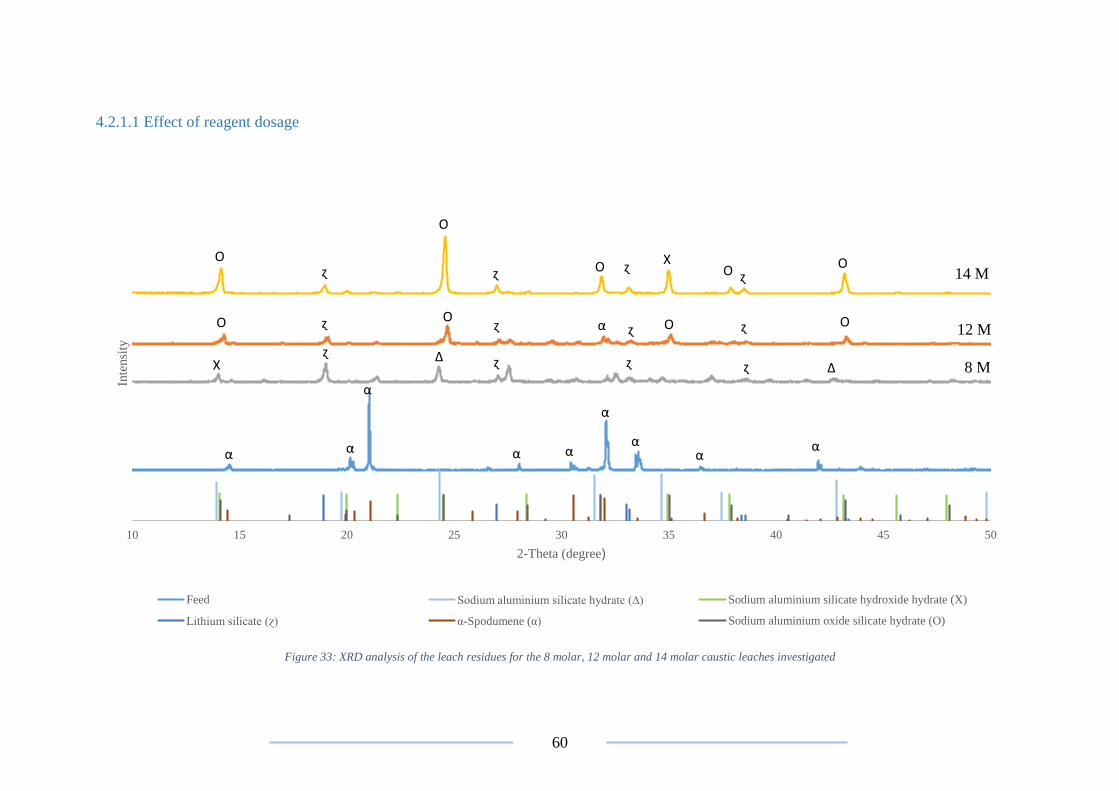
60
4.2.1.1 Effect of reagent dosage
Figure 33: XRD analysis of the leach residues for the 8 molar, 12 molar and 14 molar caustic leaches investigated
10 15 20 25 30 35 40 45 50
Inte
nsi
ty
2-Theta (degree)
Feed Sodium aluminium silicate hydrate (∆) Sodium aluminium silicate hydroxide hydrate (X)
Lithium silicate (ɀ) α-Spodumene (α) Sodium aluminium oxide silicate hydrate (O)
α
α
α
O
ααα αα
α
X
O
Oɀ
ɀ
ɀ
X
O
O ɀ
ɀ
ɀ
O
Oɀ
ɀ
ɀ∆
O
O
ɀ
ɀ
ɀ∆
α
14 M
12 M
8 M
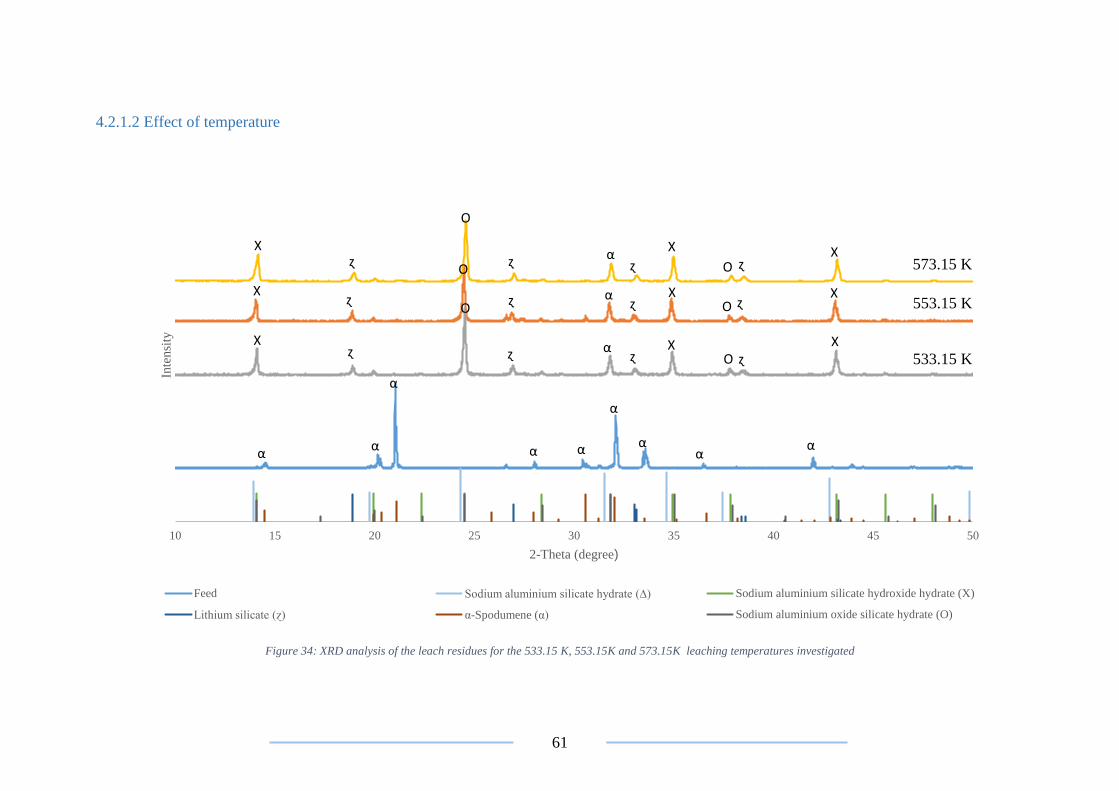
61
4.2.1.2 Effect of temperature
Figure 34: XRD analysis of the leach residues for the 533.15 K, 553.15K and 573.15K leaching temperatures investigated
10 15 20 25 30 35 40 45 50
Inte
nsi
ty
2-Theta (degree)
Feed Sodium aluminium silicate hydrate (∆) Sodium aluminium silicate hydroxide hydrate (X)
Lithium silicate (ɀ) α-Spodumene (α) Sodium aluminium oxide silicate hydrate (O)
α
α
α
α
α
α
α X
X
X
α
ɀ
ɀ
ɀ
X
X
X
O
O
O
ɀ
ɀ
ɀ
α
X
X
X
αα
O
O
ɀ
ɀ
ɀ
O
α
ɀ
ɀ
ɀ
573.15 K
553.15 K
533.15 K
62
4.2.1.3 Effect of residence time
Figure 35: XRD analysis of the leach residues for the 1, 3 and 6 hour residence times investigated
10 15 20 25 30 35 40 45 50
Inte
nsi
ty
2-Theta (degree)
Feed Sodium aluminium silicate hydrate (∆)
Sodium aluminium silicate hydroxide hydrate (X) Lithium silicate (ɀ)
α-Spodumene (α) Sodium aluminium oxide silicate hydrate (O)
α
α
αα
α
α
α
α X
O
O
O
O
∆
O
O ɀ
ɀ ɀ
ɀX
Xɀ
ɀ
X
α α αα
α Oɀ∆
α
6H
3H
1H
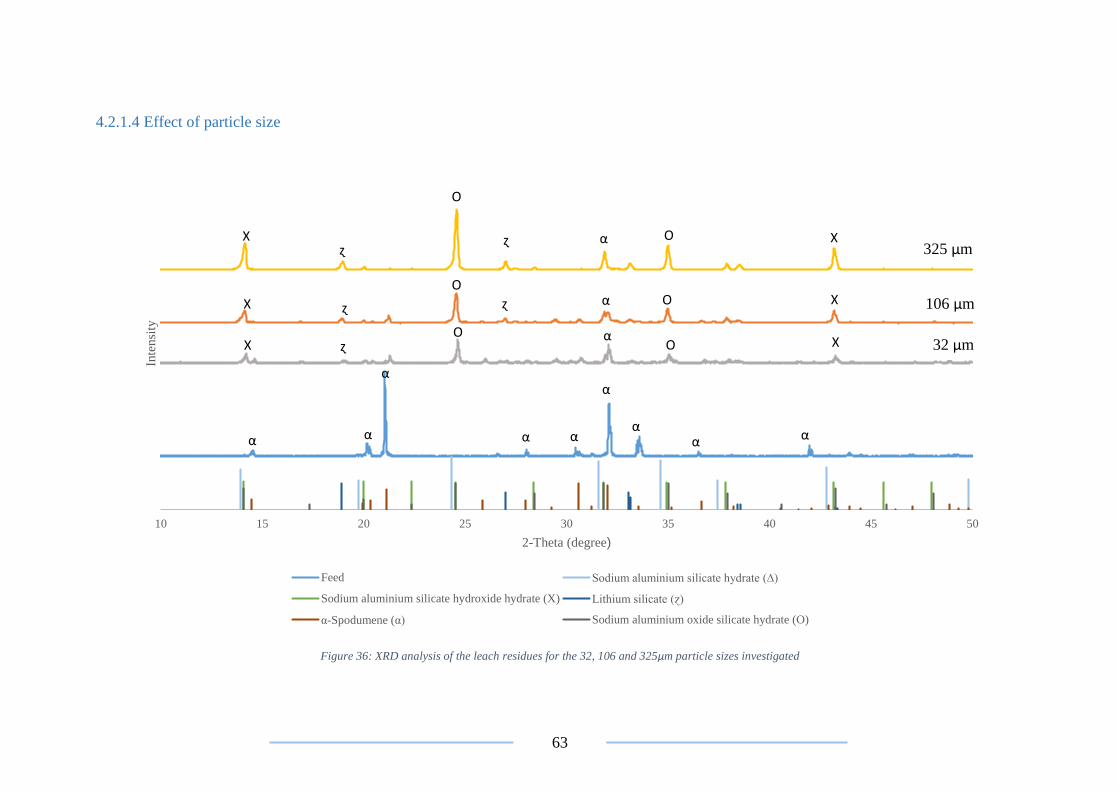
63
4.2.1.4 Effect of particle size
Figure 36: XRD analysis of the leach residues for the 32, 106 and 325µm particle sizes investigated
10 15 20 25 30 35 40 45 50
Inte
nsi
ty
2-Theta (degree)
Feed Sodium aluminium silicate hydrate (∆)
Sodium aluminium silicate hydroxide hydrate (X) Lithium silicate (ɀ)
α-Spodumene (α) Sodium aluminium oxide silicate hydrate (O)
αα
αα
α
α
α
α αα αα
X
X
X
ɀ
ɀ
ɀ
O
O
O
ɀ
ɀ
O
O
O
X
X
X
325 µm
106 µm
32 µm
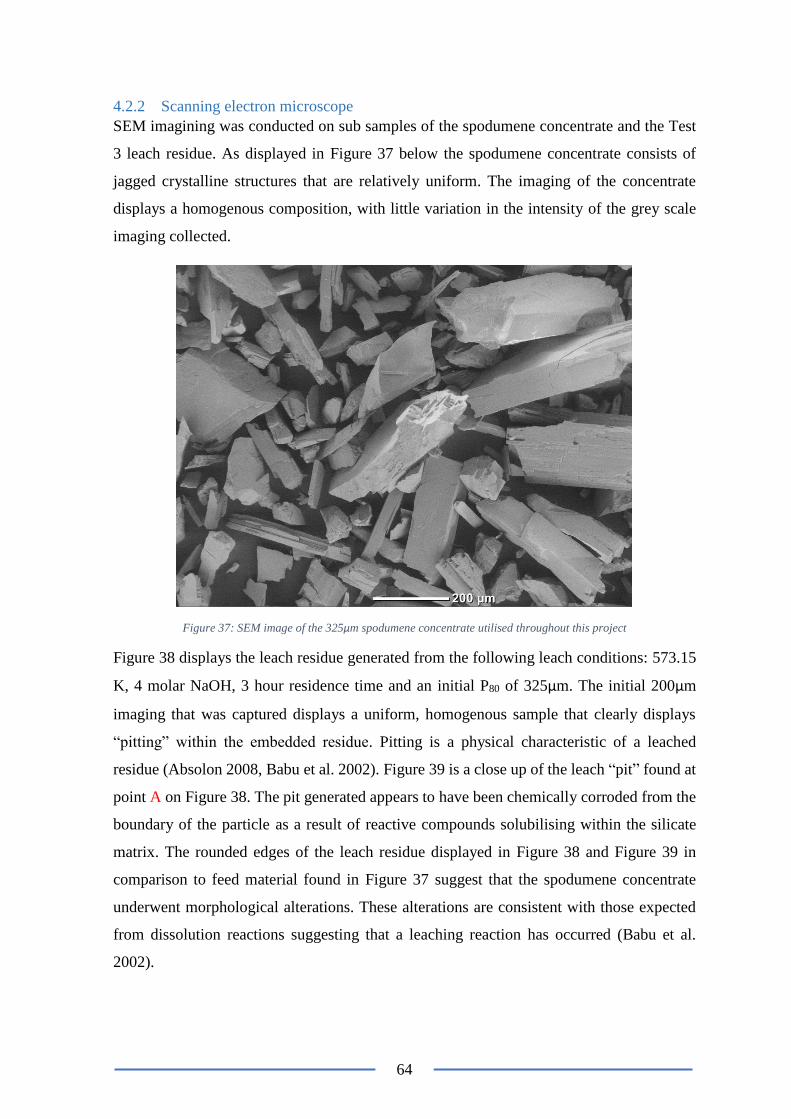
64
4.2.2 Scanning electron microscope
SEM imagining was conducted on sub samples of the spodumene concentrate and the Test
3 leach residue. As displayed in Figure 37 below the spodumene concentrate consists of
jagged crystalline structures that are relatively uniform. The imaging of the concentrate
displays a homogenous composition, with little variation in the intensity of the grey scale
imaging collected.
Figure 37: SEM image of the 325µm spodumene concentrate utilised throughout this project
Figure 38 displays the leach residue generated from the following leach conditions: 573.15
K, 4 molar NaOH, 3 hour residence time and an initial P80 of 325µm. The initial 200µm
imaging that was captured displays a uniform, homogenous sample that clearly displays
“pitting” within the embedded residue. Pitting is a physical characteristic of a leached
residue (Absolon 2008, Babu et al. 2002). Figure 39 is a close up of the leach “pit” found at
point A on Figure 38. The pit generated appears to have been chemically corroded from the
boundary of the particle as a result of reactive compounds solubilising within the silicate
matrix. The rounded edges of the leach residue displayed in Figure 38 and Figure 39 in
comparison to feed material found in Figure 37 suggest that the spodumene concentrate
underwent morphological alterations. These alterations are consistent with those expected
from dissolution reactions suggesting that a leaching reaction has occurred (Babu et al.
2002).
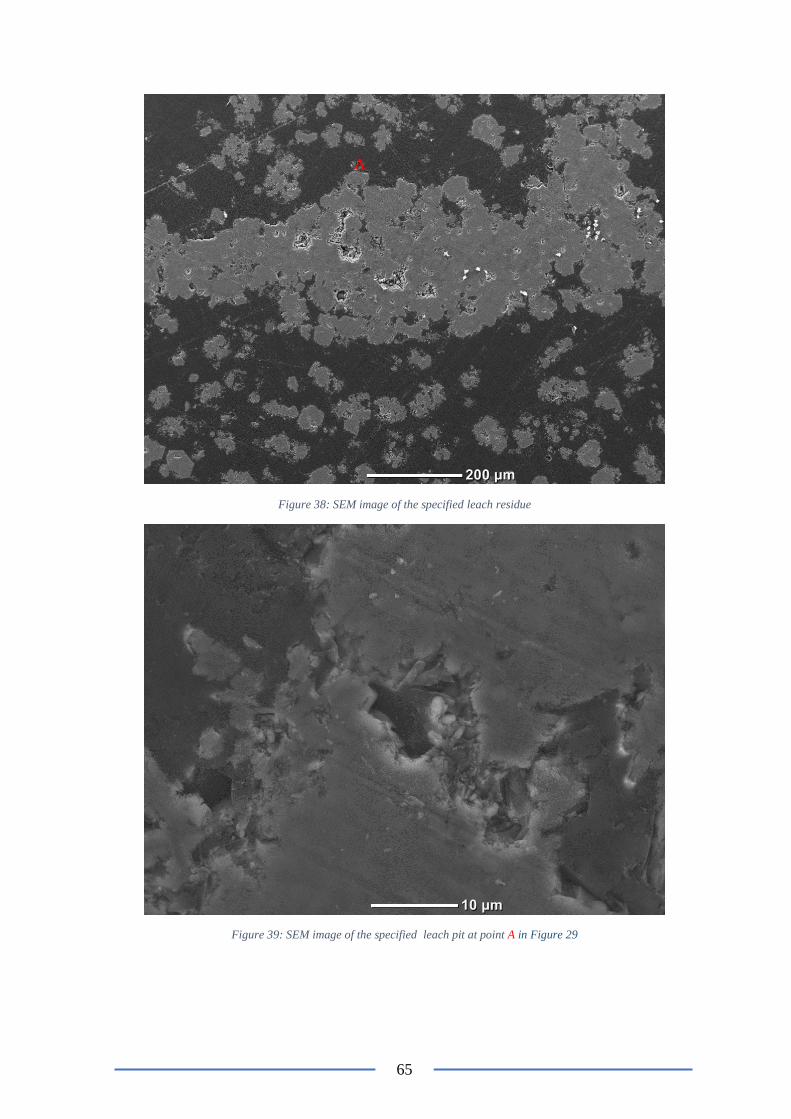
65
Figure 38: SEM image of the specified leach residue
Figure 39: SEM image of the specified leach pit at point A in Figure 29
A
66
5. Discussion
5.1 Leaching of α-spodumene
The information from the results displayed throughout section 4 suggest that the leaching of
α-spodumene readily occurs when operating under alkaline leaching conditions. Under the
operating conditions investigated it was determined that the optimal operating parameters
for maximising the extraction efficiency of lithium occurred under the following conditions:
a 14 molar NaOH leaching lixiviant, 573.15 K operating temperature, a 6 hour residence
time and a P80 of 325µm.
From the operating variables investigated it was determined that NaOH dosage had the most
significant influence on the extraction efficiency of lithium. This was followed
consequentially by the influence of particle size, residence time and operating temperature.
From interpreting the elemental assay, XRD and SEM data collected, it is suggested that a
chemo-selective ion exchange occurs between the lithium and silicon ions present within α-
spodumene and the sodium ion present in the leach lixiviant (Kuang et al. 2018). The XRD
analysis conducted indicates that the formation of anhydrous sodium silicate based hydrates
has occurred in significant quantities within the leach residue, while the lithium silicate feed
material almost completely reacted. Elemental assay results supported the XRD analysis by
indicating that an average of 91.02% sodium had being substituted into the leach residue,
when compared against its initial feed material. To investigate the proposed chemo-selective
ion exchange mechanism further an SEM analysis was conducted on a leach residue (Test
3) that had been previously assayed. The assays conducted on the leach residue indicated
that: 41.48% of the lithium had been extracted, 37.63% silica and 1.1% aluminium
dissolution had occurred. It was also noted that a 154.00% rise in the sodium contents of the
leach residue occurred, when compared to the initial feed material. The results from the
elemental assay analysis on the spodumene feed material and respective leach residue are
depicted in Figure 40, below.
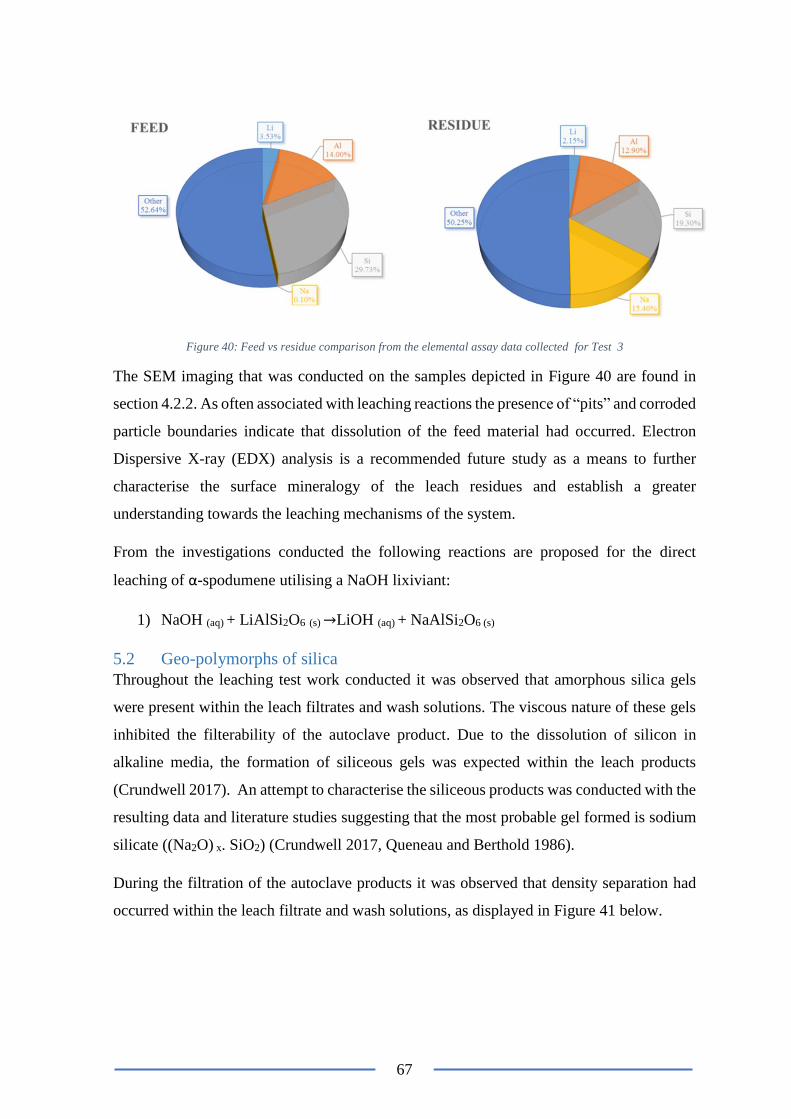
67
Figure 40: Feed vs residue comparison from the elemental assay data collected for Test 3
The SEM imaging that was conducted on the samples depicted in Figure 40 are found in
section 4.2.2. As often associated with leaching reactions the presence of “pits” and corroded
particle boundaries indicate that dissolution of the feed material had occurred. Electron
Dispersive X-ray (EDX) analysis is a recommended future study as a means to further
characterise the surface mineralogy of the leach residues and establish a greater
understanding towards the leaching mechanisms of the system.
From the investigations conducted the following reactions are proposed for the direct
leaching of α-spodumene utilising a NaOH lixiviant:
1) NaOH (aq) + LiAlSi2O6 (s) →LiOH (aq) + NaAlSi2O6 (s)
5.2 Geo-polymorphs of silica
Throughout the leaching test work conducted it was observed that amorphous silica gels
were present within the leach filtrates and wash solutions. The viscous nature of these gels
inhibited the filterability of the autoclave product. Due to the dissolution of silicon in
alkaline media, the formation of siliceous gels was expected within the leach products
(Crundwell 2017). An attempt to characterise the siliceous products was conducted with the
resulting data and literature studies suggesting that the most probable gel formed is sodium
silicate ((Na2O) x. SiO2) (Crundwell 2017, Queneau and Berthold 1986).
During the filtration of the autoclave products it was observed that density separation had
occurred within the leach filtrate and wash solutions, as displayed in Figure 41 below.
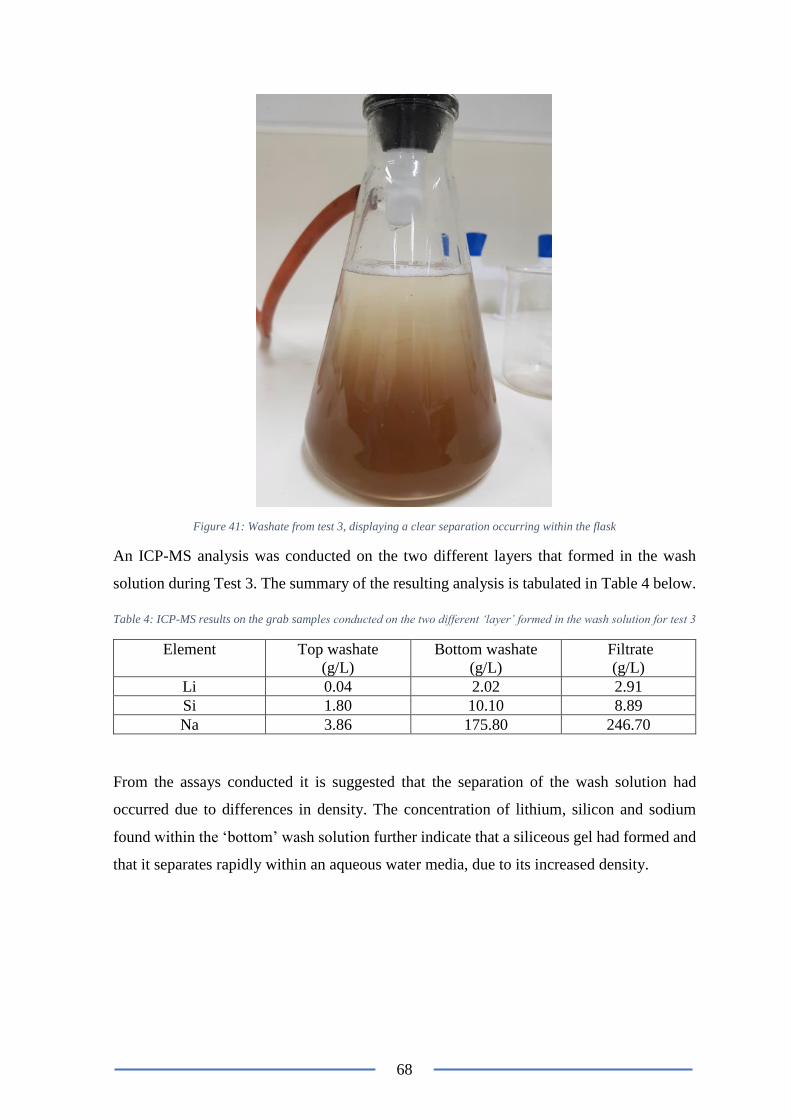
68
Figure 41: Washate from test 3, displaying a clear separation occurring within the flask
An ICP-MS analysis was conducted on the two different layers that formed in the wash
solution during Test 3. The summary of the resulting analysis is tabulated in Table 4 below.
Table 4: ICP-MS results on the grab samples conducted on the two different ‘layer’ formed in the wash solution for test 3
Element Top washate
(g/L)
Bottom washate
(g/L)
Filtrate
(g/L)
Li 0.04 2.02 2.91
Si 1.80 10.10 8.89
Na 3.86 175.80 246.70
From the assays conducted it is suggested that the separation of the wash solution had
occurred due to differences in density. The concentration of lithium, silicon and sodium
found within the ‘bottom’ wash solution further indicate that a siliceous gel had formed and
that it separates rapidly within an aqueous water media, due to its increased density.
69
6. Conclusion and recommendations This study aimed to investigate the direct leaching of α-spodumene in alkaline media by
addressing the influence of reagent dosage, operating temperature, residence time and
particle size. From the study conducted the research concluded that:
α-spodumene can be leached directly in caustic solutions
The extraction efficiency of lithium under optimised conditions was limited to
approximately 46%
Diffraction patterns generated by SEM and XRD analysis on the leach residues
shows that the crystalline spodumene is almost fully converted to an amorphous-
hydrated material
Recommendations for further investigations include:
Further test work be conducted to evaluate the recovery efficiency at higher NaOH
concentrations
Test work to assess the formation of potential by-product siliceous materials
A kinetics study on the leaching system be conducted in order to identify the leaching
mechanisms and inhibiting factors
EDX analysis be conducted on the leach residues to further characterise the surface
mineralogy of the leach products
70
References Absolon, V.J. 2008. A comparasion of biological and chemically induced leaching
mechanisms of chalcopyrite Adelaide: University of South Australia.
Alexander, P.P. 1947. Method of Producing Lithium Hydride and Hydrides Of Other
Alkali Metals Massachusetts, Unisted States of America.
AMEC. 2018. Grasping the Lithium opportunity Association of Mining and Exploration
Companies.
Archambault, M, and C Olivier. 1968. Carbonising roast of lithium bearing ores. Quebec,
Canada.
Averill, W.A, and D.L. Olson. 1978. "A review of extractive processes for lithium from
ores and brines " Energy no. 3:305-313.
Babu, M.N, K.K Sahu, and B.D. Pandey. 2002. "Zinc recovery from sphaleraite
concentrate by direct oxidative leaching with ammonium, sodium and potassium
persulphates." Hydrometallurgy no. 64 (2):119-129.
Barbosa, L.I, N.G Valente, and J.A Gonzalez. 2013. "Kinetic study on the chlorination of
B-spodumene for lithium extraction with Cl2 gas." Thermochimica Acta (557):61-
67.
Barbosa, L.I., G. Valente, R.P. Orosco, and J.A. Gonzalez. 2014. "Lithium extraction from
b-spodumene through chlorination with chlorine gas." Minerals Engineering no.
56:29-34.
Birney, M. 2017. Lithium Australia in funding and off-take for SiLeach tech. Buisness
News Western Australia, October 31.
Botto, I.L. 1985. "Structural and spectroscopic properties of leached spodumene in the acid
roast processing." Materials Chemistry and Physics no. 13 (5):423-436.
Bridgetown, Shire of. 2016. Discover Greenbushes. Paper Napkin Creative.
Brown, T. 2016. Lithium. Nottingham: Minerals UK.
Chen, Y., Q. Tian, B. Chen, X. Shi, and T. Liao. 2011. "Preparation of lithium carbonate
from spodumene by a sodium carbonate autoclave process." Hydrometallurgy no.
109:43-46.
Cho, J., Y.J. Kim, and B. Park. 2000. "Novel LiCoO2 Cathode Material with Al2O3
Coasting for a Li Ion Cell." American Chemical Society no. 12 (12):3788-3791.
Choi, Jung-Hae, Yong-Seok Seo, and Byung-Gon Chae. 2013. "A study of the pressure
solution and deformation of quartz crystal at high pH and under high stress."
Nuclear Engineering and Technology no. 45 (1):53-60. doi:
https://doi.org/10.5516/NET.06.2012.024.
Choubey, P.K, M Kim, R.R Srivastava, J Lee, and J Lee. 2016. "Advance review on the
exploitation of the prominent energy-storage element: Lithium. Part I: From
mineral and brine resources." Minerals Engineering (89):119-137.
Crundwell, Frank K. 2017. "On the Mechanism of the Dissolution of Quartz and Silica in
Aqueous Solutions." ACS Omega no. 2 (3):1116-1127. doi:
10.1021/acsomega.7b00019.
Dean, J.A. 1999. Lange Handbook of Chemistry. New York: McGRAW-HILL, INC.
DeYoung, D.H. 1991. Production of Lithium by Direct Electrolysis of Lithium Carbonate
United States of America
Di, Y., Z. Wang, S. Tao, and N. Feng. 2013. "A novel vacuum aluminothermic reduction
lithium process." John Wiley & Sons: 4th international symposium on high
temperature metallurgical processing:11-17.
Dove, Patricia M. 1999. "The dissolution kinetics of quartz in aqueous mixed cation
solutions." Geochimica et Cosmochimica Acta no. 63 (22):3715-3727. doi:
https://doi.org/10.1016/S0016-7037(99)00218-5.
71
Ellestad, R.B, and K.M Leute. 1950. Method of extracting lithium valuables from
spodumene ores. Minneapolis,Minnesota, United States of America.
Free, M.L. 2013. Hydrometallurgy fundamentals and Applications. New Jersey: John
Wiley & Sons Inc.
Fuerstenau, M.C., and K.N. Han. 2003. Principals of Mineral Processing. Colorado:
Society for Mining, Metallurgy and Exploration Inc.
Gains, L., J. Sullivan, A. Burnham, and I. Belharouak. 2011. Life-Cycle Analysis for
Lithium-Ion Battery Production and Recycling. Paper read at Transportation
Research Board 90th Annual Meeting, at Washington, DC.
Galaxy Resources Limited. 2011. Galaxy Resources Ltd.
Griffin, A. 2017. Corporate Position Statement, August 2017. Perth, Western Australia:
Lithium Australia.
Grosjean, C., P.H. Miranda, M. Perrin, and P. Pogg. 2012. "Assessment of world lithium
resources and consequences of their geographic distribution on the expected
development of the electric vehicle industry." Renewable and Sustainable Energy
Reviews no. 16:1735-1744.
Gummow, R.J., M.W. Thackeray, W.I.F. David, and S. Hull. 1992. "Structure and
electrochemistry of lithium cobalt oxide synthesised at 400°C." Materials Research
Bulletin no. 27 (3):327-337.
Guo, H., G. Kuang, H. Wang, H. Yu, and X. Zhao. 2017. "Investigation of Enhanced
Leaching of Lithium from α-Spodumene Using Hydrofluoric and Sulfuric Acid."
Minerals no. 205 (7):1-16.
Habashi, F. 1986. "Pyrometallurgy." In Principals of Extractive Metallurgy. New York:
Gordon and Breach Science Publishers.
Halmann, M., M. Epstien, and A. Steinfeld. 2012. "Carbothermic reduction of aluminia by
natural gas to aluminium and syngas: A thermodynamic study." Mineral
Processing and Extractive Metallurgy Review no. 5 (33):352-361.
Hampel, C.A. 1972. "Lithium Electrowinning " In Encyclopedia of Electrochemistry 778-
779. Huntington, New York: Krieger.
Hazen, R.M, and L.W Finger. 1984. "Comparative Crystal Chemistry: In this young and
developing discipline, the variations in crystal structure with temperature, pressure,
and composition are used to investigate interatomic forces." American Scientist no.
72 (2):143-150.
Hocking, M., J. Kan, P. Young, C. Terry, and D. Begleiter. 2016. Lithium 101. Sydney,
Australia: The Deutsche Bank, Markets Research
Hurlbut, C.S. 1971. Dana’s Manual of Mineralogy. New York: Wiley.
Ingham, P.D., I.R. White, and S. Jackson. 2011. Greenbushes Lithium Operations. NI 43-
101 Technical Report prepared for Talison Lithium Ltd. . Perth, Western Australia:
Talison Lithium Ltd.
International Centre for Diffraction Data. 2009. ICDD. JCPDS.
International Union of Crystallography. 1999. The Prinicpals of X-ray Diffraction.
Ionode Pty Ltd. 2015. Ionode Sealed Gel Electrodes.
Jaskula, B.W. 2017. Lithium. Reston, Virginia, United States: United States Geological
Survey
Julien, C., G.A. Nazri, and A. Rougier. 2000. "Electrochemical performances of layered
LiM1-Y M'y O2 (M= Ni, Co; M'= Mg, Al, B) oxides in lithium batteries " Solid
State Ionics (135):121-130.
Kipouros, G.J., and D.R. Sadoway. 1998. Toward New Technologies for the Production of
Lithium. Toronto: Journal Of Minerals
72
Konar, B, D.G Kim, and I Jung. 2018. "Critical thermodynamic optimization of the Li2O-
Al2O3-SiO2 system and its application for the thermodynamic analysis of the
glass-ceramics." Journal of the European Ceramic Society.
Kuang, G., Y. Liu, H. Li, S. Xing, F. Li, and H. Guo. 2018. "Extraction of lithium from β-
spodumene using sodium sulfate." Hydrometallurgy.
Kulifeev, V.K., V.P. Tarasov, O.N. Krivolapova, and V.V. Miklushevskiy. 2007. New
trends in the development of the lithium metallurgy. Paper read at Names 2007, 3rd
France-Russia Seminar, at Metz, France
Lier, J. A. Van, P. L. De Bruyn, and J. Th G. Overbeek. 1960. "The soluability of quartz."
The Journal of Physical Chemistry no. 64 (11):1675-1682. doi:
10.1021/j100840a017.
Linde Group. 2018. Air. Linde Group
Lithium Australia. 2016. About SiLeach.
London, D. 2014. "A petrologic assessment of internal zonation in granitic pegmatites."
Lithos no. 184-187:74-104.
Mao, H. 1996. Simplified preparation of LIPF6 based electrolyte for non-aqueous
batteries. Burnaby, Canada.
Mayer, S.T. 1999. Mixed Lithium Maganese Oxide and Lithium Nickel Cobalt Oxide
Positive Electrodes California, United States of America.
Meshram, P., B.D. Pandey, and T.R Mankhand. 2014. "Extraction of lithium from primary
and secondary sources by pre-treatment, leaching and separation: A comprehensive
review." Hydrometallurgy no. 150:192-208.
Mindat. Spodumene 1993-2018. Available from https://www.mindat.org/min-3733.html.
Moon, K.S., and F.W. Douglas. 2003. "Surface crystal chemistry in selective flotation of
spodumene (LiAl[SiO3]2) from other aluminosilicates." International journal of
mineral processing no. 72:11-24.
Munoz, J.L. 1969. "Stability relations of LiAISi206 at high pressures." Minerological
Society of America (2):203-209.
Nicholson, C.I. 1946. Production of lithium compounds. Ottawa, Ontario, Canada.
OutoTec. HSC Chemictry (7.0), Chemical Reactions and Equalibrum Calculations.
Outotec Pty Ltd 2017. Available from http://www.outotec.com/products/digital-
solutions/hsc-chemistry/.
Parr Instrument Company. 2009. Stirred Reactors and Pressure Vessels. Moline, Illinois:
Parr Instrument Company.
Partington, G.A., and N.J. McNaughton. 1995. "A Review of the Geology, Mineralization,
and Geochronology of the Greenbushes Pegmatite, Western Australia." Economic
Geology no. 90:616-635.
Pauling's, L. 1932. "The nature of the chemical bond. IV. The energy of single bonds and
the relative electronegativity of atoms." Journal of the American Chemical Society
no. 9 (54):3570-3582.
Phillips, S.L, and D.L Perry. 1995. Handbook of inorganic compounds. New York: CRC
Press.
Pidgeon, L.M., and J.M. Touguri. 1962. "High-temperature studies of metallurgical
process part 11. The thermal reduction of calcined dolomite with silicon."
CanadIan Journal of Chemistry no. 40:1769-1776.
Queneau, Paul B., and Cornelius E. Berthold. 1986. "Silica in Hydrometallurgy: An
Overview." Canadian Metallurgical Quarterly no. 25 (3):201-209. doi:
10.1179/cmq.1986.25.3.201.
Rio Tinto. 2014. Rio Tinto Serbia Highlights Innovating to Develop New Resources. Rio
Tinto, Serbia.
73
Rosales, G.D., M.C. Ruiz, and M.H. Rodriguez. 2014. "Novel process for the extraction of
lithium from β-spodumene by leaching with HF." Hydrometallurgy no. 147:1-6.
ROWE Scientific Pty Ltd. 2018. Products-pH buffers. edited by ROWE Scientific Pty Ltd.
Salakjani, N. Kh., P. Singh, and A.N. Nikoloski. 2016. "Mineralogical transformations of
spodumene concentrate from Greenbushes, Western Australia. Part 1:
Conventional heating." Minerals Engineering no. 98:71-79.
Souza, S.O., G.M. Ferraz, and S. Watanabe. 2004. "Effects of Mn and Fe impurities on the
TL and EPR properties of artificial spodumene polycrystals under irradiation."
Nuclear Instruments and Methods in Physics Research no. 218 B:259-263.
Takeda, O., M. Li, T. Toma, K. Sugiyama, M. Hoshi, and Y. Sato. 2014. "Electrowinning
of Lithium from LiOH in Molten Chloride." Journal of The Electrochemical
Society no. 161 (14).
Talison Pty Ltd, Lithium. 2018. Talison Lithium Vividgroup.
ThermoFisher. 2015. ThermoFisher Catalouge. ThermoFisher Scientific Inc.
Thomas, R, and P Davidson. 2016. "Revisiting complete miscibility between silicate melts
and hydrous fluids, and the extreme enrichment of some elements in the
supercritical state — Consequences for the formation of pegmatites and ore
deposits." Ore Geology Reviews (72):1088-1101.
Tianqi Lithium. 2018. Tianqi Lithium Australia. Tianqi Lithium Corporation
TPS Australia. 2018. TPS WP-80. TPS.
Tran, T., and V.T. Luong. 2015. "Lithium Production Processes." In Lithium Process
Chemistry, 81-124. Gwangju, Korea: Elsevier Inc.
U.S. Department of Health and Human Services. 2004. The Facts About Chlorine New
York, United States if America: State Goverment of New York
University of Minnesota. 2010. Pyroxene.
Vikström, H., S. Davidson, and M. Höök. 2013. "Lithium availability and future
production outlooks." Applied Energy no. 110:252-266.
Walker, W.Q. 2015. Short course on lithium ion batteries: Fundamentals, Thermal
preformance and Understanding Paper read at TFAWS 2015 Short Course on
Lithium-ion Batteries, at Houston, United States of America.
Wang, T, Y Tong, B Jahn, T Zou, Y Wang, D Hong, and B Han. 2007. "SHRIMP U–Pb
Zircon geochronology of the Altai No. 3 Pegmatite, NW China, and its
implications for the origin and tectonic setting of the pegmatite." Ore Geology
Reviews no. 32 (1-2):325-336.
Wanhill, R.J.H. 2014. "Chapter 15 – Aerospace Applications of Aluminum–Lithium
Alloys." In Aluminum-lithium Alloys 503-535. Butterworth & Heinemann.
Williams, P. 2017. Biggest lithium mine doubles with Greenbushes expansion. March 17.
Yaksic, A., and J.E. Tilton. 2009. "Using the cumulative availability curve to assess the
threat of mineral depletion: The case of lithium." Resources Policy no. 34:185-194.
Yan, X.Y., and D.J. Fray. 2010. "Molten salt electrolysis for sustainable metals extraction
and materials processing – A review." In Electrolysis: Theory, Types and
Applications 1-48. Cambridge, United Kingdom: Nova Science Publishers, Inc. .
Zelikman, A.N., O.E. Krein, and G.V. Samsonov. 1996. "Lithium." In Metallurgy of Rare
Metals, 458. Washington D.C.: National Science Foundation.
Zumdahl, S.S. 2013. Chemical Principles Illinois, United States of Amercia Brooks/ Cole,
Cengage Learning
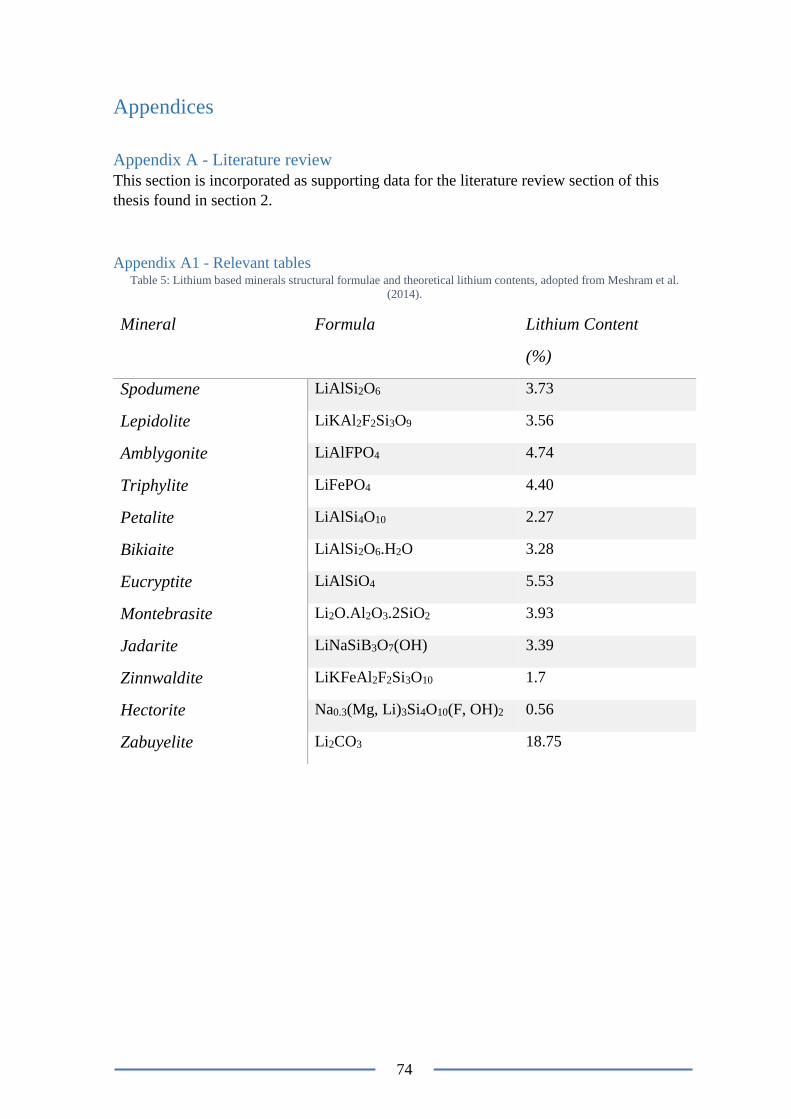
74
Appendices
Appendix A - Literature review
This section is incorporated as supporting data for the literature review section of this
thesis found in section 2.
Appendix A1 - Relevant tables Table 5: Lithium based minerals structural formulae and theoretical lithium contents, adopted from Meshram et al.
(2014).
Mineral Formula Lithium Content
(%)
Spodumene LiAlSi2O6 3.73
Lepidolite LiKAl2F2Si3O9 3.56
Amblygonite LiAlFPO4 4.74
Triphylite LiFePO4 4.40
Petalite LiAlSi4O10 2.27
Bikiaite LiAlSi2O6.H2O 3.28
Eucryptite LiAlSiO4 5.53
Montebrasite Li2O.Al2O3.2SiO2 3.93
Jadarite LiNaSiB3O7(OH) 3.39
Zinnwaldite LiKFeAl2F2Si3O10 1.7
Hectorite Na0.3(Mg, Li)3Si4O10(F, OH)2 0.56
Zabuyelite Li2CO3 18.75
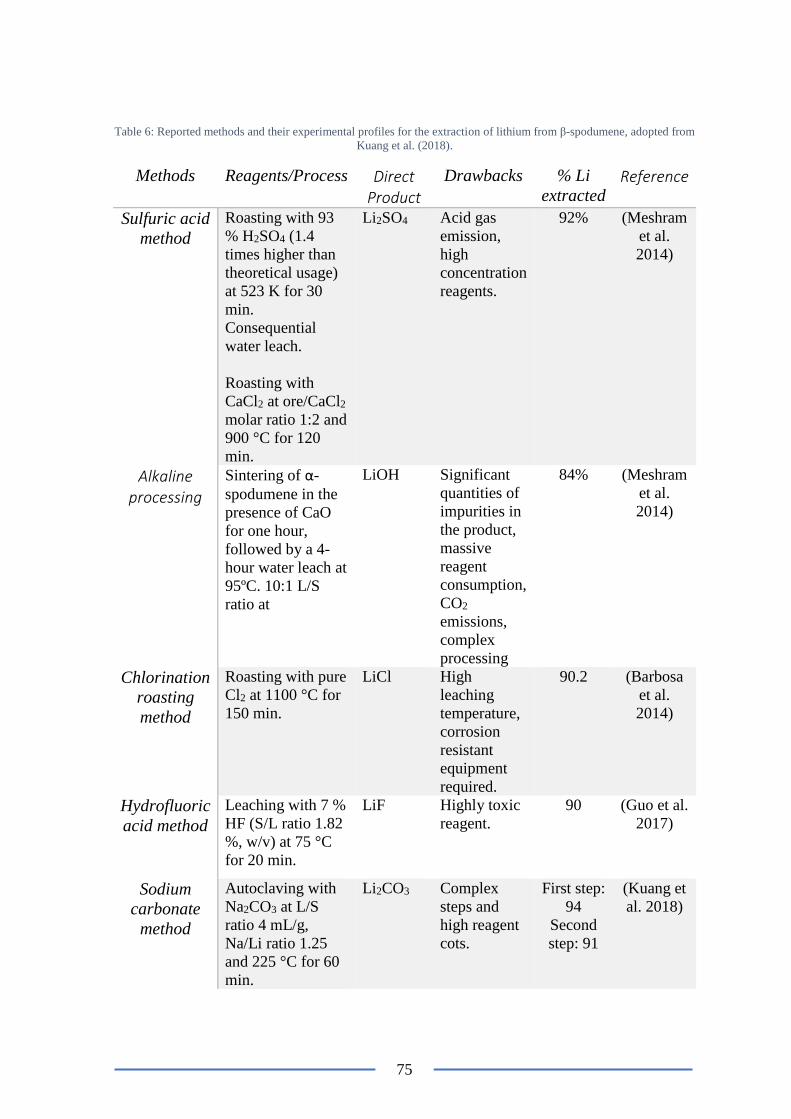
75
Table 6: Reported methods and their experimental profiles for the extraction of lithium from β-spodumene, adopted from
Kuang et al. (2018).
Methods Reagents/Process Direct Product
Drawbacks % Li
extracted Reference
Sulfuric acid
method
Roasting with 93
% H2SO4 (1.4
times higher than
theoretical usage)
at 523 K for 30
min.
Consequential
water leach.
Roasting with
CaCl2 at ore/CaCl2
molar ratio 1:2 and
900 °C for 120
min.
Li2SO4 Acid gas
emission,
high
concentration
reagents.
92% (Meshram
et al.
2014)
Alkaline processing
Sintering of α-
spodumene in the
presence of CaO
for one hour,
followed by a 4-
hour water leach at
95ºC. 10:1 L/S
ratio at
LiOH Significant
quantities of
impurities in
the product,
massive
reagent
consumption,
CO2
emissions,
complex
processing
84% (Meshram
et al.
2014)
Chlorination
roasting
method
Roasting with pure
Cl2 at 1100 °C for
150 min.
LiCl High
leaching
temperature,
corrosion
resistant
equipment
required.
90.2 (Barbosa
et al.
2014)
Hydrofluoric
acid method
Leaching with 7 %
HF (S/L ratio 1.82
%, w/v) at 75 °C
for 20 min.
LiF Highly toxic
reagent.
90 (Guo et al.
2017)
Sodium
carbonate
method
Autoclaving with
Na2CO3 at L/S
ratio 4 mL/g,
Na/Li ratio 1.25
and 225 °C for 60
min.
Li2CO3 Complex
steps and
high reagent
cots.
First step:
94
Second
step: 91
(Kuang et
al. 2018)
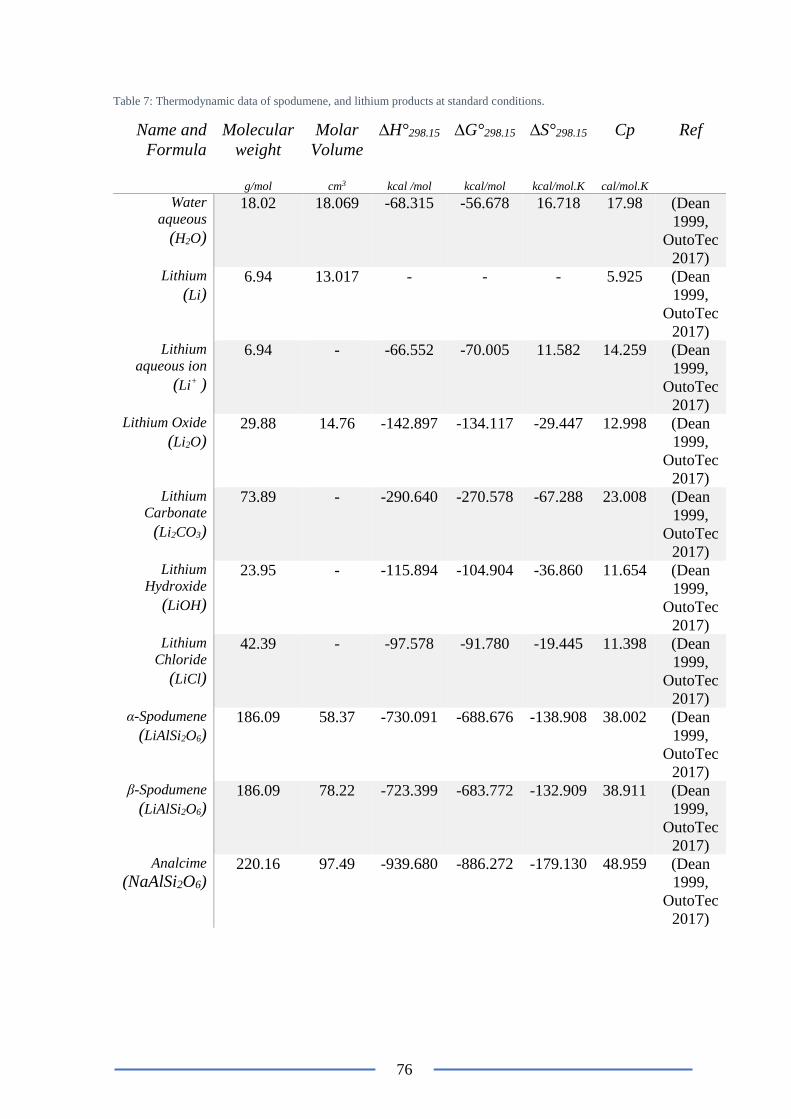
76
Table 7: Thermodynamic data of spodumene, and lithium products at standard conditions.
Name and
Formula
Molecular
weight
g/mol
Molar
Volume
cm3
∆H°298.15
kcal /mol
∆G°298.15
kcal/mol
∆S°298.15
kcal/mol.K
Cp
cal/mol.K
Ref
Water
aqueous
(H2O)
18.02 18.069
-68.315 -56.678 16.718 17.98 (Dean
1999,
OutoTec
2017) Lithium
(Li)
6.94 13.017
- - - 5.925 (Dean
1999,
OutoTec
2017) Lithium
aqueous ion
(Li+ )
6.94 - -66.552 -70.005
11.582 14.259 (Dean
1999,
OutoTec
2017) Lithium Oxide
(Li2O)
29.88 14.76
-142.897
-134.117
-29.447 12.998 (Dean
1999,
OutoTec
2017) Lithium
Carbonate
(Li2CO3)
73.89 - -290.640 -270.578 -67.288 23.008 (Dean
1999,
OutoTec
2017) Lithium
Hydroxide
(LiOH)
23.95 - -115.894 -104.904 -36.860 11.654 (Dean
1999,
OutoTec
2017) Lithium
Chloride
(LiCl)
42.39 - -97.578 -91.780 -19.445 11.398 (Dean
1999,
OutoTec
2017) α-Spodumene
(LiAlSi2O6)
186.09 58.37
-730.091 -688.676 -138.908 38.002 (Dean
1999,
OutoTec
2017) β-Spodumene
(LiAlSi2O6)
186.09 78.22 -723.399 -683.772 -132.909 38.911 (Dean
1999,
OutoTec
2017) Analcime
(NaAlSi2O6)
220.16 97.49
-939.680 -886.272
-179.130 48.959 (Dean
1999,
OutoTec
2017)

77
Table 8: Solubility of lithium products at variating temperatures (g/100g H2O) (Dean (1999), Phillips and Perry 1995) .
Li-Salts 273.15 293.15 313.15 333.15 353.15 373.15 Li2CO3 1.54 1.33 1.17 1.01 0.85 0.72
LiCl 69.20 83.50 89.20 98.40 112 128 Li2SO4 36.10 34.80 33.70 32.60 31.40 -
LiHCO3 5.80 5.74 - - - -
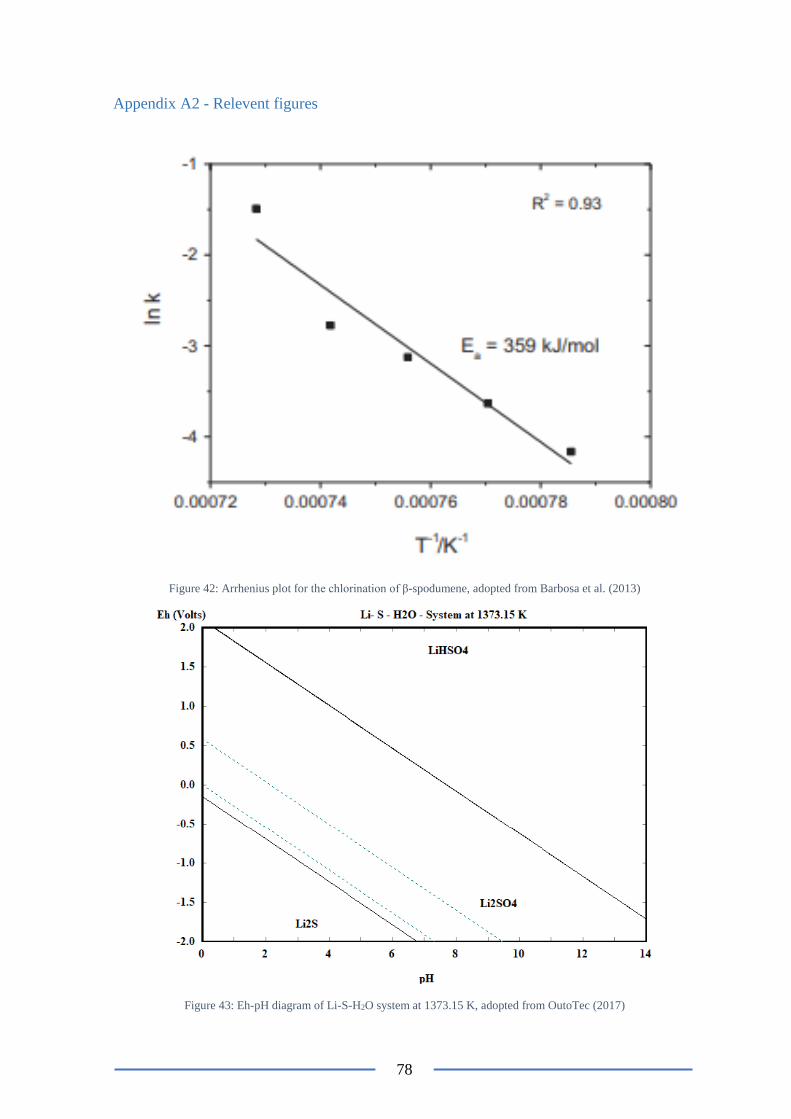
78
Appendix A2 - Relevent figures
Figure 42: Arrhenius plot for the chlorination of β-spodumene, adopted from Barbosa et al. (2013)
Figure 43: Eh-pH diagram of Li-S-H2O system at 1373.15 K, adopted from OutoTec (2017)
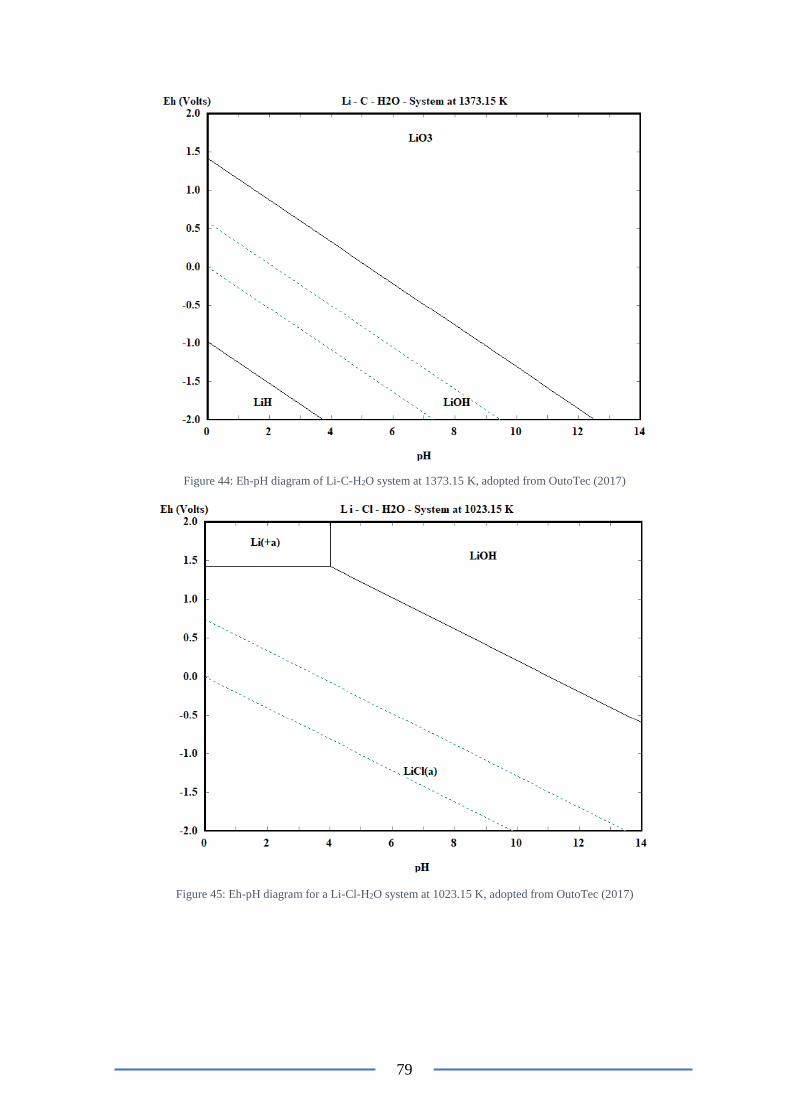
79
Figure 44: Eh-pH diagram of Li-C-H2O system at 1373.15 K, adopted from OutoTec (2017)
Figure 45: Eh-pH diagram for a Li-Cl-H2O system at 1023.15 K, adopted from OutoTec (2017)
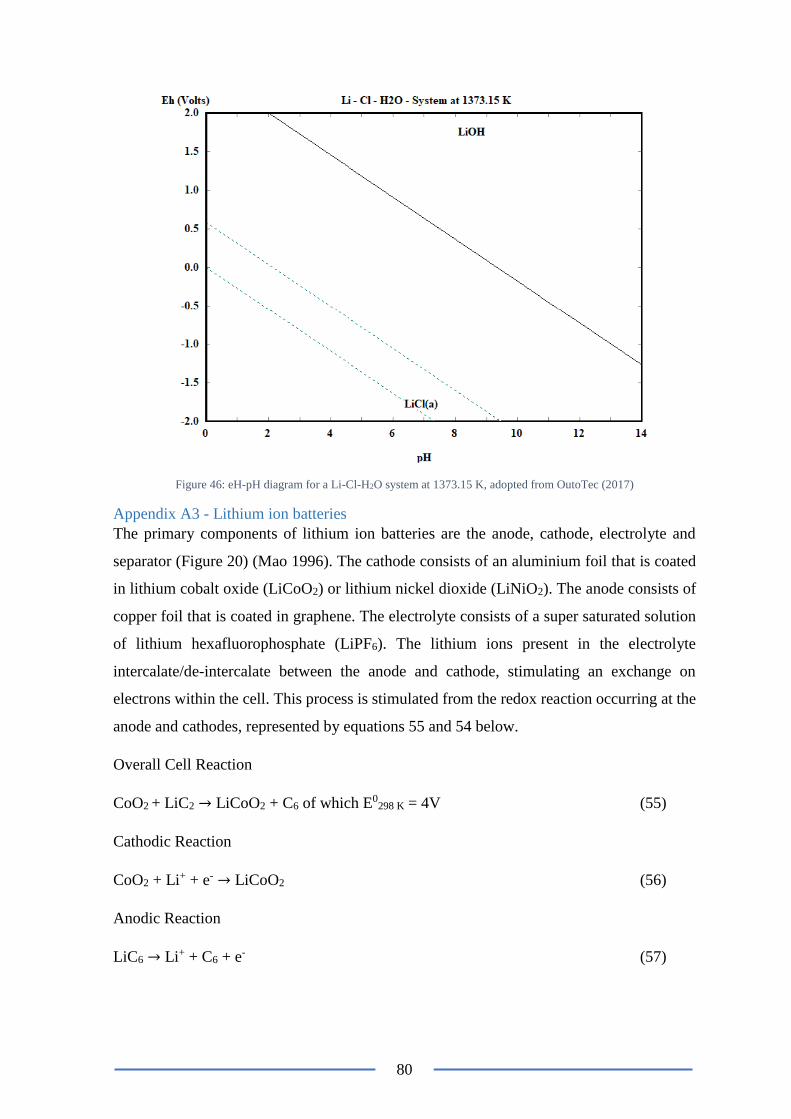
80
Figure 46: eH-pH diagram for a Li-Cl-H2O system at 1373.15 K, adopted from OutoTec (2017)
Appendix A3 - Lithium ion batteries
The primary components of lithium ion batteries are the anode, cathode, electrolyte and
separator (Figure 20) (Mao 1996). The cathode consists of an aluminium foil that is coated
in lithium cobalt oxide (LiCoO2) or lithium nickel dioxide (LiNiO2). The anode consists of
copper foil that is coated in graphene. The electrolyte consists of a super saturated solution
of lithium hexafluorophosphate (LiPF6). The lithium ions present in the electrolyte
intercalate/de-intercalate between the anode and cathode, stimulating an exchange on
electrons within the cell. This process is stimulated from the redox reaction occurring at the
anode and cathodes, represented by equations 55 and 54 below.
Overall Cell Reaction
CoO2 + LiC2 → LiCoO2 + C6 of which E0298 K = 4V (55)
Cathodic Reaction
CoO2 + Li+ + e- → LiCoO2 (56)
Anodic Reaction
LiC6 → Li+ + C6 + e- (57)

81
The redox flow throughout the battery sees the discharge point occurring at the cathode, and
charging point occurring at the anode (Figure 20). The cycling of charges between the two
electrodes stimulates a flow of electrons in an external circuit, which provides the battery
with a point connection to an external circuit.
Figure 47: Schematic of a battery displaying the flow of ions, adopted from Walker (2015)
The Binding agents
The binding agents utilised by LiCoO2 contains 10 g of polyvinlidene fluoride (PVDF)
powder and 100 mL of dimethylformamide (DMF) of which are combined together and
mixed at 323.15 K for 1 hour. 50g of cathode oxide is combined with 5.40 g of SFG-15
graphite adhesive and 2.10 g of carbon. Finally, approximately 16.55 g of additional DMF
was added to the mixture as a smoothing agent.
The final cathode is meant to consist of 90 weight % of cathodic material, 5 weight %
carbon and 5% binding agent.
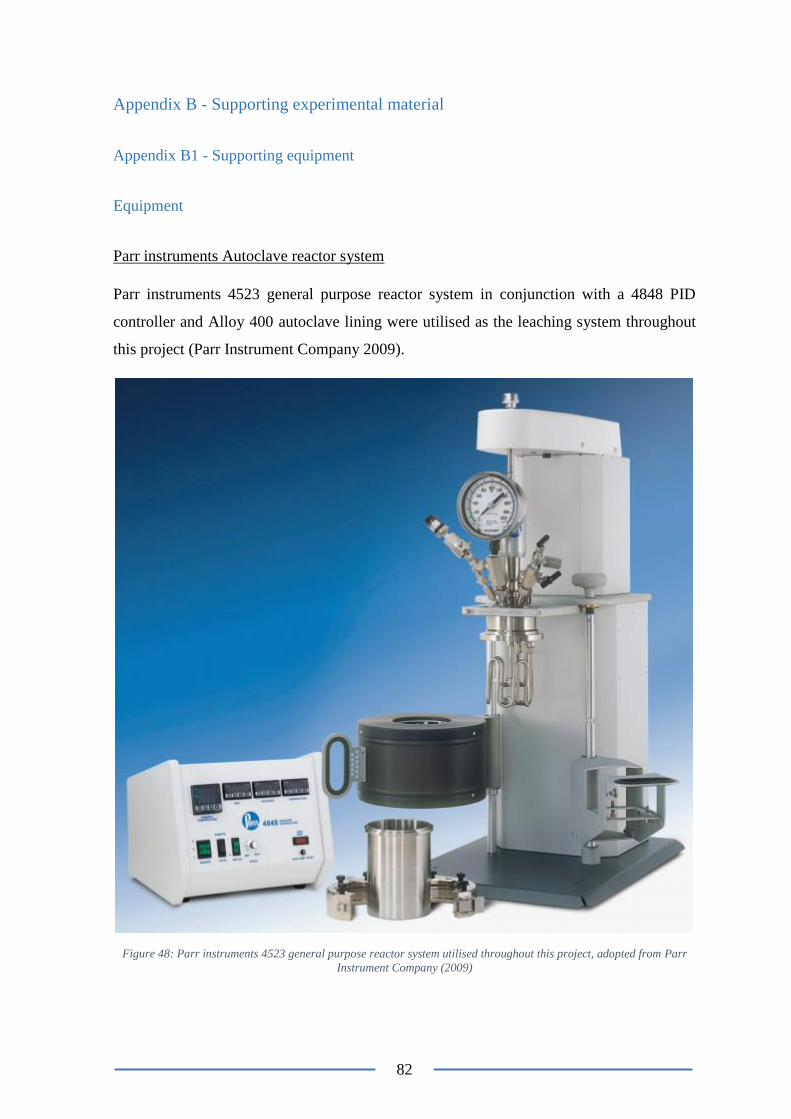
82
Appendix B - Supporting experimental material
Appendix B1 - Supporting equipment
Equipment
Parr instruments Autoclave reactor system
Parr instruments 4523 general purpose reactor system in conjunction with a 4848 PID
controller and Alloy 400 autoclave lining were utilised as the leaching system throughout
this project (Parr Instrument Company 2009).
Figure 48: Parr instruments 4523 general purpose reactor system utilised throughout this project, adopted from Parr
Instrument Company (2009)
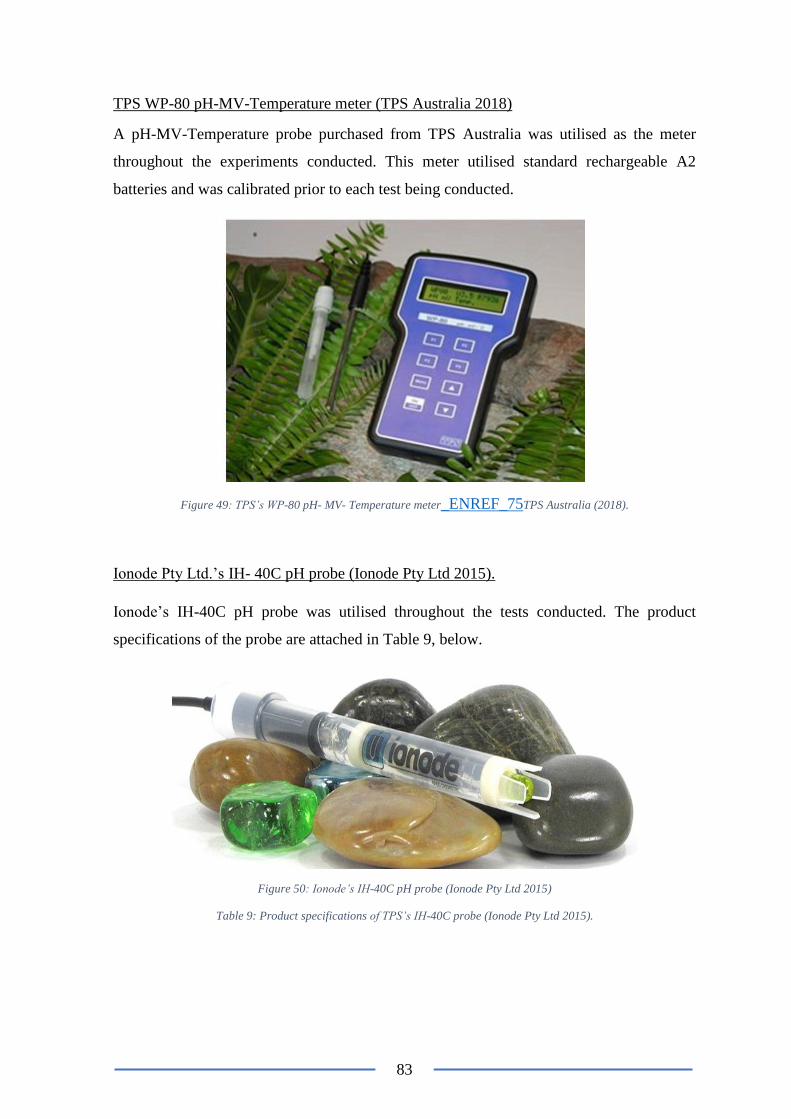
83
TPS WP-80 pH-MV-Temperature meter (TPS Australia 2018)
A pH-MV-Temperature probe purchased from TPS Australia was utilised as the meter
throughout the experiments conducted. This meter utilised standard rechargeable A2
batteries and was calibrated prior to each test being conducted.
Figure 49: TPS’s WP-80 pH- MV- Temperature meter_ENREF_75TPS Australia (2018).
Ionode Pty Ltd.’s IH- 40C pH probe (Ionode Pty Ltd 2015).
Ionode’s IH-40C pH probe was utilised throughout the tests conducted. The product
specifications of the probe are attached in Table 9, below.
Figure 50: Ionode’s IH-40C pH probe (Ionode Pty Ltd 2015)
Table 9: Product specifications of TPS’s IH-40C probe (Ionode Pty Ltd 2015).
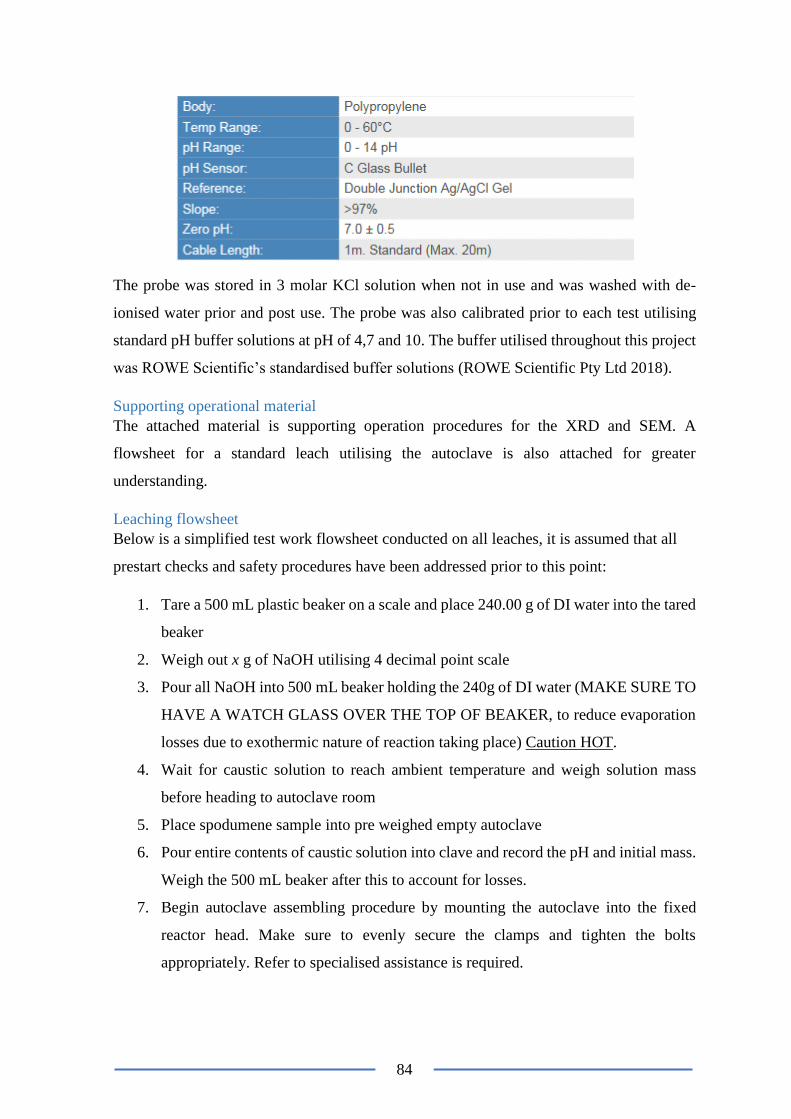
84
The probe was stored in 3 molar KCl solution when not in use and was washed with de-
ionised water prior and post use. The probe was also calibrated prior to each test utilising
standard pH buffer solutions at pH of 4,7 and 10. The buffer utilised throughout this project
was ROWE Scientific’s standardised buffer solutions (ROWE Scientific Pty Ltd 2018).
Supporting operational material
The attached material is supporting operation procedures for the XRD and SEM. A
flowsheet for a standard leach utilising the autoclave is also attached for greater
understanding.
Leaching flowsheet
Below is a simplified test work flowsheet conducted on all leaches, it is assumed that all
prestart checks and safety procedures have been addressed prior to this point:
1. Tare a 500 mL plastic beaker on a scale and place 240.00 g of DI water into the tared
beaker
2. Weigh out x g of NaOH utilising 4 decimal point scale
3. Pour all NaOH into 500 mL beaker holding the 240g of DI water (MAKE SURE TO
HAVE A WATCH GLASS OVER THE TOP OF BEAKER, to reduce evaporation
losses due to exothermic nature of reaction taking place) Caution HOT.
4. Wait for caustic solution to reach ambient temperature and weigh solution mass
before heading to autoclave room
5. Place spodumene sample into pre weighed empty autoclave
6. Pour entire contents of caustic solution into clave and record the pH and initial mass.
Weigh the 500 mL beaker after this to account for losses.
7. Begin autoclave assembling procedure by mounting the autoclave into the fixed
reactor head. Make sure to evenly secure the clamps and tighten the bolts
appropriately. Refer to specialised assistance is required.
85
8. Pre load the autoclave with 200 kPa worth of pressure to ensure assemblage has
occurred correctly. Check for leaks with soapy water. If no leaks, then pressurisation
can occur.
9. Pressurise to 1000 kPa.
10. Remove gas loading assembly by closing off the gas bottles isolation valve followed
by the attached regulators valve. Once closed the two isolation valves on the
autoclave head can be closed. The two safety valves that operate in series across the
gas link connecting the gas bottle to the clave can then be closed.
11. Once all gas valves are isolated, the pressure line connecting the autoclave to the gas
bottle can be disconnected. (BE WARY OF ANY RESIDUAL PRESSURE
TRAPPED IN THE LINE)
12. Once disconnected and the autoclave is sealed and pressurised the heating sequence
can begin. The impellor can also be set to the standardised 300 rpm to begin agitating
the contents of the autoclave.
13. Wait within a safe but accessible vicinity to the autoclave to evaluate its heating
sequence to ensure a stable operation. Turn on the ventilation system to the room.
14. Record time, temperature and pressure once the autoclave has reached operating
temperature. Repeat this process every 15 minutes to account for a safe and stable
operation.
END LEACH (ENSURE ALL CORRECT PPE IS WORN)
15. Once predetermined residence time has been achieved the cooling sequence can be
initiated. Set operating temperature to ambient temperature of the room and step
away.
16. Wait outside of the autoclave operational area for it to cool via its internal cooling
system
17. Once cooled to ambient temperature commence de-pressurisation by slowing
venting the autoclave through one of its marked gas vent valves.
18. Begin the de-assembling sequence.
19. Weigh the contents of the autoclave and record its pH. Take photos and record any
necessary observations.
20. Assemble a Buchner filter under the influence of a vacuum. Line the filter with two
WhatmanTM grade 1 filter papers.
86
21. Mix and pour the entire contents of the autoclave into the filter and allow separation
to occur.
22. Collect a 20 mL sample of the filtrate for solution analysis. Dilute the 20 mL sample
in 100 mL of DI utilising a volumetric flask. Shake flask and pour 30 ml from the
contents of the volumetric flask into a sterile vial, for assay.
23. Collect all the contents of the volumetric flak by placing the residual solution into
new sterile 100 mL sample container.
24. Tare a 10ml volumetric flask on a 4 decimal point scale. Place 10 ml of the leach
filtrate into the 10 ml volumetric flask and recorded the mass. From the mass of the
solution the specific gravity of the solution is determined (refer to B3 for
calculations).
25. Once the mass of the 10 ml volumetric flask is collected, the contents can be emptied
back into the bulk filtrate in the Buchner filter. Take and record a pH reading of the
filtrate to ensure solution is stable. Pour entire contents of filtrate into a 500 mL
plastic container for storage.
26. Begin washing cycle of the residue by utilising DI water as a wash solution. Make
sure the entire contents of the autoclave is emptied into the Buchner filter. Once the
entire contents of the autoclave is cleared leave it aside to dry.
27. Fill the contents of Buchner funnel to the 1000 ml mark on the vacuumed flask
utilising the DI water. Make sure to pour the DI water into bed level volumes,
ensuring the solid residues are being “washed’.
28. Collect a sample of the wash solution for assay (20 mL is sufficient). Dispose of the
remainder.
29. Repeat the wash steps another two times with DI water to ensure the solid residues
are washed. Collect 20 mL subsample of the wash for assay.
30. Collect the washed solids from the Buchner filter and place them in the 60-degree
oven for drying (leave for 2 days to dry sufficiently).
31. Weigh the dried post mass of the clave to account for samples sticking to the clave
32. Weigh the solid samples after two days’ worth of drying and split into two even
portions by mass.
33. Ring pulverise one half of the residue sample for XRD and peroxide fusion digestion
and ICP-MS analysis. The remaining half is riffle split out into a 5 g representative
sample for SEM analysis. All residues are then bagged and stored in a secured, cool
dry pace.
87
XRD
Starting the machine:
1. Confirm power connection to water cooler and the XRD has been switched on.
2. Turn rotary switch on.
3. Select the ‘Control power on’ button located on the spellman DF3 panel.
4. Ensure correct slits have been inserted into XRD.
5. Select the ‘X Ray On’ button located on the generator control panel
6. Ensure start up voltage is set to 20 kV and current at 10 mA.
7. After 10 minutes, slowly raise the voltage to 35 kV and the current to 28 mA.
8. Place prepared samples into their respective holders.
9. Start up the visX112E operating software and set up the data collection
10. Start the Auto Loader Batch to allowing sample analysis.
Turning off Instrument:
1. Turn kV and mA down to start values of 20 kV and 10 mA.
2. Select the ‘X-Ray off’ button to turn off generator.
3. Turn off the water cooler.
4. Turn off rotary switch to shut down power to XRD.
SEM
Sample Preparation:
Resin
1. Prepare the resin mixture by adding Epohy Resin and EpoFix
Hardener at a ratio of 5 to 1 to a large weigh boat. Mix consistently
for 2 minutes to ensure resin is homogenous.
2. Add solid sample to the base of a 25 mm SEM sample mould.
3. Top up mould with resin mixture and leave to set overnight.
4. Remove set resin sample from mould, polish and place in a vacuum
desiccator overnight.
5. Undertake sample carbon coating process.
Tabs
88
1. Place 20 g worth of sample into weigh boat and spread until uniform
layer covers the face of the boat.
2. Remove SEM tab from the package and remove protect sheath from the
sticky face of the tab.
3. Place sticky face of the tab into the sample, allowing for sample to
attach to the face
4. Attach the correct SEM plate for loose particle analysis and conduct
SEM operation
SEM/EDX Operation:
1. Turn on computer, select JCM-6000 login and wait for software to load.
Ensure aperture is in correct position.
2. Select the ON/OFF button to turn on SEM and select the ‘Vent’ button on
the computer screen.
3. Slowly open the SEM door once the chamber has released.
4. Carefully place the sample into holder and place into the SEM sample
stage, securing the latches.
5. Slowly close and secure SEM door, holding for 2 seconds.
6. Once the SEM chamber evacuation has been complete and the software has
run a full auto adjustment, SEM images can be taken.
SEM/EDX Sample Removal and Shutdown:
1. Select ‘filament’ in the software interface and allow to cool for 2 minutes.
2. Select the ‘Vent’ button, allow chamber to vent and the door to release.
3. Slowly pull out door, loosen latches and remove sample holder from SEM.
4. Close the chamber door, hold for 2 seconds and wait for chamber to evacuate.
5. Select the ‘Power Off’ button in the software interface, select ‘yes’ to the alert
message and ‘ok’ to the following message.
6. Exit the SEM computer software

89
Appendix B2 - Supporting results section
Supporting experimental data and analysis is found throughout this section. This includes
all supporting assay data, calculated balances and operational variables.
Relevant tables
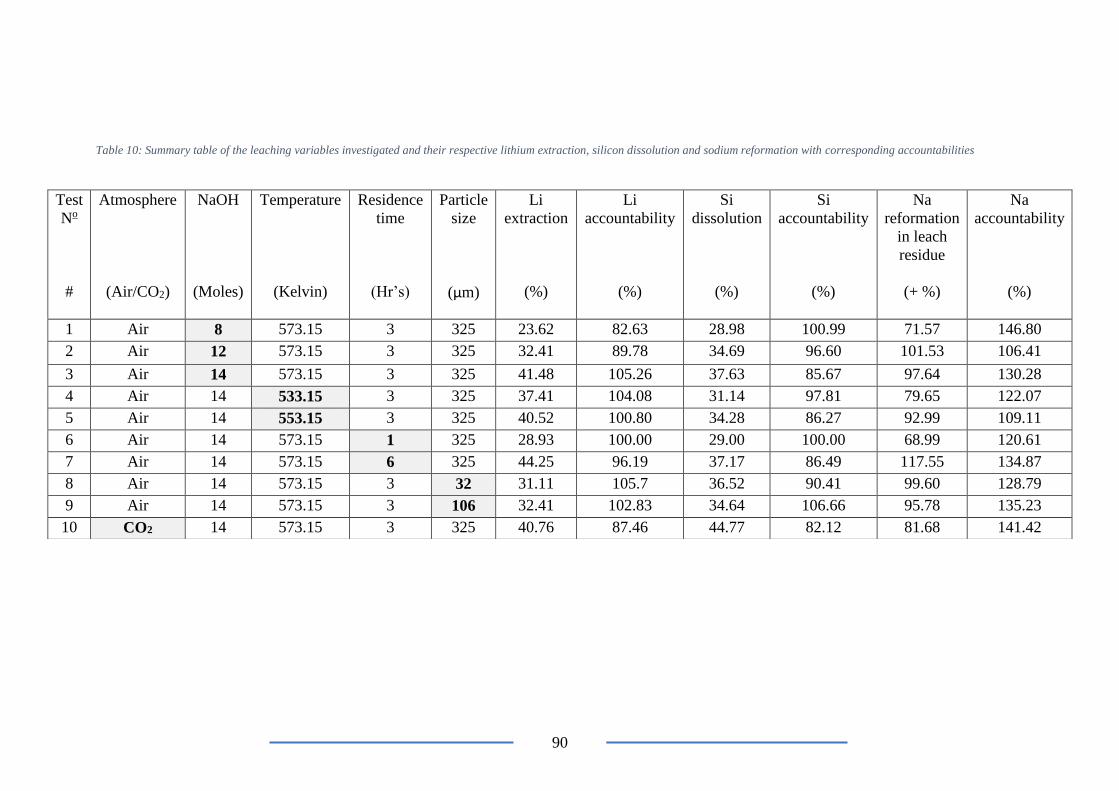
90
Table 10: Summary table of the leaching variables investigated and their respective lithium extraction, silicon dissolution and sodium reformation with corresponding accountabilities
Test
No
#
Atmosphere
(Air/CO2)
NaOH
(Moles)
Temperature
(Kelvin)
Residence
time
(Hr’s)
Particle
size
(µm)
Li
extraction
(%)
Li
accountability
(%)
Si
dissolution
(%)
Si
accountability
(%)
Na
reformation
in leach
residue
(+ %)
Na
accountability
(%)
1 Air 8 573.15 3 325 23.62 82.63 28.98 100.99 71.57 146.80
2 Air 12 573.15 3 325 32.41 89.78 34.69 96.60 101.53 106.41
3 Air 14 573.15 3 325 41.48 105.26 37.63 85.67 97.64 130.28
4 Air 14 533.15 3 325 37.41 104.08 31.14 97.81 79.65 122.07
5 Air 14 553.15 3 325 40.52 100.80 34.28 86.27 92.99 109.11
6 Air 14 573.15 1 325 28.93 100.00 29.00 100.00 68.99 120.61
7 Air 14 573.15 6 325 44.25 96.19 37.17 86.49 117.55 134.87
8 Air 14 573.15 3 32 31.11 105.7 36.52 90.41 99.60 128.79
9 Air 14 573.15 3 106 32.41 102.83 34.64 106.66 95.78 135.23
10 CO2 14 573.15 3 325 40.76 87.46 44.77 82.12 81.68 141.42
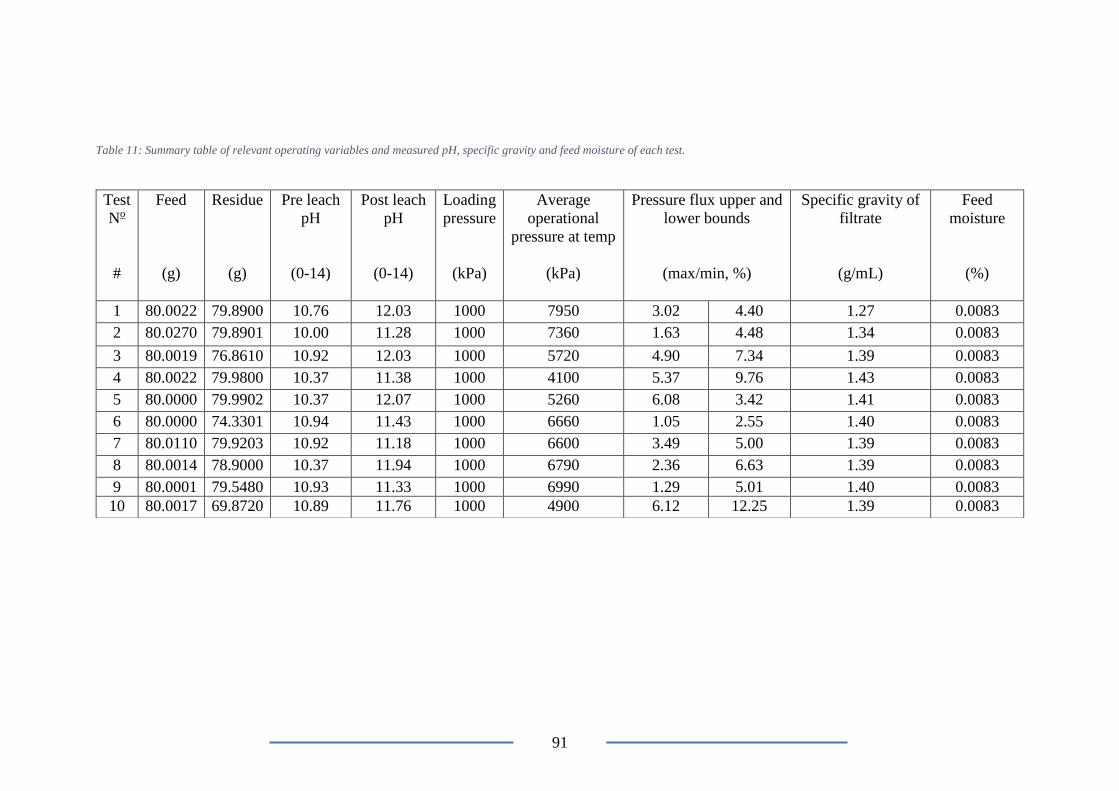
91
Table 11: Summary table of relevant operating variables and measured pH, specific gravity and feed moisture of each test.
Test
No
#
Feed
(g)
Residue
(g)
Pre leach
pH
(0-14)
Post leach
pH
(0-14)
Loading
pressure
(kPa)
Average
operational
pressure at temp
(kPa)
Pressure flux upper and
lower bounds
(max/min, %)
Specific gravity of
filtrate
(g/mL)
Feed
moisture
(%)
1 80.0022 79.8900 10.76 12.03 1000 7950 3.02 4.40 1.27 0.0083
2 80.0270 79.8901 10.00 11.28 1000 7360 1.63 4.48 1.34 0.0083
3 80.0019 76.8610 10.92 12.03 1000 5720 4.90 7.34 1.39 0.0083
4 80.0022 79.9800 10.37 11.38 1000 4100 5.37 9.76 1.43 0.0083
5 80.0000 79.9902 10.37 12.07 1000 5260 6.08 3.42 1.41 0.0083
6 80.0000 74.3301 10.94 11.43 1000 6660 1.05 2.55 1.40 0.0083
7 80.0110 79.9203 10.92 11.18 1000 6600 3.49 5.00 1.39 0.0083
8 80.0014 78.9000 10.37 11.94 1000 6790 2.36 6.63 1.39 0.0083
9 80.0001 79.5480 10.93 11.33 1000 6990 1.29 5.01 1.40 0.0083
10 80.0017 69.8720 10.89 11.76 1000 4900 6.12 12.25 1.39 0.0083
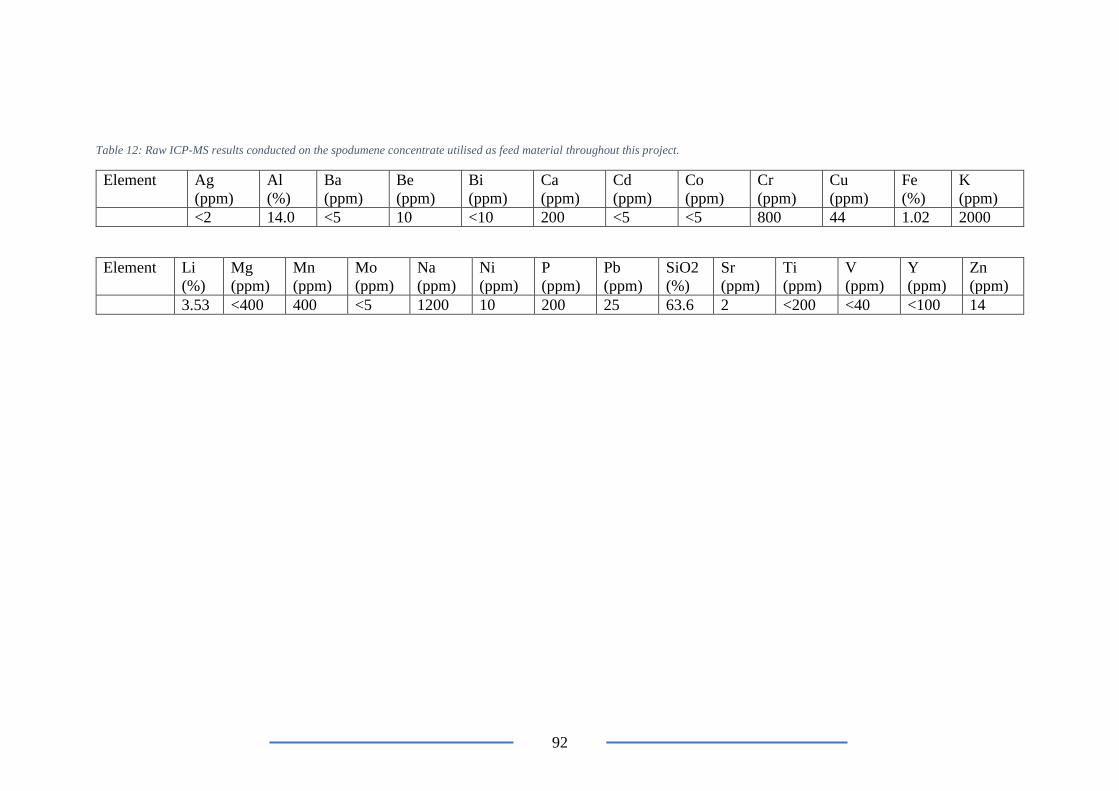
92
Table 12: Raw ICP-MS results conducted on the spodumene concentrate utilised as feed material throughout this project.
Element Ag
(ppm)
Al
(%)
Ba
(ppm)
Be
(ppm)
Bi
(ppm)
Ca
(ppm)
Cd
(ppm)
Co
(ppm)
Cr
(ppm)
Cu
(ppm)
Fe
(%)
K
(ppm) <2 14.0 <5 10 <10 200 <5 <5 800 44 1.02 2000
Element Li
(%)
Mg
(ppm)
Mn
(ppm)
Mo
(ppm)
Na
(ppm)
Ni
(ppm)
P
(ppm)
Pb
(ppm)
SiO2
(%)
Sr
(ppm)
Ti
(ppm)
V
(ppm)
Y
(ppm)
Zn
(ppm)
3.53 <400 400 <5 1200 10 200 25 63.6 2 <200 <40 <100 14

93
Table 13: Analysis and balance on test 1- 8M NaOH leach conducted
Ore
(g)
NaOH
(g)
DI
(g)
Solution
(g)
Total out
(g)
Residue
(g)
Soln out
(mL)
SG
filtrate
(g/mL)
80.0022 83.34 240.00 242.61 388.00 79.89 242.61 1.270
Element Feed
(%)
Feed
(g)
Residue
(%)
Residue
(g)
Aq
(g/L)
Wash
(g/L)
Extraction
(%)
Accountability
(%)
Li 3.53 2.82 2.70 2.16 0.43 0.29 23.62 82.63
Si 29.79 23.79 21.10 16.89 17.48 11.91 28.98 100.99
Na - 0.12 10.90 8.71 156.95 97.95 + 71.51 146.80
Table 14: Analysis and balance on test 2- 12M NaOH leach conducted
Ore
(g)
NaOH
(g)
DI
(g)
Solution
(g)
Total out
(g)
Residue
(g)
Soln out
(mL)
SG
filtrate
(g/mL)
80.03 133.44 240.00 371.17 435.00 79.89 264.60 1.342
Element Feed
(%)
Feed
(g)
Residue
(%)
Residue
(g)
Aq
(g/L)
Wash
(g/L)
Extraction
(%)
Accountability
(%)
Li 3.53 2.82 2.40 1.91 1.95 0.42 32.41 89.78
Si 29.79 23.79 19.50 15.54 24.02 4.12 34.69 96.60
Na - 0.12 15.40 12.30 214.55 47.78 + 101.53 106.41
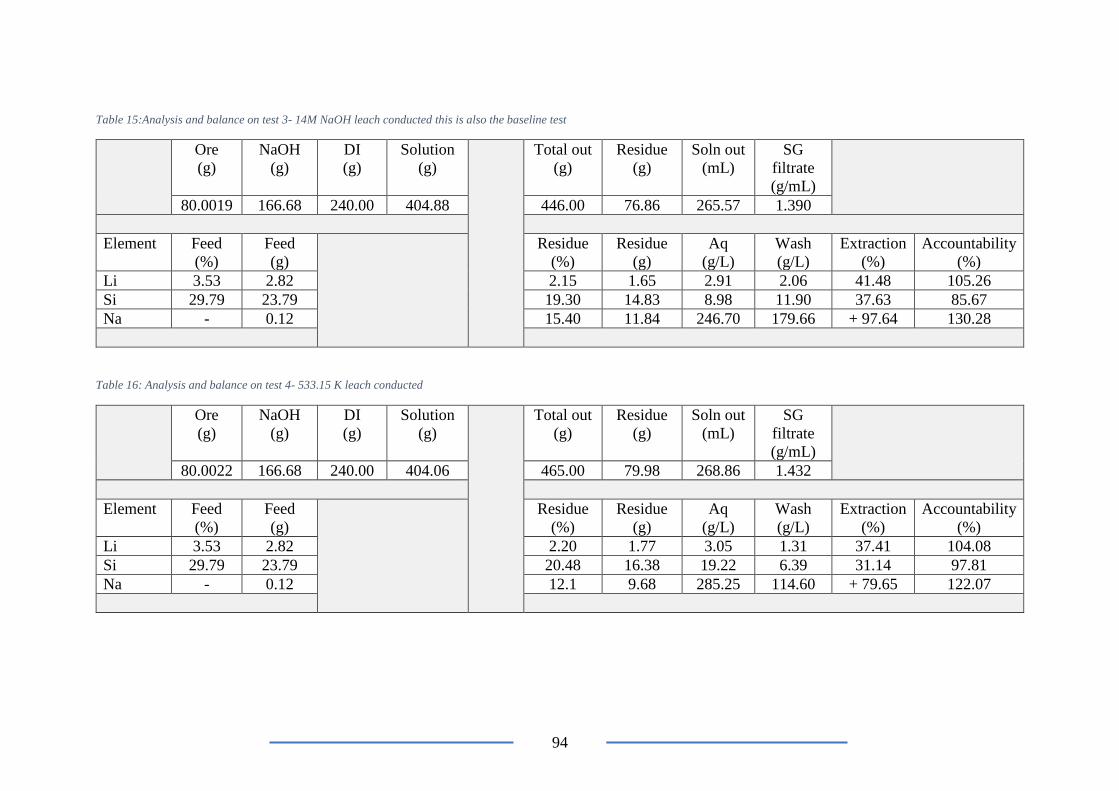
94
Table 15:Analysis and balance on test 3- 14M NaOH leach conducted this is also the baseline test
Ore
(g)
NaOH
(g)
DI
(g)
Solution
(g)
Total out
(g)
Residue
(g)
Soln out
(mL)
SG
filtrate
(g/mL)
80.0019 166.68 240.00 404.88 446.00 76.86 265.57 1.390
Element Feed
(%)
Feed
(g)
Residue
(%)
Residue
(g)
Aq
(g/L)
Wash
(g/L)
Extraction
(%)
Accountability
(%)
Li 3.53 2.82 2.15 1.65 2.91 2.06 41.48 105.26
Si 29.79 23.79 19.30 14.83 8.98 11.90 37.63 85.67
Na - 0.12 15.40 11.84 246.70 179.66 + 97.64 130.28
Table 16: Analysis and balance on test 4- 533.15 K leach conducted
Ore
(g)
NaOH
(g)
DI
(g)
Solution
(g)
Total out
(g)
Residue
(g)
Soln out
(mL)
SG
filtrate
(g/mL)
80.0022 166.68 240.00 404.06 465.00 79.98 268.86 1.432
Element Feed
(%)
Feed
(g)
Residue
(%)
Residue
(g)
Aq
(g/L)
Wash
(g/L)
Extraction
(%)
Accountability
(%)
Li 3.53 2.82 2.20 1.77 3.05 1.31 37.41 104.08
Si 29.79 23.79 20.48 16.38 19.22 6.39 31.14 97.81
Na - 0.12 12.1 9.68 285.25 114.60 + 79.65 122.07
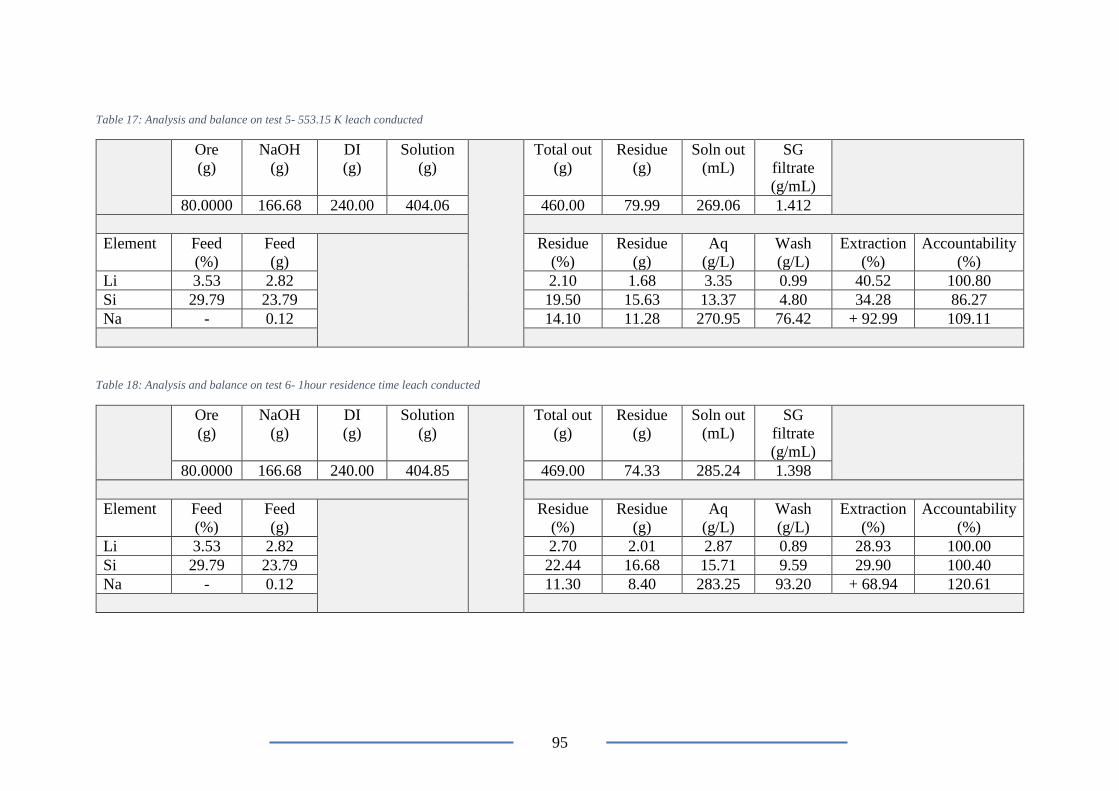
95
Table 17: Analysis and balance on test 5- 553.15 K leach conducted
Ore
(g)
NaOH
(g)
DI
(g)
Solution
(g)
Total out
(g)
Residue
(g)
Soln out
(mL)
SG
filtrate
(g/mL)
80.0000 166.68 240.00 404.06 460.00 79.99 269.06 1.412
Element Feed
(%)
Feed
(g)
Residue
(%)
Residue
(g)
Aq
(g/L)
Wash
(g/L)
Extraction
(%)
Accountability
(%)
Li 3.53 2.82 2.10 1.68 3.35 0.99 40.52 100.80
Si 29.79 23.79 19.50 15.63 13.37 4.80 34.28 86.27
Na - 0.12 14.10 11.28 270.95 76.42 + 92.99 109.11
Table 18: Analysis and balance on test 6- 1hour residence time leach conducted
Ore
(g)
NaOH
(g)
DI
(g)
Solution
(g)
Total out
(g)
Residue
(g)
Soln out
(mL)
SG
filtrate
(g/mL)
80.0000 166.68 240.00 404.85 469.00 74.33 285.24 1.398
Element Feed
(%)
Feed
(g)
Residue
(%)
Residue
(g)
Aq
(g/L)
Wash
(g/L)
Extraction
(%)
Accountability
(%)
Li 3.53 2.82 2.70 2.01 2.87 0.89 28.93 100.00
Si 29.79 23.79 22.44 16.68 15.71 9.59 29.90 100.40
Na - 0.12 11.30 8.40 283.25 93.20 + 68.94 120.61
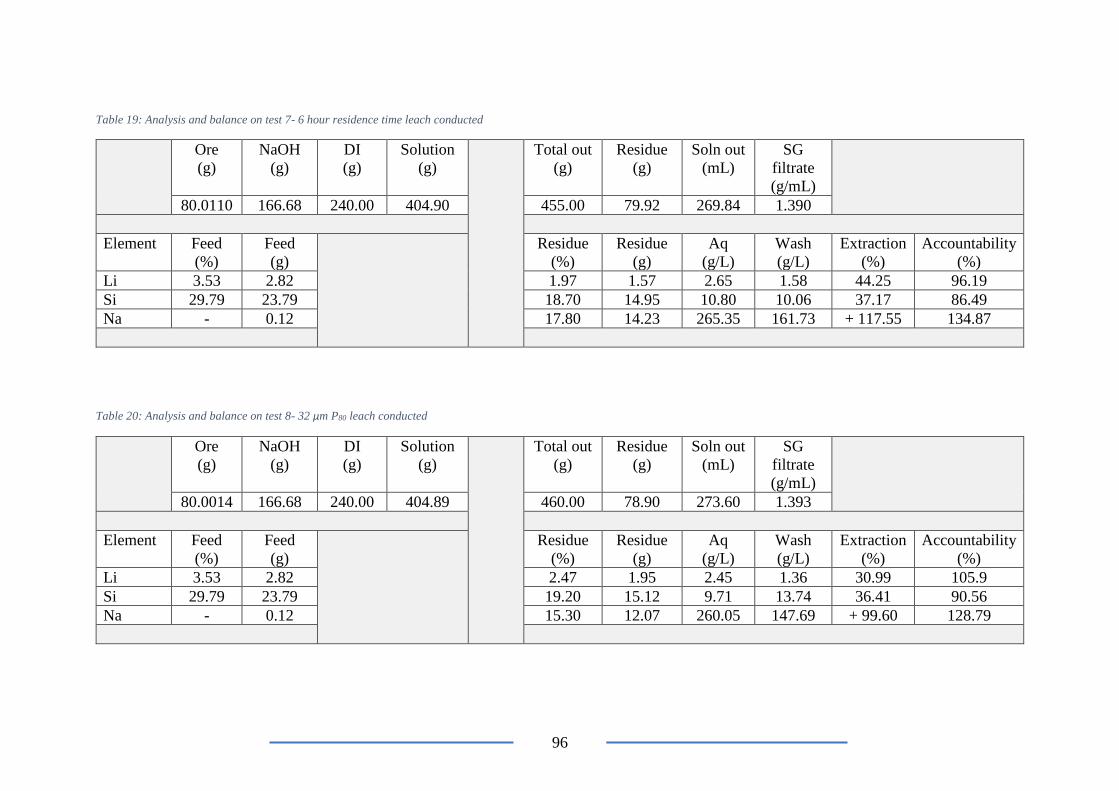
96
Table 19: Analysis and balance on test 7- 6 hour residence time leach conducted
Ore
(g)
NaOH
(g)
DI
(g)
Solution
(g)
Total out
(g)
Residue
(g)
Soln out
(mL)
SG
filtrate
(g/mL)
80.0110 166.68 240.00 404.90 455.00 79.92 269.84 1.390
Element Feed
(%)
Feed
(g)
Residue
(%)
Residue
(g)
Aq
(g/L)
Wash
(g/L)
Extraction
(%)
Accountability
(%)
Li 3.53 2.82 1.97 1.57 2.65 1.58 44.25 96.19
Si 29.79 23.79 18.70 14.95 10.80 10.06 37.17 86.49
Na - 0.12 17.80 14.23 265.35 161.73 + 117.55 134.87
Table 20: Analysis and balance on test 8- 32 µm P80 leach conducted
Ore
(g)
NaOH
(g)
DI
(g)
Solution
(g)
Total out
(g)
Residue
(g)
Soln out
(mL)
SG
filtrate
(g/mL)
80.0014 166.68 240.00 404.89 460.00 78.90 273.60 1.393
Element Feed
(%)
Feed
(g)
Residue
(%)
Residue
(g)
Aq
(g/L)
Wash
(g/L)
Extraction
(%)
Accountability
(%)
Li 3.53 2.82 2.47 1.95 2.45 1.36 30.99 105.9
Si 29.79 23.79 19.20 15.12 9.71 13.74 36.41 90.56
Na - 0.12 15.30 12.07 260.05 147.69 + 99.60 128.79
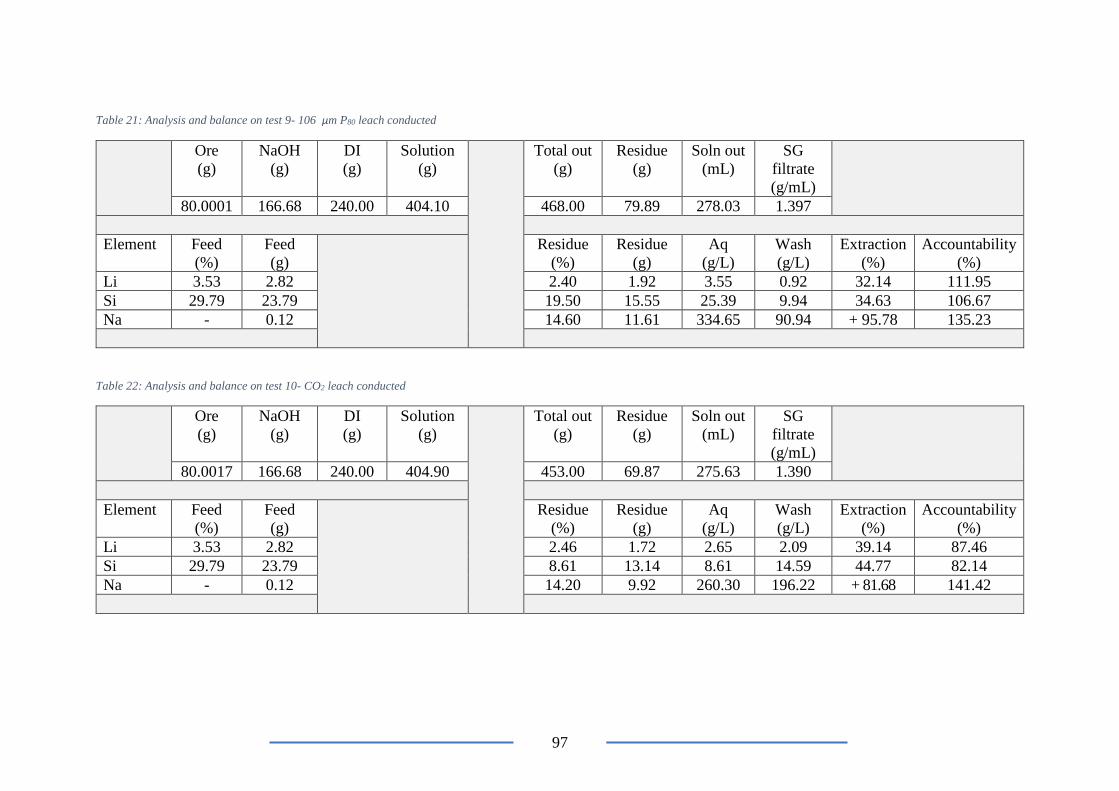
97
Table 21: Analysis and balance on test 9- 106 µm P80 leach conducted
Ore
(g)
NaOH
(g)
DI
(g)
Solution
(g)
Total out
(g)
Residue
(g)
Soln out
(mL)
SG
filtrate
(g/mL)
80.0001 166.68 240.00 404.10 468.00 79.89 278.03 1.397
Element Feed
(%)
Feed
(g)
Residue
(%)
Residue
(g)
Aq
(g/L)
Wash
(g/L)
Extraction
(%)
Accountability
(%)
Li 3.53 2.82 2.40 1.92 3.55 0.92 32.14 111.95
Si 29.79 23.79 19.50 15.55 25.39 9.94 34.63 106.67
Na - 0.12 14.60 11.61 334.65 90.94 + 95.78 135.23
Table 22: Analysis and balance on test 10- CO2 leach conducted
Ore
(g)
NaOH
(g)
DI
(g)
Solution
(g)
Total out
(g)
Residue
(g)
Soln out
(mL)
SG
filtrate
(g/mL)
80.0017 166.68 240.00 404.90 453.00 69.87 275.63 1.390
Element Feed
(%)
Feed
(g)
Residue
(%)
Residue
(g)
Aq
(g/L)
Wash
(g/L)
Extraction
(%)
Accountability
(%)
Li 3.53 2.82 2.46 1.72 2.65 2.09 39.14 87.46
Si 29.79 23.79 8.61 13.14 8.61 14.59 44.77 82.14
Na - 0.12 14.20 9.92 260.30 196.22 + 81.68 141.42
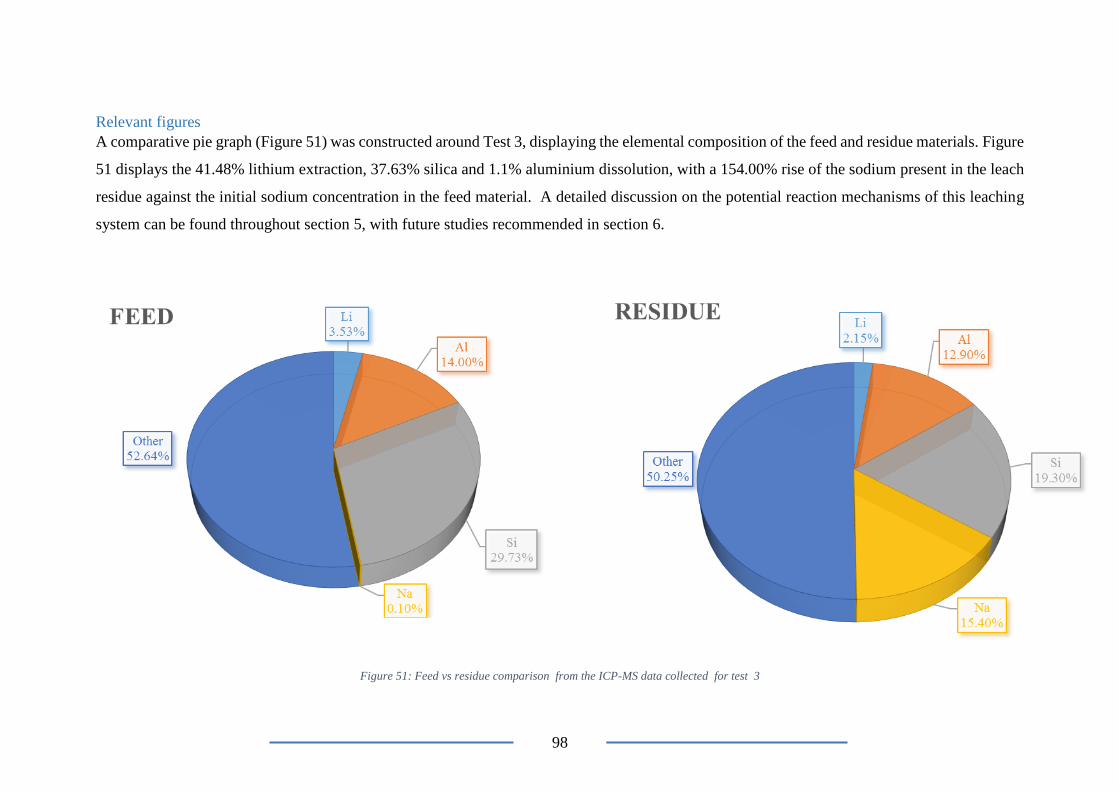
98
Relevant figures
A comparative pie graph (Figure 51) was constructed around Test 3, displaying the elemental composition of the feed and residue materials. Figure
51 displays the 41.48% lithium extraction, 37.63% silica and 1.1% aluminium dissolution, with a 154.00% rise of the sodium present in the leach
residue against the initial sodium concentration in the feed material. A detailed discussion on the potential reaction mechanisms of this leaching
system can be found throughout section 5, with future studies recommended in section 6.
Figure 51: Feed vs residue comparison from the ICP-MS data collected for test 3
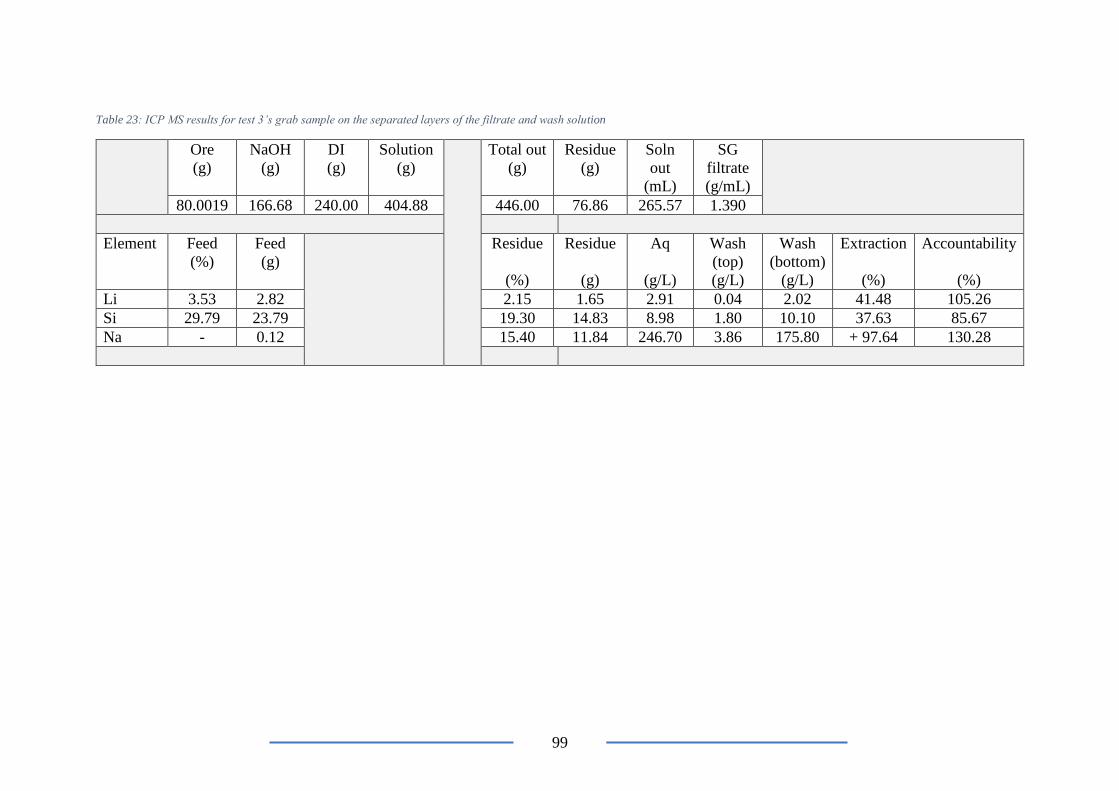
99
Table 23: ICP MS results for test 3’s grab sample on the separated layers of the filtrate and wash solution
Ore
(g)
NaOH
(g)
DI
(g)
Solution
(g)
Total out
(g)
Residue
(g)
Soln
out
(mL)
SG
filtrate
(g/mL)
80.0019 166.68 240.00 404.88 446.00 76.86 265.57 1.390
Element Feed
(%)
Feed
(g)
Residue
(%)
Residue
(g)
Aq
(g/L)
Wash
(top)
(g/L)
Wash
(bottom)
(g/L)
Extraction
(%)
Accountability
(%)
Li 3.53 2.82 2.15 1.65 2.91 0.04 2.02 41.48 105.26
Si 29.79 23.79 19.30 14.83 8.98 1.80 10.10 37.63 85.67
Na - 0.12 15.40 11.84 246.70 3.86 175.80 + 97.64 130.28
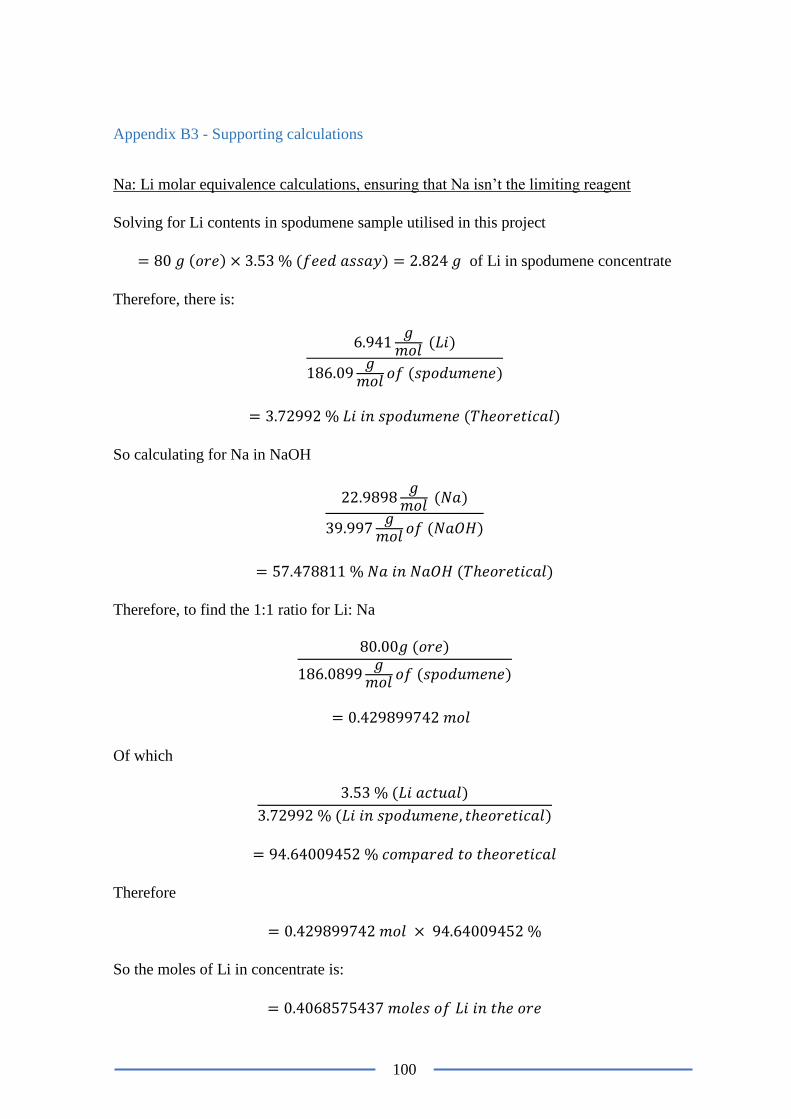
100
Appendix B3 - Supporting calculations
Na: Li molar equivalence calculations, ensuring that Na isn’t the limiting reagent
Solving for Li contents in spodumene sample utilised in this project
= 80 𝑔 (𝑜𝑟𝑒) × 3.53 % (𝑓𝑒𝑒𝑑 𝑎𝑠𝑠𝑎𝑦) = 2.824 𝑔 of Li in spodumene concentrate
Therefore, there is:
6.941𝑔𝑚𝑜𝑙
(𝐿𝑖)
186.09𝑔𝑚𝑜𝑙
𝑜𝑓 (𝑠𝑝𝑜𝑑𝑢𝑚𝑒𝑛𝑒)
= 3.72992 % 𝐿𝑖 𝑖𝑛 𝑠𝑝𝑜𝑑𝑢𝑚𝑒𝑛𝑒 (𝑇ℎ𝑒𝑜𝑟𝑒𝑡𝑖𝑐𝑎𝑙)
So calculating for Na in NaOH
22.9898𝑔𝑚𝑜𝑙
(𝑁𝑎)
39.997𝑔𝑚𝑜𝑙
𝑜𝑓 (𝑁𝑎𝑂𝐻)
= 57.478811 % 𝑁𝑎 𝑖𝑛 𝑁𝑎𝑂𝐻 (𝑇ℎ𝑒𝑜𝑟𝑒𝑡𝑖𝑐𝑎𝑙)
Therefore, to find the 1:1 ratio for Li: Na
80.00𝑔 (𝑜𝑟𝑒)
186.0899𝑔𝑚𝑜𝑙
𝑜𝑓 (𝑠𝑝𝑜𝑑𝑢𝑚𝑒𝑛𝑒)
= 0.429899742 𝑚𝑜𝑙
Of which
3.53 % (𝐿𝑖 𝑎𝑐𝑡𝑢𝑎𝑙)
3.72992 % (𝐿𝑖 𝑖𝑛 𝑠𝑝𝑜𝑑𝑢𝑚𝑒𝑛𝑒, 𝑡ℎ𝑒𝑜𝑟𝑒𝑡𝑖𝑐𝑎𝑙)
= 94.64009452 % 𝑐𝑜𝑚𝑝𝑎𝑟𝑒𝑑 𝑡𝑜 𝑡ℎ𝑒𝑜𝑟𝑒𝑡𝑖𝑐𝑎𝑙
Therefore
= 0.429899742 𝑚𝑜𝑙 × 94.64009452 %
So the moles of Li in concentrate is:
= 0.4068575437 𝑚𝑜𝑙𝑒𝑠 𝑜𝑓 𝐿𝑖 𝑖𝑛 𝑡ℎ𝑒 𝑜𝑟𝑒
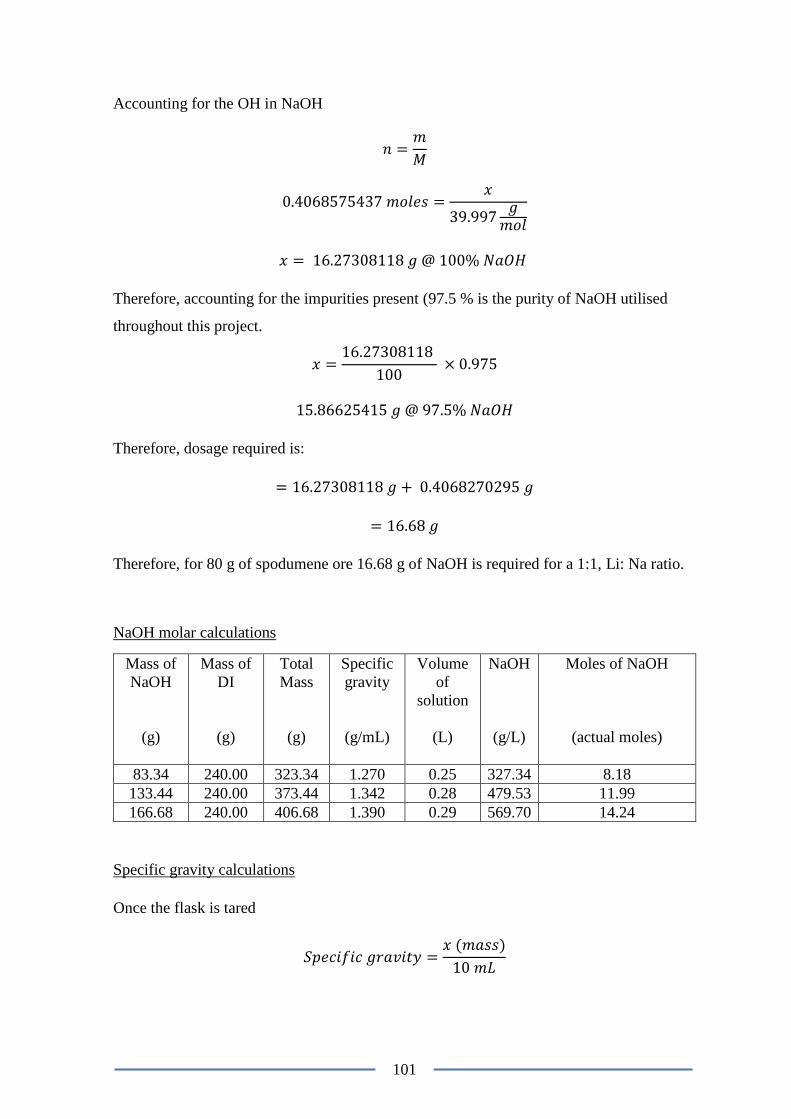
101
Accounting for the OH in NaOH
𝑛 =𝑚
𝑀
0.4068575437 𝑚𝑜𝑙𝑒𝑠 =𝑥
39.997𝑔𝑚𝑜𝑙
𝑥 = 16.27308118 𝑔 @ 100% 𝑁𝑎𝑂𝐻
Therefore, accounting for the impurities present (97.5 % is the purity of NaOH utilised
throughout this project.
𝑥 =16.27308118
100 × 0.975
15.86625415 𝑔 @ 97.5% 𝑁𝑎𝑂𝐻
Therefore, dosage required is:
= 16.27308118 𝑔 + 0.4068270295 𝑔
= 16.68 𝑔
Therefore, for 80 g of spodumene ore 16.68 g of NaOH is required for a 1:1, Li: Na ratio.
NaOH molar calculations
Mass of
NaOH
(g)
Mass of
DI
(g)
Total
Mass
(g)
Specific
gravity
(g/mL)
Volume
of
solution
(L)
NaOH
(g/L)
Moles of NaOH
(actual moles)
83.34 240.00 323.34 1.270 0.25 327.34 8.18
133.44 240.00 373.44 1.342 0.28 479.53 11.99
166.68 240.00 406.68 1.390 0.29 569.70 14.24
Specific gravity calculations
Once the flask is tared
𝑆𝑝𝑒𝑐𝑖𝑓𝑖𝑐 𝑔𝑟𝑎𝑣𝑖𝑡𝑦 =𝑥 (𝑚𝑎𝑠𝑠)
10 𝑚𝐿
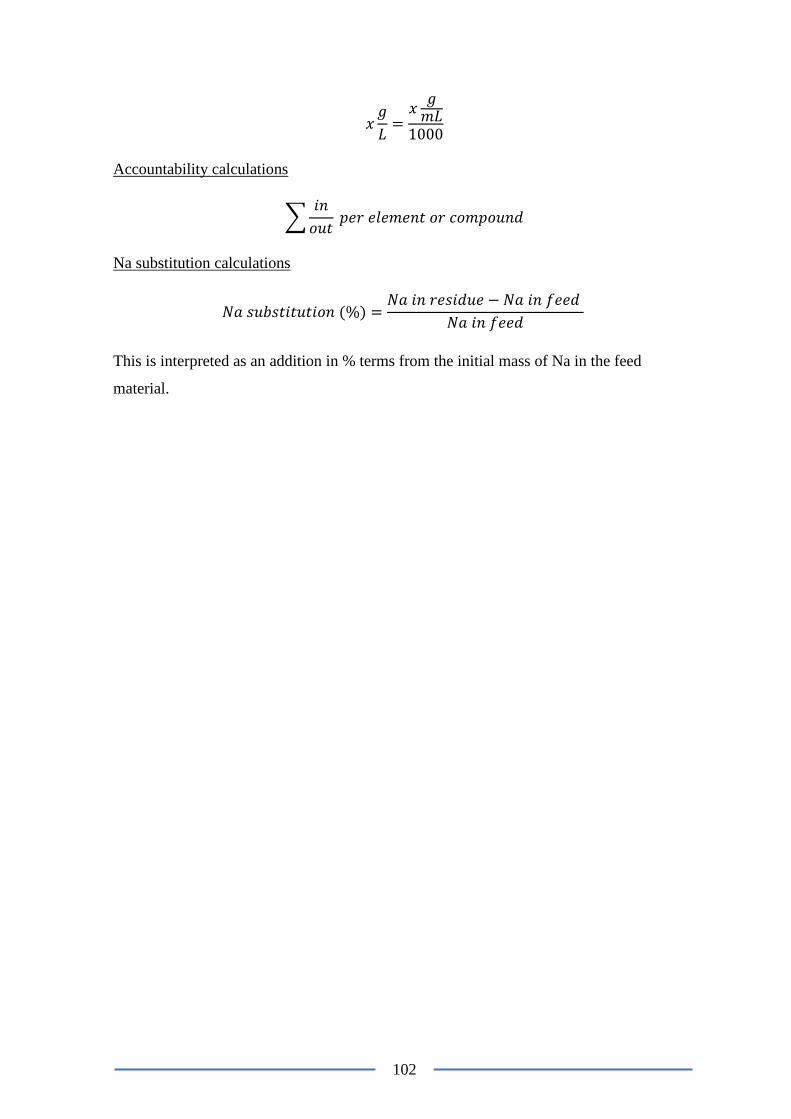
102
𝑥𝑔
𝐿=𝑥𝑔𝑚𝐿
1000
Accountability calculations
∑𝑖𝑛
𝑜𝑢𝑡 𝑝𝑒𝑟 𝑒𝑙𝑒𝑚𝑒𝑛𝑡 𝑜𝑟 𝑐𝑜𝑚𝑝𝑜𝑢𝑛𝑑
Na substitution calculations
𝑁𝑎 𝑠𝑢𝑏𝑠𝑡𝑖𝑡𝑢𝑡𝑖𝑜𝑛 (%) =𝑁𝑎 𝑖𝑛 𝑟𝑒𝑠𝑖𝑑𝑢𝑒 − 𝑁𝑎 𝑖𝑛 𝑓𝑒𝑒𝑑
𝑁𝑎 𝑖𝑛 𝑓𝑒𝑒𝑑
This is interpreted as an addition in % terms from the initial mass of Na in the feed
material.
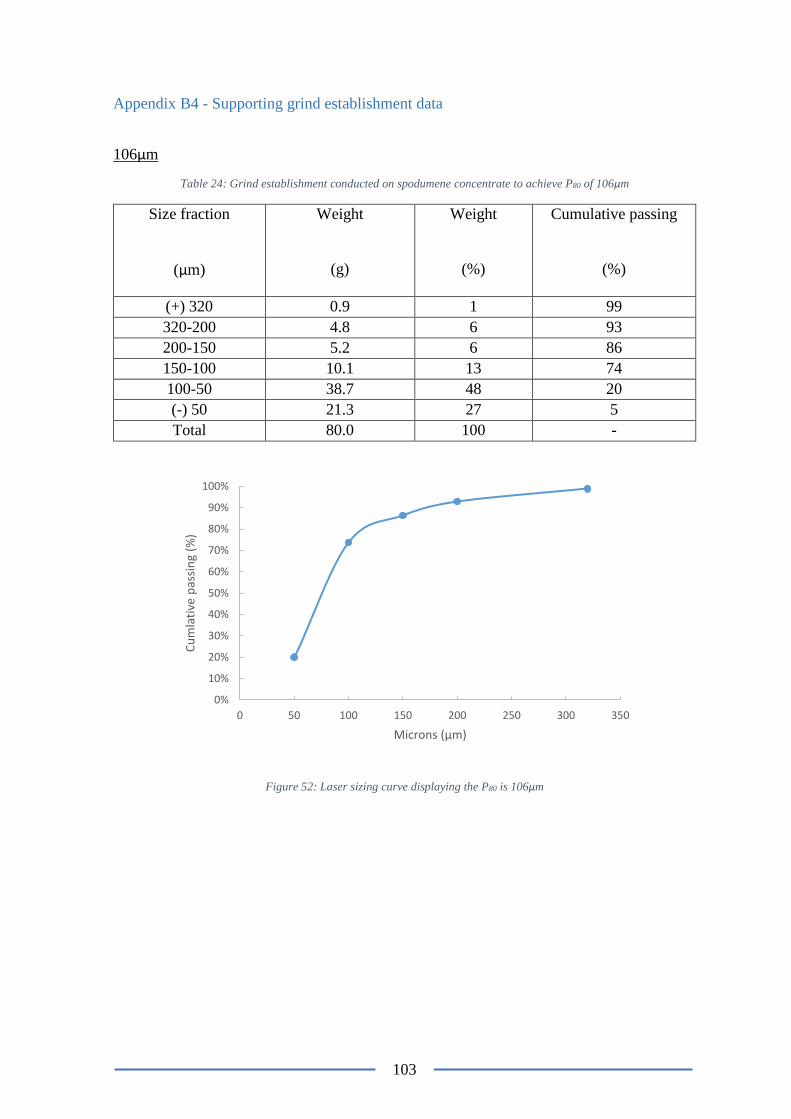
103
Appendix B4 - Supporting grind establishment data
106µm
Table 24: Grind establishment conducted on spodumene concentrate to achieve P80 of 106µm
Size fraction
(µm)
Weight
(g)
Weight
(%)
Cumulative passing
(%)
(+) 320 0.9 1 99
320-200 4.8 6 93
200-150 5.2 6 86
150-100 10.1 13 74
100-50 38.7 48 20
(-) 50 21.3 27 5
Total 80.0 100 -
Figure 52: Laser sizing curve displaying the P80 is 106µm
0%
10%
20%
30%
40%
50%
60%
70%
80%
90%
100%
0 50 100 150 200 250 300 350
Cu
mla
tive
pas
sin
g (%
)
Microns (µm)
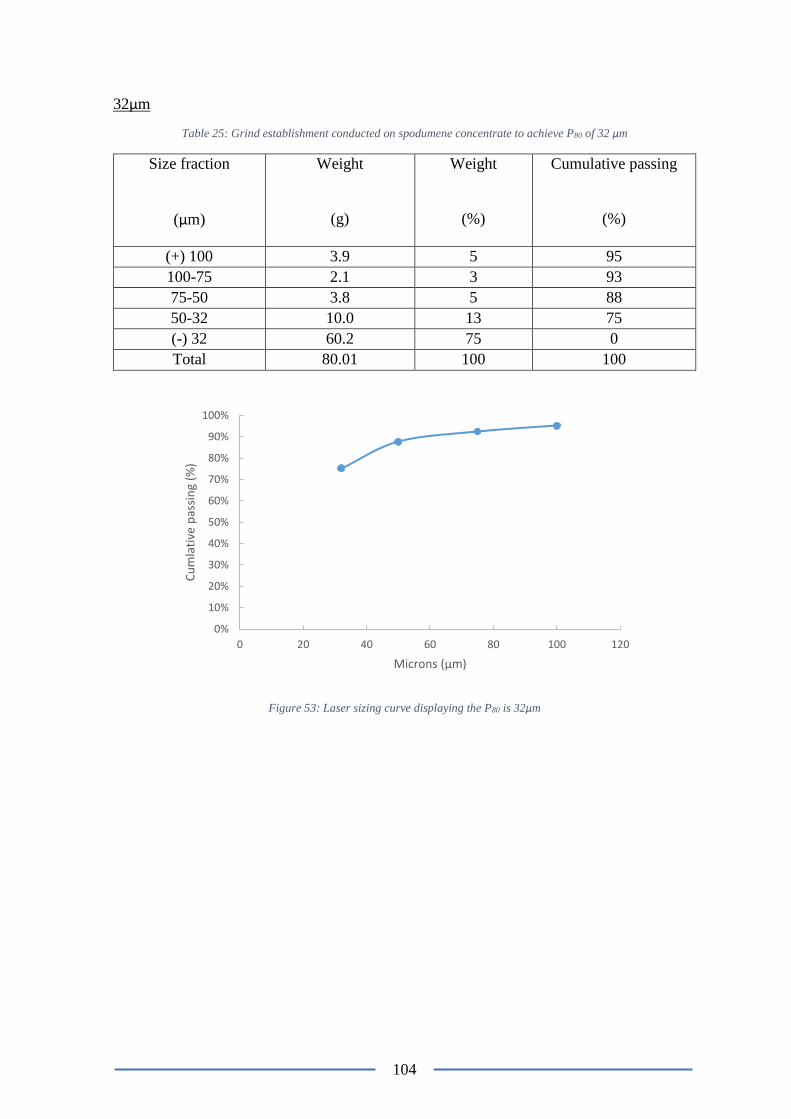
104
32µm
Table 25: Grind establishment conducted on spodumene concentrate to achieve P80 of 32 µm
Size fraction
(µm)
Weight
(g)
Weight
(%)
Cumulative passing
(%)
(+) 100 3.9 5 95
100-75 2.1 3 93
75-50 3.8 5 88
50-32 10.0 13 75
(-) 32 60.2 75 0
Total 80.01 100 100
Figure 53: Laser sizing curve displaying the P80 is 32µm
0%
10%
20%
30%
40%
50%
60%
70%
80%
90%
100%
0 20 40 60 80 100 120
Cu
mla
tive
pas
sin
g (%
)
Microns (µm)
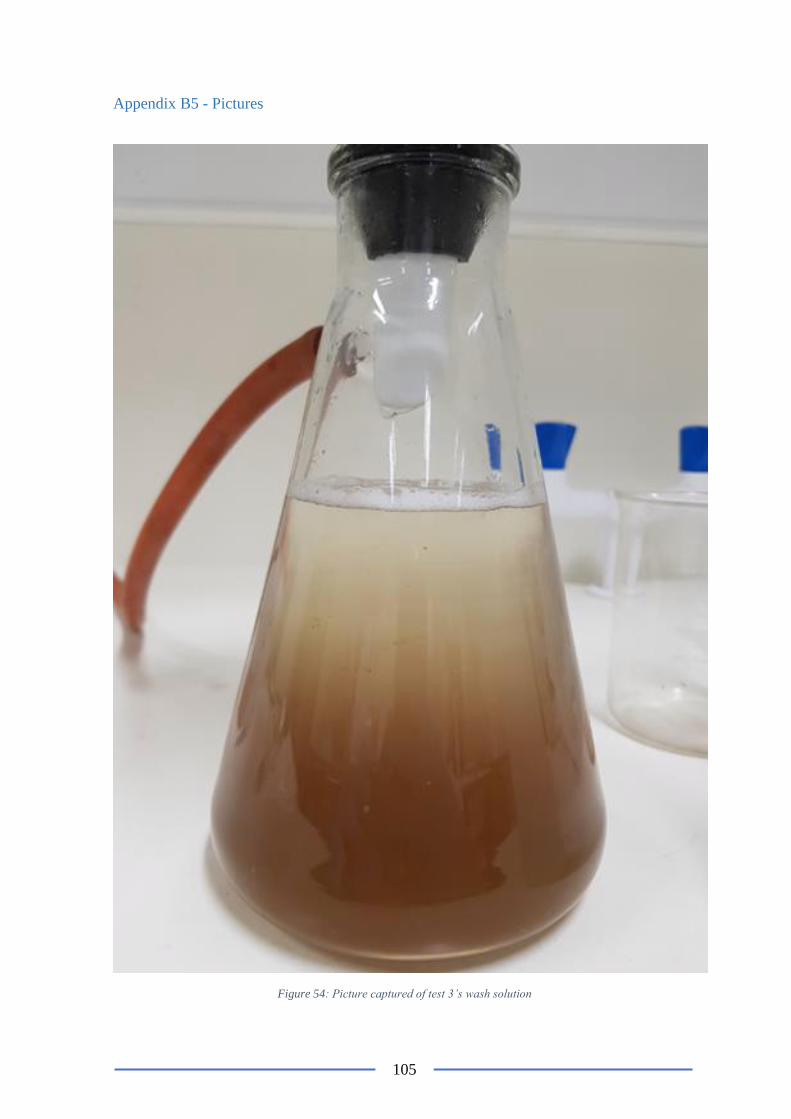
105
Appendix B5 - Pictures
Figure 54: Picture captured of test 3’s wash solution
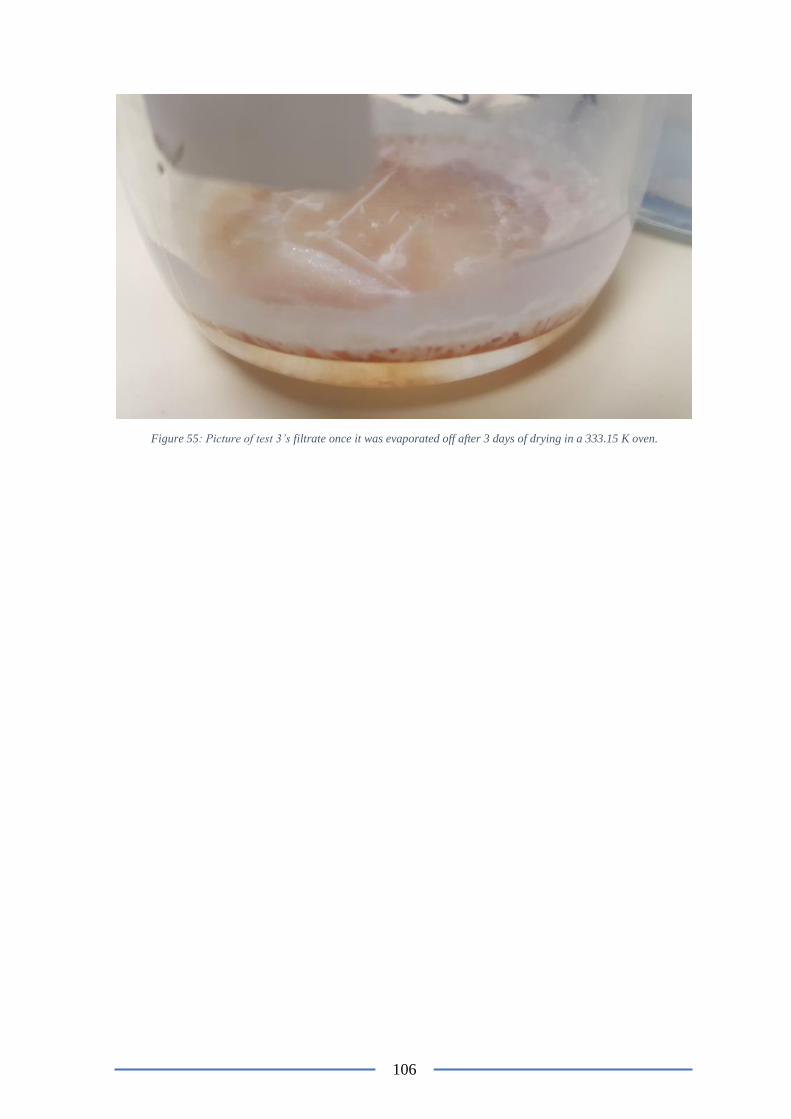
106
Figure 55: Picture of test 3’s filtrate once it was evaporated off after 3 days of drying in a 333.15 K oven.
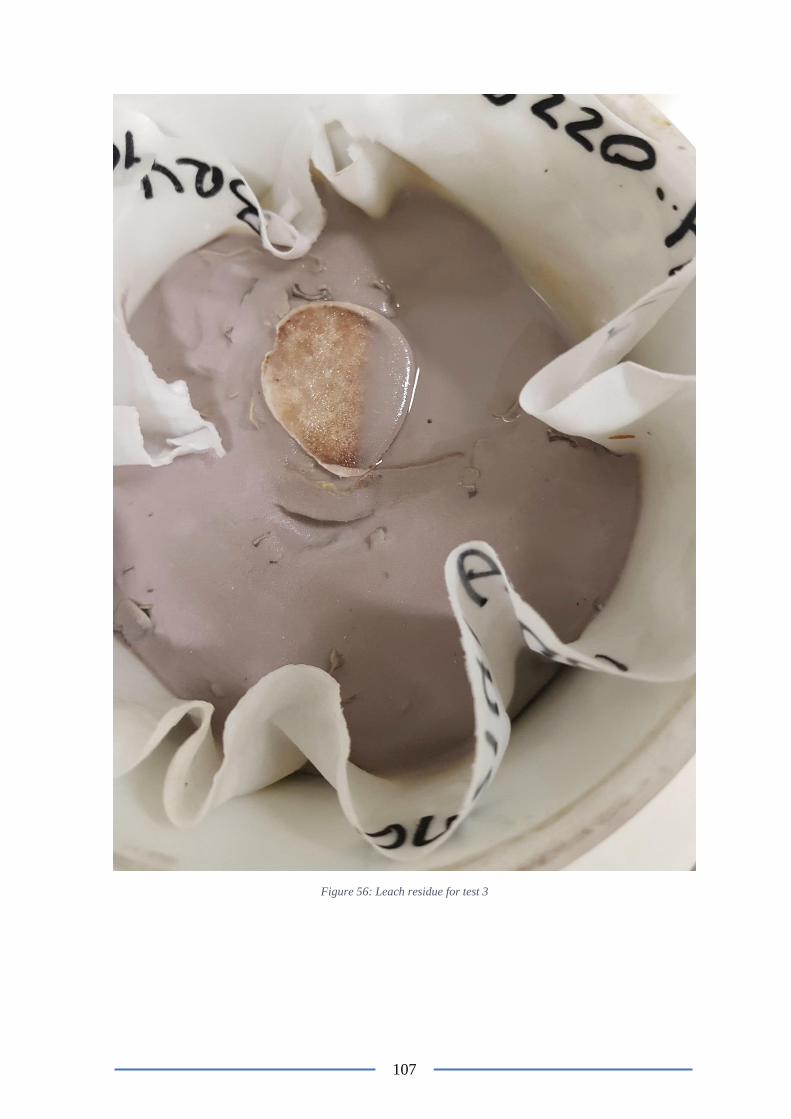
107
Figure 56: Leach residue for test 3
Top Related