


γλώσσες
Σελίδες
Νομικός

Task Force on Integrated Assessment Modelling
45th session, 23-25 May 2016
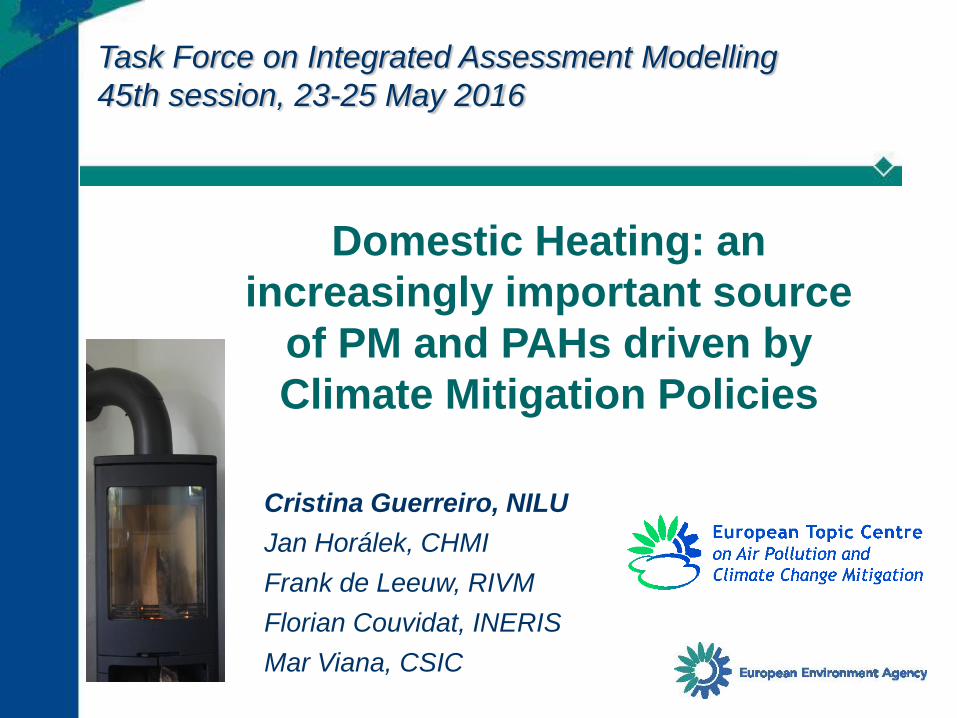
Domestic Heating: an
increasingly important source
of PM and PAHs driven by
Climate Mitigation Policies
Cristina Guerreiro, NILU
Jan Horálek, CHMI
Frank de Leeuw, RIVM
Florian Couvidat, INERIS
Mar Viana, CSIC
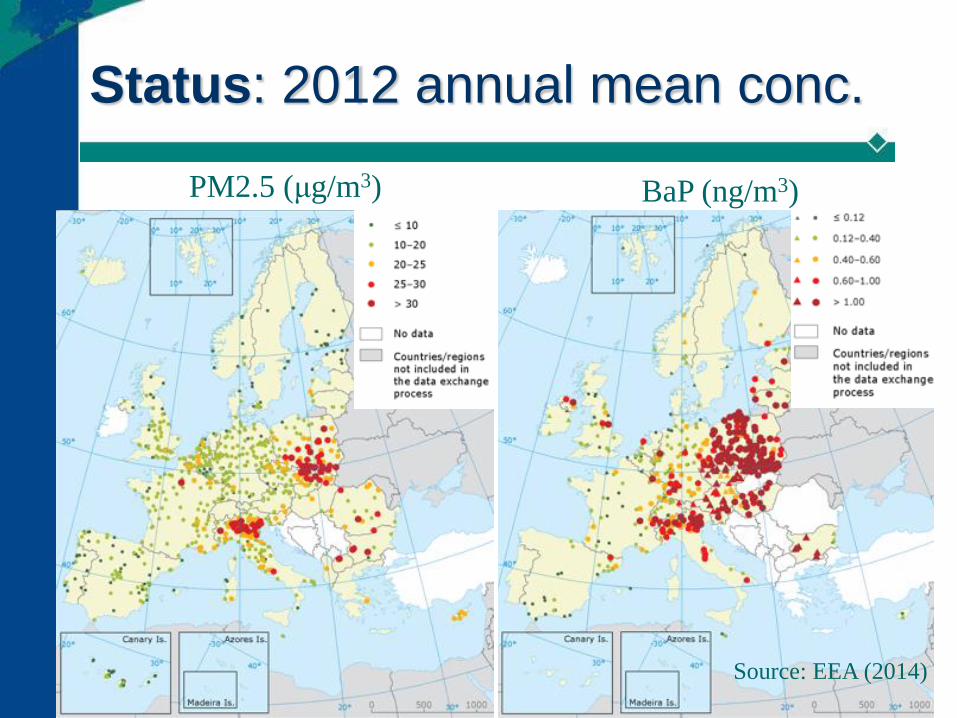
Status: 2012 annual mean conc.
2
PM2.5 (μg/m3) BaP (ng/m3)
Source: EEA (2014)
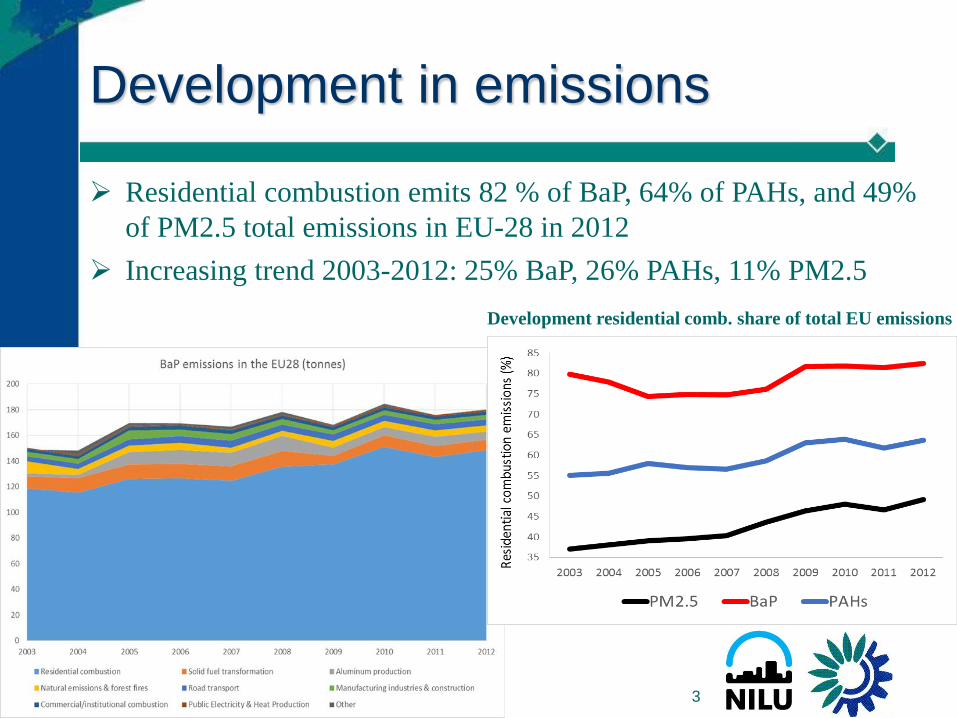
Development in emissions
3
Residential combustion emits 82 % of BaP, 64% of PAHs, and 49%
of PM2.5 total emissions in EU-28 in 2012
Increasing trend 2003-2012: 25% BaP, 26% PAHs, 11% PM2.5
Development residential comb. share of total EU emissions
Development in emissions
4
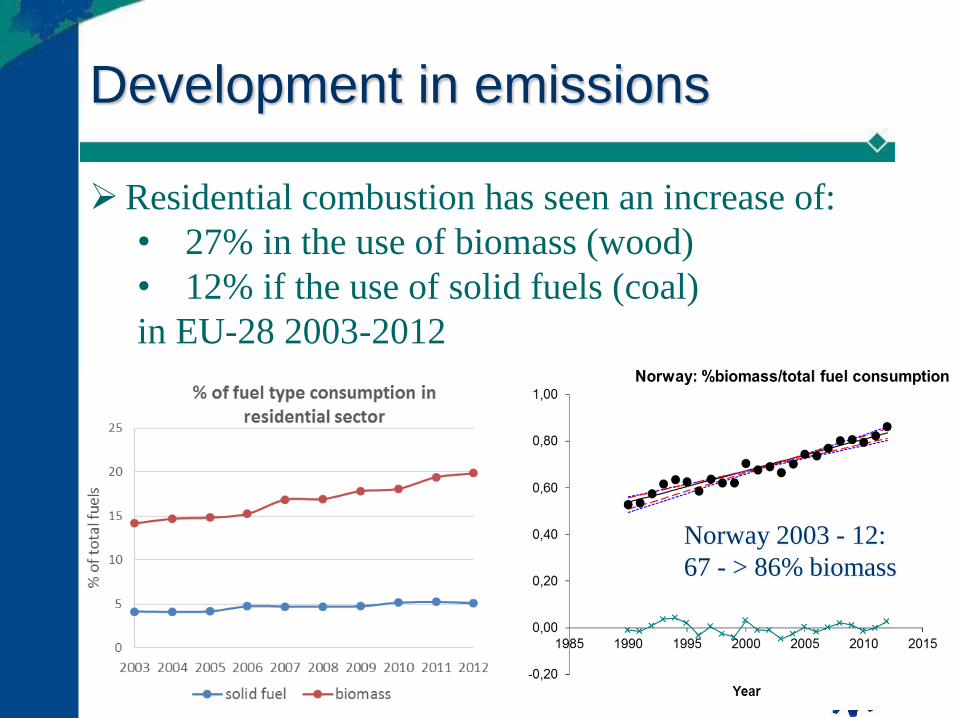
Residential combustion has seen an increase of:
• 27% in the use of biomass (wood)
• 12% if the use of solid fuels (coal)
in EU-28 2003-2012
Norway 2003 - 12:
67 - > 86% biomass
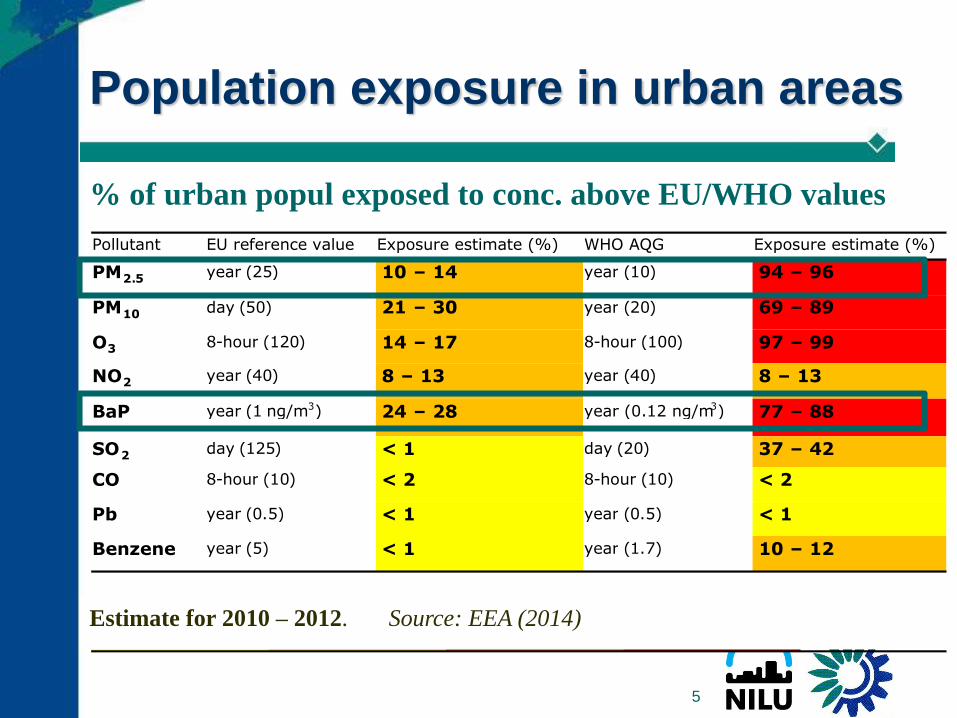
Pollutant EU reference value Exposure estimate (%) WHO AQG Exposure estimate (%)
PM 2 . 5 year ( 25 ) 10 – 14 year ( 10 ) 94 – 96
PM 10 day ( 50 ) 21 – 30 year ( 20 ) 69 – 89
O 3 8 - hour ( 120 ) 14 – 17 8 - hour ( 100 ) 97 – 99
NO 2 year ( 40 ) 8 – 13 year ( 40 ) 8 – 13
BaP year ( 1 ng/m 3 ) 24 – 28 year (0.12 ng/m 3 ) 77 – 88
SO 2 day ( 125 ) < 1 day ( 20 ) 37 – 42
CO 8 - hour ( 10 ) < 2 8 - hour ( 10 ) < 2
Pb year ( 0 . 5 ) < 1 year ( 0 . 5 ) < 1
Benzene year ( 5 ) < 1 year ( 1 . 7 ) 10 – 12
Colour coding : < 5 % 5 - 50 % 50 - 75 % > 75 %
Population exposure in urban areas
5
Estimate for 2010 – 2012. Source: EEA (2014)
% of urban popul exposed to conc. above EU/WHO values
European exposure: Methodology I
BaP concentration map
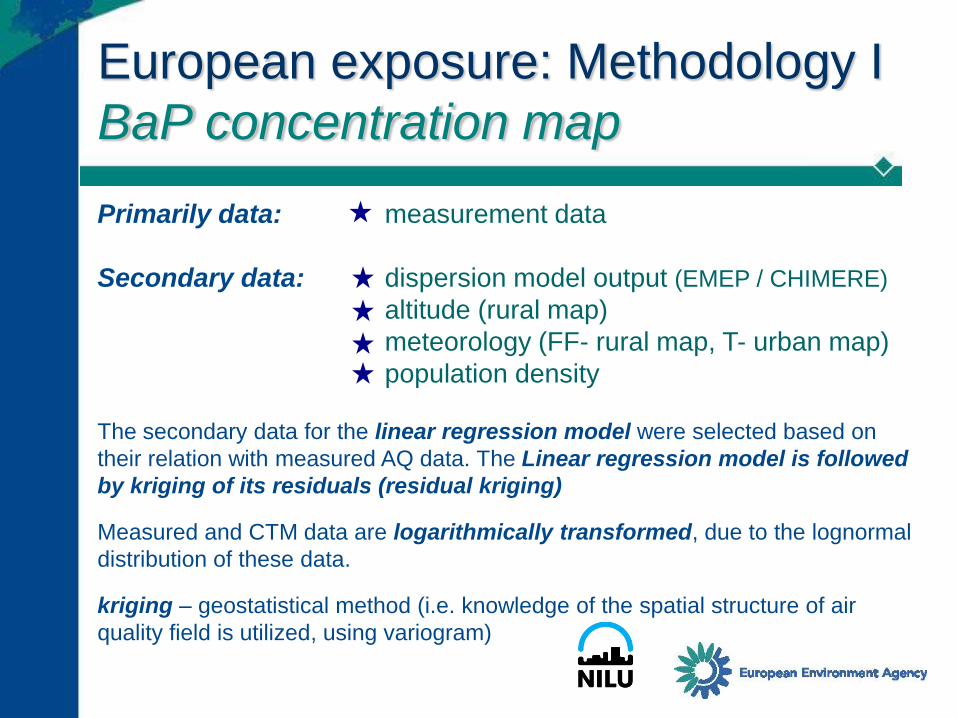
Primarily data: measurement data
Secondary data: dispersion model output (EMEP / CHIMERE)
altitude (rural map)
meteorology (FF- rural map, T- urban map)
population density
The secondary data for the linear regression model were selected based on
their relation with measured AQ data. The Linear regression model is followed
by kriging of its residuals (residual kriging)
Measured and CTM data are logarithmically transformed, due to the lognormal
distribution of these data.
kriging – geostatistical method (i.e. knowledge of the spatial structure of air
quality field is utilized, using variogram)
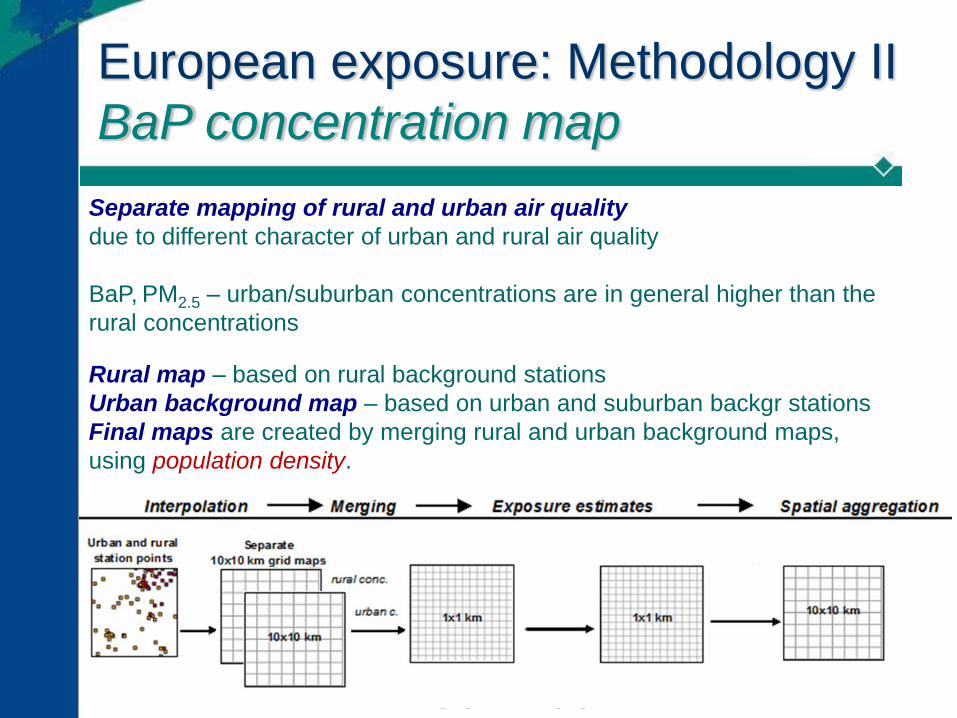
Separate mapping of rural and urban air quality
due to different character of urban and rural air quality
BaP, PM2.5 – urban/suburban concentrations are in general higher than the
rural concentrations
Rural map – based on rural background stations
Urban background map – based on urban and suburban backgr stations
Final maps are created by merging rural and urban background maps,
using population density.
European exposure: Methodology II
BaP concentration map
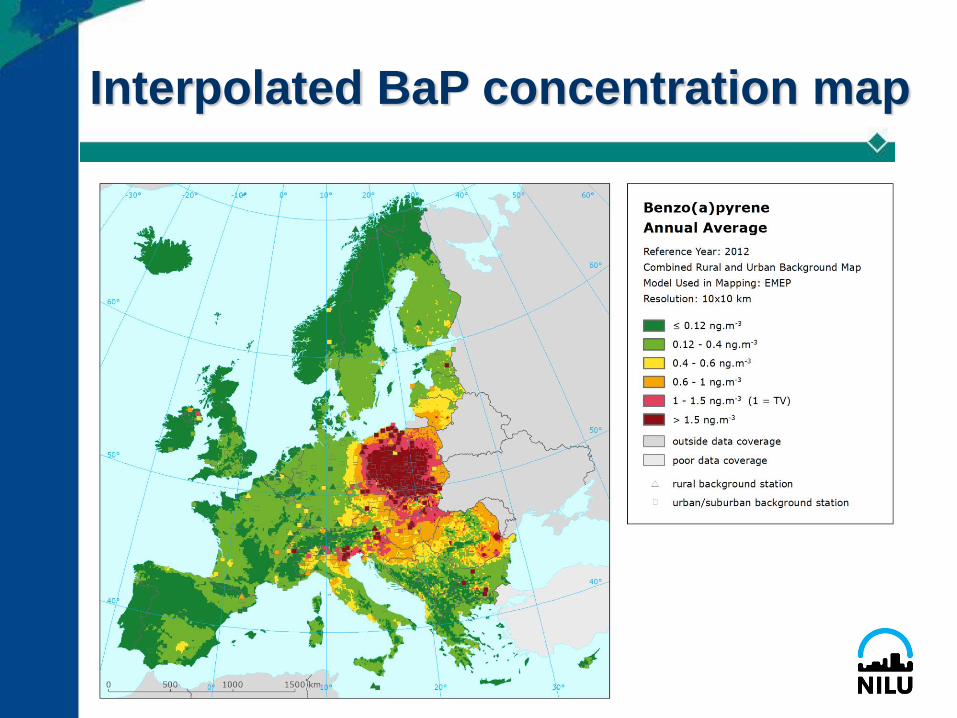
Interpolated BaP concentration map
8
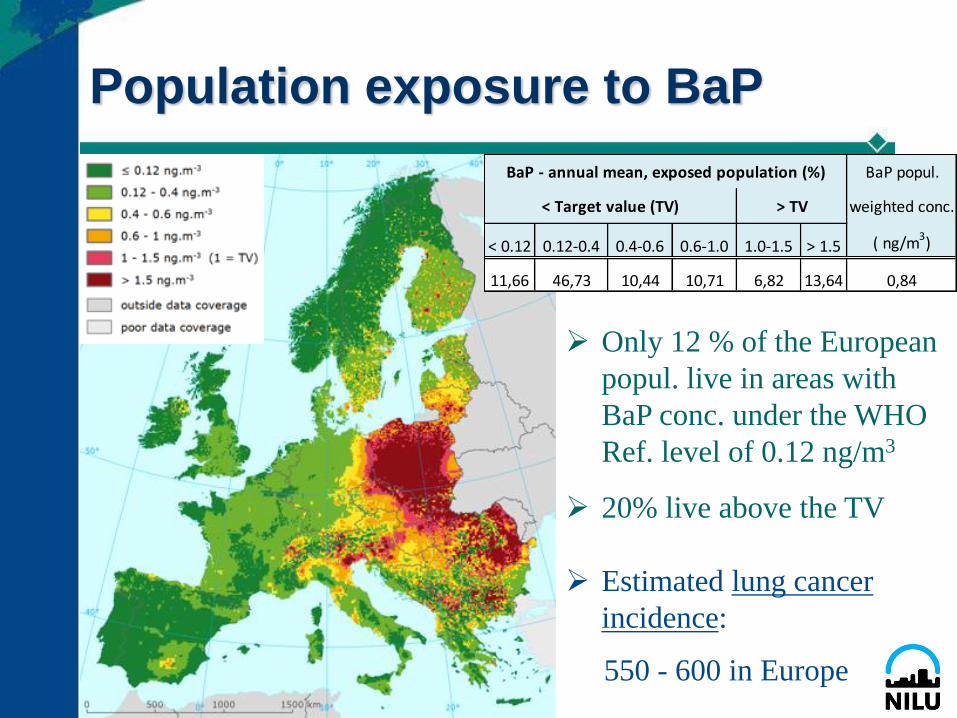
Population exposure to BaP
9
Only 12 % of the European
popul. live in areas with
BaP conc. under the WHO
Ref. level of 0.12 ng/m3
20% live above the TV
Estimated lung cancer
incidence:
550 - 600 in Europe
BaP popul.
weighted conc.
< 0.12 0.12-0.4 0.4-0.6 0.6-1.0 1.0-1.5 > 1.5 ( ng/m3)
11,66 46,73 10,44 10,71 6,82 13,64 0,84
BaP - annual mean, exposed population (%)
< Target value (TV) > TV
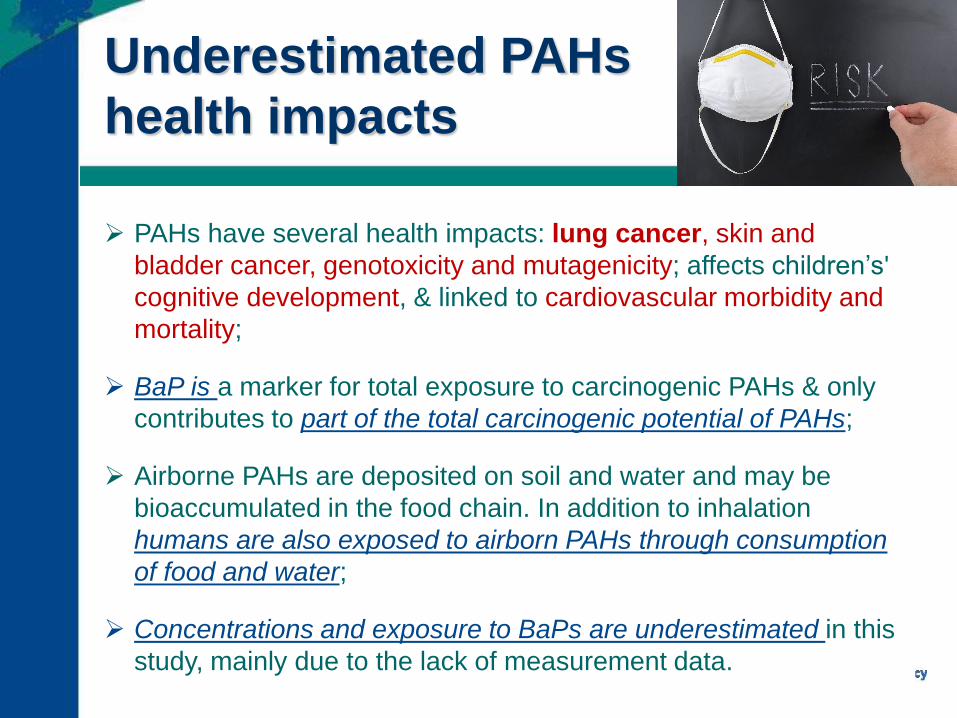
Underestimated PAHs
health impacts
PAHs have several health impacts: lung cancer, skin and
bladder cancer, genotoxicity and mutagenicity; affects children’s'
cognitive development, & linked to cardiovascular morbidity and
mortality;
BaP is a marker for total exposure to carcinogenic PAHs & only
contributes to part of the total carcinogenic potential of PAHs;
Airborne PAHs are deposited on soil and water and may be
bioaccumulated in the food chain. In addition to inhalation
humans are also exposed to airborn PAHs through consumption
of food and water;
Concentrations and exposure to BaPs are underestimated in this
study, mainly due to the lack of measurement data.
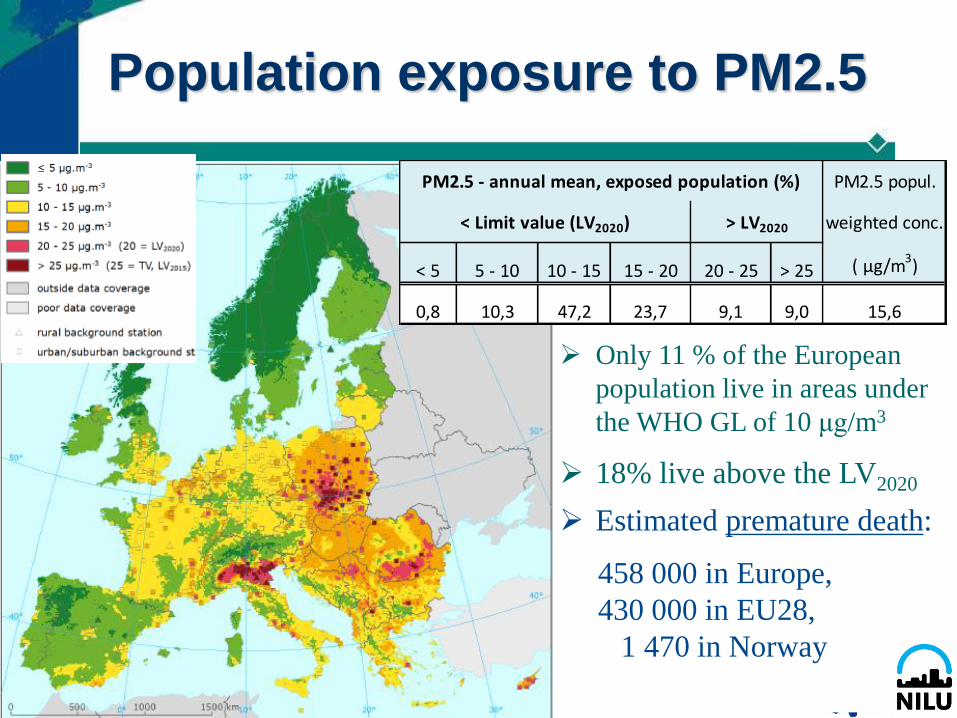
Population exposure to PM2.5
11
Only 11 % of the European
population live in areas under
the WHO GL of 10 μg/m3
18% live above the LV2020
Estimated premature death:
458 000 in Europe,
430 000 in EU28,
1 470 in Norway
PM2.5 popul.
weighted conc.
< 5 5 - 10 10 - 15 15 - 20 20 - 25 > 25 ( μg/m3)
0,8 10,3 47,2 23,7 9,1 9,0 15,6
PM2.5 - annual mean, exposed population (%)
< Limit value (LV2020) > LV2020
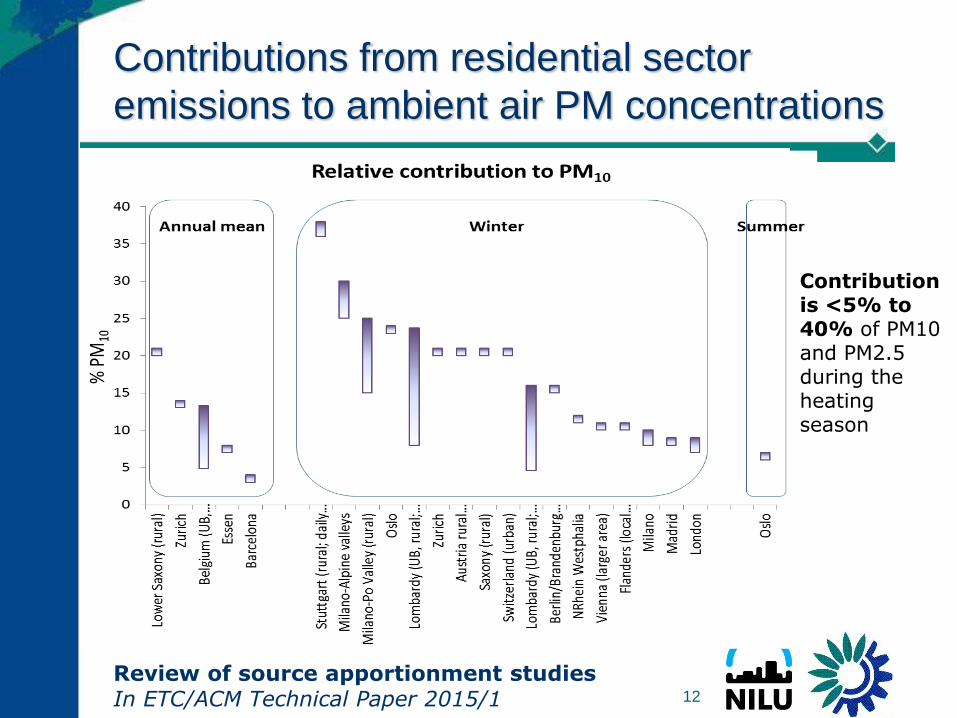
Contributions from residential sector
emissions to ambient air PM concentrations
12
Review of source apportionment studiesIn ETC/ACM Technical Paper 2015/1
Contribution is <5% to 40% of PM10 and PM2.5 during the heating season
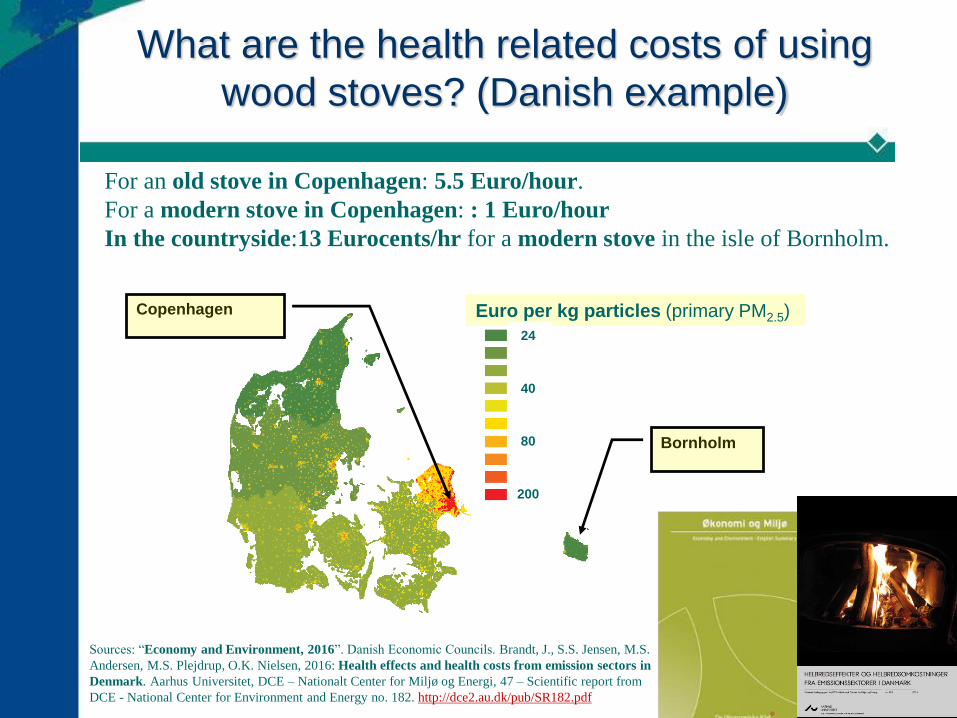
What are the health related costs of using
wood stoves? (Danish example)
13
Sources: “Economy and Environment, 2016”. Danish Economic Councils. Brandt, J., S.S. Jensen, M.S.
Andersen, M.S. Plejdrup, O.K. Nielsen, 2016: Health effects and health costs from emission sectors in
Denmark. Aarhus Universitet, DCE – Nationalt Center for Miljø og Energi, 47 – Scientific report from
DCE - National Center for Environment and Energy no. 182. http://dce2.au.dk/pub/SR182.pdf
For an old stove in Copenhagen: 5.5 Euro/hour.
For a modern stove in Copenhagen: : 1 Euro/hour
In the countryside:13 Eurocents/hr for a modern stove in the isle of Bornholm.
Euro per kg particles (primary PM2.5)
24
40
80
200
Copenhagen
Bornholm
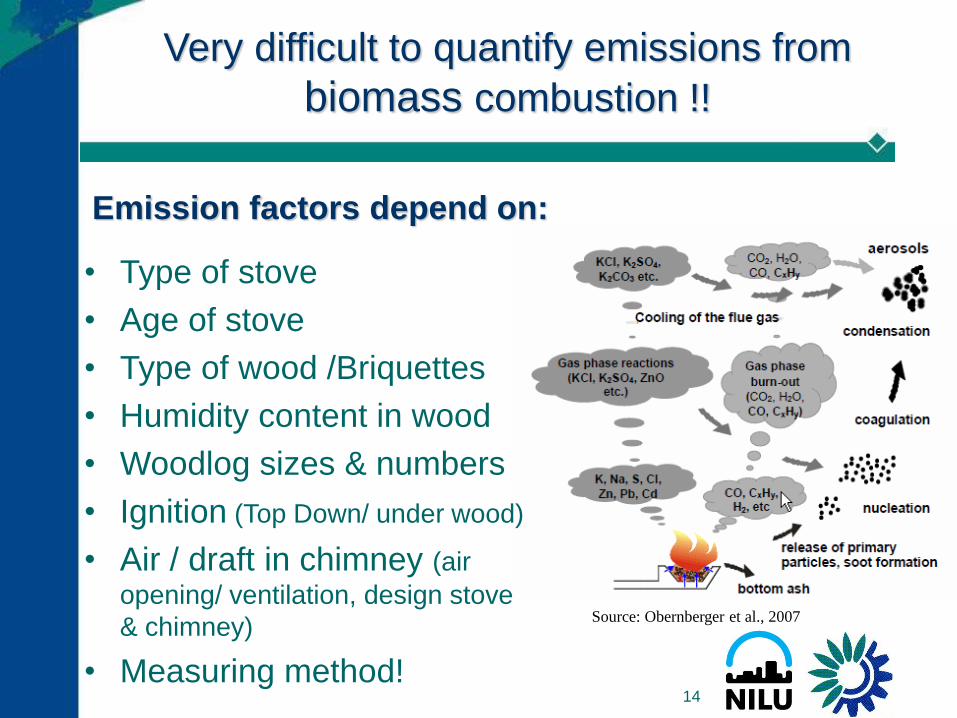
Emission factors depend on:
14
• Type of stove
• Age of stove
• Type of wood /Briquettes
• Humidity content in wood
• Woodlog sizes & numbers
• Ignition (Top Down/ under wood)
• Air / draft in chimney (air
opening/ ventilation, design stove
& chimney)
• Measuring method!
Very difficult to quantify emissions from
biomass combustion !!
Source: Obernberger et al., 2007
15
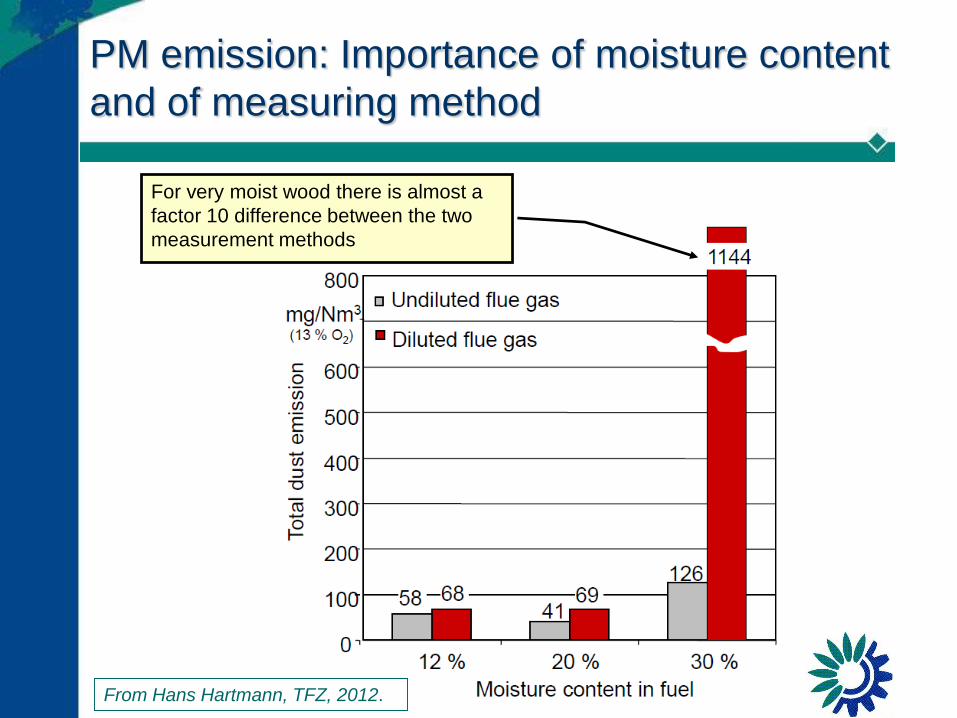
PM emission: Importance of moisture content
and of measuring method
For very moist wood there is almost a
factor 10 difference between the two
measurement methods
From Hans Hartmann, TFZ, 2012.
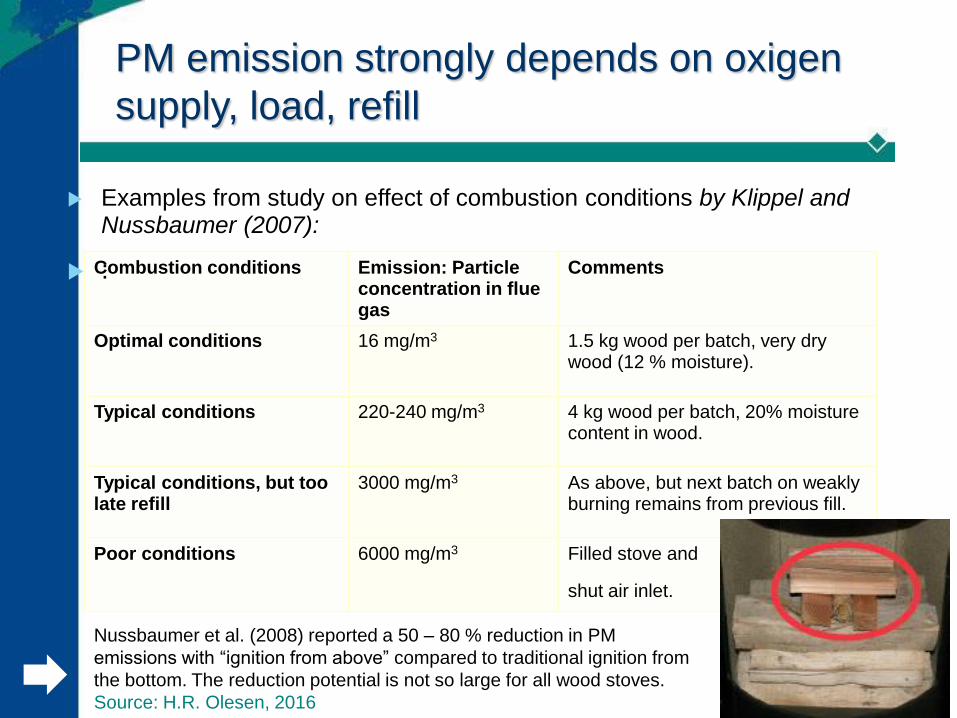
PM emission strongly depends on oxigen
supply, load, refill
16
Combustion conditions Emission: Particle concentration in flue gas
Comments
Optimal conditions 16 mg/m3 1.5 kg wood per batch, very dry wood (12 % moisture).
Typical conditions 220-240 mg/m3 4 kg wood per batch, 20% moisture content in wood.
Typical conditions, but too late refill
3000 mg/m3 As above, but next batch on weakly burning remains from previous fill.
Poor conditions 6000 mg/m3 Filled stove and
shut air inlet.
Examples from study on effect of combustion conditions by Klippel and Nussbaumer (2007):
:
Nussbaumer et al. (2008) reported a 50 – 80 % reduction in PM
emissions with “ignition from above” compared to traditional ignition from
the bottom. The reduction potential is not so large for all wood stoves.
Source: H.R. Olesen, 2016
17
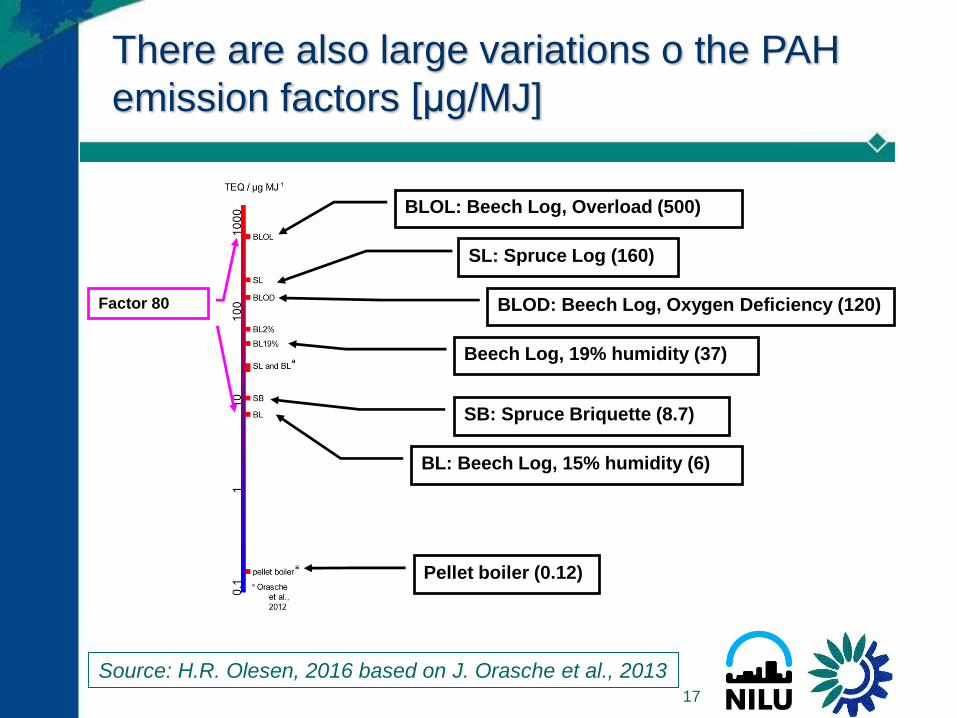
There are also large variations o the PAH
emission factors [μg/MJ]
BL: Beech Log, 15% humidity (6)
BLOL: Beech Log, Overload (500)
SL: Spruce Log (160)
BLOD: Beech Log, Oxygen Deficiency (120)
Beech Log, 19% humidity (37)
SB: Spruce Briquette (8.7)
Pellet boiler (0.12)
Factor 80
Source: H.R. Olesen, 2016 based on J. Orasche et al., 2013
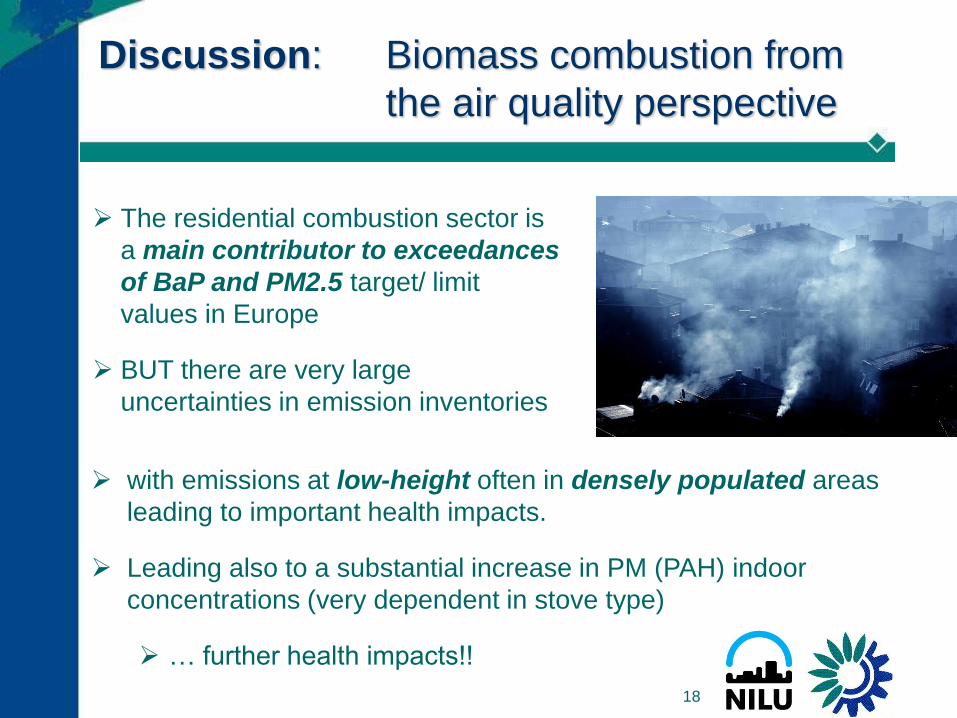
Discussion: Biomass combustion from
the air quality perspective
with emissions at low-height often in densely populated areas
leading to important health impacts.
Leading also to a substantial increase in PM (PAH) indoor
concentrations (very dependent in stove type)
… further health impacts!!
18
The residential combustion sector is
a main contributor to exceedances
of BaP and PM2.5 target/ limit
values in Europe
BUT there are very large
uncertainties in emission inventories
Discussion: Biomass combustion from
the climate perspective
19
Biomass for domestic heating: 43% of RES
in 2012 in the EU28 playing key role in
meeting “20-20-20” targets.
Impacts of biomass combustion on climate:
emissions of CH4 and BC (warming effect)
+ OC / other PM (cooling effect)
= ? net effect ?
LCA by Solli et al. (2009) estimates 30-50%
of CO2 emissions compared to heating with
electricity in Norway (Nordic mix)
Thank you for your attention!
Guerreiro, C., Horálek, J., de Leeuw, F.,
Couvidat, F. (2016) Benzo(a)pyrene in Europe:
Ambient Air Concentrations, Population
Exposure and Health Effects.
J. of Environmental Pollution
DOI: 10.1016/j.envpol.2016.04.081
http://authors.elsevier.com/authorforms/ENPO8670/d9c5760d253207b5e6c976bb2c210863
Top Related