


γλώσσες
Σελίδες
Νομικός

Article
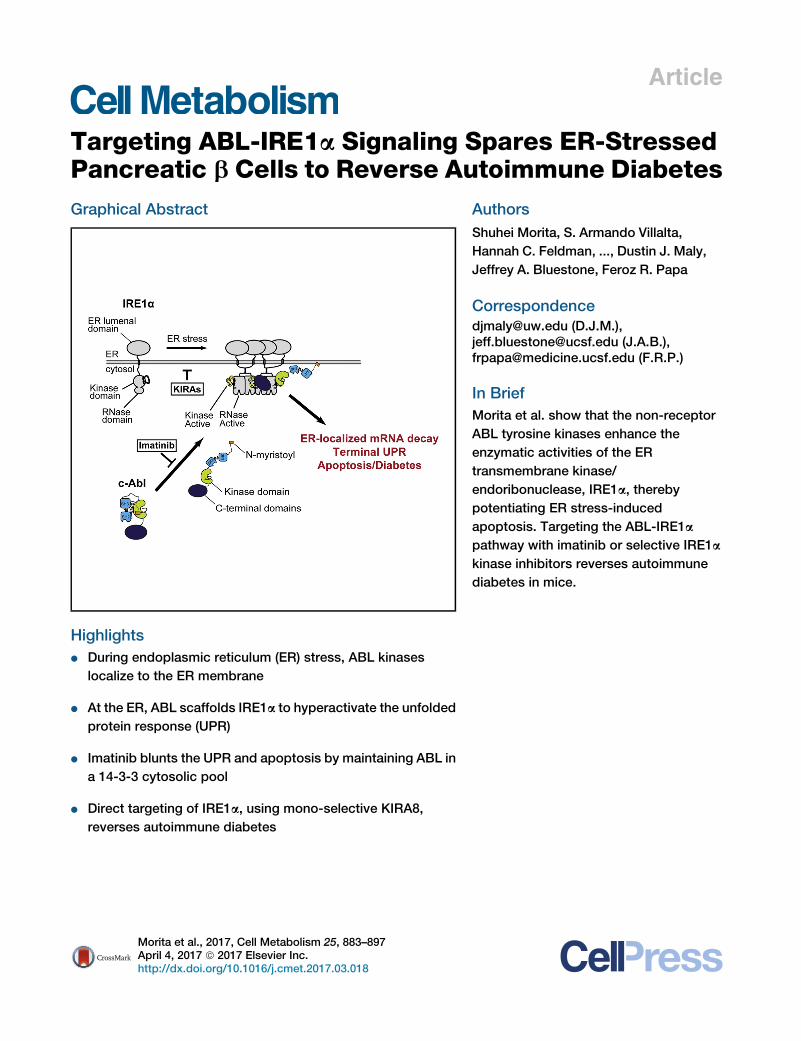
Targeting ABL-IRE1a Signaling Spares ER-StressedPancreatic b Cells to Reverse Autoimmune Diabetes
Graphical Abstract
Highlightsd During endoplasmic reticulum (ER) stress, ABL kinases
localize to the ER membrane
d At the ER, ABL scaffolds IRE1a to hyperactivate the unfolded
protein response (UPR)
d Imatinib blunts the UPR and apoptosis by maintaining ABL in
a 14-3-3 cytosolic pool
d Direct targeting of IRE1a, using mono-selective KIRA8,
reverses autoimmune diabetes
Authors
Shuhei Morita, S. Armando Villalta,
Hannah C. Feldman, ..., Dustin J. Maly,
Jeffrey A. Bluestone, Feroz R. Papa
[email protected] (D.J.M.),[email protected] (J.A.B.),[email protected] (F.R.P.)
In BriefMorita et al. show that the non-receptor
ABL tyrosine kinases enhance the
enzymatic activities of the ER
transmembrane kinase/
endoribonuclease, IRE1a, thereby
potentiating ER stress-induced
apoptosis. Targeting the ABL-IRE1a
pathway with imatinib or selective IRE1a
kinase inhibitors reverses autoimmune
diabetes in mice.
Morita et al., 2017, Cell Metabolism 25, 883–897April 4, 2017 ª 2017 Elsevier Inc.http://dx.doi.org/10.1016/j.cmet.2017.03.018
Cell Metabolism
Article
Targeting ABL-IRE1a SignalingSpares ER-Stressed Pancreatic b Cellsto Reverse Autoimmune DiabetesShuhei Morita,1,3,4,5,10 S. Armando Villalta,3,8,9,10 Hannah C. Feldman,6 Ames C. Register,6 Wendy Rosenthal,3
Ingeborg T. Hoffmann-Petersen,1,3,4,5 Morvarid Mehdizadeh,3 Rajarshi Ghosh,1,3,4,5 Likun Wang,1,3,4,5
Kevin Colon-Negron,1,3,4,5 RosaMeza-Acevedo,1,3,4,5 Bradley J. Backes,1,3,4 Dustin J.Maly,6,7,* Jeffrey A. Bluestone,1,2,3,*and Feroz R. Papa1,2,3,4,5,11,*1Department of Medicine2Department of Pathology3Diabetes Center4Lung Biology Center5California Institute for Quantitative BiosciencesUniversity of California, San Francisco, San Francisco, CA 94143, USA6Department of Chemistry7Department of BiochemistryUniversity of Washington, Seattle, WA 98195, USA8Department of Physiology and Biophysics9Institute for ImmunologyUniversity of California, Irvine, Irvine, CA 92697, USA10These authors contributed equally11Lead Contact*Correspondence: [email protected] (D.J.M.), [email protected] (J.A.B.), [email protected] (F.R.P.)http://dx.doi.org/10.1016/j.cmet.2017.03.018
SUMMARY
In cells experiencing unrelieved endoplasmic reticu-lum (ER) stress, the ER transmembrane kinase/en-doribonuclease (RNase)—IRE1a—endonucleolyti-cally degrades ER-localized mRNAs to promoteapoptosis. Here we find that the ABL family of tyro-sine kinases rheostatically enhances IRE1a’s enzy-matic activities, thereby potentiating ER stress-induced apoptosis. During ER stress, cytosolic ABLkinases localize to the ER membrane, where theybind, scaffold, and hyperactivate IRE1a’s RNase. Im-atinib—an anti-cancer tyrosine kinase inhibitor—an-tagonizes the ABL-IRE1a interaction, blunts IRE1aRNase hyperactivity, reduces pancreatic b cellapoptosis, and reverses type 1 diabetes (T1D) in thenon-obese diabetic (NOD)mousemodel. Amono-se-lective kinase inhibitor that allosterically attenuatesIRE1a’s RNase—KIRA8—also efficaciously reversesestablished diabetes in NOD mice by sparing b cellsand preserving their physiological function. Ourdata support a model wherein ER-stressed b cellscontribute to their own demise during T1D pathogen-esis and implicate the ABL-IRE1a axis as a drugtarget for the treatment of an autoimmune disease.
INTRODUCTION
Diverse perturbations compromise folding and structural matu-ration of secretory proteins in the endoplasmic reticulum (ER).
If uncorrected, such ‘‘ER stress’’ promotes cell degenerationand apoptosis. ER stress activates unfolded protein response(UPR) signaling pathways that determine cell fate. RemediableER stress activates adaptive (‘‘A’’)-UPR outputs that favor cellsurvival. But under irremediably high, chronic ER stress, theseadaptive measures wane, as alternate terminal (‘‘T’’)-UPR out-puts trigger apoptosis.High/chronic ER stress promotes numerous diseases of
premature cell loss (Oakes and Papa, 2015). For example,pancreatic islet b cells, responsible for synthesizing andsecreting sufficient quantities of insulin tomaintain blood glucosehomeostasis, commonly experience high ER stress and secre-tory exhaustion (Scheuner andKaufman, 2008). Peripheral insulinresistance further elevates b cell insulin secretory demand duringdevelopment of type 2 diabetes (T2D) (Back andKaufman, 2012).Insulin gene mutations cause encoded proinsulin to becomestructurally arrested in the b cell ER, and various UPR gene dele-tions debilitate insulin production by b cells. Dysregulated UPRsignaling promotes b cell autonomous apoptosis in these diversediabetic syndromes (Ozcan et al., 2004; Papa, 2012).Type 1 diabetes (T1D) is triggered by immune dysregulation
and autoreactive T cell responses against b cells. However, theautoreactivity does not inevitably result in direct b cell destruc-tion (fratricide), but will also induce b cells to autonomously un-dergo apoptosis (suicide) during disease progression (Atkinsonet al., 2011; Bottazzo, 1986). Both human and mouse studieshave suggested that, at the time of T1D diagnosis, as much as30%–40% of b cells remain and are functionally unresponsivebut can recover following removal of stress, suggesting that awindow of opportunity may exist for therapies that preventfurther b cell deterioration and restore b cell function (Alanentaloet al., 2010; Krogvold et al., 2015).
Cell Metabolism 25, 883–897, April 4, 2017 ª 2017 Elsevier Inc. 883
(legend on next page)
884 Cell Metabolism 25, 883–897, April 4, 2017
The non-obese diabetic ‘‘NOD’’ mouse develops b cell failuresubsequent to innate immune and T cell islet infiltration (as in hu-mans with T1D) (Anderson and Bluestone, 2005). We found thattreating NOD mice with the anti-cancer drug imatinib both pre-vents and reverses diabetes, inducing prolonged remission(Louvet et al., 2008). This remarkable efficacy in the NOD hasprompted a phase II clinical trial to repurpose imatinib for new-onset T1D. However, a full understanding of the underlyingmechanism of imatinib’s efficacy has remained unclear.Enigmatically, imatinib shows minimal effects on T cell effectorfunction and trafficking in the NOD. Insulitis scores, CD4+/CD8+ ratios in spleen and pancreatic lymph nodes, and regu-latory T cell function remained unchanged, supporting the notionthat imatinib’s anti-diabetic effect is not simply due to immunemodulation (Louvet et al., 2008). Recently, investigators reportedhigh ER stress signaling in autoimmune-targeted b cells of theNOD (Engin et al., 2013; Tersey et al., 2012), which promptedus to inquire whether imatinib may instead protect b cells inthe NOD by modulating the UPR.The ER transmembrane kinase/endoribonuclease (RNase),
IRE1a, determines cell fate based on ER stress severity. UnderER stress, IRE1a monomers in the ER membrane undergotrans-autophosphorylation and RNase activation, thereby initi-ating frameshift splicing of the mRNA encoding XBP1 transcrip-tion factor to trigger adaptive UPR transcriptional programs(Yoshida et al., 2001). If ER stress remains unrelieved, IRE1aorganizes into high-order, oligomeric complexes as its auto-phosphorylation and RNase activation state rise further, therebycausing endonucleolytic degradation of many ER-localizedmRNAs and apoptosis (Han et al., 2009a). Despite this mecha-nistic understanding, the exact components of the IRE1a com-plex remain largely unresolved.Here we find that imatinib’s anti-diabetogenic effects in the
NOD derive from ameliorating pro-apoptotic terminal UPRsignaling in b cells through an unexpected link between IRE1aand the non-receptor ABL tyrosine kinases, which play diverse,intracellular signaling functions but have not previously beencharacterized as UPR components. We find that this ABL-IRE1a axis functions upstream in the UPR to potentiateapoptosis during ER stress, and that imatinib reduces apoptosisby attenuating a stimulatory interaction of ABLwith IRE1a. Thesefindings predicted that direct inhibition of IRE1a should prove
anti-diabetogenic in the NOD. Enabled with newly optimizedcompounds called ‘‘KIRA’’s (kinase-inhibitory RNase attenua-tors) that inhibit IRE1a kinase/RNase activity, we found that amono-selective KIRA induces near-complete reversal of estab-lished diabetes in the NOD model.
RESULTS
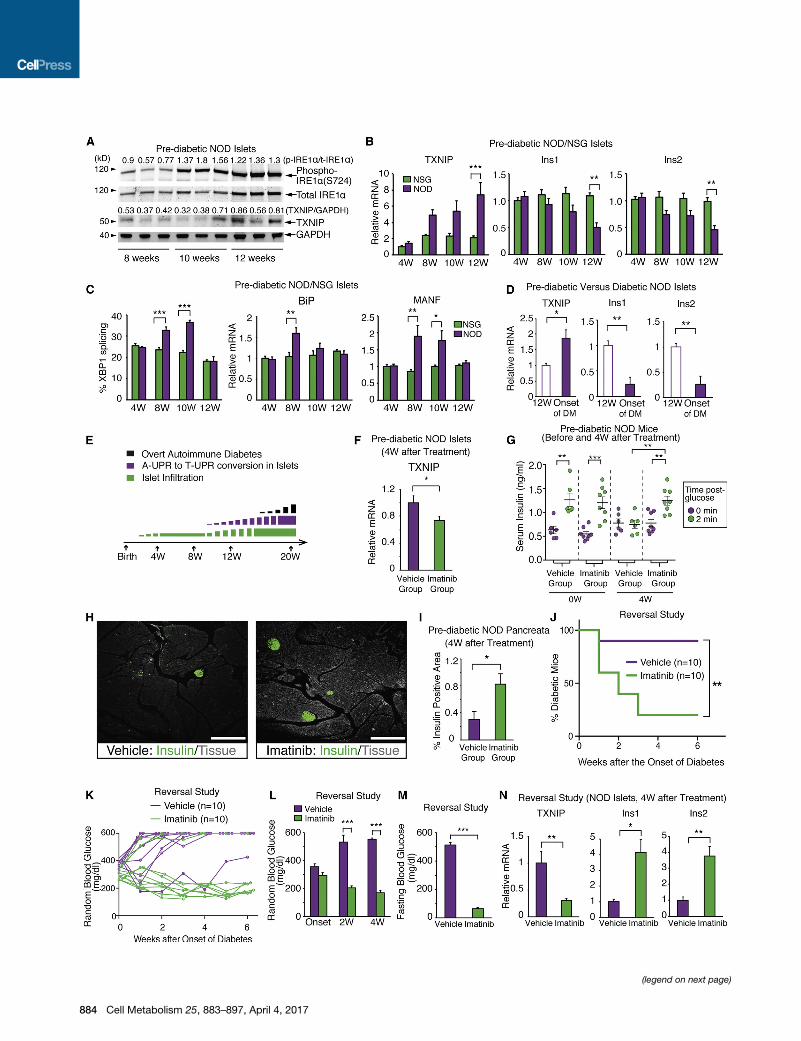
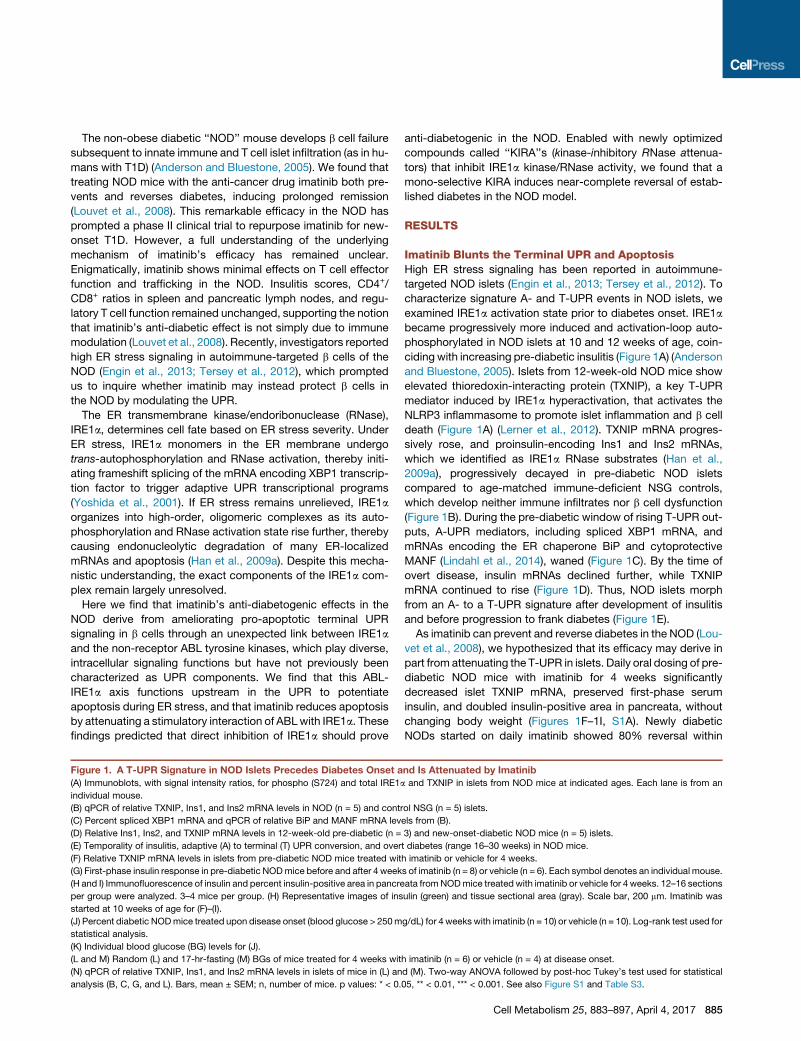
Imatinib Blunts the Terminal UPR and ApoptosisHigh ER stress signaling has been reported in autoimmune-targeted NOD islets (Engin et al., 2013; Tersey et al., 2012). Tocharacterize signature A- and T-UPR events in NOD islets, weexamined IRE1a activation state prior to diabetes onset. IRE1abecame progressively more induced and activation-loop auto-phosphorylated in NOD islets at 10 and 12 weeks of age, coin-ciding with increasing pre-diabetic insulitis (Figure 1A) (Andersonand Bluestone, 2005). Islets from 12-week-old NOD mice showelevated thioredoxin-interacting protein (TXNIP), a key T-UPRmediator induced by IRE1a hyperactivation, that activates theNLRP3 inflammasome to promote islet inflammation and b celldeath (Figure 1A) (Lerner et al., 2012). TXNIP mRNA progres-sively rose, and proinsulin-encoding Ins1 and Ins2 mRNAs,which we identified as IRE1a RNase substrates (Han et al.,2009a), progressively decayed in pre-diabetic NOD isletscompared to age-matched immune-deficient NSG controls,which develop neither immune infiltrates nor b cell dysfunction(Figure 1B). During the pre-diabetic window of rising T-UPR out-puts, A-UPR mediators, including spliced XBP1 mRNA, andmRNAs encoding the ER chaperone BiP and cytoprotectiveMANF (Lindahl et al., 2014), waned (Figure 1C). By the time ofovert disease, insulin mRNAs declined further, while TXNIPmRNA continued to rise (Figure 1D). Thus, NOD islets morphfrom an A- to a T-UPR signature after development of insulitisand before progression to frank diabetes (Figure 1E).As imatinib can prevent and reverse diabetes in the NOD (Lou-
vet et al., 2008), we hypothesized that its efficacy may derive inpart from attenuating the T-UPR in islets. Daily oral dosing of pre-diabetic NOD mice with imatinib for 4 weeks significantlydecreased islet TXNIP mRNA, preserved first-phase seruminsulin, and doubled insulin-positive area in pancreata, withoutchanging body weight (Figures 1F–1I, S1A). Newly diabeticNODs started on daily imatinib showed 80% reversal within
Figure 1. A T-UPR Signature in NOD Islets Precedes Diabetes Onset and Is Attenuated by Imatinib(A) Immunoblots, with signal intensity ratios, for phospho (S724) and total IRE1a and TXNIP in islets from NOD mice at indicated ages. Each lane is from an
individual mouse.
(B) qPCR of relative TXNIP, Ins1, and Ins2 mRNA levels in NOD (n = 5) and control NSG (n = 5) islets.
(C) Percent spliced XBP1 mRNA and qPCR of relative BiP and MANF mRNA levels from (B).
(D) Relative Ins1, Ins2, and TXNIP mRNA levels in 12-week-old pre-diabetic (n = 3) and new-onset-diabetic NOD mice (n = 5) islets.
(E) Temporality of insulitis, adaptive (A) to terminal (T) UPR conversion, and overt diabetes (range 16–30 weeks) in NOD mice.
(F) Relative TXNIP mRNA levels in islets from pre-diabetic NOD mice treated with imatinib or vehicle for 4 weeks.
(G) First-phase insulin response in pre-diabetic NODmice before and after 4 weeks of imatinib (n = 8) or vehicle (n = 6). Each symbol denotes an individual mouse.
(H and I) Immunofluorescence of insulin and percent insulin-positive area in pancreata fromNODmice treated with imatinib or vehicle for 4 weeks. 12–16 sections
per group were analyzed. 3–4 mice per group. (H) Representative images of insulin (green) and tissue sectional area (gray). Scale bar, 200 mm. Imatinib was
started at 10 weeks of age for (F)–(I).
(J) Percent diabetic NODmice treated upon disease onset (blood glucose > 250mg/dL) for 4 weeks with imatinib (n = 10) or vehicle (n = 10). Log-rank test used for
statistical analysis.
(K) Individual blood glucose (BG) levels for (J).
(L and M) Random (L) and 17-hr-fasting (M) BGs of mice treated for 4 weeks with imatinib (n = 6) or vehicle (n = 4) at disease onset.
(N) qPCR of relative TXNIP, Ins1, and Ins2 mRNA levels in islets of mice in (L) and (M). Two-way ANOVA followed by post-hoc Tukey’s test used for statistical
analysis (B, C, G, and L). Bars, mean ± SEM; n, number of mice. p values: * < 0.05, ** < 0.01, *** < 0.001. See also Figure S1 and Table S3.
Cell Metabolism 25, 883–897, April 4, 2017 885
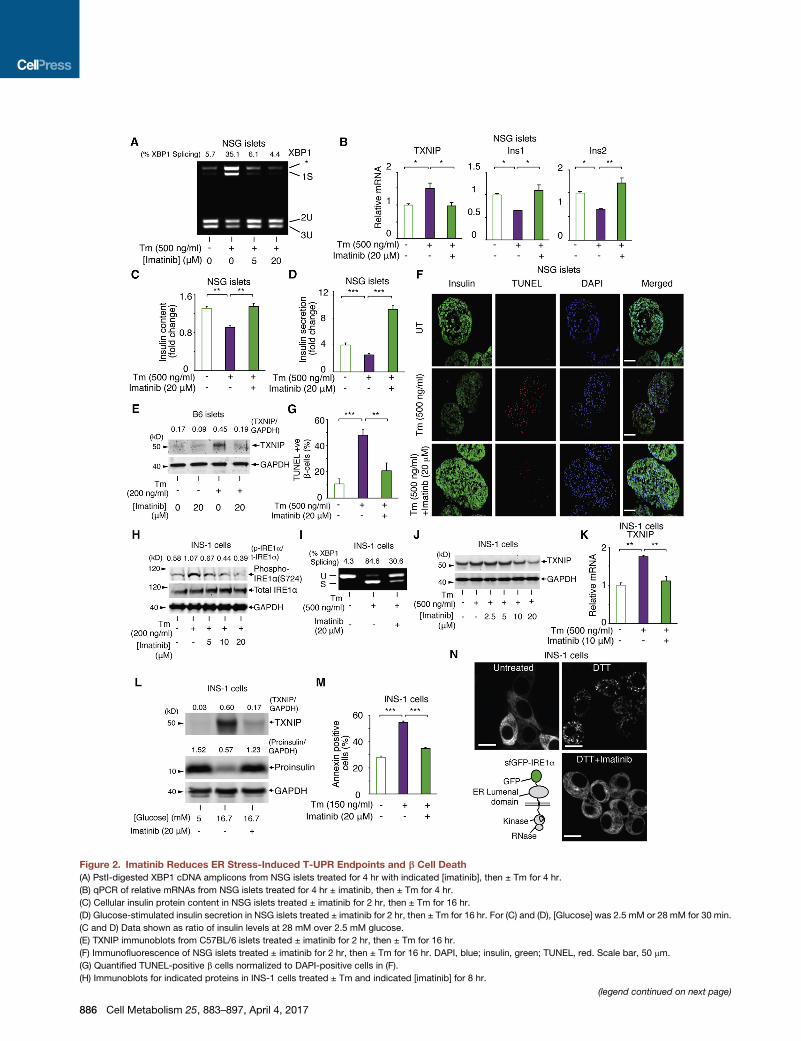
Figure 2. Imatinib Reduces ER Stress-Induced T-UPR Endpoints and b Cell Death(A) PstI-digested XBP1 cDNA amplicons from NSG islets treated for 4 hr with indicated [imatinib], then ± Tm for 4 hr.
(B) qPCR of relative mRNAs from NSG islets treated for 4 hr ± imatinib, then ± Tm for 4 hr.
(C) Cellular insulin protein content in NSG islets treated ± imatinib for 2 hr, then ± Tm for 16 hr.
(D) Glucose-stimulated insulin secretion in NSG islets treated ± imatinib for 2 hr, then ± Tm for 16 hr. For (C) and (D), [Glucose] was 2.5 mM or 28 mM for 30 min.
(C and D) Data shown as ratio of insulin levels at 28 mM over 2.5 mM glucose.
(E) TXNIP immunoblots from C57BL/6 islets treated ± imatinib for 2 hr, then ± Tm for 16 hr.
(F) Immunofluorescence of NSG islets treated ± imatinib for 2 hr, then ± Tm for 16 hr. DAPI, blue; insulin, green; TUNEL, red. Scale bar, 50 mm.
(G) Quantified TUNEL-positive b cells normalized to DAPI-positive cells in (F).
(H) Immunoblots for indicated proteins in INS-1 cells treated ± Tm and indicated [imatinib] for 8 hr.
(legend continued on next page)
886 Cell Metabolism 25, 883–897, April 4, 2017
3 weeks (Figure 1J). Random and fasting blood glucose levelswere significantly lower in the imatinib group within 2 and4 weeks, respectively, while their islets showed attenuatedTXNIP and preserved insulin mRNAs (Figures 1K–1N).While imatinib blunts the T-UPR in NOD islets, whether it
confers a direct, immune-independent, cytoprotective effecton b cells was unclear. To address this, we asked whether im-mune-deficient NSG mice islets are protected by imatinib fromtoxic doses of tunicamycin (Tm), a protein glycosylation inhibitorthat causes apoptosis (Ghosh et al., 2014). In Tm-exposed NSGislets, imatinib blocks elevations in spliced XBP1 and TXNIPmRNAs and declines in insulin mRNAs, with similar results inhuman islets (Figures 2A, 2B, and S1B). In NSG islets, Tm-pro-moted decreases in insulin content and glucose-stimulatedinsulin secretion (GSIS) are prevented by imatinib (Figures 2Cand 2D). In the absence of ER stress agents, imatinib did notchange TXNIP and Ins1/2 mRNA and insulin secretion (FiguresS1C–S1E). Also, imatinib reduces Tm-promoted TXNIP induc-tion in C57BL/6 islets (Figure 2E), showing that its effects arenot strain specific. Finally, imatinib decreases Tm-promotedapoptosis in NSG islets (Figures 2F and 2G).We next used a b cell-derived insulinoma line, INS-1, which
can be genetically manipulated, to study imatinib’s mechanisticeffects. In INS-1 cells, Tm-promoted IRE1a autophosphoryla-tion, XBP1 mRNA splicing, and TXNIP mRNA/protein inductionare all inhibited by imatinib (Figures 2H–2K). Nilotinib, an equallyselective but more potent inhibitor than imatinib, reducedTm-promoted XBP1 splicing (Figures S1F and S1G), TXNIPmRNA induction (Figure S1H), and apoptosis at lower concentra-tions than imatinib (Figures 2M and S1I). Imatinib’s salutaryeffects extend broadly to other ER stress regimes, includingSERCA pump inhibition by thapsigargin (Tg) and anterogradetrafficking blockage by brefeldin A (Figures S1J and S1K). Gluco-toxicity-promoted insulin mRNA decay (Lipson et al., 2006),TXNIP induction, and proinsulin depletion are all also preventedby imatinib (Figures 2L andS1L). As in islets, imatinib significantlyreduces ER stress-induced INS-1 cell apoptosis (Figure 2M).Suggesting that it inhibits the upstream-most UPR signaling
step of IRE1a oligomerization, imatinib blocks ER membranefocal aggregation of a superfolder (sf) GFP-IRE1a reporter duringDTT-induced ER stress (Figure 2N) (Ghosh et al., 2014). But whileimatinib inhibits IRE1a in cells, it does not directly inhibit eitherthe kinase or RNase activities of a recombinant IRE1a* mini-pro-tein (Figures S1M–S1P). Therefore, imatinib’s inhibitory effects incells appear to occur through a different target than IRE1a.
c-Abl Drives the T-UPR through IRE1aAs imatinib was optimized for BCR-Abl (Capdeville et al., 2002),we next monitored the activation state of its non-oncogeniccounterpart, c-Abl, in NOD islets. Like IRE1a, c-Abl becomesprogressively more induced and activation-loop phosphorylated
in pre-diabetic NOD islets (Figures 1A and 3A). Also, in INS-1cells, high glucose triggered acute c-Abl mRNA induction andc-Abl activation, which was abrogated by imatinib (Figures 3B,3C, S2A, and S2B). c-Abl staining was evident in b cells, butnot in infiltrating immune cells based on lack of co-localizationwith CD45 and DAPI (Figures S2C–S2T), with higher proteinand mRNA levels in NOD compared to NSG islets (Figures S3Aand S3B). Other imatinib targets, PDGFRa, PDGFRb, andc-KIT, were not detectable in b cells (Figure S3C). In islets,c-Abl co-localizes with synaptophysin in neuroendocrine cellsand with glucagon in a cells, but is undetectable in cells express-ing pancreatic polypeptide or somatostatin (Figures S2C–S2T).Together, these data suggested that imatinib’s efficacy in theNOD may derive through targeting b cell-expressed c-Abl.The ABL tyrosine kinase family comprises c-Abl (ABL1) and
Arg (ABL2), which display redundant and unique functions(Wang, 2014). To study the UPR roles of c-Abl and Arg, we sub-jected Abl/Arg (!/!) double-knockout (DKO) mouse embryonicfibroblasts (MEFs) to ER stress. XBP1 mRNA splicing, dose-dependently induced by Tm, is significantly blunted in Abl/ArgDKO MEFs (Figures 3D and S4A); c-Abl and Arg appear to playredundant roles because c-Abl (!/!) single-knockout MEFsshow no XBP1 splicing defect (Figure S4B). Under ER stress,Abl/Arg DKO MEFs show crippled TXNIP mRNA induction andapoptosis (Figures 3E, 3F, and S4C).Given the necessity of c-Abl/Arg in promoting the T-UPR, we
next tested their sufficiency in isogenic INS-1 and T-REx293lines that stably overexpress c-Abl or Arg under doxycycline(Dox). In T-REx293 cells, induction of c-Abl, capable of phos-phorylation of endogenous Crkl, causes spontaneous autophos-phorylation of endogenous IRE1a—without ER stress—andrapidly triggers XBP1 mRNA splicing and nuclear accumulationof XBP1 transcription factor (Figures S4D–S4H). Similarly,c-Abl induction in INS-1 cells leads to nuclear XBP1 enrichmentand TXNIP induction, while imatinib inhibits IRE1a autophos-phorylation, TXNIP elevation, and apoptosis (Figures 3G–3L).Overexpression of Arg is also sufficient to induce TXNIP (Fig-
ure S4I). In contrast, overexpression of other imatinib targets,PDGFRa and c-kit, did not induce T-UPR events (Figures S4Jand S4K). c-Abl and Arg did not affect PERK, another UPRsensor kinase, based on unchanged phosphorylation of its sub-strate eiF2a in Abl/Arg DKO MEFs under ER stress, or in INS-1cells overexpressing c-Abl (Figures S4L and S4M). The IRE1aRNase inhibitor, STF-083010 (Papandreou et al., 2011), blocksc-Abl-induced TXNIP mRNA and protein elevation (Figures 3Mand 3N), further supporting that c-Abl-driven T-UPR signalingproceeds through IRE1a RNase activation.
c-Abl Binds and Activates IRE1aTyrosine phosphorylation has not previously been reported toplay a role in the UPR, despite the necessity and sufficiency of
(I) XBP1 cDNA amplicons from INS-1 cells pretreated for 4 hr ± imatinib, then ± Tm for 4 hr.
(J) TXNIP immunoblots from INS-1 cells co-treated with ± Tm and indicated [imatinib] for 24 hr.
(K) qPCR for TXNIP mRNA in INS-1 cells treated for 2 hr with imatinib, then Tm for 4 hr.
(L) TXNIP and proinsulin immunoblots from INS-1 cells treated with indicated [glucose] ± imatinib for 72 hr.
(M) Annexin V staining of INS-1 cells co-treated with Tm and ± imatinib for 72 hr.
(N) sfGFP-IRE1a reporter (left bottom). Images of INS-1 expressed sfGFP-IRE1a treated ± imatinib for 1 hr, then ± 10 mM DTT for 1 hr. Scale bar, 10 mm. Bars,
mean ± SEM. Three independent biological samples were used for qPCR, insulin content, insulin secretion, immunofluorescence experiments, and Annexin
V staining. p values: * < 0.05, ** < 0.01, *** < 0.001. See also Figure S1.
Cell Metabolism 25, 883–897, April 4, 2017 887
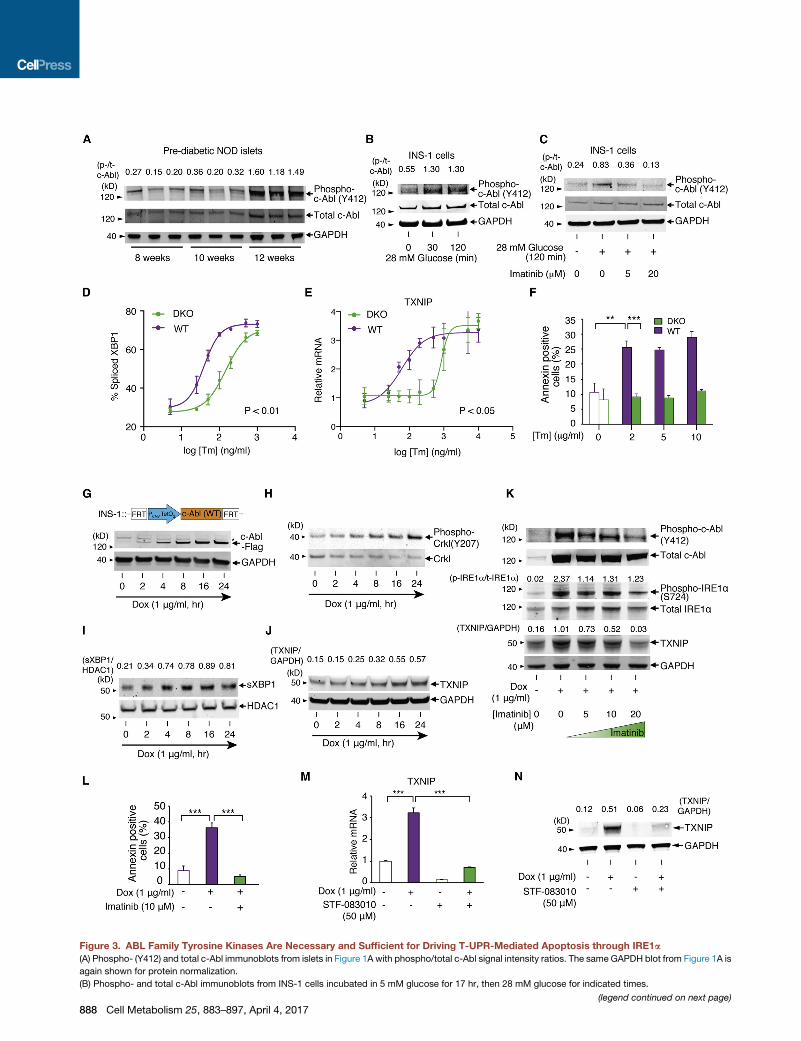
Figure 3. ABL Family Tyrosine Kinases Are Necessary and Sufficient for Driving T-UPR-Mediated Apoptosis through IRE1a(A) Phospho- (Y412) and total c-Abl immunoblots from islets in Figure 1A with phospho/total c-Abl signal intensity ratios. The same GAPDH blot from Figure 1A is
again shown for protein normalization.
(B) Phospho- and total c-Abl immunoblots from INS-1 cells incubated in 5 mM glucose for 17 hr, then 28 mM glucose for indicated times.
(legend continued on next page)
888 Cell Metabolism 25, 883–897, April 4, 2017
ABL kinases for stimulating IRE1a. Therefore, the necessity ofc-Abl’s tyrosine kinase activity was tested in an INS-1 line condi-tionally expressing a kinase-dead mutant, K290R. Surprisingly,K290R c-Abl triggers nuclear accumulation of XBP1s and TXNIPinduction to similar levels as WT c-Abl (Figures 4A–4D). Remark-ably, imatinib reduces K290R c-Abl-induced TXNIP proteinelevation (Figure 4E), like WT c-Abl (Figure 3K).These results suggest that c-Abl phosphotransfer-indepen-
dently stimulates IRE1a and that imatinib counters this effectapart from kinase catalytic inhibition. We therefore reasonedthat under ER stress c-Abl may co-localize with IRE1a to scaffoldand stimulate IRE1a’s activity, with imatinib countering this inter-action. To test this, we performed live-cell imaging with sfGFP-IRE1a and a c-Abl-mCherry fusion. In INS-1 cells, c-Abl-mCherryis diffusely localized, but with significant ER enrichment, consis-tent with previous reports (Figures 4F and 4G) (Qi and Mochly-Rosen, 2008). Under ER stress, c-Abl-mCherry co-localizeswith sfGFP-IRE1a in ER punctate foci, while imatinib co-treat-ment prevents c-Abl-mCherry focal re-localization, as withsfGFP-IRE1a (Figures 2N and 4G).We next tested whether c-Abl’s association with cytosolic
14-3-3 proteins that modulate localization of c-Abl and other ki-nases is disrupted under ER stress, as during oxidative stress(Nihira et al., 2008; Yoshida et al., 2005). Indeed, ER stresscauses rapid dissociation of the c-Abl/14-3-3 complex, whichimatinib prevents (Figures 4H, 4I, and S5A). These data furthersupport a model of c-Abl re-localizing from the cytosol to anIRE1a complex at the ER membrane under stress. Also, c-Ablco-immunoprecipitates (coIPs) either endogenous or transgenicIRE1a, which imatinib abrogates (Figures 4J, S5B, and S5C).The N-terminal myristoyl group of c-Abl is necessary for di-
recting c-Abl to IRE1a because a non-myristoylated splicevariant—Abl1a—cannot rescue XBP1 splicing or TXNIP mRNAelevation when reconstituted in Abl/Arg DKO MEFs, unlikeN-terminally myristoylated Abl1b (Figures S5D–S5G). We thenasked if the N-terminal SH2, SH3, and kinase domains of c-Ablare sufficient for IRE1a stimulation by testing an N-terminal trun-cation, c-Abl(3D). XBP1 splicing is abrogated in cells expressingc-Abl(3D) (Figures 4K–4N, S5F, and S5H), showing that c-Abl’sC-terminal domains are also required for IRE1a activation.Also, unlike full-length c-Abl, c-Abl(3D) cannot coIP recombinantIRE1a* (Figures 4O–4Q). Finally, to determine if c-Abl and IRE1adirectly interact, we conducted biochemical experiments usingrecombinant c-Abl (Figure S5I) and IRE1a*. Purified, full-lengthc-Abl, immobilized on beads with an ATP-competitive inhibitor,coIPs IRE1a* (Figure S5J). Finally, purified c-Abl or c-AblK290R can—with equal potency—directly stimulate IRE1a*’sRNase catalytic activity in vitro, whereas c-Abl(3D) cannot (Fig-ures 4R–4T and S5K–S5M).
Thus, under ER stress, c-Abl scaffolds and stimulates IRE1a atthe ER membrane independent of its phosphotransfer activity,but requires both its N-myristoyl group and domains C-terminalto its kinase. Thus, we predicted that forcibly directing c-Abl intoIRE1a foci should hyperactivate IRE1awithout ER stress. To testthis, we used GNF-2 (Figure 5A), an inhibitor that interacts withthemyristate-binding pocket in c-Abl’s catalytic domain, therebydisplacing c-Abl’s N-terminal myristoyl group and enhancing ERlocalization (Choi et al., 2009). Consistent with previous studies,we further find that GNF-2 promotes spontaneous formation ofER foci containing both c-Abl-mCherry and sfGFP-IRE1a, corre-lating with diminished c-Abl/14-3-3 interaction, without ERstress (Figures 5B and 5C). In INS-1 cells, GNF-2 reduces Crklphosphorylation while increasing IRE1a autophosphorylation,XBP1 splicing, TXNIP mRNA/protein induction, Ins1 mRNAdecay, and apoptosis (Figures 5D–5K); GNF-2 does not increaseXBP1 splicing in Abl/Arg DKO MEFs or PERK-mediated eiF2aphosphorylation (Figures S6A and S6B). In summary, althoughGNF-2 allosterically inhibits c-Abl’s phosphotransfer activity,its ability to promote c-Abl co-localization with IRE1a sufficesto hyperactivate IRE1a’s RNase, which can be inhibited withSTF-083010 (Figure S6C).
IRE1a Inhibition Spares b Cells to Reverse Diabetes inthe NOD MouseBy investigating themechanismof imatinib’s efficacy in theNOD,we identified an ABL-IRE1a signaling axis, leading to a final pre-diction: if IRE1a hyperactivity promotes b cell death in the NOD,then direct IRE1a inhibition should be anti-diabetogenic. To testthis, we treated pre-diabetic NOD females with KIRA6, an ATP-competitive ligand that allosterically inhibits IRE1a’s RNase bybreaking oligomers. Using an intraperitoneal (i.p.) dosing regimethat reduces diabetes in the Akita mouse—which expresses anoxidative-folding defective proinsulin mutant, Ins2(C96Y), thattriggers autonomous b cell apoptosis (Ghosh et al., 2014; Lerneret al., 2012)—we noted significant reduction of TXNIP and recov-ery of Ins1/Ins2, BiP, and MANF mRNAs within 1 week of treat-ment in 10-week-old NODs (Figures S6D–S6H). After a 6-weekKIRA6 treatment of 8-week-old pre-diabetic NODs, preservedfirst-phase insulin response—and significantly greater pancre-atic insulin protein staining—was evident in the KIRA6 groupcompared to vehicles (Figures S6I–S6K). Diabetes reversal wasattempted by dosing KIRA6 upon disease onset. Random bloodglucoses stabilized in the KIRA6 cohort, whereas hyperglycemiacontinued to rise in controls, without significant weight differ-ences between groups (Figures S6L and S6M). By 4 weeks, sig-nificant differences in the percentage of diabetic mice in the twocohorts became apparent, and KIRA6-treatedmice showed pre-served fasting insulin (Figures S6N and S6O).
(C) Phospho- and total c-Abl immunoblots for INS-1 cells incubated in 5 mM glucose for 17 hr, then indicated [imatinib] for 2 hr, then ± 28 mM glucose for 2 hr.
(D and E) Percent spliced XBP1 (quantified from PstI-digested XBP1 cDNA amplicons) (D) and qPCR of relative TXNIP mRNAs normalized to no Tm (E) from
c-Abl/Arg DKO or WT MEFs treated with indicated [Tm] for 3 hr. Statistical analysis, two-way ANOVA (D and E).
(F) Annexin V staining of c-Abl/Arg DKO orWTMEFs treated with indicated [Tm] for 24 hr. Statistical analysis, two-way ANOVA followed by post-hoc Tukey’s test.
(G–J) Immunoblots for indicated proteins in INS-1 cells stably expressing WT c-Abl under Dox for indicated times. Nuclear protein extract used for (I).
(K) Immunoblots for indicated proteins in INS-1 cells expressing WT c-Abl ± Dox, co-treated with indicated [imatinb] for 72 hr.
(L) Annexin V staining of INS-1 cells expressing WT c-Abl ± Dox, co-treated with ± imatinib for 96 hr.
(M) qPCR of relative TXNIP mRNA in INS-1 cells expressing WT c-Abl under Dox, co-treated ± STF-083010 for 48 hr.
(N) Immunoblots for TXNIP in INS-1 cells expressing WT c-Abl under Dox, co-treated ± STF-083010 for 48 hr. Bars, mean ± SEM. Three independent biological
samples were used for XBP1 splicing, qPCR, and Annexin V staining. p values: ** < 0.01, *** < 0.001. See also Figures S2, S3, and S4.
Cell Metabolism 25, 883–897, April 4, 2017 889

(legend on next page)
890 Cell Metabolism 25, 883–897, April 4, 2017
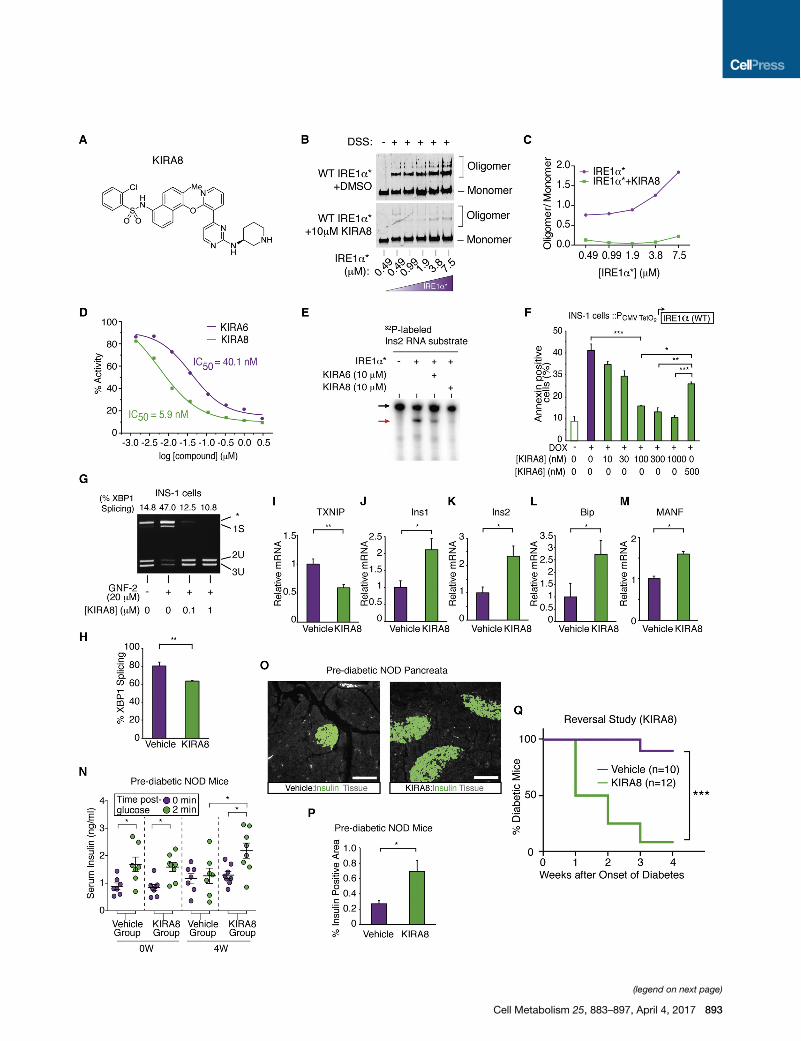
Despite these encouraging results, KIRA6 inhibits c-Abl atmicromolar concentrations (Figure S7A), raising the possibilitythat KIRA6’s anti-diabetogenic effects proceed partially throughABL inhibition. But recently a mono-selective IRE1a inhibitor—compound 18 (Figure 6A) —that possesses all the properties ofa KIRA and will be referred to as KIRA8 henceforth, wasdescribed (Harrington et al., 2014). Specifically, KIRA8 blocksIRE1a* oligomerization, and potently inhibits IRE1a* RNase ac-tivity against XBP1 and Ins2 RNAs (Figures 6B–6E). KIRA8more potently reduces IRE1a-driven apoptosis in INS-1 cellsthan KIRA6 (Figure 6F) and also reverses XBP1 splicing pro-moted by GNF-2 (Figure 6G). We confirmed KIRA8’s mono-selectivity for IRE1a in vitro, noting that it even has minimal inhi-bition on IRE1a’s closely related paralog, IRE1b (Wang et al.,1998) (Figure S7B and Table S1); other kinases operating in theUPR, including PERK, c-Abl, and Arg, are not inhibited by KIRA8.KIRA8 was first tested in vivo in 3-week-old male pre-diabetic
Akitamice by i.p. daily dosing of 50mg/kg (Table S2), whereuponsignificant reduction of hyperglycemia became apparent overseveral weeks (Figure S7C). This encouraging anti-diabetogenicefficacy of KIRA8 in the focal Akitamodelmotivated us to test it inthe complex NOD. Showing target engagement, 1-week treat-ment of pre-diabetic NODs with KIRA8 led to significant reduc-tions in islet XBP1 splicing and TXNIP mRNAs and preservedIns1/Ins2, BiP, and MANF mRNAs (Figures 6H–6M); no signifi-cant effects were apparent in T-UPR endpoints in B6 micetreated similarly with KIRA8 (Figures S7D–S7F). Upon longertreatment durations in 10-week-old prediabetic NODs, KIRA8preserved first-phase insulin responses by 4 weeks, and by6 weeks significantly increased—by 3-fold—the levels ofpancreatic insulin-positive area (Figures 6N–6P). Although atrend toward an increased proportion of islets without insulitiswas noted in KIRA8-treated mice, overall insulitis severity wasnot significantly reduced relative to vehicle (Figure S7G).Finally, we conducted an NOD diabetes reversal study, start-
ing KIRA8 daily upon disease onset. Random blood glucoserapidly decreased in the KIRA8 cohort relative to controls, withno weight differences seen (Figures S7H–S7J). By 4 weeks, sta-tistically significant differences in the percentages of diabeticmice became apparent, with a remarkable > 90% diabetesreversal rate in the KIRA8 cohort (Figure 6Q).
DISCUSSION
Role of the ABL-IRE1a Axis in Amplifying the UPRThe UPR is canonically viewed as a network of signaling cas-cades emanating from three ER transmembrane sensors—IRE1a, PERK, and ATF6—activated by unfolded proteins in theER. However, it is becoming apparent that many cytosolic pro-teins characterized as components of other signaling pathwaysinteract with UPR sensors to regulate their outputs, constitutinga complex and dynamically regulated ‘‘UPRosome’’ (Hetz andGlimcher, 2009). For example, protein-tyrosine phosphatase1B, BAX inhibitor-1, ASK1, RACK1, and nonmuscle myosin IIBtune IRE1a outputs to affect cell fate (Gu et al., 2004; He et al.,2012; Lisbona et al., 2009; Nishitoh et al., 2002; Qiu et al.,2010). Here we found that ABL kinases are also integral UPRcomponents that rheostatically regulate IRE1a.Under high/chronic ER stress, a scaffolding interaction be-
tween ABL and IRE1a at the ER membrane increases IRE1a’senzymatic activities to critical levels, potentiating the T-UPR(Figure 7). This ABL-IRE1a link was found by delineating themechanism of how the anti-cancer drug—Gleevec (imatinib)—prevents and reverses diabetes in the NOD mouse, thenconfirmed and validated inmultiple, reductionist, cell-based sys-tems. Based on these studies, c-Abl and Arg play necessary,overlapping roles in amplifying IRE1a’s response to ER stress.Furthermore, forced activation of either ABL kinase is sufficientto drive IRE1a autophosphorylation, XBP1 mRNA splicing,ER-localized mRNA decay, induction of TXNIP, and apoptosis.All these outputs are curtailed by imatinib.While c-Abl is best understood as the kinase component of the
oncoprotein, BCR-Abl, WT ABL kinases play both pro-survivaland pro-death roles (Wang, 2000, 2014). For example, c-Abl isa major driver of apoptosis during oxidative stress and DNAdamage (Yoshida et al., 2005). Multi-domain ABL kinasesinteract with diverse proteins and shuttle between various organ-elles, playing numerous biological roles (Wang, 2014). DuringUV-induced DNA damage, c-Abl rapidly mobilizes to the nu-cleus, interacting with DNA through its C-terminal DNA-bindingdomain. Under oxidative stress, c-Abl promotes apoptosis bylocalizing to mitochondria and the nucleus (Nihira et al., 2008).Thus, c-Abl’s ability to co-localize with IRE1a at the ER
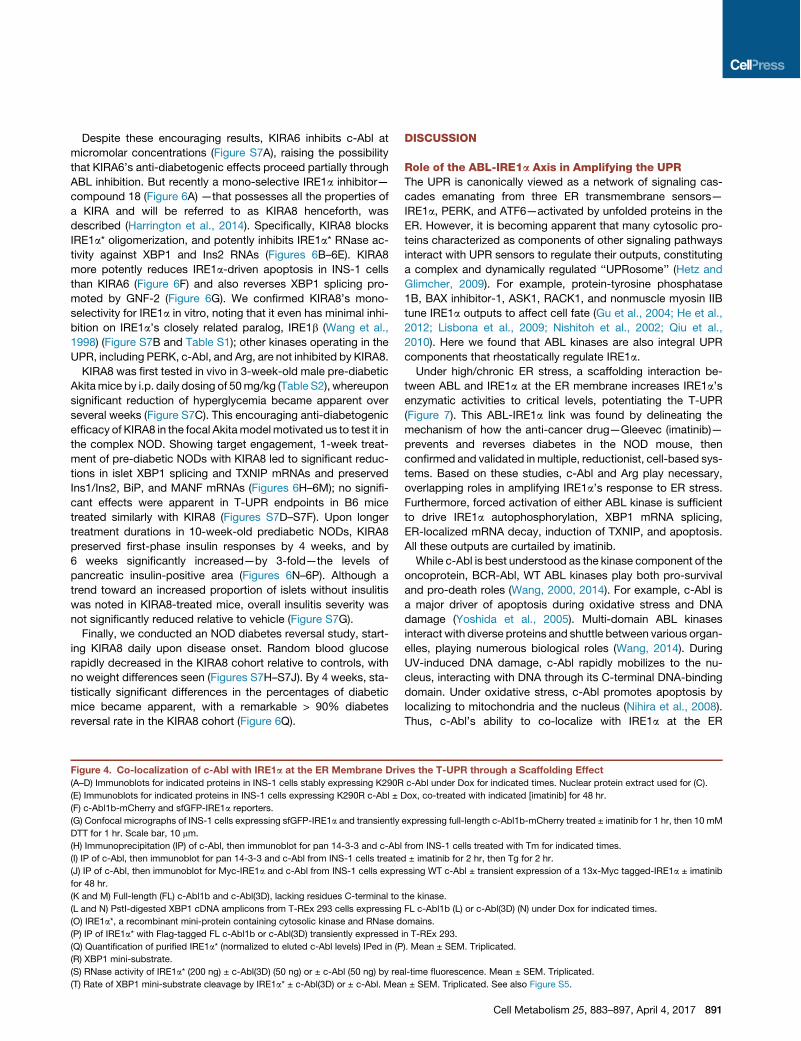
Figure 4. Co-localization of c-Abl with IRE1a at the ER Membrane Drives the T-UPR through a Scaffolding Effect(A–D) Immunoblots for indicated proteins in INS-1 cells stably expressing K290R c-Abl under Dox for indicated times. Nuclear protein extract used for (C).
(E) Immunoblots for indicated proteins in INS-1 cells expressing K290R c-Abl ± Dox, co-treated with indicated [imatinib] for 48 hr.
(F) c-Abl1b-mCherry and sfGFP-IRE1a reporters.
(G) Confocal micrographs of INS-1 cells expressing sfGFP-IRE1a and transiently expressing full-length c-Abl1b-mCherry treated ± imatinib for 1 hr, then 10 mM
DTT for 1 hr. Scale bar, 10 mm.
(H) Immunoprecipitation (IP) of c-Abl, then immunoblot for pan 14-3-3 and c-Abl from INS-1 cells treated with Tm for indicated times.
(I) IP of c-Abl, then immunoblot for pan 14-3-3 and c-Abl from INS-1 cells treated ± imatinib for 2 hr, then Tg for 2 hr.
(J) IP of c-Abl, then immunoblot for Myc-IRE1a and c-Abl from INS-1 cells expressing WT c-Abl ± transient expression of a 13x-Myc tagged-IRE1a ± imatinib
for 48 hr.
(K and M) Full-length (FL) c-Abl1b and c-Abl(3D), lacking residues C-terminal to the kinase.
(L and N) PstI-digested XBP1 cDNA amplicons from T-REx 293 cells expressing FL c-Abl1b (L) or c-Abl(3D) (N) under Dox for indicated times.
(O) IRE1a*, a recombinant mini-protein containing cytosolic kinase and RNase domains.
(P) IP of IRE1a* with Flag-tagged FL c-Abl1b or c-Abl(3D) transiently expressed in T-REx 293.
(Q) Quantification of purified IRE1a* (normalized to eluted c-Abl levels) IPed in (P). Mean ± SEM. Triplicated.
(R) XBP1 mini-substrate.
(S) RNase activity of IRE1a* (200 ng) ± c-Abl(3D) (50 ng) or ± c-Abl (50 ng) by real-time fluorescence. Mean ± SEM. Triplicated.
(T) Rate of XBP1 mini-substrate cleavage by IRE1a* ± c-Abl(3D) or ± c-Abl. Mean ± SEM. Triplicated. See also Figure S5.
Cell Metabolism 25, 883–897, April 4, 2017 891
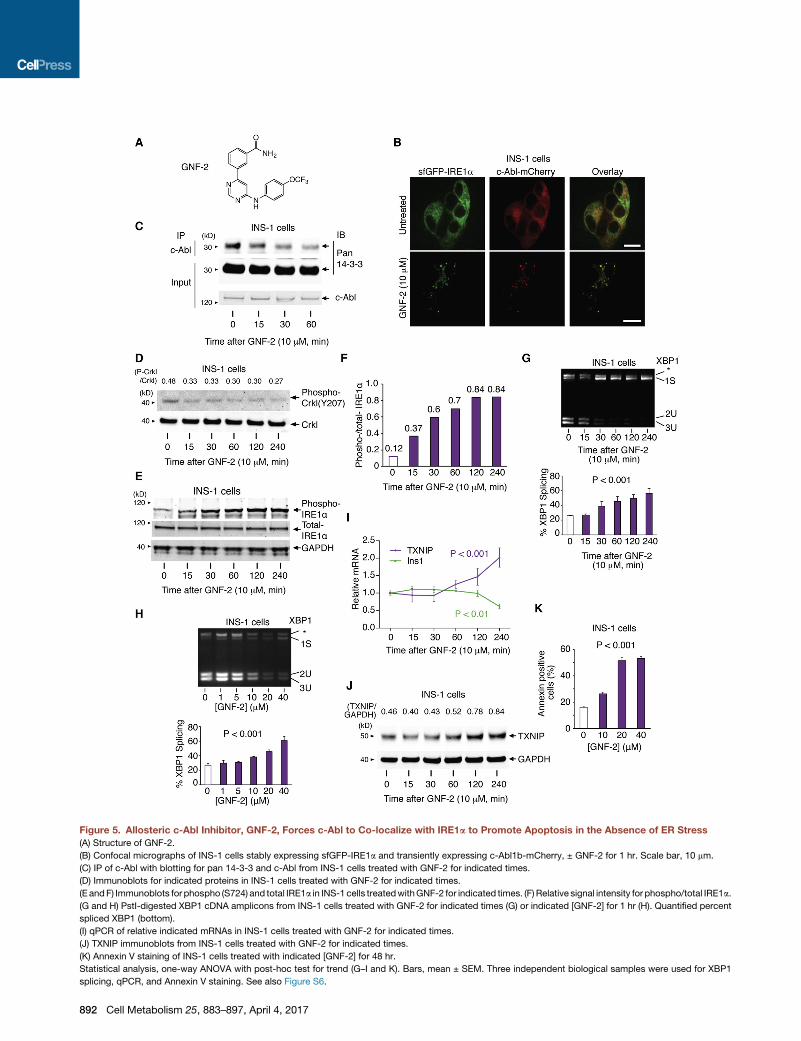
Figure 5. Allosteric c-Abl Inhibitor, GNF-2, Forces c-Abl to Co-localize with IRE1a to Promote Apoptosis in the Absence of ER Stress(A) Structure of GNF-2.
(B) Confocal micrographs of INS-1 cells stably expressing sfGFP-IRE1a and transiently expressing c-Abl1b-mCherry, ± GNF-2 for 1 hr. Scale bar, 10 mm.
(C) IP of c-Abl with blotting for pan 14-3-3 and c-Abl from INS-1 cells treated with GNF-2 for indicated times.
(D) Immunoblots for indicated proteins in INS-1 cells treated with GNF-2 for indicated times.
(E andF) Immunoblots for phospho (S724) and total IRE1a in INS-1 cells treatedwithGNF-2 for indicated times. (F) Relative signal intensity for phospho/total IRE1a.
(G and H) PstI-digested XBP1 cDNA amplicons from INS-1 cells treated with GNF-2 for indicated times (G) or indicated [GNF-2] for 1 hr (H). Quantified percent
spliced XBP1 (bottom).
(I) qPCR of relative indicated mRNAs in INS-1 cells treated with GNF-2 for indicated times.
(J) TXNIP immunoblots from INS-1 cells treated with GNF-2 for indicated times.
(K) Annexin V staining of INS-1 cells treated with indicated [GNF-2] for 48 hr.
Statistical analysis, one-way ANOVA with post-hoc test for trend (G–I and K). Bars, mean ± SEM. Three independent biological samples were used for XBP1
splicing, qPCR, and Annexin V staining. See also Figure S6.
892 Cell Metabolism 25, 883–897, April 4, 2017
(legend on next page)
Cell Metabolism 25, 883–897, April 4, 2017 893
membrane under ER stress, as its interactions with 14-3-3 pro-teins become disrupted, is consistent with ABL re-localizationfrom a cytosolic pool to specific organelles serving as a generalmechanism for diversified, contextual signaling.
Two inhibitors of ABL’s phosphotransfer activity—imatiniband GNF-2—cause divergent UPR signaling based on differen-tial effects on ABL ER localization (Figure 7). Under ER stress, im-atinib blocks ABL/IRE1a co-localization at the ER, preservingABL/14-3-3 protein interactions and blunting the UPR. Imatinib’sUPR-inhibitory effects do not rely on inhibition of ABL’s phos-photransfer activity, which appears to be dispensable basedon kinase-dead c-Abl’s ability to drive IRE1a activation. ThatGNF-2 can directly activate IRE1a—without ER stress—by dis-engaging kinase-inhibited endogenous ABL from 14-3-3 pro-teins and into IRE1a foci further demonstrates the dispensabilityof ABL’s phosphotransfer activity. This UPR scaffolding role isconsistent with c-ABL playing phosphotransfer-independentfunctions in other signaling pathways (Cong and Goff, 1999;
Galan-Moya et al., 2008; Rauch et al., 2011; Theis and Roemer,1998).ABL scaffolding provides gain control over IRE1a’s RNase,
which triggers ER-localized mRNA decay and apoptosis whenhyperactivated. Amplification of IRE1a RNase activity by ABLunder ER stress, or through GNF-2 without ER stress, can be de-feated through direct (STF-083010) or allosteric (KIRA8) RNaseinhibition. Thus, despite c-Abl playing a mitochondrial role lateduring ER stress (Ito et al., 2001), its rheostatic control overIRE1a is essential to adjusting an early set point that potentiatesapoptosis. Amplification of IRE1a’s enzymatic activities by ABL,thereby sensitizing cells to apoptosis, was demonstrated inengineered cell lines and in endogenous systems with pharma-cological agents. Finally, direct enhancement of IRE1a’s RNaseactivity by ABLwas confirmed in reconstitution experiments withpurified proteins, including a kinase-dead mutant.In sum, these results support a growing view that IRE1a’s cell
fate outputs are not solely dependent on autonomous signaling
Figure 6. Mono-selective KIRA8 Spares b Cells and Reverses Established Diabetes in NOD Mice(A) Structure of KIRA8.
(B) Immunoblots of DSS-crosslinked varying [IRE1a*] ± KIRA8.
(C) Quantified oligomer/monomer ratio.
(D) Percent IRE1a* RNase activity at indicated [compound]. IC50: KIRA6, 40.1 nM; KIRA8, 5.9 nM.
(E) Cleavage of a32P-labeled mouse Ins2 RNA by IRE1a* ± KIRA6 or KIRA8.
(F) Annexin V staining of INS-1 cells expressing IRE1a under Dox, co-treated with indicated [compound] for 72 hr. Three independent biological samples
were used.
(G) PstI-digested XBP1 cDNA amplicons from INS-1 cells treated with indicated [KIRA8] for 2 hr, then GNF-2 for 1 hr.
(H–M) Indicated mRNAs from islets of NOD females injected with 50 mg/kg KIRA8 (n = 4) or vehicle (n = 3) i.p., daily, starting at 10 weeks of age for 1 week.
(N) First-phase insulin response in pre-diabetic NOD mice before and after 4 weeks of KIRA8 (n = 8) or vehicle (n = 7), daily, starting at 10 weeks of age.
(O and P) Immunofluorescence of insulin and quantified insulin-positive area in pancreata from NOD mice treated daily with KIRA8 (n = 5) or vehicle (n = 4) for
6 weeks starting at 10 weeks of age.
(O) Representative images of insulin stain (green) and tissue sectional area (gray). Scale bar, 100 mm.
(Q) Percent diabetic mice in KIRA8-treated (n = 12) and vehicle-treated (n = 10) groups; KIRA8 or vehicle was initiated at disease onset. Statistical analysis, log-
rank test. Bars, mean ± SEM; n, number of mice. p values: * < 0.05, ** < 0.01, *** < 0.001. See also Figure S7, Table S2, and Table S3.
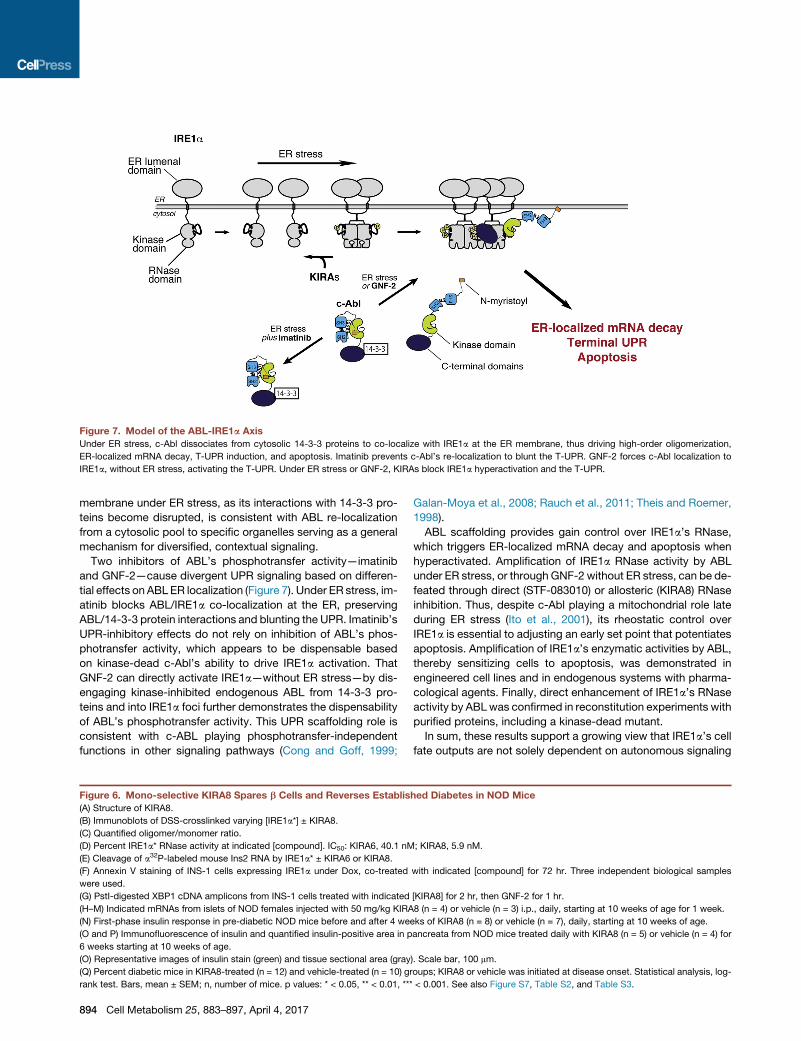
Figure 7. Model of the ABL-IRE1a AxisUnder ER stress, c-Abl dissociates from cytosolic 14-3-3 proteins to co-localize with IRE1a at the ER membrane, thus driving high-order oligomerization,
ER-localized mRNA decay, T-UPR induction, and apoptosis. Imatinib prevents c-Abl’s re-localization to blunt the T-UPR. GNF-2 forces c-Abl localization to
IRE1a, without ER stress, activating the T-UPR. Under ER stress or GNF-2, KIRAs block IRE1a hyperactivation and the T-UPR.
894 Cell Metabolism 25, 883–897, April 4, 2017
events relayed linearly in direct proportion to conditions withinthe ER, but that other non-canonical UPR components cantune IRE1a activity. This opens up the potential to drug theUPR and its outputs through other targets.
UPR Modulation in Autoimmune-Initiated b CellDegenerationMono-selective IRE1a inhibitor KIRA8 enabled us to preciselyshow that attenuating IRE1a pharmacologically in the Akitamouse preserves glycemic control in this monogenetic, fulmi-nant diabetes model driven by autonomous b cell apoptosis.This result motivated us to test whether KIRA8 would alsodemonstrate anti-diabetogenic effects in the complex NODmodel, which like the Akita shows islet IRE1a hyperactivationin the period leading up to frank diabetes (Lerner et al., 2012).At dosing regimes in the NOD that led to partial inhibition ofIRE1a (i.e., attenuated, but nonetheless preserved, XBP1mRNA splicing in islets), declines in BiP, MANF, and insulinmRNAs (and insulin protein) were reversed, even as reductionsin TXNIP mRNA were observed. Concomitant with T-UPR blunt-ing, b cell functional mass was preserved in diabetes preventionstudies. In the more stringent endpoint of reversal of establisheddiabetes, KIRA8 showed > 90% efficacy in NOD mice within3 weeks.Therefore, pharmacologically attenuating IRE1a activity in
murine diabetes models is phenotypically distinct from removalof the Ire1a gene in the b cell, which leads to translationalblocks and b cell hypoplasia (Hassler et al., 2015). Also, b cellconditional knockout of the Xbp1 gene compensatorily acti-vates IRE1a, confounding interpretations of the natural role ofthe IRE1a-XBP1 arm in b cell physiology (Lee et al., 2011).Such compensatory, dysregulated UPR effects may be generalas Perk deletion, likewise, hyperactivates IRE1a in b cells,which suffer early apoptosis, leading to postnatal diabetes(Harding et al., 2001). Therefore, selective UPR kinase inhibitorsare powerful tools for deconvoluting the role of parallel UPRsignaling in diverse in vivo models of ER stress-induced celldegeneration.Analogously, whole-body genetic knockouts of Abl1 and Abl2
are embryonic lethal, but pharmacological inhibition of ABL ki-nases reveals cell-sparing effects. And despite the essentialfunction of ABL kinases in development, human patients withCML treated with imatinib (or nilotinib) can tolerate chronicABL inhibition. Indeed, a multitude of mounting reports docu-ment paradoxical cell-sparing effects of tyrosine kinase inhibi-tory drugs originally developed against cancers (Fountas et al.,2015; H€agerkvist et al., 2007; Han et al., 2009b; Paniaguaet al., 2006). Clinical studies and case reports show improvedglycemic control and reversal of diabetes in humans treatedwith imatinib, sunitinib, or dasatanib (Fountas et al., 2015). Whilethe cell-sparing mechanism of action of these drugs and theirrelevant kinase targets is not generally understood, here the cy-toprotective basis of one member, imatinib, is clarified. Impor-tantly, our results provide mechanistic rationale to support theclinical use of imatinib for the treatment of new-onset T1D,currently being tested in a Phase II clinical trial (NCT01781975).Similarly, other FDA-approved TKIs may conceivably be repur-posed for cell-degenerative indications after clarifying their un-derlying mechanism of action.
Lastly, our results implicate ER stress-induced b cell degener-ation centrally in the pathogenesis of T1D (as in other diabeticsyndromes), although the disease is initiated by autoimmuneattack of pancreatic islets. It is tempting to speculate that tempo-rary revival of b cell function in human T1D patients experiencinga ‘‘honeymoon period’’ shortly after starting insulin may resultfrom ER stress/T-UPR reduction in islets as b cell secretoryworkload becomes reduced. Thus, our results support anevolving notion that targeting the significant percentage ofpotentially salvageable b cells in early periods of autoimmuneattack is a promising therapeutic strategy in T1D (Krogvoldet al., 2015). The ability, therefore, to blunt, from either node,the ABL-IRE1a axis and curtail premature degeneration ofER stressed b cells in autoimmune diabetes raises thepromise of further optimizing related small molecules into drugsto treat T1D and perhaps other diseases driven by unchecked ERstress.
STAR+METHODS
Detailed methods are provided in the online version of this paperand include the following:
d KEY RESOURCES TABLEd CONTACT FOR REAGENT AND RESOURCE SHARINGd EXPERIMENTAL MODEL AND SUBJECT DETAILS
B Mouse StudiesB Tissue CultureB Ex vivo Islet Studies
d METHOD DETAILSB Imatinib TreatmentsB Intra-Peritoneal Glucose Tolerance Tests and First-
phase Insulin ResponseB Histological Staining of Pancreatic Tissues and Insuli-
tis ScoreB Western Blots and AntibodiesB RNA Isolation, Quantitative Real-time PCR, and
PrimersB XBP-1 mRNA SplicingB Glucose-Stimulated Insulin Secretion (GSIS) assayB Flow CytometryB Islet StainingB Superfolder GFP-IRE1a Construction and MicroscopyB Expression and Purification of c-Abl(3D)B Expression and Purification of c-Abl1b K290RB In vitro IRE1a* Protein Preparation, Kinase, RNase and
Crosslinking AssaysB In vitro IRE1a* ImmunoprecipitationsB c-Abl-mCherry Constructs and Lentivirus ProductionB Synthesis of Dasatinib-amine and Dasatinib-amine
PrecursorB Preparation of Dasatinib ResinB In Vitro Pull Down Assay with Dasatinib ResinB KinomeB In vitro c-Abl Tyrosine Kinase ActivityB Synthesis of KIRA6B KIRA6 TreatmentB Synthesis of KIRA8B
1H-NMR of KIRA8
Cell Metabolism 25, 883–897, April 4, 2017 895
B KIRA8 Treatmentsd QUANTIFICATION AND STATISTICAL ANALYSIS
SUPPLEMENTAL INFORMATION
Supplemental Information includes seven figures and three tables and can be
found with this article online at http://dx.doi.org/10.1016/j.cmet.2017.03.018.
AUTHOR CONTRIBUTIONS
All authors conceived and designed the experiments. S.M., S.A.V., A.C.R.,
H.C.F., W.R., I.T.H.-P., M.M., R.G., L.W., K.C.-N., and R.M.-A. performed
the experiments. All authors analyzed the data. F.R.P., J.A.B, and D.J.M wrote
the paper.
ACKNOWLEDGMENTS
This work was supported by NIH grants RO1DK080955 (F.R.P.),
RO1GM086858 (D.J.M.), RO1AI046643 (J.A.B.), RO1DK100623 (D.J.M. and
F.R.P), P30 DK063720 (F.R.P. and J.A.B.), and T32GM008268 (A.C.R.); Bur-
roughs Wellcome Fund (F.R.P.); JDRF #17-2013-513 (J.A.B. and F.R.P.),
#3-PDF-2015-80-A-N (S.M.), and #2-SRA-2016-234-S-N (F.R.P.); Sumitomo
Life Social Welfare Sciences Foundation (S.M.); Lundbeck Foundation Clinical
Research Fellowship Program (I.T.H.-P.); Brehm Coalition (J.A.B.); and Break-
through Therapeutics Initiative from Leona M. and Harry B. Helmsley Chari-
table Trust—2016PG-T1D044 (F.R.P.). We thank J.Y. Wang for providing
MEFs, Vinh Nguyen for islet isolation, Anthony Hernandez for technical assis-
tance, and Dorothy Fuentes for animal husbandry. We thank members of the
Bluestone, Maly, and Papa labs and Art Weiss, Scott Oakes, Dean Sheppard,
and Mark Anderson for helpful suggestions, edits, and comments. D.J.M.,
B.J.B., and F.R.P. are founders and equity holders of OptiKira, LLC, a UPR-
ophthalmology biotech company.
Received: September 25, 2016
Revised: February 10, 2017
Accepted: March 21, 2017
Published: April 4, 2017; corrected online: April 18, 2017
REFERENCES
Alanentalo, T., Hornblad, A., Mayans, S., Karin Nilsson, A., Sharpe, J., Larefalk,
A., Ahlgren, U., and Holmberg, D. (2010). Quantification and three-dimensional
imaging of the insulitis-induced destruction of beta-cells in murine type 1 dia-
betes. Diabetes 59, 1756–1764.
Anderson, M.S., and Bluestone, J.A. (2005). The NOD mouse: a model of im-
mune dysregulation. Annu. Rev. Immunol. 23, 447–485.
Atkinson, M.A., Bluestone, J.A., Eisenbarth, G.S., Hebrok, M., Herold, K.C.,
Accili, D., Pietropaolo, M., Arvan, P.R., Von Herrath, M., Markel, D.S., and
Rhodes, C.J. (2011). How does type 1 diabetes develop?: the notion of homi-
cide or b-cell suicide revisited. Diabetes 60, 1370–1379.
Back, S.H., and Kaufman, R.J. (2012). Endoplasmic reticulum stress and type
2 diabetes. Annu. Rev. Biochem. 81, 767–793.
Bottazzo, G.F. (1986). Lawrence lecture. Death of a beta cell: homicide or sui-
cide? Diabet. Med. 3, 119–130.
Capdeville, R., Buchdunger, E., Zimmermann, J., and Matter, A. (2002). Glivec
(STI571, imatinib), a rationally developed, targeted anticancer drug. Nat. Rev.
Drug Discov. 1, 493–502.
Choi, Y., Seeliger, M.A., Panjarian, S.B., Kim, H., Deng, X., Sim, T., Couch, B.,
Koleske, A.J., Smithgall, T.E., and Gray, N.S. (2009). N-myristoylated c-Abl
tyrosine kinase localizes to the endoplasmic reticulum upon binding to an allo-
steric inhibitor. J. Biol. Chem. 284, 29005–29014.
Cong, F., and Goff, S.P. (1999). c-Abl-induced apoptosis, but not cell cycle ar-
rest, requires mitogen-activated protein kinase kinase 6 activation. Proc. Natl.
Acad. Sci. USA 96, 13819–13824.
Engin, F., Yermalovich, A., Nguyen, T., Hummasti, S., Fu, W., Eizirik, D.L.,
Mathis, D., and Hotamisligil, G.S. (2013). Restoration of the unfolded protein
response in pancreatic b cells protects mice against type 1 diabetes. Sci.
Transl. Med. 5, 211ra156.
Fischer, J.J., Dalhoff, C., Schrey, A.K., Graebner, O.Y., Michaelis, S., Andrich,
K., Glinski, M., Kroll, F., Sefkow, M., Dreger, M., and Koester, H. (2011).
Dasatinib, imatinib and staurosporine capture compounds - Complementary
tools for the profiling of kinases by Capture Compound Mass Spectrometry
(CCMS). J. Proteomics 75, 160–168.
Fountas, A., Diamantopoulos, L.N., and Tsatsoulis, A. (2015). Tyrosine Kinase
Inhibitors and Diabetes: A Novel Treatment Paradigm? Trends Endocrinol.
Metab. 26, 643–656.
Galan-Moya, E.M., Hernandez-Losa, J., Aceves Luquero, C.I., de la Cruz-
Morcillo, M.A., Ramırez-Castillejo, C., Callejas-Valera, J.L., Arriaga, A.,
Aranburo, A.F., Ramon y Cajal, S., Silvio Gutkind, J., and Sanchez-Prieto, R.
(2008). c-Abl activates p38 MAPK independently of its tyrosine kinase activity:
Implications in cisplatin-based therapy. Int. J. Cancer 122, 289–297.
Ghosh, R., Wang, L., Wang, E.S., Perera, B.G., Igbaria, A., Morita, S., Prado,
K., Thamsen, M., Caswell, D., Macias, H., et al. (2014). Allosteric inhibition of
the IRE1a RNase preserves cell viability and function during endoplasmic re-
ticulum stress. Cell 158, 534–548.
Gu, F., Nguyen, D.T., Stuible, M., Dube, N., Tremblay, M.L., and Chevet, E.
(2004). Protein-tyrosine phosphatase 1B potentiates IRE1 signaling during
endoplasmic reticulum stress. J. Biol. Chem. 279, 49689–49693.
H€agerkvist, R., Sandler, S., Mokhtari, D., andWelsh, N. (2007). Amelioration of
diabetes by imatinib mesylate (Gleevec): role of beta-cell NF-kappaB activa-
tion and anti-apoptotic preconditioning. FASEB J. 21, 618–628.
Han, D., Lerner, A.G., Vande Walle, L., Upton, J.P., Xu, W., Hagen, A., Backes,
B.J., Oakes, S.A., and Papa, F.R. (2009a). IRE1alpha kinase activation modes
control alternate endoribonuclease outputs to determine divergent cell fates.
Cell 138, 562–575.
Han, M.S., Chung, K.W., Cheon, H.G., Rhee, S.D., Yoon, C.H., Lee, M.K., Kim,
K.W., and Lee, M.S. (2009b). Imatinib mesylate reduces endoplasmic reticu-
lum stress and induces remission of diabetes in db/db mice. Diabetes 58,
329–336.
Harding, H.P., Zeng, H., Zhang, Y., Jungries, R., Chung, P., Plesken, H.,
Sabatini, D.D., and Ron, D. (2001). Diabetes mellitus and exocrine pancreatic
dysfunction in perk-/- mice reveals a role for translational control in secretory
cell survival. Mol. Cell 7, 1153–1163.
Harrington, P.E., Biswas, K., Malwitz, D., Tasker, A.S., Mohr, C., Andrews,
K.L., Dellamaggiore, K., Kendall, R., Beckmann, H., Jaeckel, P., et al. (2014).
Unfolded Protein Response in Cancer: IRE1a Inhibition by Selective Kinase
Ligands Does Not Impair Tumor Cell Viability. ACS Med. Chem. Lett. 6, 68–72.
Hassler, J.R., Scheuner, D.L., Wang, S., Han, J., Kodali, V.K., Li, P., Nguyen, J.,
George, J.S., Davis, C., Wu, S.P., et al. (2015). The IRE1a/XBP1s Pathway Is
Essential for the Glucose Response and Protection of b Cells. PLoS Biol. 13,
e1002277.
He, Y., Beatty, A., Han, X., Ji, Y., Ma, X., Adelstein, R.S., Yates, J.R., 3rd,
Kemphues, K., and Qi, L. (2012). Nonmuscle myosin IIB links cytoskeleton to
IRE1a signaling during ER stress. Dev. Cell 23, 1141–1152.
Hetz, C., and Glimcher, L.H. (2009). Fine-tuning of the unfolded protein
response: Assembling the IRE1alpha interactome. Mol. Cell 35, 551–561.
Ito, Y., Pandey, P., Mishra, N., Kumar, S., Narula, N., Kharbanda, S., Saxena,
S., and Kufe, D. (2001). Targeting of the c-Abl tyrosine kinase to mitochondria
in endoplasmic reticulum stress-induced apoptosis. Mol. Cell. Biol. 21,
6233–6242.
Krogvold, L., Skog, O., Sundstrom, G., Edwin, B., Buanes, T., Hanssen, K.F.,
Ludvigsson, J., Grabherr, M., Korsgren, O., and Dahl-Jørgensen, K. (2015).
Function of Isolated Pancreatic Islets From Patients at Onset of Type
1 Diabetes: Insulin Secretion Can Be Restored After Some Days in a
Nondiabetogenic Environment In Vitro: Results From the DiViD Study.
Diabetes 64, 2506–2512.
Lee, A.H., Heidtman, K., Hotamisligil, G.S., andGlimcher, L.H. (2011). Dual and
opposing roles of the unfolded protein response regulated by IRE1alpha and
XBP1 in proinsulin processing and insulin secretion. Proc. Natl. Acad. Sci.
USA 108, 8885–8890.
896 Cell Metabolism 25, 883–897, April 4, 2017
Lerner, A.G., Upton, J.P., Praveen, P.V., Ghosh, R., Nakagawa, Y., Igbaria, A.,
Shen, S., Nguyen, V., Backes, B.J., Heiman, M., et al. (2012). IRE1a induces
thioredoxin-interacting protein to activate the NLRP3 inflammasome and pro-
mote programmed cell death under irremediable ER stress. Cell Metab. 16,
250–264.
Lindahl, M., Danilova, T., Palm, E., Lindholm, P., Voikar, V., Hakonen, E.,
Ustinov, J., Andressoo, J.O., Harvey, B.K., Otonkoski, T., et al. (2014).
MANF is indispensable for the proliferation and survival of pancreatic b cells.
Cell Rep. 7, 366–375.
Lipson, K.L., Fonseca, S.G., Ishigaki, S., Nguyen, L.X., Foss, E., Bortell, R.,
Rossini, A.A., and Urano, F. (2006). Regulation of insulin biosynthesis in
pancreatic beta cells by an endoplasmic reticulum-resident protein kinase
IRE1. Cell Metab. 4, 245–254.
Lisbona, F., Rojas-Rivera, D., Thielen, P., Zamorano, S., Todd, D., Martinon, F.,
Glavic, A., Kress, C., Lin, J.H., Walter, P., et al. (2009). BAX inhibitor-1 is a
negative regulator of the ER stress sensor IRE1alpha. Mol. Cell 33, 679–691.
Louvet, C., Szot, G.L., Lang, J., Lee, M.R., Martinier, N., Bollag, G., Zhu, S.,
Weiss, A., and Bluestone, J.A. (2008). Tyrosine kinase inhibitors reverse type
1 diabetes in nonobese diabetic mice. Proc. Natl. Acad. Sci. USA 105,
18895–18900.
Nihira, K., Taira, N., Miki, Y., and Yoshida, K. (2008). TTK/Mps1 controls nu-
clear targeting of c-Abl by 14-3-3-coupled phosphorylation in response to
oxidative stress. Oncogene 27, 7285–7295.
Nishitoh, H., Matsuzawa, A., Tobiume, K., Saegusa, K., Takeda, K., Inoue, K.,
Hori, S., Kakizuka, A., and Ichijo, H. (2002). ASK1 is essential for endoplasmic
reticulum stress-induced neuronal cell death triggered by expanded polyglut-
amine repeats. Genes Dev. 16, 1345–1355.
Oakes, S.A., and Papa, F.R. (2015). The role of endoplasmic reticulum stress in
human pathology. Annu. Rev. Pathol. 10, 173–194.
Ozcan, U., Cao, Q., Yilmaz, E., Lee, A.H., Iwakoshi, N.N., Ozdelen, E.,
Tuncman, G., Gorg€un, C., Glimcher, L.H., and Hotamisligil, G.S. (2004).
Endoplasmic reticulum stress links obesity, insulin action, and type 2 diabetes.
Science 306, 457–461.
Paniagua, R.T., Sharpe, O., Ho, P.P., Chan, S.M., Chang, A., Higgins, J.P.,
Tomooka, B.H., Thomas, F.M., Song, J.J., Goodman, S.B., et al. (2006).
Selective tyrosine kinase inhibition by imatinib mesylate for the treatment of
autoimmune arthritis. J. Clin. Invest. 116, 2633–2642.
Papa, F.R. (2012). Endoplasmic reticulum stress, pancreatic b-cell degenera-
tion, and diabetes. Cold Spring Harb. Perspect. Med. 2, a007666.
Papandreou, I., Denko, N.C., Olson, M., VanMelckebeke, H., Lust, S., Tam, A.,
Solow-Cordero, D.E., Bouley, D.M., Offner, F., Niwa, M., and Koong, A.C.
(2011). Identification of an Ire1alpha endonuclease specific inhibitor with cyto-
toxic activity against human multiple myeloma. Blood 117, 1311–1314.
Qi, X., and Mochly-Rosen, D. (2008). The PKCdelta -Abl complex communi-
cates ER stress to the mitochondria - an essential step in subsequent
apoptosis. J. Cell Sci. 121, 804–813.
Qiu, Y., Mao, T., Zhang, Y., Shao, M., You, J., Ding, Q., Chen, Y., Wu, D., Xie,
D., Lin, X., et al. (2010). A crucial role for RACK1 in the regulation of glucose-
stimulated IRE1alpha activation in pancreatic beta cells. Sci. Signal. 3, ra7.
Rauch, J., Volinsky, N., Romano, D., and Kolch, W. (2011). The secret life of
kinases: functions beyond catalysis. Cell Commun. Signal. 9, 23.
Scheuner, D., and Kaufman, R.J. (2008). The unfolded protein response: a
pathway that links insulin demand with beta-cell failure and diabetes.
Endocr. Rev. 29, 317–333.
Tersey, S.A., Nishiki, Y., Templin, A.T., Cabrera, S.M., Stull, N.D., Colvin, S.C.,
Evans-Molina, C., Rickus, J.L., Maier, B., and Mirmira, R.G. (2012). Islet b-cell
endoplasmic reticulum stress precedes the onset of type 1 diabetes in the
nonobese diabetic mouse model. Diabetes 61, 818–827.
Theis, S., and Roemer, K. (1998). c-Abl tyrosine kinase can mediate tumor cell
apoptosis independently of the Rb and p53 tumor suppressors. Oncogene 17,
557–564.
Villalta, S.A., Lang, J., Kubeck, S., Kabre, B., Szot, G.L., Calderon, B.,
Wasserfall, C., Atkinson, M.A., Brekken, R.A., Pullen, N., et al. (2013).
Inhibition of VEGFR-2 reverses type 1 diabetes in NOD mice by abrogating
insulitis and restoring islet function. Diabetes 62, 2870–2878.
Wang, J.Y. (2000). Regulation of cell death by the Abl tyrosine kinase.
Oncogene 19, 5643–5650.
Wang, J.Y. (2014). The capable ABL: what is its biological function? Mol. Cell.
Biol. 34, 1188–1197.
Wang, X.Z., Harding, H.P., Zhang, Y., Jolicoeur, E.M., Kuroda, M., and Ron, D.
(1998). Cloning of mammalian Ire1 reveals diversity in the ER stress responses.
EMBO J. 17, 5708–5717.
Yoshida, H., Matsui, T., Yamamoto, A., Okada, T., and Mori, K. (2001). XBP1
mRNA is induced by ATF6 and spliced by IRE1 in response to ER stress to
produce a highly active transcription factor. Cell 107, 881–891.
Yoshida, K., Yamaguchi, T., Natsume, T., Kufe, D., and Miki, Y. (2005). JNK
phosphorylation of 14-3-3 proteins regulates nuclear targeting of c-Abl in the
apoptotic response to DNA damage. Nat. Cell Biol. 7, 278–285.
Cell Metabolism 25, 883–897, April 4, 2017 897
STAR+METHODS
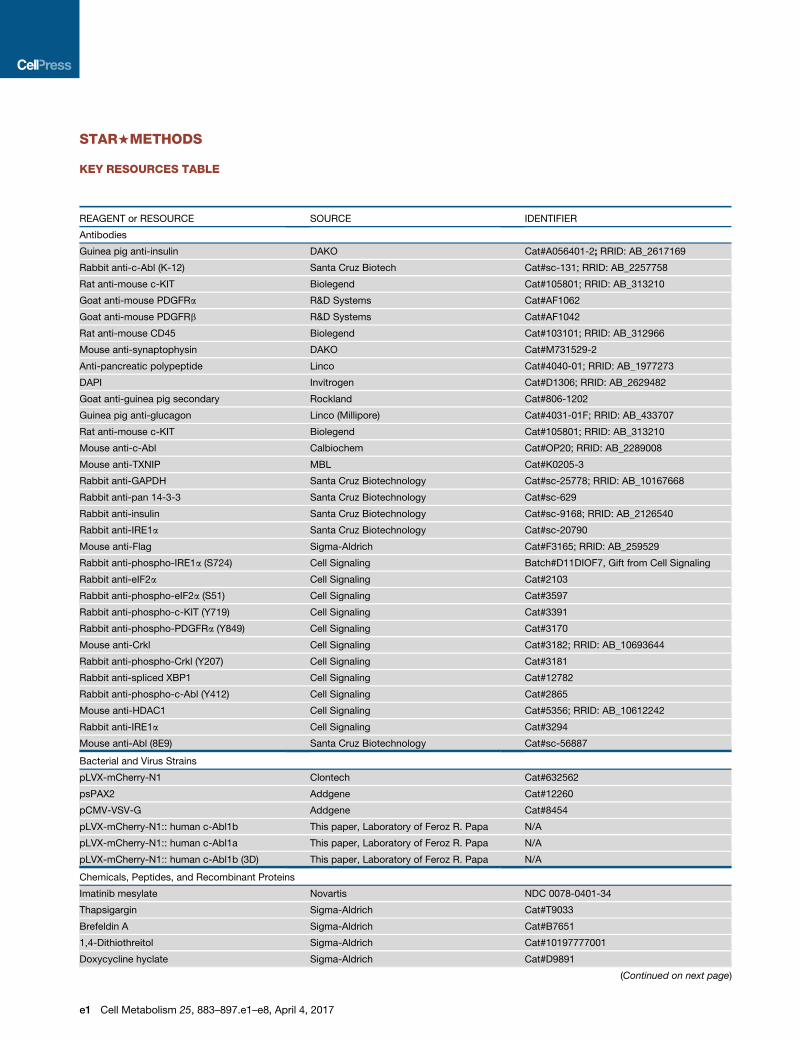
KEY RESOURCES TABLE
REAGENT or RESOURCE SOURCE IDENTIFIER
Antibodies
Guinea pig anti-insulin DAKO Cat#A056401-2; RRID: AB_2617169
Rabbit anti-c-Abl (K-12) Santa Cruz Biotech Cat#sc-131; RRID: AB_2257758
Rat anti-mouse c-KIT Biolegend Cat#105801; RRID: AB_313210
Goat anti-mouse PDGFRa R&D Systems Cat#AF1062
Goat anti-mouse PDGFRb R&D Systems Cat#AF1042
Rat anti-mouse CD45 Biolegend Cat#103101; RRID: AB_312966
Mouse anti-synaptophysin DAKO Cat#M731529-2
Anti-pancreatic polypeptide Linco Cat#4040-01; RRID: AB_1977273
DAPI Invitrogen Cat#D1306; RRID: AB_2629482
Goat anti-guinea pig secondary Rockland Cat#806-1202
Guinea pig anti-glucagon Linco (Millipore) Cat#4031-01F; RRID: AB_433707
Rat anti-mouse c-KIT Biolegend Cat#105801; RRID: AB_313210
Mouse anti-c-Abl Calbiochem Cat#OP20; RRID: AB_2289008
Mouse anti-TXNIP MBL Cat#K0205-3
Rabbit anti-GAPDH Santa Cruz Biotechnology Cat#sc-25778; RRID: AB_10167668
Rabbit anti-pan 14-3-3 Santa Cruz Biotechnology Cat#sc-629
Rabbit anti-insulin Santa Cruz Biotechnology Cat#sc-9168; RRID: AB_2126540
Rabbit anti-IRE1a Santa Cruz Biotechnology Cat#sc-20790
Mouse anti-Flag Sigma-Aldrich Cat#F3165; RRID: AB_259529
Rabbit anti-phospho-IRE1a (S724) Cell Signaling Batch#D11DIOF7, Gift from Cell Signaling
Rabbit anti-eIF2a Cell Signaling Cat#2103
Rabbit anti-phospho-eIF2a (S51) Cell Signaling Cat#3597
Rabbit anti-phospho-c-KIT (Y719) Cell Signaling Cat#3391
Rabbit anti-phospho-PDGFRa (Y849) Cell Signaling Cat#3170
Mouse anti-Crkl Cell Signaling Cat#3182; RRID: AB_10693644
Rabbit anti-phospho-Crkl (Y207) Cell Signaling Cat#3181
Rabbit anti-spliced XBP1 Cell Signaling Cat#12782
Rabbit anti-phospho-c-Abl (Y412) Cell Signaling Cat#2865
Mouse anti-HDAC1 Cell Signaling Cat#5356; RRID: AB_10612242
Rabbit anti-IRE1a Cell Signaling Cat#3294
Mouse anti-Abl (8E9) Santa Cruz Biotechnology Cat#sc-56887
Bacterial and Virus Strains
pLVX-mCherry-N1 Clontech Cat#632562
psPAX2 Addgene Cat#12260
pCMV-VSV-G Addgene Cat#8454
pLVX-mCherry-N1:: human c-Abl1b This paper, Laboratory of Feroz R. Papa N/A
pLVX-mCherry-N1:: human c-Abl1a This paper, Laboratory of Feroz R. Papa N/A
pLVX-mCherry-N1:: human c-Abl1b (3D) This paper, Laboratory of Feroz R. Papa N/A
Chemicals, Peptides, and Recombinant Proteins
Imatinib mesylate Novartis NDC 0078-0401-34
Thapsigargin Sigma-Aldrich Cat#T9033
Brefeldin A Sigma-Aldrich Cat#B7651
1,4-Dithiothreitol Sigma-Aldrich Cat#10197777001
Doxycycline hyclate Sigma-Aldrich Cat#D9891
(Continued on next page)
e1 Cell Metabolism 25, 883–897.e1–e8, April 4, 2017
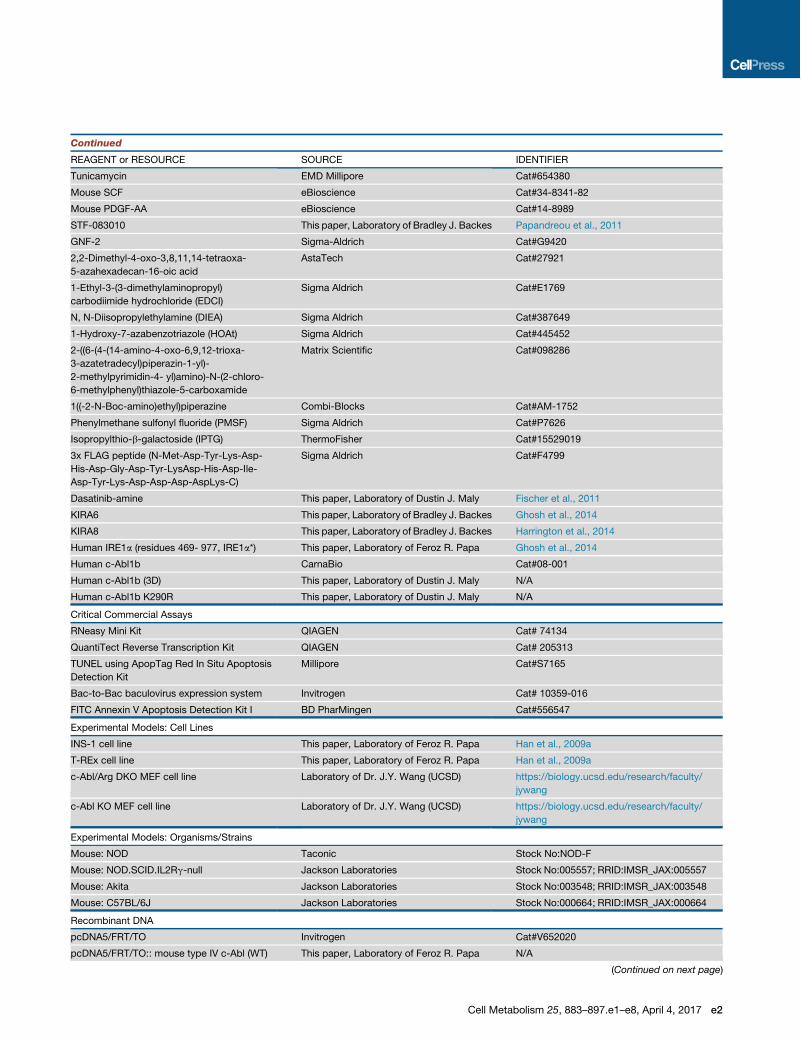
Continued
REAGENT or RESOURCE SOURCE IDENTIFIER
Tunicamycin EMD Millipore Cat#654380
Mouse SCF eBioscience Cat#34-8341-82
Mouse PDGF-AA eBioscience Cat#14-8989
STF-083010 This paper, Laboratory of Bradley J. Backes Papandreou et al., 2011
GNF-2 Sigma-Aldrich Cat#G9420
2,2-Dimethyl-4-oxo-3,8,11,14-tetraoxa-
5-azahexadecan-16-oic acid
AstaTech Cat#27921
1-Ethyl-3-(3-dimethylaminopropyl)
carbodiimide hydrochloride (EDCI)
Sigma Aldrich Cat#E1769
N, N-Diisopropylethylamine (DIEA) Sigma Aldrich Cat#387649
1-Hydroxy-7-azabenzotriazole (HOAt) Sigma Aldrich Cat#445452
2-((6-(4-(14-amino-4-oxo-6,9,12-trioxa-
3-azatetradecyl)piperazin-1-yl)-
2-methylpyrimidin-4- yl)amino)-N-(2-chloro-
6-methylphenyl)thiazole-5-carboxamide
Matrix Scientific Cat#098286
1((-2-N-Boc-amino)ethyl)piperazine Combi-Blocks Cat#AM-1752
Phenylmethane sulfonyl fluoride (PMSF) Sigma Aldrich Cat#P7626
Isopropylthio-b-galactoside (IPTG) ThermoFisher Cat#15529019
3x FLAG peptide (N-Met-Asp-Tyr-Lys-Asp-
His-Asp-Gly-Asp-Tyr-LysAsp-His-Asp-Ile-
Asp-Tyr-Lys-Asp-Asp-Asp-AspLys-C)
Sigma Aldrich Cat#F4799
Dasatinib-amine This paper, Laboratory of Dustin J. Maly Fischer et al., 2011
KIRA6 This paper, Laboratory of Bradley J. Backes Ghosh et al., 2014
KIRA8 This paper, Laboratory of Bradley J. Backes Harrington et al., 2014
Human IRE1a (residues 469- 977, IRE1a*) This paper, Laboratory of Feroz R. Papa Ghosh et al., 2014
Human c-Abl1b CarnaBio Cat#08-001
Human c-Abl1b (3D) This paper, Laboratory of Dustin J. Maly N/A
Human c-Abl1b K290R This paper, Laboratory of Dustin J. Maly N/A
Critical Commercial Assays
RNeasy Mini Kit QIAGEN Cat# 74134
QuantiTect Reverse Transcription Kit QIAGEN Cat# 205313
TUNEL using ApopTag Red In Situ Apoptosis
Detection Kit
Millipore Cat#S7165
Bac-to-Bac baculovirus expression system Invitrogen Cat# 10359-016
FITC Annexin V Apoptosis Detection Kit I BD PharMingen Cat#556547
Experimental Models: Cell Lines
INS-1 cell line This paper, Laboratory of Feroz R. Papa Han et al., 2009a
T-REx cell line This paper, Laboratory of Feroz R. Papa Han et al., 2009a
c-Abl/Arg DKO MEF cell line Laboratory of Dr. J.Y. Wang (UCSD) https://biology.ucsd.edu/research/faculty/
jywang
c-Abl KO MEF cell line Laboratory of Dr. J.Y. Wang (UCSD) https://biology.ucsd.edu/research/faculty/
jywang
Experimental Models: Organisms/Strains
Mouse: NOD Taconic Stock No:NOD-F
Mouse: NOD.SCID.IL2Rg-null Jackson Laboratories Stock No:005557; RRID:IMSR_JAX:005557
Mouse: Akita Jackson Laboratories Stock No:003548; RRID:IMSR_JAX:003548
Mouse: C57BL/6J Jackson Laboratories Stock No:000664; RRID:IMSR_JAX:000664
Recombinant DNA
pcDNA5/FRT/TO Invitrogen Cat#V652020
pcDNA5/FRT/TO:: mouse type IV c-Abl (WT) This paper, Laboratory of Feroz R. Papa N/A
(Continued on next page)
Cell Metabolism 25, 883–897.e1–e8, April 4, 2017 e2
CONTACT FOR REAGENT AND RESOURCE SHARING
Further information and requests for reagents may be directed to and will be fulfilled by Lead Contact Feroz R. Papa ([email protected]).
EXPERIMENTAL MODEL AND SUBJECT DETAILS
Mouse StudiesFemale NOD and NOD.SCID.IL2Rg null (NSG) mice were obtained from Taconic and Jackson Laboratories, respectively. MaleC57BL/6 ‘‘Akita’’ Ins2WT/C96Y (Ins2+/Akita) mice were obtained from Jackson Laboratories. Akita mice were genotyped by followingthe instruction of Jackson Laboratories. Glucose levels were measured from tail snips obtained between 9:00 and 11:00 AM using aLifeScan glucose meter (OneTouch Ultra) twice per week. Diabetic mice were defined as having blood glucose levels in the range of250 to 400 mg/dL. All procedures were performed in accordance with protocols approved by the Institutional Animal Care and UseCommittee at the University of California, San Francisco. Animals were kept in a specific pathogen-free animal facility on a 12 hr light-dark cycle at an ambient temperature of 21"C. They were given free access to water and food.
Tissue CultureINS-1 cells (rat insulinoma cell line) were grown in RPMI, 10% fetal bovine serum, 1 mM sodium pyruvate, 10 mM HEPES, 2 mMglutamine, 50 mM b-mercaptoethanol. SV40-transformed MEFs were maintained in Dulbecco’s Modified Eagle Media (DMEM)containing 5mM glucose. The DMEM was supplemented with 10% heat-inactivated fetal bovine serum (FBS, J.R. Scientific),100U penicillin, and 100U streptomycin. Flag-tagged, full-length mouse type IV c-Abl (WT), mouse type IV c-Abl (K290R), mousePDGFRa, mouse c-KIT, mouse Arg, human type 1b full-length c-Abl (1b), and deletion forms of human c-Abl(3D) were subclonedinto pcDNA5/FRT/TO plasmid (Invitrogen) by PCR. INS-1/FRT/TO or T-REx 293/FRT/TO cells were grown in the above media with10 mg/ml blasticidin. Cells were then grown in 200 mg/ml zeocin, cotransfected with each 1 mg pcDNA5/FRT/TO constructs and1 mg FLP recombinase constructs pOG44 (Invitrogen) using Lipofectamine LTX (Invitrogen). After 4 hr, cells were switched to zeo-cin-free media, trypsinized 48 hr later, and then plated in media containing hygromycin (150 mg/ml), which was replaced every3 days until colonies appeared.
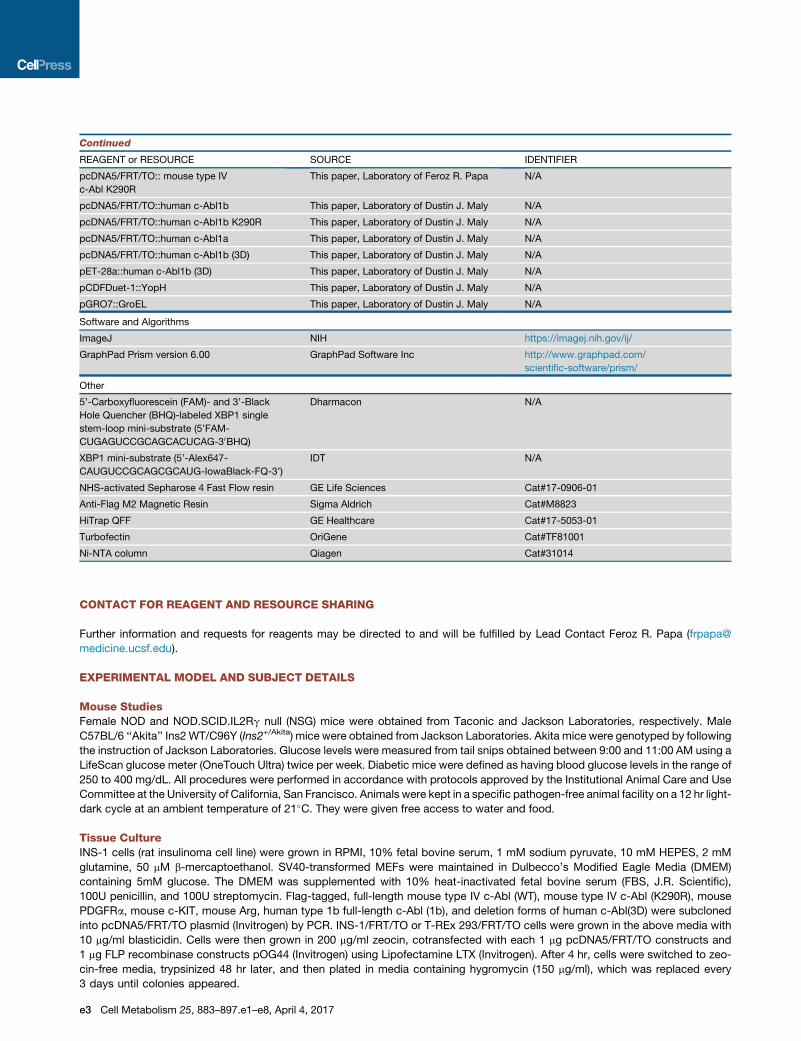
Continued
REAGENT or RESOURCE SOURCE IDENTIFIER
pcDNA5/FRT/TO:: mouse type IV
c-Abl K290R
This paper, Laboratory of Feroz R. Papa N/A
pcDNA5/FRT/TO::human c-Abl1b This paper, Laboratory of Dustin J. Maly N/A
pcDNA5/FRT/TO::human c-Abl1b K290R This paper, Laboratory of Dustin J. Maly N/A
pcDNA5/FRT/TO::human c-Abl1a This paper, Laboratory of Dustin J. Maly N/A
pcDNA5/FRT/TO::human c-Abl1b (3D) This paper, Laboratory of Dustin J. Maly N/A
pET-28a::human c-Abl1b (3D) This paper, Laboratory of Dustin J. Maly N/A
pCDFDuet-1::YopH This paper, Laboratory of Dustin J. Maly N/A
pGRO7::GroEL This paper, Laboratory of Dustin J. Maly N/A
Software and Algorithms
ImageJ NIH https://imagej.nih.gov/ij/
GraphPad Prism version 6.00 GraphPad Software Inc http://www.graphpad.com/
scientific-software/prism/
Other
5’-Carboxyfluorescein (FAM)- and 3’-Black
Hole Quencher (BHQ)-labeled XBP1 single
stem-loop mini-substrate (5’FAM-
CUGAGUCCGCAGCACUCAG-30BHQ)
Dharmacon N/A
XBP1 mini-substrate (5’-Alex647-
CAUGUCCGCAGCGCAUG-IowaBlack-FQ-3’)
IDT N/A
NHS-activated Sepharose 4 Fast Flow resin GE Life Sciences Cat#17-0906-01
Anti-Flag M2 Magnetic Resin Sigma Aldrich Cat#M8823
HiTrap QFF GE Healthcare Cat#17-5053-01
Turbofectin OriGene Cat#TF81001
Ni-NTA column Qiagen Cat#31014
e3 Cell Metabolism 25, 883–897.e1–e8, April 4, 2017
Ex vivo Islet StudiesNon-diabetic human islets were obtained from Prodo Labs (Irvine, CA) and cultured in Prodo Islet Medium (PIM from Prodo Labs).Islets were pretreated with or without imatinib for 2 hr followed by treatment with Tm for 16 hr. For mouse islet experiments, extractedislets were cultured in RPMI + 10% FBS with 500 ng/ml Tm with or without Imatinib (20 mM) or left untreated for 16 hr. Approximately50 islets were cultured for each condition in triplicate.
METHOD DETAILS
Imatinib TreatmentsImatinib mesylate (Gleevec) tablets were purchased from Novartis, ground and suspended in peanut oil or methylcellulose to a con-centration of 5mg/ml. Micewere treated daily by gavagewith a single dose of 1.5mg/mouse (0.3ml). Control mice received 0.3mL ofvehicle only. 10-week-old euglycemic NOD mice were used for pre-diabetic studies. Mice that succumbed to complications attrib-uted to overt diabetes during the experiments were excluded from the final analysis. In reversal studies, imatinib or vehicle treatmentimmediately commenced at the onset of diabetes and continued for 4 weeks. The imatinib- or vehicle-treated groups were randomlyselected. For reversal studies, mice were treated by gavage daily with 1.5 mg of imatinib or methycellulose for 6 weeks.
Intra-Peritoneal Glucose Tolerance Tests and First-phase Insulin ResponseMice were fasted for 17 hr before intraperitoneal injection with glucose (1.5 g/kg in saline). Blood samples (25ml) were collected fromthe tail vein immediately before the injection and 2 min afterward to determine the first-phase insulin response, and separated toserum. Serum insulin levels were measured using mouse ultra-sensitive insulin-ELISA (Mercodia).
Histological Staining of Pancreatic Tissues and Insulitis ScoreParaffin-embedded and frozen sections prepared from human and mouse pancreata were analyzed using standard immunofluores-cence staining procedures. Sections were subsequently washed and incubated with the species-appropriate, Alexa-conjugatedsecondary antibodies (Invitrogen). Sections were stained with DAPI for 5 min to stain nuclei and mounted with FluorSave reagent(Calbiochem). The insulin-positive area in pancreatic sections was highlighted and quantified with Metamorph by a blinded operator,andwas expressed as a percentage of the total pancreatic area. 12-16 sections per group were analyzed. For insulitis score, multiple10 mm sections were stained with hematoxylin and eosin and scored blindly for severity of insulitis. The insulitis was considered peri-insulitis when lymphocytes were found surrounding, but not infiltrating the architecture of the islets; moderate insulitis if less than halfof the islet architecture was infiltrated with lymphocytes; and severe insulitis if more than half of the islet architecture was infiltratedwith lymphocytes. Score; 0 = no insulitis; 1 = peri insulitis; 2 = moderate insulitis; 3 = severe insulitis.
Western Blots and AntibodiesFor protein analysis, cells were lysed in M-PER buffer (ThermoScientific) plus complete EDTA-free protease inhibitor (Roche) andphosphatase inhibitor cocktail (Sigma-Aldrich). Protein concentration was determined using BCA Protein Assay (Thermo). Westernblots were performed using 4%–12% Bis-Tris (NuPage), 3%–8% Tris-Acetate (NuPage), or Phos-tag (Wako Pure Chemical Indus-tries) precast gels on Invitrogen XCell SureLockMini-Cell modules. Gels were run usingMES, Tris-Acetate, or Tris-Glycine buffer andtransferred onto nitrocellulose transfer membrane using an XCell II Blot Module. Antibody binding was detected with near-infrared-dye-conjugated secondary antibodies (Li-Cor) on the LI-COR Odyssey scanner. Blocking, antibody incubation, and washing weredone in TBS with 0.05% Tween-20 (v/v) and 0.5%–5% (w/v) non-fat dry milk. Antibody-binding was detected with near-infrared-dye-conjugated secondary antibodies (Li-Cor) on the LI-COR Odyssey scanner and quantified by densitometry using ImageJ(NIH). GAPDH and HDAC1 were used as a loading control. Please note that the immunoblot membrane of Figure 1A—used to detectIRE1a species—phospho- and total-was stripped and reprobed for detection of Abl species—phospho- and total- for Figure 3A.Thus, the GAPDH blot used for normalization is common to both figures, and has been shown in Figures 1A and 3A.
RNA Isolation, Quantitative Real-time PCR, and PrimersRNAwas isolated fromwhole cells using either QIAGEN RNeasyMini kits or Trizol (Invitrogen). For standard mRNA detection, gener-ally 1 mg total RNA was reverse transcribed using the QuantiTect Reverse Transcription Kit (QIAGEN). For qPCR, we used SYBRgreen (QIAGEN) and StepOnePlus Real-Time PCR System (Applied Biosystems). Thermal cycles were: 5 min at 95"C, 40 cyclesof 15 s at 95"C, 30 s at 60"C. Gene expression levels were normalized to Beta Actin or Hprt1. Primers used for qPCRwere as follows:Rat TXNIP: 50-CTGATGGAGGCACAGTGAGA-30 and 50- CTCGGGTGGAGTGCTTAGAG-30; Rat Ins1: 50-GTCCTCTGGGAGCCCAAG-30 and 50- ACAGAGCCTCCACCAGG-30; Rat c-Abl: 50-CTCCTTGACTGACCCAGAGC-30 and 50-GCACCGACATCAGCTACAGA-30; Rat Beta Actin: 50-GCAAATGCTTCTAGGCGGAC-30 and 50-AAGAAAGGGTGTAAAACGCAGC-30; Human Insulin:50-GCCTTTGTGAACCAACACCTG-30 and 50-GTTGCAGTAGTTCTCCAGCTG-30; Human TXNIP: 50-CCTCTGGGAACATCCTTCAA-30 and 50-GGGGTATTGACATCCACCAG-30; Human Beta Actin: 50-AGAGCTACGAGCTGCCTGAC-30 and 50-AGCACTGTGTTGGCGTACAG-30; Mouse Hprt1: 50-CTCATGGACTGATTATGGACAGGAC-30 and 50-GCAGGTCAGCAAAGAACTTATAGCC-30; Mouse BiP:50-TTCAGCCAATTATCAGCAAACTCT-30 and 50-TTTTCTGATGTATCCTCTTCACCAGT-30; Mouse MANF: 50-AGGTCCACTGTGCTCAGGTC-30 and 50-CCACCATATCCCTGTGGAAA-30; Mouse TXNIP: 50-TCAAGGGCCCCTGGGAACATC-30 and 50- GACACTGGTGCCATTAAGTCAG-30; Mouse Ins1: 50-ACCCACCCAGGCTTTTGTC-30 and 50-TCCCCACACACCAGGTAGAGA-30; Mouse
Cell Metabolism 25, 883–897.e1–e8, April 4, 2017 e4
Ins2: 50-TGGCTTCTTCTACACACCCATGT-30 and 50-AGCTCCAGTTGTGCCACTTGT-30; Mouse c-Abl: 50-GCAGTTCCTTCCGAGAGATG-30 and 50-GAGAACGGAAGCCTGAGTTG-30.
XBP-1 mRNA SplicingRNAwas isolated fromwhole cells or tissues and reverse transcribed as above to obtain total cDNA. Then, XBP-1 primers were usedto amplify an XBP-1 amplicon spanning the 26 nt intron from the cDNA samples in a regular 3-step PCR. Thermal cycles were: 5 minat 95"C, 30 cycles of 30 s at 95"C, 30 s at 60"C, and 1 min at 72"C, followed by 72"C for 15 min, and hold at 4"C. Primers used forXBP-1 mRNA splicing were as follows: sense primer XBP1.3S (50-AAACAGAGTAGCACAGACTGC-30) and antisense primerXBP1.2AS (50-GGATCTCTAAGACTAGAGGCTTGGTG-30). PCR fragments were then digested by PstI, resolved on 3% agarosegels, stained with EtBr and quantified by densitometry using ImageJ (NIH).
Glucose-Stimulated Insulin Secretion (GSIS) assayFreshly isolated islets were cultured in RPMI-1640 with 10% FCS, 2 mM L-glutamine, 0.1 mM 2-mercaptoethanol, and 11.1 mMglucose with or without Tm (500 ng/ml) for 16 hr before the GSIS assay. Imatinib (20 mM) was added 2 hr before treating with Tm.In the GSIS assay, islets were preincubated in HEPES-buffered Krebs-Ringer bicarbonate solution (KRBH) (10 mM HEPES[pH 7.4], 129 mM NaCl, 4.7 mM KCl, 1.2 mM KH2PO4, 1.2 mM MgSO4, 2 mM CaCl2, 5 mM NaHCO3, and 0.1% BSA) containing2.5 mM glucose for 30 min at 37"C. Fifty islets per condition were incubated with either 2.5 mM or 28 mM glucose in KRBH at37"C for 30 min. Collected media were analyzed by anti-insulin ELISA (EMDMillipore) and insulin levels were normalized to total pro-tein amount.
Flow CytometryFor assaying apoptosis by Annexin V staining, cells were plated in 12-well plates overnight. Cells were then treated with either variousER stress agents or Dox for the indicated times. On the day of analysis, cells were trypsinized andwashed in PBS and resuspended inAnnexin V binding buffer with Annexin V FITC (FITC Annexin V Apoptosis Detection Kit I, BD PharMingen). Flow cytometry wasperformed on a Becton Dickinson LSRII flow cytometer.
Islet StainingAfter islet extraction, islets were spun, washed once with PBS, and fixed for 30 min with 4% PFA. After fixation, islets were washedtwice with PBS, followed by a wash in 100% ethanol. After removal of all ethanol, 100 mL of prewarmed Histogel (Thermo Scientific)was added to the eppendorf tube and placed at 4"C to solidify before paraffin embedding and 5 mmsectioning of the islets. Islets werestainedwith TUNEL using ApopTag Red In Situ Apoptosis Detection Kit (Millipore) according to themanufacturer’s instructions. Isletswere also co-stained with guinea pig anti-insulin (Zymed), DAPI (Sigma-Aldrich), and goat anti-guinea pig secondary (Rockland)before mounting onto slides with VectaShield (Vector Laboratories). At least 10 islets and > 500 b-cell nuclei were counted per group(in triplicate). Cells were considered TUNEL positive if staining was present and co-localized with DAPI staining, indicating nuclearlocalization.
Superfolder GFP-IRE1a Construction and MicroscopyThe first 27 amino acids of mouse IRE1a containing the signal peptide were cloned just before the first ATG of sfGFP lacking the stopcodon, and the remaining IRE1a sequence (WT) was cloned in-frame after the sfGFP in a pcDNA5/FRT/TO mammalian expressionplasmid. INS-1-FRT/TO cells were transfected to generate stable cell lines expressing the above constructs. INS1-sfGFP-IRE1a cellswere inducted with 1 ng/ml Dox (a sub-apoptotic dose sufficient for imaging the reporter) for 24 hr. Live cells were imaged (NikonEclipse Ti-Yokogawa CSU22 spinning disk confocal) with Apo 60X/1.49 oil objective and a 491nm excitation/525-50 emission filter.Composite figures were prepared using ImageJ (NIH).
Expression and Purification of c-Abl(3D)Residues 65-534 of human c-Abl1b (c-Abl(3D)) were cloned in a pET-28a vector. The plasmid for Abl(3D), YopH (pCDFDuet-1 vector),andGroEL (pGRO7 vector) were co-transformed into BL21 cells and plated onto triple selective (kanamycin, streptomycin, and chlor-amphenicol) LB agar plates and grown overnight at 37"C. A single colony from the plate was grown in an overnight culture of 50mls ofTerrific Broth + kanamycin/streptomycin/ chloramphenicol overnight at 37"C. A large 2L culture was then inoculated with the over-night culture and grown to an OD600 of 1.2 at 37"C (approximately 5-6 hr). The culture was then cooled to 18"C for one hr whileshaking. Expression was induced with 0.2 mM IPTG for 16 hr (overnight) at 18"C and pelleted. The pellet was re-suspended in chilledlysis buffer (50mMHEPES pH 8.0, 20 mM Imidazole, 300 mM NaCl, 0.1% Triton-X, and 1 mM PMSF). Cells were lysed by sonicationand cleared by spinning for 30-45 min at 10,000x rcf. The clarified lysate was decanted, added to 1 mL 50% Ni-NTA slurry, androtated at 4"C for 1 hr. Samples were pelleted by centrifugation and the supernatant was aspirated. The pelleted resin was thenwashed with 3x resin volume of cold lysis buffer. Eluted c-Abl(3D) was dialyzed overnight into 50 mM Tris pH 8.0, 150 mM NaCl,5% Glycerol, and 1 mM DTT. FPLC buffers A (50 mM Tris pH 8.0, 1 mM DTT, 5% Glycerol) and B (50 mM Tris pH 8.0, 15 M NaCl,1mMDTT, 5%Glycerol) were prepared and filtered. c-Abl(3D) was eluted on an anion exchange column (QFFHiTrap; GEHealthcare)with a 0%–35% B gradient over 15 column volumes at a flow rate of 2 mls per minute. Fractions with UV absorbance were analyzedby SDS-PAGE. Pure fractions were combined, concentrated, and stored for later use.
e5 Cell Metabolism 25, 883–897.e1–e8, April 4, 2017
Expression and Purification of c-Abl1b K290Rc-Abl1b K290R was cloned using a c-Abl1b Flag pcDNA5/FRT/TO template and the following QuikChange primers: Forward:50-GTGGCCGTGAGGACCTTGAAGGAGGACACCATG–30, Reverse: 50-GTCCTCACGGCCACCGTCAGGCTGTATTTCTTCC– 30.The plasmid (10 mg) was transfected into HEK293T cells that had been plated onto 15 cm dishes at 3x10⁵ cells/ml and allowed togrow for 16 hr. The cells were grown for another 16 hr in media containing plasmid and transfection reagent (Turbofectin). Cellswere then washed twice with ice cold PBS and lysed in 1 mL of chilled lysis buffer (50 mM Tris pH 7.4, 150 mM NaCl, 1 mMEDTA, 1%Triton-X). Anti-FlagM2Magnetic Resin (Sigma Aldrich) (60 mL in a 50% slurry) was added to an eppendorf tube and dilutedwith 500 mL of TBS and aspirated towash the beads, this stepwas repeated twice. Lysate was then added to the beads and rotated at4"C for 2 hr. After two hr the supernatant was removed and the beads were washed three times with TBS. To elute c-Abl1b K290R,100 mL of 1 mg/mL of 3xFlag peptide in TBS was added to beads and rotated for one hr at 4"C. After one hr the supernatant wascollected and it’s purity and concentration was determined via SDS-PAGE.
In vitro IRE1a* Protein Preparation, Kinase, RNase and Crosslinking AssaysA construct containing the cytosolic kinase and RNase domains of human IRE1a (residues 469-977, IRE1a*) was expressed in SF9insect cells using the Bac-to-Bac baculovirus expression system (Invitrogen) with a 6-His-tag at the N terminus, and purified with aNi-NTA (QIAGEN) column. To determine the effect of compounds on IRE1a* kinase activity, imatinib or nilotinib (20 mM and 6.7 mM)was incubated with IRE1a* in cleavage buffer (20 mM HEPES at pH 7.5, 0.05% Triton X-100 (v/v), 50 mM potassium chloride, 1 mMmagnesium chloride, 0.05mg/ml BSA, 0.2mg/mlMBP 1mMDTT) for 30min, followed by incubation with 10 mCi [g-32P] ATP (3,000 Cimmol!1, PerkinElmer) at 23"C for 3 hr. Samples were then spotted onto phosphocellulose paper and washed in triplicate with 0.5%phosphoric acid and autoradiographed. Percent activity was quantified relative to DMSO treated IRE1a*. The RNase assay for theendpoint readings of IRE1a* (Figure 6D) was performed by using 50FAM-30BHQ-labeled XBP1 single stem-loop mini-substrate(50FAM- CUGAGUCCGCAGCACUCAG-30BHQ, from Dharmacon). For the endpoint readings of IRE1a* RNase activity, 0.1 mg/mlIRE1a* was incubated with 2 mM XBP1 mini-substrate for 20 min. Reaction mixtures were subsequently resolved by urea 15%PAGE. For the kinetic assay with c-Abl constructs (Figures 4S and 4T), 200 ng IRE1a* and 50 ng c-Abl1b or c-Abl(3D) were incubatedat room temperature in buffer A (20 mMHEPES pH 7.5, 50mM K2OAc, 1mMMgOAc, 0.05% Triton X-100). For the kinetic assay withc-Abl1b WT and K290R constructs (Figures S5L and S5M), 230nM IRE1a* and varying concentrations of c-Abl1b K290R (520 nM,260 nM, 130 nM, 65 nM, and 32.5 nM) or c-Abl1bWTwere incubated at room temperature in buffer A. After 20 min, 2 mL of the abovemixture was added into a Corning 384 well plate. XBP1 mini-substrate (50-Alex647-CAUGUCCGCAGCGCAUG-IowaBlack-FQ-30;IDT) was added to the wells to a final concentration of 2 mM and a final well volume of 30 mL. Fluorescence was detected on a PerkinElmer Envision Microplate Reader at excitation and emission wavelengths of 650 nm and 665 nm. Reaction process was monitoredreal time in 15- or 20 s intervals for 40 min. Rates were determined by plotting the linear range of fluorescent curves using GraphPadPrism analysis software. To determine the effect of compounds using the RNase kinetic assay, 10 nM IRE1a* were incubated with2 mM XBP1 mini-substrate under varying concentrations of compounds for one hr. Fluorescence signal was monitored in 20 s inter-vals on SpectraMaxM5 (Molecular Devices) and the reaction velocity (V0) was defined asD(Fluorescence Intensity) x (min-1) to calcu-late % activity. Internally 32P-labeled mouse Insulin2 (Ins2) RNA was also used as a substrate. For the crosslinking experiments,IRE1a* was crosslinked with 250 mM disuccinimidyl suberate (DSS) with DMSO or 10 mM KIRA8 for one hr.
In vitro IRE1a* ImmunoprecipitationsT-REx 293 cells were plated onto 10-cm2 dishes 24 hr before transfection with c-Abl1b-Flag or c-Abl(3D)-Flag DNA (X-tremegene HPprotocol). After 24 hr, cells were trypsinized, washed with PBS, and lysed in 500 mL RIPA buffer (50 mM Tris pH 7.8, 150 mM NaCl,1mM EDTA, 1% Igepal CA-630, 1X Roche PhosSTOP phosphatase inhibitor cocktail, 1x Pierce Protease inhibitor cocktail, 1mMPMSF) for 30min on ice. Lysates were cleared for 20min at 14,000 g and 10 mL anti-Flagmagnetic beads (Sigma-Aldrich) were addedto each cleared lysate. Immunoprecipitation was performed for 2 hr at 4"C. Immediately following immunoprecipitation, resin waswashed three times with 200 mL RIPA buffer, followed by three 200 mL TBS washes, and a one hr incubation with 100 nM IRE1a*in TBS at 4"C. Resin was washed three times with TBS. Bound c-Abl1b-Flag or c-Abl(3D)-Flag and associated IRE1a* were elutedwith 100 mL 0.18 mg/ml 3x Flag peptide in TBS for 15 min at room temperature. Fractions were analyzed by SDS-PAGE and probedwith Flag (Cell Signaling) and IRE1a (Santa Cruz) antibodies following immunoblotting.
c-Abl-mCherry Constructs and Lentivirus ProductionFull-length Flag-tagged human c-Abl1b was used as a template to create deletion forms of c-Abl(3D) by PCR and Gibson Assembly(NEB). Flag-tagged human c-Abl (1b, 1a, and 3D) constructs were subcloned into pcDNA5 (Invitrogen), and then into pLVX-mCherry-N1 vector (Clontech) for lentivirus expression. For lentivirus production, T-REx 293 packaging cells were cotransfected at 70%confluence by calcium phosphate method with 5 mg lentivirus vectors, 3 mg psPAX2 vector, and 2 mg pCMV-VSV-G vector. After48 hr, the viral supernatant was collected and filtered. Cells were incubated overnight with the viral supernatant. Subsequently, pu-romycin was used for selection.
Synthesis of Dasatinib-amine and Dasatinib-amine Precursor5-Thiazolecarboxamide, 2-[[6-[4-(2-aminoethyl)-1-piperazinyl]-2-methyl-4-pyrimidinyl]amino]-N-(2-chloro-6-methylphenyl): Oneequivalent of commericially available Dasatinib-amine precursor (2-((6-(4-(14-amino-4-oxo-6,9,12-trioxa-3-azatetradecyl)pipera-
Cell Metabolism 25, 883–897.e1–e8, April 4, 2017 e6
zin-1-yl)-2-methylpyrimidin-4-yl)amino)-N-(2-chloro-6 methylphenyl)thiazole-5-carboxamide (CAS#: 302964-08-5) was added tofive equivalents of 1((!2-N-Boc-amino)ethyl)piperazine (CAS#: 140447-78-5) and three equivalents of DIEA in 0.1 M 1,4-dioxane.The reaction was sealed in a microwave vial and placed in an organic synthesis microwave for one hr at 110"C. The crude mixturewas then dissolved in 5mL of dichloromethane and 2mL of trifluoroacetic acid are stirred at room temperature for two hr. Solvent wasremoved under vaccum and 5-thiazolecarboxamide, 2-[[6-[4-(2-aminoethyl)-1-piperazinyl]-2-methyl-4-pyrimidinyl]amino]-N-(2-chloro-6-methylphenyl) was purified by flash column chromatography using DCM:Methanol (2% NH4OH).
2-[[6-[4-(14-amino-4-oxo-6,9,12-trioxa-3-azatetradec-1-yl)-1-piperazinyl]-2-methyl-4-pyrimidinyl]amino]-N-(2-chloro-6-methyl-phenyl)!5-Thiazolecarboxamide (Dasatinib-amine, CAS#: 1622947-07-2): A mixture of 5-Thiazolecarboxamide, 2-[[6-[4-(2-amino-ethyl)-1-piperazinyl]-2-methyl-4-pyrimidinyl]amino]-N-(2-chloro-6-methylphenyl) (1 eq.) and 2,2-Dimethyl-4-oxo-3,8,11,14-tet-raoxa-5-azahexadecan-16-oic acid (1.2 eq.) was added to EDCI (1.5 eq.), HOAt (1.5 eq.), DIEA (3 eq.) in 0.1 M DMF and stirred atroom temperature overnight. The mixture was diluted in EtOAc and the organic layer extracted in a separatory funnel. Ethyl acetatewas removed under vacuum from the organic layer. Crude was re-dissolved in a 1:4 mixture of DCM and TFA and stirred at roomtemperature for 2 hr. Solvent was removed under vacuum and the crude dissolved in a 1:1 mixture of water and acetonitrile and pu-rified using reverse-phase chromatography (HPLC). 2,2-Dimethyl-4-oxo-3,8,11,14-tetraoxa-5-azahexadecan-16-oic acid (1.2 eq.)was added to EDCI (1.5 eq.), HOAt (1.5 eq.), DIEA (3 eq.) in 0.1 M DMF and stirred at room temperature overnight. The mixturewas diluted in EtOAc and the organic layer extracted in a separatory funnel. Ethyl acetate was removed under vacuum from theorganic layer. Crudewas re-dissolved in a 1:4mixture of DCMand TFA and stirred at room temperature for 2 hr. Solvent was removedunder vacuum and the crude dissolved in a 1:1 mixture of water and acetonitrile and purified using reverse-phase HPLC. Rf = 0.5(CHCl3 containing 13% v/v MeOH and 2% v/v NH3 in MeOH). ESI-MS: m/z = 676.9 [M+H]+ (consistent with previously describedcharacterization [Fischer et al., 2011]).
Preparation of Dasatinib ResinNHS-activated Sepharose 4 Fast Flow resin in a 50% slurry with isopropanol was pipetted into a Poly Prep ChromatographyColumn (BioRad). Isopropanol was drained from the resin and the resin was washed twice with 2x resin volumes of ice cold50% DMF:Ethanol (1:1). Resin was drained and 1x resin volume of DMF:Ethanol (1:1) was added. 2-[[6-[4-(14-amino-4-oxo-6,9,12-trioxa-3-azatetradec-1-yl)-1-piperazinyl]-2-methyl-4-pyrimidinyl]amino]-N-(2-chloro-6-methylphenyl)!5-Thiazolecarboxa-mide (Dasatinibamine, CAS#: 1622947-07-2) was added to the resin to a concentration of 15 mM. The resin mixture was adjustedto a pH of 8.0 with DIEA and allowed to rotate overnight at room temperature. Resin was then drained and two resin volumes ofquenching mixture (0.5 M Ethanolamine, 0.5 M NaCl pH 8.5) was added and allowed to rotate overnight at room temperature.Resin was drained and washed three times with 3x resin volumes of 0.1M Tris-HCl at pH 8.5 and then washed three timeswith three resin volumes 0.1 M Acetate, 0.5 M NaCl at pH 5.0. Resin was drained and stored at 4"C in 20% Ethanol as a 50%slurry.
In Vitro Pull Down Assay with Dasatinib ResinDasatinib resin (40 mL) was added to a microcentrifuge tube; centrifuged and aspirated. Resin was washed with 100 mL pull downbuffer (50 mM Tris pH 7.5, 100 mM NaCl, 0.5 mg/ml BSA, 1 mM DTT) three times and aspirated. IRE1a* (500 nM) with and withoutc-Abl (Carnebio; 250 nM) in pull down buffer (120 mL) was added to washed resin and allowed to rotate for 1.5 hr at room temperature.After incubation, resin was centrifuged and aspirated. Resin was subsequently washed with 120 mL pull down buffer, centrifuged andaspirated. Immobilized proteins were then eluted with 120 mL 1x SDS and boiled. Samples were resolved via SDS-PAGE gel andvisualized via Western Blot using a total IRE1a antibody (#3294; Cell Signaling) and an SH2-domain specific c-Abl antibody(sc-56887; Santa Cruz Biotechnology). Antibody-binding was detected with near-infrared-dye-conjugated secondary antibodies(Li-Cor) on the LI-COR Odyssey scanner.
KinomeKIRA8 was tested at a single dose at least in duplicate at a concentration of 1 mM against 365 kinases by Reaction Biology. Percentenzymatic activity was determined relative to DMSO-treated kinases. Curve fits were performed for KIRA8 when the remaining enzy-matic activity was less than 65%.
In vitro c-Abl Tyrosine Kinase ActivityTitrations of inhibitors (3-fold serial dilutions starting at 20 mM, eight data points) were assayed in a black 384-well plate (Corning,3573) in buffer containing 50 nM c-Abl(3D), 75 mM HEPES (pH 7.5), 155 mM MgCl2, 3.75 mM EGTA, 1 mM Na3VO4, 150 mMNaCl, 0.2 mg/ml BSA, 100 mM ATP, and 20 mM Abl pyrene substrate (Ac-AEAIYAA(dap-pyrene)-LA-NH2). The final volume ofeach assay well was 30 mL and the total DMSO concentration was 4% per well. The enzymatic reaction was initiated with Abl pyrenesubstrate after one hr incubation at room temperature of c-Abl(3D), inhibitor, and ATP. The reaction proceeded for two hr after whichthe plate was read on a Perkin Elmer EnVision fluorimeter (Ex 340, Em 405).
Synthesis of KIRA6KIRA6 1-(4-(8-amino-3-tert-butylimidazo[1,5-a]pyrazin-1-yl)naphthalen-1-yl)-3-(3- (trifluoromethyl)phenyl)urea (KIRA6). A mixture ofI1 (60.0mg, 0.120mmol),A (66mg, 0.15mmol), tetrakis(triphenylphosphine)palladium (5mg, 4 mmol) and sodium carbonate (928mg,
e7 Cell Metabolism 25, 883–897.e1–e8, April 4, 2017
0.27 mmol) was dissolved in a 3:1 mixture of DME/water (0.5 ml). The mixture was heated overnight at 85"C. The crude mixture wascooled to room temperature, diluted in a mixture of acetonitrile/water and purified by reverse phase chromatography (HPLC) toobtain 53 mg of KIRA6. TLC (CH2Cl2:MeOH, 95:5 v/v): Rf = 0.4; 1H NMR (300 MHz, MeOD): d 8.26 (m, 1H), 8.08-7.99 (m, 2H),7.90-7.86 (m, 1H), 7.83-7.79 (m, 1H), 7.69- 7.52 (m, 5H), 7.35 (d, J = 7.4 Hz, 1H), 6.98 (m, 1H), 1.65 (s, 9H); 13C NMR (126 MHz,MeOD): d 154.8, 140.2, 135.7, 133.0, 132.4, 131.7, 131.6, 131.0, 130.7, 129.4, 128.8, 128.6, 128.5, 127.0, 126.6, 125.9, 125.4,123.2, 121.9, 120.1, 118.7, 115.0, 114.4, 110.1, 33.6, 27.3; ESI-MS (m/z): [M]+ calculated for C28H25F3N6O [M+H]+: 519.2; found519.4. The purity of KIRA6 was determined with two analytical RP-HPLC methods, using a Varian Microsorb-MV 100-5 C18 column(4.6mm x 150mm), and eluted with either H2O/CH3CN or H2O/MeOH gradient solvent systems (+0.05% TFA) run over 30min. Prod-ucts were detected by UV at 254 nm. KIRA6 was found to be > 95% pure in both solvent systems.
KIRA6 TreatmentFemale NODmicewere randomized to KIRA6 or vehicle groups, and injected i.p. with a 2mg/ml solution of KIRA6 (5mg/kg) or vehicle(3% ethanol: 7% Tween-80: 90% saline) twice a day (b.i.d.). 8- or 10-week-old euglycemic NOD mice were used for pre-diabeticstudies. In reversal studies, KIRA6 or vehicle treatment immediately commenced at the onset of diabetes. The first 6 enrolledmice in each group were treated for 8 weeks. Blood glucose and body weight were monitored weekly. At 6 weeks, 2 (vehicle) and1 (KIRA6) mice with blood glucose levels greater than 600 mg/dL were euthanized due to complications of hyperglycemia. Assome mice were euthanized due to complications attributed to overt diabetes, subsequent KIRA6 trials were conducted for nomore than 4 weeks, and blood glucose was monitored weekly. Mice that were euthanized due to complication attributed to overtdiabetes were excluded from the final analysis.
Synthesis of KIRA8(S)-2-chloro-N-(6-methyl-5-((3-(2-(piperidin-3-ylamino)pyrimidin-4-yl)pyridin-2-yl)oxy)naphthalen-1-yl)benzenesulfonamide (KIRA8):A solution of (S)-tert-butyl 3-((4-(2-((5-(2-chlorophenylsulfonamido)-2-methylnaphthalen-1-yl)oxy)pyridin-3- yl)pyrimidin-2-yl)amino)piperidine-1-carboxylate (4.36 g, 6.22 mmol) in DCM (15 ml) was treated with HCl in dioxane (3.5 M, 4 ml) and stirred at 50"C for1 hr. The solution was then concentrated, and the remaining solid was triturated with Et2O. Drying over P2O5 in a vacuum desiccatorgave (S)-2-chloro-N-(6-methyl-5-((3-(2- (piperidin-3-ylamino)pyrimidin-4-yl)pyridin-2-yl)oxy)naphthalen-1-yl)benzenesulfonamideas an off-color and free-flowing solid (3.56 g, 90%). Product was determined to be 97.4% pure by reverse phase analytical chroma-tography (HPLC). ESI-MS: m/z = 601.3 [M+H]+ (consistent with previously described characterization. Compound #18 in Harringtonet al., 2014).
1H-NMR of KIRA8See Supplemental Information.
KIRA8 TreatmentsFemale NOD mice were randomized to KIRA8 or vehicle groups, and injected i.p. with KIRA8 (50 mg/kg) or vehicle (3% ethanol: 7%Tween-80: 90% saline) once a day. 8- or 10-week-old euglycemic NOD mice were used for pre-diabetic studies. Mice that wereeuthanized due to complication attributed to overt diabetes were excluded from the final analysis. In reversal studies, KIRA8 orvehicle treatment immediately commenced at the onset of diabetes and continued for 6 weeks. Blood glucose and body weightwere monitored weekly. Male Ins2+/Akita mice were injected i.p. with KIRA8 or vehicle.
QUANTIFICATION AND STATISTICAL ANALYSIS
All statistical analyses were performed using GraphPad Prism version 6.00. Student’s t test or one-way ANOVA followed by post hocTukey’s test were applied to determine statistical difference between two groups or between more than two groups, respectively,unless otherwise noted. The difference of the percent diabetic mice between the treatment and vehicle group in the reversal studywas estimated using the Kaplan–Meier method, as indicated in the figure legends, and compared using log-rank test betweengroups, setting the endpoint as reversal of diabetes. Use of one-way ANOVA followed by post hoc test for trend and two-wayANOVA to determine statistical significance are indicated in the figure legends. The number of mice were selected based on our pre-vious observations in performing similar assays in the NODmouse model (Louvet et al., 2008; Villalta et al., 2013). Animal number (n)and experimental repeats are indicated in figures and figure legends. Data are presented as mean ± SEM p < 0.05 was consideredsignificant throughout the study. p values: * < 0.05; ** < 0.01; *** < 0.001; N.S., non-significant.
Cell Metabolism 25, 883–897.e1–e8, April 4, 2017 e8
Top Related