


γλώσσες
Σελίδες
Νομικός

Supporting InformationLissa et al. 10.1073/pnas.1318440111SI Materials and MethodsCell Lines and Culture Conditions. All cell lines were routinelymaintained at 37 °C under 5% (vol/vol) CO2, in the appropriatemedium containing 10% (vol/vol) FBS, 100 units/mL penicillinsodium, and 100 μg/mL streptomycin sulfate, 1 mM sodium py-ruvate, and 10 mM Hepes buffer. Human colon carcinomaHCT116 and RKO cells were grown in McCoy’s 5A medium,supplemented with 20 μg/mL blasticidin (Invitrogen), for the cellsstably transfected with a cDNA coding for a histone 2B fused tothe green fluorescent protein (H2B-GFP) from BD PharMingen.Human osteosarcoma (U2OS) cells stably expressing H2B-GFPand murine Lewis lung carcinoma (LLC) cells were cultured inDulbecco’s modified Eagle’s medium (DMEM), supplementedwith blasticidin for U2OS. Mouse embryonic fibroblasts (MEFs)were grown in DMEM supplemented with 1% nonessentialamino acids and 2-mercaptoethanol (80 μM). Culture media andsupplements for cell culture were obtained from Gibco In-vitrogen. Cells were seeded in the appropriate support (6-, 12- or96-well plates; Corning) and allowed to adapt for 24 h beforeexperimental assessments. HCT116 p53−/− cells were a kind giftfrom Bert Volgelstein (Johns Hopkins University, Baltimore).
Generation of Tetraploid Cells. Tetraploid cells were generatedfrom close-to-diploid parental cancer cells or diploid mouseembryonic fibroblasts with 100 nM nocodazole (Sigma-Aldrich),1 μM dihydrocytochalasin B (DCB) (Sigma-Aldrich) or cyto-chalasin D (Sigma-Aldrich) for 48 h. After drug washout, cellswere cultured for 2 wk, followed by cloning of clones charac-terized by an 8n DNA content on a FACSVantage cell sorterfrom BD Biosciences, as previously described (1–4).
Isolation and Culture of Mouse Mammary Gland Epithelial andIntestinal Epithelial Crypt Cells. The isolation of mouse mammarygland epithelial cells (MMECs) was performed on 7-mo-old fe-male Tp53−/− C57BL/6 mice as detailed previously (3). Dissoci-ated cells were then cultured in flasks precoated for 4 h at 37 °Cwith 0.1% (wt/vol in PBS) gelatin. MMECs were grown inDMEM/F12 medium supplemented with 2% FBS, 50 μg/mLgentamycin sulfate, 100 μg/mL insulin, and 5 ng/mL epithelialgrowth factor (EGF). mouse intestinal epithelial crypt cells(MIECs) were isolated from 11-wk-old male C57BL/6 andApcMin/+ mice (Charles River), as previously described (5, 6).
Chemicals. Resveratrol was purchased from Sigma-Aldrich andSelleckchem. Piceatannol, rolipram, aspirin, salicylate, 2-deoxy-glucose, 3-bromopyruvate mevastatin, simvastatin, nocodazole,dihydrocytochalasin B, Checkpoint kinase 1 inhibitor (UCN-01),cisplatin (CDDP), paraquat, rotenone, quercetin, and bafilo-mycin A1 were obtained from Sigma-Aldrich. A-769662, AI-CAR, H89, etodolac, and rofecoxib were purchased fromSelleckchem; MDL-12330A from Enzo Life Sciences; rapamycinand EX-527 from Tocris Bioscience; and the pan-caspase in-hibitor Z-VAD-fmk from Bachem Bioscience.
RNA Interference.Diploid and tetraploid HCT116 cells preseededin 12-well plates were transfected with siRNAs by Oligofectaminetransfection reagent (Invitrogen), according to the manufacturer’sinstructions. The following siRNA, purchased from Sigma-Proligo,were used:
5′-GCCGGUAUGCCGGUUAAGUdTdT-3′ (siUNR),
5′-GACUCCAGUGGUAAUCUACdTdT-3′ (sip53a),
5′-GCCGGUAUGCCGGUUAAGUdTdT-3′ (sip53b),5′-GGUGCCGGAACUGAUCAGAdTdT-3′ (siBax),5′-GCGAAGUCUUUGCCUUCUC dTdT-3′(siBak),5′-GCUGCACCUGACGCCCUUCdTdT-3′ (siBcl-2),5′-GGAGAUGCAGGUAUUGGUGdTdT-3′ (siBcl-xL),5′-GCAUCGAACCAUUAGCAGAdTdT-3′ (siMcl-1),
5′-GGUGAUGGAGAAUAGCAGUdTdT-3′ (siAURKB).
Plasmid Transfection in Human Cell Cultures. Plasmids encodingGFP-LC3 cDNAs (Addgene) and AMP-activated protein kinase(AMPK) alpha1 subunit were obtained from Benoit Viollet(Institut Cochin, Paris) upon material transfer agreement.PcDNA3.1 was used as empty vector control. Transient plasmidcotransfections were performed by means of Lipofectamine LTXreagent (Invitrogen) and cells were analyzed by automated fluo-rescence microscopy 48 h after transfection or harvested for im-munoblotting analyses. GFP positive cells were considered aspositively transfected for each couple of plasmids.
Compound Screen. Diploid and tetraploid HCT116 and U2OScells stably transduced with H2B-GFP, were mixed in a 1:1 ratioand seeded in 96-well black/clear imaging plates (BD Biosciences).To discriminate between diploid and tetraploid cells, only one celltype was stably expressing an H2B-GFP construct. Cells weretreated for 48 h with agents from the Institute of Chemistry andCell Biology (ICCB) Known Bioactives Library (Enzo Life Sci-ences), at final concentrations ranging from 5 to 12 μg/mL. Forty-eight hours after treatment, cells were fixed with 4% para-formaldehyde (PFA, wt/vol in PBS) and nuclei were stained withHoechst 33342 (1 μg/mL in PBS, Molecular Probes; Invitrogen).
Automated Fluorescence Microscopy and Videomicroscopy. Imagesfrom plates processed as above were acquired with a BD Pathway855 automatedmicroscope (BDBiosciences). Four view fields perwell were acquired using a Plan Apo 20× objective (Olympus).Images were segmented and the ratio between the total number ofcells (stained with Hoechst 33342) and H2B-GFP–expressing cellswas determined with Attovision software version 1.7 (BD Bio-sciences). Data were statistically evaluated using Prism GraphPadsoftware version 5 (GraphPad Software). To take into accountinterplate variations, data were normalized by z scoring.For videomicroscopy, diploid and tetraploid HCT116 WT cells
or HCT116 p53−/− cells, stably transduced with H2B-GFP, weregrown in 96-well black/clear imaging plates (BD Biosciences).The recording of the images started at the time of the treatment(t = 0), and pictures were taken every 16 min (Movies S1 and S2)or 20 min (Movies S3–S5) for 41 h and 72 h, respectively. Threeview fields per well were acquired using a 20× objective. Bothtransmitted light and fluorescence imaging were used to detectthe cells. Images were analyzed with the open-source softwareImage J.
Immunofluorescence Microscopy. For detection of apoptoticmarkers, cells were fixed with 4% PFA (wt/vol in PBS), per-meabilized with 0.1% Triton X-100 (in PBS), and immunostainedwith antibodies specific for cytochrome c (1/100; 6H2.B4, BDBiosciences) and cleaved caspase-3 (Asp175) (1/200; 9661, CellSignaling Technology). Revelation was performed with the appro-priate Alexa Fluor conjugated secondary antibodies (Molecular
Lissa et al. www.pnas.org/cgi/content/short/1318440111 1 of 15
Probes; Invitrogen). Hoechst 33342 (1 μg/mL) was used for nuclearcounterstaining. Images were captured with a Primo Star micro-scope (Carl Zeiss) equipped with an AxioCam ERc 5s camera (CarlZeiss) and AxioVision 4.8.2 software. An oil immersion objective(63×) was used.
Quantification of Autophagic Features by Fluorescence Microscopy.For the detection of autophagic markers, diploid and tetra-ploid HCT116 cells were transiently transfected with a plasmidGFP-LC3, by means of Lipofectamine 2000 (Gibco; Invitrogen)following manufacturer’s recommendations. Twenty-four hourslater, cells were treated with 80 μM resveratrol alone or incombination with 10 μM EX-527. Rapamycin (1 μM) was used asa positive control. Bafilomycin A1 (50 nM) was added in eachcondition to detect the accumulation of autophagosomes. After6 h treatment, cells were fixed with 4% PFA and nuclei stainedwith 1 μg/mL Hoechst 33342. The accumulation of autophago-somes (visualized as GFP-LC3 aggregates) was examined byfluorescence microscopy, using an oil immersion objective (63×).
Cytofluorometry. For quantification of apoptotic features, livingcells were costained for 30 min at 37 °C with 20 nM 3,3′dihex-iloxalocarbocyanine iodide (DioC6(3), Molecular Probes; In-vitrogen) or 150 nM tetramethylrhodamine methyl ester (TMRM)(Sigma-Aldrich), which measure the mitochondrial transmembranepotential (Δψm), and 1 μg/mL propidium iodide (PI) (Sigma-Aldrich) or 10 μM 4′,6-diamidino-2-phenylindole (DAPI)(Molecular Probes; Invitrogen), to detect plasma membrane per-meabilization. Annexin V was used to quantify phosphatidylserineexposure according to manufacturer’s protocol (BD Pharmingen).Hoechst 33342 (10 μg/mL) was used to monitor DNA content.For identification of polyploid cells from intestinal crypts, cells
were extracted from the distal 5-cm small intestine. After iso-lation, the cells were fixed in 80% cold ethanol. To discriminateepithelial cells, cells were stained with a pan-cytokeratin antibody(1/100; C2562 Sigma-Aldrich) and counterstainedwith PI (50 μg/mL)according to a previously described protocol (4). The cell cycle
profiles were determined upon cytoketin positive cells. All cyto-fluorometric determinations were conducted with a FACSCalibur,a FACScan (BD Biosciences), or a Gallios cytometer (BeckmanCoulter). First line statistical analyses were performed usingCellQuest software (BD Biosciences) or Kaluza software (Beck-man Coulter). Single viable cells were discriminated from dou-blets upon gating on the events characterized by normal forwardand side scatter (FSC and SSC, respectively).
Immunoblotting.Cells were washed and lysed in Nonidet P-40 lysisbuffer, according to standard procedures. Thirty micrograms ofprotein extracts were then run on NuPAGE Novex Bis-Tris4–12% precast gels (Invitrogen), and electrotransferred to Im-mobilon polyvinyldifluoride (PVDF) membranes (Bio-Rad). Toblock unspecific binding sites, membranes were incubated in5% BSA (wt/vol) (Euromedex) plus 0.05% Tween (Euromedex)in 1× Tris buffered saline (TBS; Euromedex) for 1 h, beforeovernight incubation with appropriate primary antibody. The fol-lowing antibodies were used: phospho-AMPKα (Thr172) (40H9;Cell Signaling Technology), AMPKα (23A3; Cell Signaling Tech-nology), phospho-ACC (Ser79) (Cell Signaling Technology), andACC (Cell Signaling Technology). Anti-β actin mouse monoclonalantibody (ab4900; Abcam) and anti-GAPDH (Millipore ChemiconInternational) were used to monitor equal loading of lanes. Finally,membranes were incubated with the appropriate horseradishperoxidase-labeled secondary antibodies (Southern Biotech As-sociates). Revelation was performed with SuperSignal West Picochemoluminescent substrate (Thermo Scientific Pierce) and theImageQuant LAS 4000 Biomolecular Imager (GE HealthcareLife Sciences).
Statistics.Unless otherwise specified, all experiments were carriedout in duplicate parallel instances and independently repeated atleast two times with multiple diploid and tetraploid clones. Datawere analyzed with Microsoft Excel (Microsoft) and statisticalsignificance was assessed by means of two-tailed unpaired Studentt test (*P < 0.05; **P < 0.01; ***P < 0.001).
1. Castedo M, et al. (2006) Selective resistance of tetraploid cancer cells against DNAdamage-induced apoptosis. Ann N Y Acad Sci 1090:35–49.
2. Castedo M, et al. (2006) Apoptosis regulation in tetraploid cancer cells. EMBO J 25(11):2584–2595.
3. Senovilla L, et al. (2009) p53 represses the polyploidization of primary mammaryepithelial cells by activating apoptosis. Cell Cycle 8(9):1380–1385.
4. Senovilla L, et al. (2012) An immunosurveillance mechanism controls cancer cell ploidy.Science 337(6102):1678–1684.
5. Sato T, et al. (2011) Long-term expansion of epithelial organoids from human colon,adenoma, adenocarcinoma, and Barrett’s epithelium.Gastroenterology 141(5):1762–1772.
6. Sato T, et al. (2009) Single Lgr5 stem cells build crypt-villus structures in vitro withouta mesenchymal niche. Nature 459(7244):262–265.
Lissa et al. www.pnas.org/cgi/content/short/1318440111 2 of 15
A
0.51Te
trapl
oid
cell
ratio
(z-s
core
) +
- 0.51Te
trapl
oid
cell
ratio
(z-s
core
) +
-
Co (Mean + SD)
Resveratrol
HCT 116 (Tetraploid H2B-GFP) HCT 116 (Diploid H2B-GFP) U2OS (Tetraploid H2B-GFP)
- Total cells (z-score) + - Total cells (z-score) + - Total cells (z-score) +0.51Te
trapl
oid
cell
ratio
(z-s
core
) +
-
HitsResveratrol a
W-7 (calmodulin inhibitor) a
17-Allylamino-geldanamycin b
CDC (12-lipoxygenase inhibitor) b
Ro 31-8220 b
Z-Leu3-VS b
Z-VAD-FMK b
a Common to all three screenings.b Common to two out of three screenings.
CBResveratrol CDDPControl
H2B-GFP
10 m
Hoechst 33342UCN-01
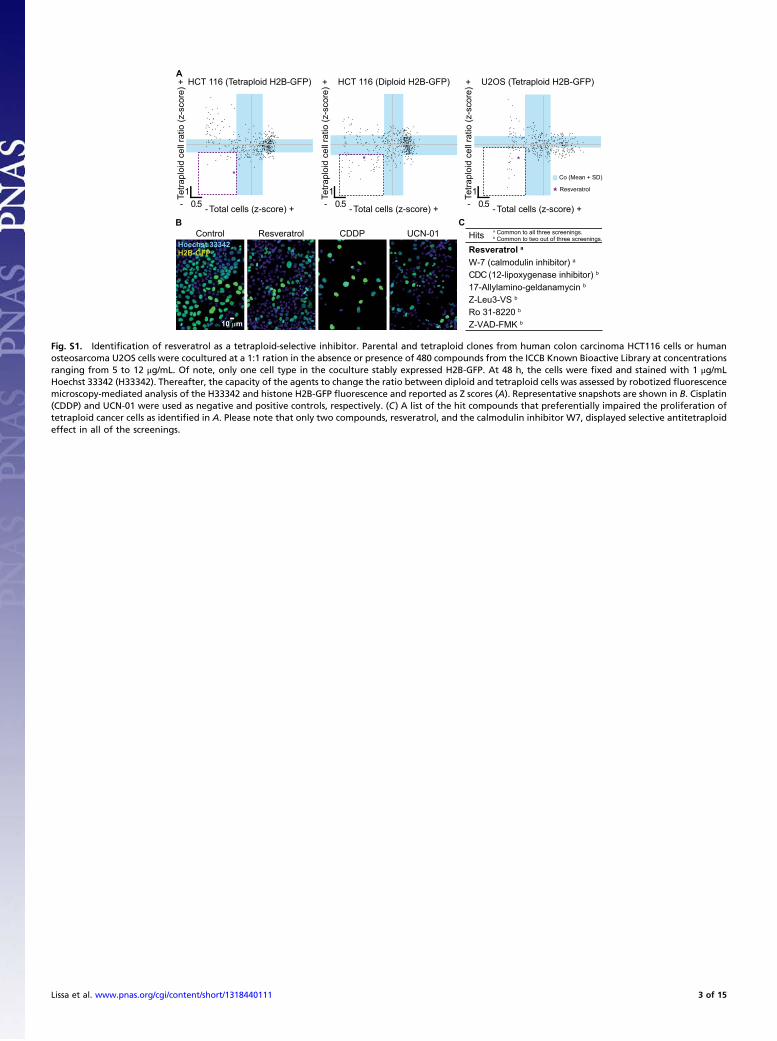
Fig. S1. Identification of resveratrol as a tetraploid-selective inhibitor. Parental and tetraploid clones from human colon carcinoma HCT116 cells or humanosteosarcoma U2OS cells were cocultured at a 1:1 ration in the absence or presence of 480 compounds from the ICCB Known Bioactive Library at concentrationsranging from 5 to 12 μg/mL. Of note, only one cell type in the coculture stably expressed H2B-GFP. At 48 h, the cells were fixed and stained with 1 μg/mLHoechst 33342 (H33342). Thereafter, the capacity of the agents to change the ratio between diploid and tetraploid cells was assessed by robotized fluorescencemicroscopy-mediated analysis of the H33342 and histone H2B-GFP fluorescence and reported as Z scores (A). Representative snapshots are shown in B. Cisplatin(CDDP) and UCN-01 were used as negative and positive controls, respectively. (C) A list of the hit compounds that preferentially impaired the proliferation oftetraploid cancer cells as identified in A. Please note that only two compounds, resveratrol, and the calmodulin inhibitor W7, displayed selective antitetraploideffect in all of the screenings.
Lissa et al. www.pnas.org/cgi/content/short/1318440111 3 of 15
BA
***
**
***
Cel
ls (%
)
Resv ( M): 0 40 80
Cel
ls (%
)**
***
Cel
ls (%
)
LLCDiOC3(6)low PI-
PI+
D T
**
**
Cel
ls (%
)
E
*
**
Cel
ls (%
)
F
*
**
Cel
ls (%
)
0
40
60
80
20
HCT 116Annexin Vhigh PI
PI+
D T
0
40
60
80
20
Resv ( M): 0 10 20
**
RKOTMRMlow DAPI
DAPI+
D T
40
0
40
60
80
20
MEFDiOC3(6)low PI-
PI+
D T
Resv (M): 0 20 400
40
60
80
20
Resv ( M): 0 10 20
0
40
60
80
20
HCT 116DiOC3(6)low PI-
PI+
D T
0 10 20PIC (M):0
40
60
80
20
0 10 20PIC (M):
RKOTMRMlow DAPI
DAPI+
D T
C D
- -
-
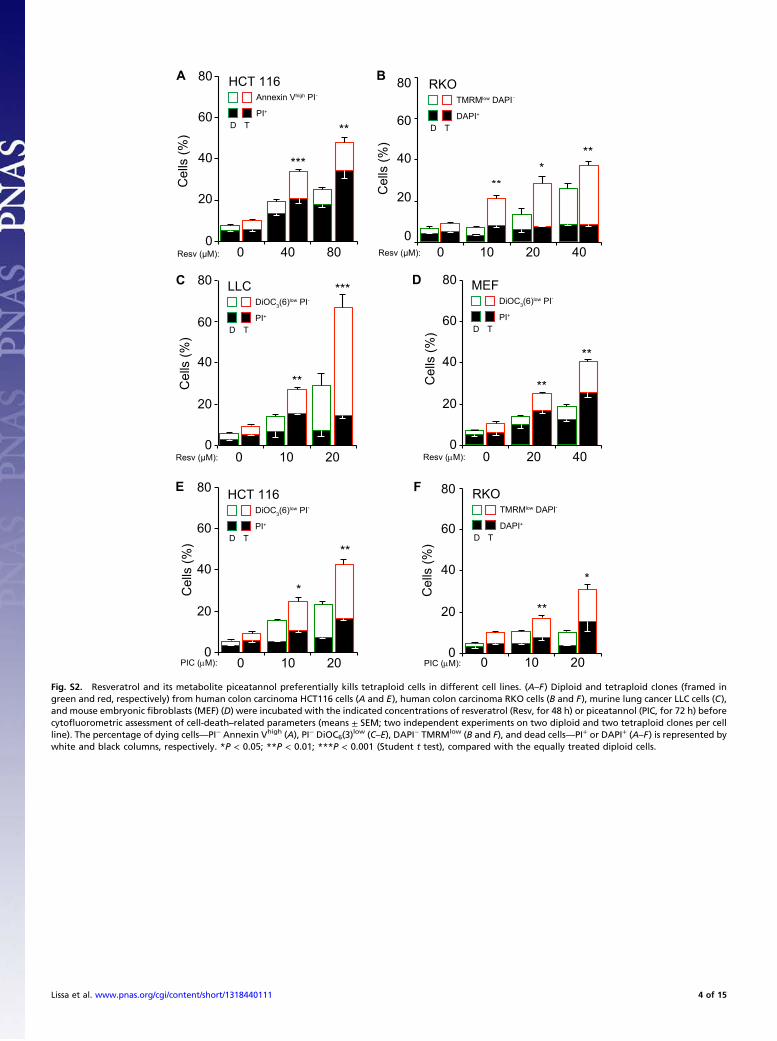
Fig. S2. Resveratrol and its metabolite piceatannol preferentially kills tetraploid cells in different cell lines. (A–F) Diploid and tetraploid clones (framed ingreen and red, respectively) from human colon carcinoma HCT116 cells (A and E), human colon carcinoma RKO cells (B and F), murine lung cancer LLC cells (C),and mouse embryonic fibroblasts (MEF) (D) were incubated with the indicated concentrations of resveratrol (Resv, for 48 h) or piceatannol (PIC, for 72 h) beforecytofluorometric assessment of cell-death–related parameters (means ± SEM; two independent experiments on two diploid and two tetraploid clones per cellline). The percentage of dying cells—PI− Annexin Vhigh (A), PI− DiOC6(3)
low (C–E), DAPI− TMRMlow (B and F), and dead cells—PI+ or DAPI+ (A–F) is represented bywhite and black columns, respectively. *P < 0.05; **P < 0.01; ***P < 0.001 (Student t test), compared with the equally treated diploid cells.
Lissa et al. www.pnas.org/cgi/content/short/1318440111 4 of 15
C D
BA
***
***
***
**
***
***
Cel
ls (%
)CDDP (M):
0
40
60
80
0 15 25
DiOC6(3)low PI-
PI+
D T
20
Cel
ls (%
)
QC (M):0
20
40
60
0 50 100
PI+
D T
DiOC6(3)low PI-
Cel
ls (%
)
PQ (M):0
20
40
60
0 400 800
PI+
D T
DiOC6(3)low PI-
Cel
ls (%
)
ROT (M):0
20
40
60
0 1 2
PI+
D T
DiOC6(3)low PI-
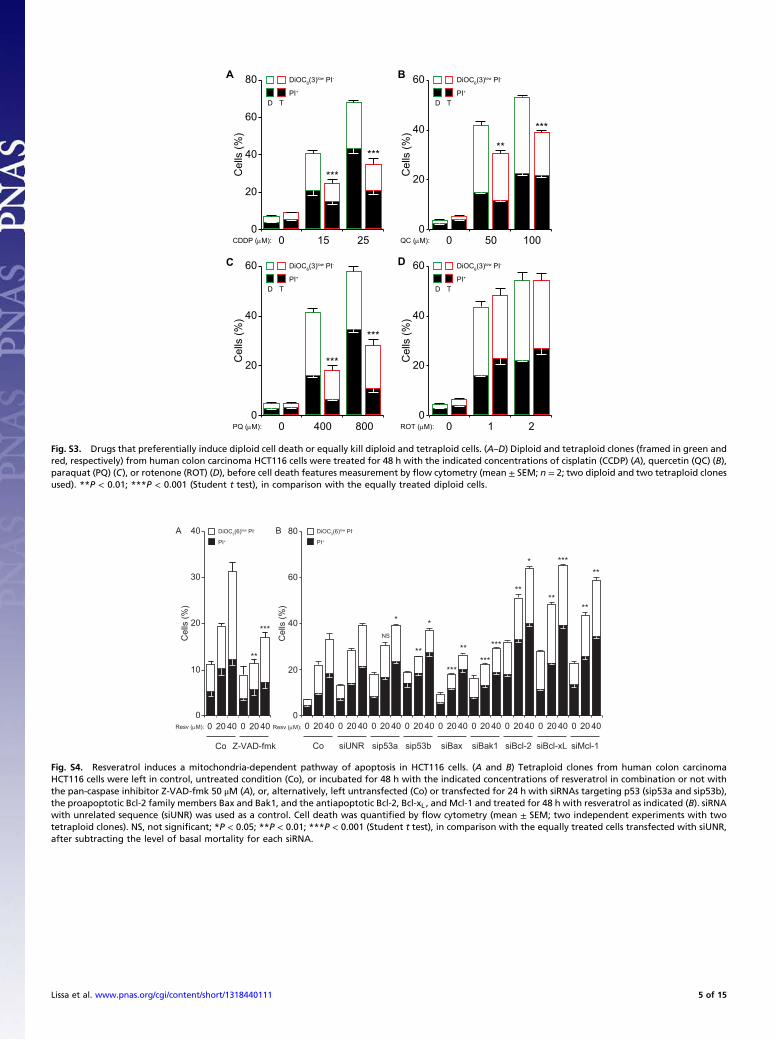
Fig. S3. Drugs that preferentially induce diploid cell death or equally kill diploid and tetraploid cells. (A–D) Diploid and tetraploid clones (framed in green andred, respectively) from human colon carcinoma HCT116 cells were treated for 48 h with the indicated concentrations of cisplatin (CCDP) (A), quercetin (QC) (B),paraquat (PQ) (C), or rotenone (ROT) (D), before cell death features measurement by flow cytometry (mean ± SEM; n = 2; two diploid and two tetraploid clonesused). **P < 0.01; ***P < 0.001 (Student t test), in comparison with the equally treated diploid cells.
A
20 40
Co siUNR sip53a sip53b siBax siBak1 siBcl-2 siBcl-xL siMcl-1
0
20
40
60
80
Cel
ls (%
)
DiOC3(6)low PI-
PI+
Resv (M): 0 20 400 20 400 20 400 20 400 20 400 20 400 20 400 20 400
***
*****
***
**
*
**
***
**
**
NS
*
**
*
**
***
0
10
20
30
40
Cel
ls (%
)
Resv (M): 20 40
Co Z-VAD-fmk
0 20 400
BDiOC3(6)low PI-
PI+
Fig. S4. Resveratrol induces a mitochondria-dependent pathway of apoptosis in HCT116 cells. (A and B) Tetraploid clones from human colon carcinomaHCT116 cells were left in control, untreated condition (Co), or incubated for 48 h with the indicated concentrations of resveratrol in combination or not withthe pan-caspase inhibitor Z-VAD-fmk 50 μM (A), or, alternatively, left untransfected (Co) or transfected for 24 h with siRNAs targeting p53 (sip53a and sip53b),the proapoptotic Bcl-2 family members Bax and Bak1, and the antiapoptotic Bcl-2, Bcl-xL , and Mcl-1 and treated for 48 h with resveratrol as indicated (B). siRNAwith unrelated sequence (siUNR) was used as a control. Cell death was quantified by flow cytometry (mean ± SEM; two independent experiments with twotetraploid clones). NS, not significant; *P < 0.05; **P < 0.01; ***P < 0.001 (Student t test), in comparison with the equally treated cells transfected with siUNR,after subtracting the level of basal mortality for each siRNA.
Lissa et al. www.pnas.org/cgi/content/short/1318440111 5 of 15
apop
tosi
sP
ost-m
itotic
apop
tosi
s
A
B
800’272’ 1360’
H2B-GFP
0’ 480’ 960’
0’
10 m
208’
144’96’ 2160’
1280’ 1744’ 2128’
Con
trol
Res
vera
trol (
40M
)
Cell division Interphase apoptosis Post-mitotic apoptosisInterphase
Inte
rpha
se
**
*
*
Diploid20
15
10
5
0Inte
rpha
se a
popt
osis
(%)
Pos
t-mito
tic a
popt
osis
(%)
Num
ber o
f mito
ses/
50 c
ells
CDiploid Diploid
TetraploidTetraploid Tetraploid
Resv ( M) Resv ( M)Resv ( M)
20
15
10
5
0
160
120
80
40
020 400 20 400 20 400
0' 500' 1000' 1500' 2000' 2500' 0' 500' 1000' 1500' 2000' 2500'
Diploid Tetraploid
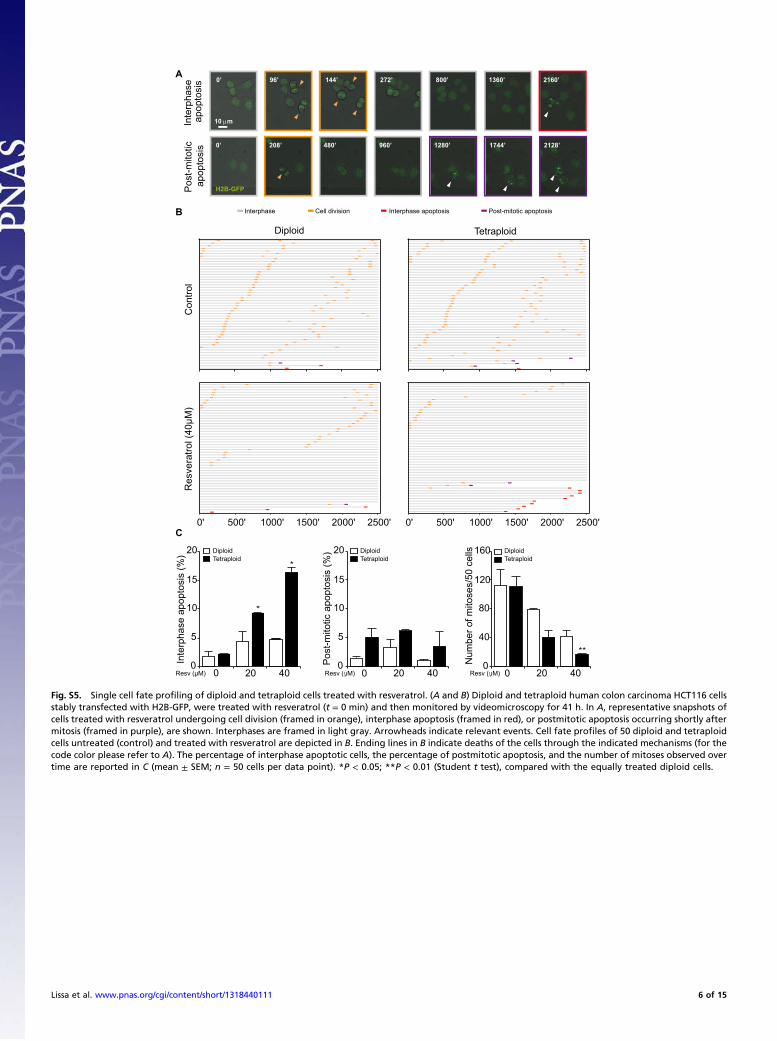
Fig. S5. Single cell fate profiling of diploid and tetraploid cells treated with resveratrol. (A and B) Diploid and tetraploid human colon carcinoma HCT116 cellsstably transfected with H2B-GFP, were treated with resveratrol (t = 0 min) and then monitored by videomicroscopy for 41 h. In A, representative snapshots ofcells treated with resveratrol undergoing cell division (framed in orange), interphase apoptosis (framed in red), or postmitotic apoptosis occurring shortly aftermitosis (framed in purple), are shown. Interphases are framed in light gray. Arrowheads indicate relevant events. Cell fate profiles of 50 diploid and tetraploidcells untreated (control) and treated with resveratrol are depicted in B. Ending lines in B indicate deaths of the cells through the indicated mechanisms (for thecode color please refer to A). The percentage of interphase apoptotic cells, the percentage of postmitotic apoptosis, and the number of mitoses observed overtime are reported in C (mean ± SEM; n = 50 cells per data point). *P < 0.05; **P < 0.01 (Student t test), compared with the equally treated diploid cells.
Lissa et al. www.pnas.org/cgi/content/short/1318440111 6 of 15
0 1 3 6 16 24 48 (h)
TetraploidDiploid
Actin
AMPK
P-AMPK 62 KDa
62 KDa
42 KDa
280 KDa
280 KDaP-ACC
ACC
0 1 3 6 16 24 48
24 48
***
*
Co
Starva
tion Co
Starva
tion
0Starvation (h)0
20
30
40
Cel
ls (%
)
10
DiOC6(3)low PI-
PI+
D T
ActinAMPK
P-AMPK
A
CB
**
Co Aspirin
Co Aspirin
0 6 10Aspirin (mM)0
20
30
40
Cel
ls (%
)
10
DiOC6(3)low PI-
PI+
D T
ActinAMPK
P-AMPK
40 80
**
***
Co2-D
G Co2-D
G
02-DG (mM)0
20
30
40
Cel
ls (%
)
10
DiOC6(3)low PI-
PI+
D T
ActinAMPK
P-AMPK
0
10
20
30
40
50
0 40 80
**
**
Co
3-BrP
yr Co
3-BrP
yr
Cel
ls (%
)
3-BrPyr (μM)
DiOC6(3)low PI-
PI+
D T
ActinAMPK
P-AMPK
ED
F
0 0.25 0.5
***
***
Co
AICAR Co
AICAR
AICAR (mM)0
20
30
40
Cel
ls (%
)
10
DiOC6(3)low PI-
PI+
D T
ActinAMPK
P-AMPK
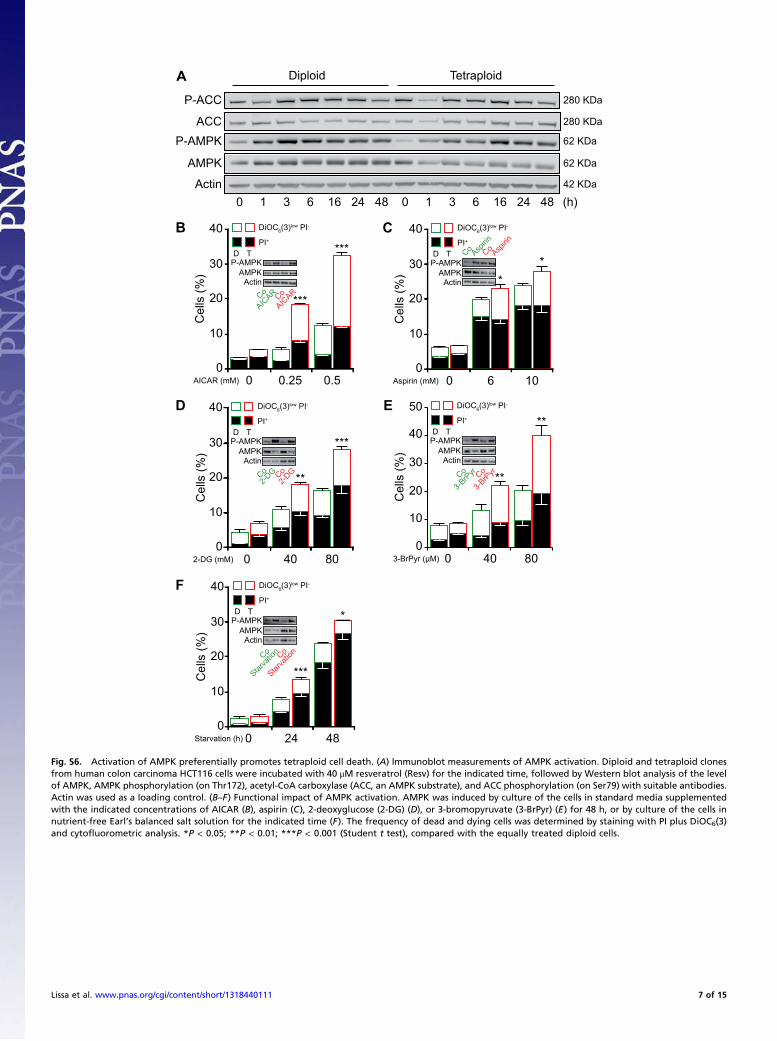
Fig. S6. Activation of AMPK preferentially promotes tetraploid cell death. (A) Immunoblot measurements of AMPK activation. Diploid and tetraploid clonesfrom human colon carcinoma HCT116 cells were incubated with 40 μM resveratrol (Resv) for the indicated time, followed by Western blot analysis of the levelof AMPK, AMPK phosphorylation (on Thr172), acetyl-CoA carboxylase (ACC, an AMPK substrate), and ACC phosphorylation (on Ser79) with suitable antibodies.Actin was used as a loading control. (B–F) Functional impact of AMPK activation. AMPK was induced by culture of the cells in standard media supplementedwith the indicated concentrations of AICAR (B), aspirin (C), 2-deoxyglucose (2-DG) (D), or 3-bromopyruvate (3-BrPyr) (E) for 48 h, or by culture of the cells innutrient-free Earl’s balanced salt solution for the indicated time (F). The frequency of dead and dying cells was determined by staining with PI plus DiOC6(3)and cytofluorometric analysis. *P < 0.05; **P < 0.01; ***P < 0.001 (Student t test), compared with the equally treated diploid cells.
Lissa et al. www.pnas.org/cgi/content/short/1318440111 7 of 15
A
C
B
Res
vera
trol
Con
trol
Rap
amyc
in
EX-527Control
LC3-GFP 10 m
0
10
20
30
40
- + - + - -
******
Resv
Aut
opha
gic
cells
(%)
Rapa - - - - + +EX-527 - - -+ + +
DiploidTetraploid
Cel
ls (%
)
0
10
20
30
40
0 40 80 0 40 80EX-527
Resv (M)
NS
DiOC6(3)low PI-
PI+
D T
Control
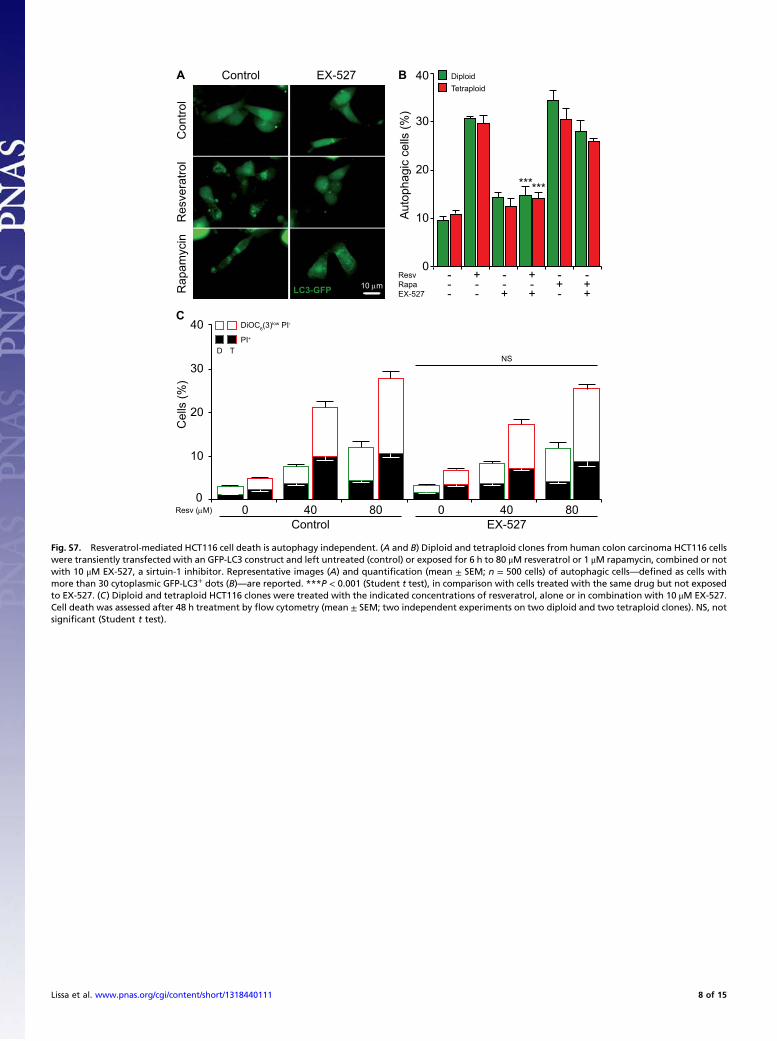
Fig. S7. Resveratrol-mediated HCT116 cell death is autophagy independent. (A and B) Diploid and tetraploid clones from human colon carcinoma HCT116 cellswere transiently transfected with an GFP-LC3 construct and left untreated (control) or exposed for 6 h to 80 μM resveratrol or 1 μM rapamycin, combined or notwith 10 μM EX-527, a sirtuin-1 inhibitor. Representative images (A) and quantification (mean ± SEM; n = 500 cells) of autophagic cells—defined as cells withmore than 30 cytoplasmic GFP-LC3+ dots (B)—are reported. ***P < 0.001 (Student t test), in comparison with cells treated with the same drug but not exposedto EX-527. (C) Diploid and tetraploid HCT116 clones were treated with the indicated concentrations of resveratrol, alone or in combination with 10 μM EX-527.Cell death was assessed after 48 h treatment by flow cytometry (mean ± SEM; two independent experiments on two diploid and two tetraploid clones). NS, notsignificant (Student t test).
Lissa et al. www.pnas.org/cgi/content/short/1318440111 8 of 15
0 0.1 0.2
D
**
**
AICAR (mM) 0 0.5 1
10
20
30
40
Cel
ls (%
)0
A
***
**
B
0
20
40
60
80
100
0 60 120
**
***
Cel
ls (%
)
AICAR (mM)
C
0
10
20
30
40
50
**
*Cel
ls (%
)
AICAR (mM) 0 0.5 1 A-769662 (mM)
10
20
30
40
Cel
ls (%
)0
16 200SAL(mM)0
20
40
60
80
100
Cel
ls (%
)
0
20
40
60
80
100
Cel
ls (%
)
16 200SAL(mM)
***
*
**
**
RKOTMRMlow DAPI
DAPI+
D T
-
LLCDiOC3(6)low PI-
PI+
D T
RKOTMRMlow DAPI
DAPI+
D T
-
MEFDiOC3(6)low PI-
PI+
D T
MEFDiOC3(6)low PI-
PI+
D T
LLCDiOC3(6)low PI-
PI+
D T
FE
0
20
40
60
0 48 72
**
****
***
HG
Cel
ls (%
)
Starvation (h)0
10
20
30
40
50
Cel
ls (%
)
0 48 72Starvation (h)
MEFDiOC3(6)low PI-
PI+
D T
RKOTMRMlow DAPI
DAPI+
D T
-
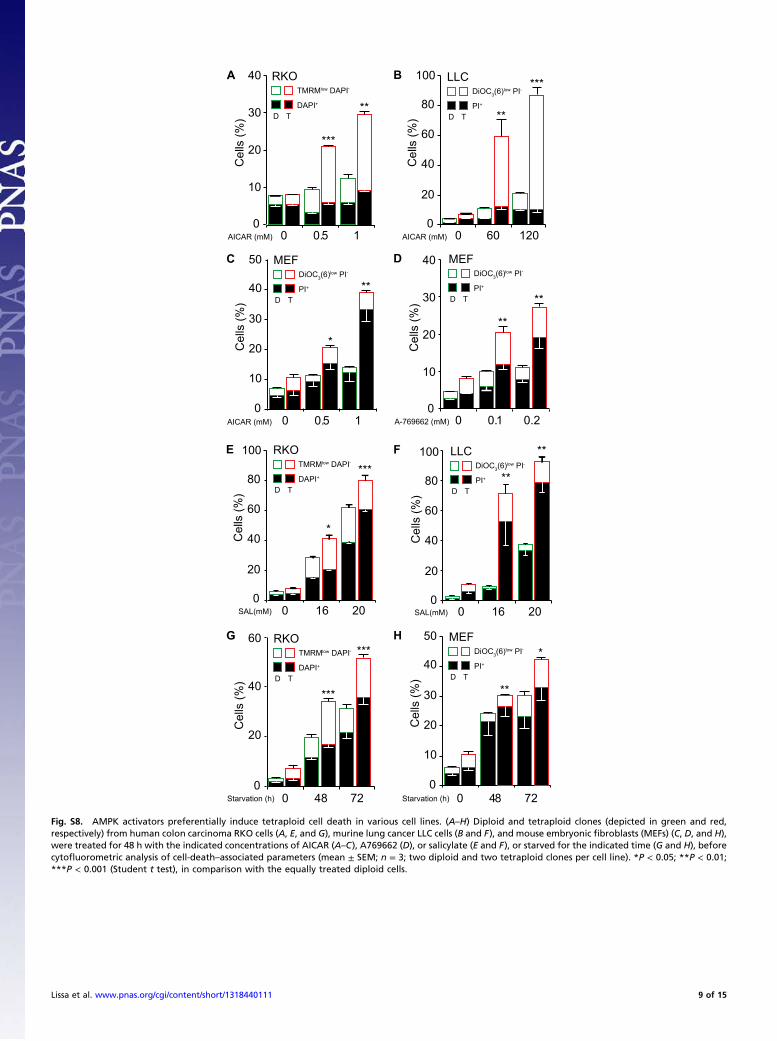
Fig. S8. AMPK activators preferentially induce tetraploid cell death in various cell lines. (A–H) Diploid and tetraploid clones (depicted in green and red,respectively) from human colon carcinoma RKO cells (A, E, and G), murine lung cancer LLC cells (B and F), and mouse embryonic fibroblasts (MEFs) (C, D, and H),were treated for 48 h with the indicated concentrations of AICAR (A–C), A769662 (D), or salicylate (E and F), or starved for the indicated time (G and H), beforecytofluorometric analysis of cell-death–associated parameters (mean ± SEM; n = 3; two diploid and two tetraploid clones per cell line). *P < 0.05; **P < 0.01;***P < 0.001 (Student t test), in comparison with the equally treated diploid cells.
Lissa et al. www.pnas.org/cgi/content/short/1318440111 9 of 15
0
20
40
60 DiOC6(3)low PI-
PI+
Contro
l
Resve
ratrol
Aspirin
Salicy
late
Rolipra
m
Cytochalasin D
Contro
l
Resve
ratrol
Aspirin
Salicy
late
Rolipra
m
Cel
ls (%
)
0
10
20
30
Contro
l
Resve
ratrol
Aspirin
Salicy
late
Rolipra
m
Contro
l
Resve
ratrol
Aspirin
Salicy
late
Rolipra
mAIC
ARAIC
AR
siUNR siAURKB
Cel
ls (%
)
>4N
0
20
40
Contro
l
Resve
ratrol
Aspirin
Salicy
late
Rolipra
m
Contro
l
Resve
ratrol
Aspirin
Salicy
late
Rolipra
mAIC
ARAIC
AR
DiOC6(3)low PI-
PI+
*
* ****
** **** **
**
*** ******
***
***
*********
***
**
* *
Contro
l
Rolipra
m
A7696
62
Aspirin
Salicy
late
2-deo
xyglu
cose
3-brom
opyru
vate
Resve
ratrol
Nocodazole
Contro
l
Rolipra
m
A7696
62
Aspirin
Salicy
late
2-deo
xyglu
cose
3-brom
opyru
vate
Resve
ratrol
0
20
40
60
Cel
ls (%
)
DiOC6(3)low PI-
PI+
0
20
40
60
Cel
ls (%
)
80
Cytochalasin D
Contro
l
Resve
ratrol
Aspirin
Salicy
late
Rolipra
m
Contro
l
Resve
ratrol
Aspirin
Salicy
late
Rolipra
m
>4N
**** ** **
A
B C
60
Cel
ls (%
)
D E
siUNR siAURKB
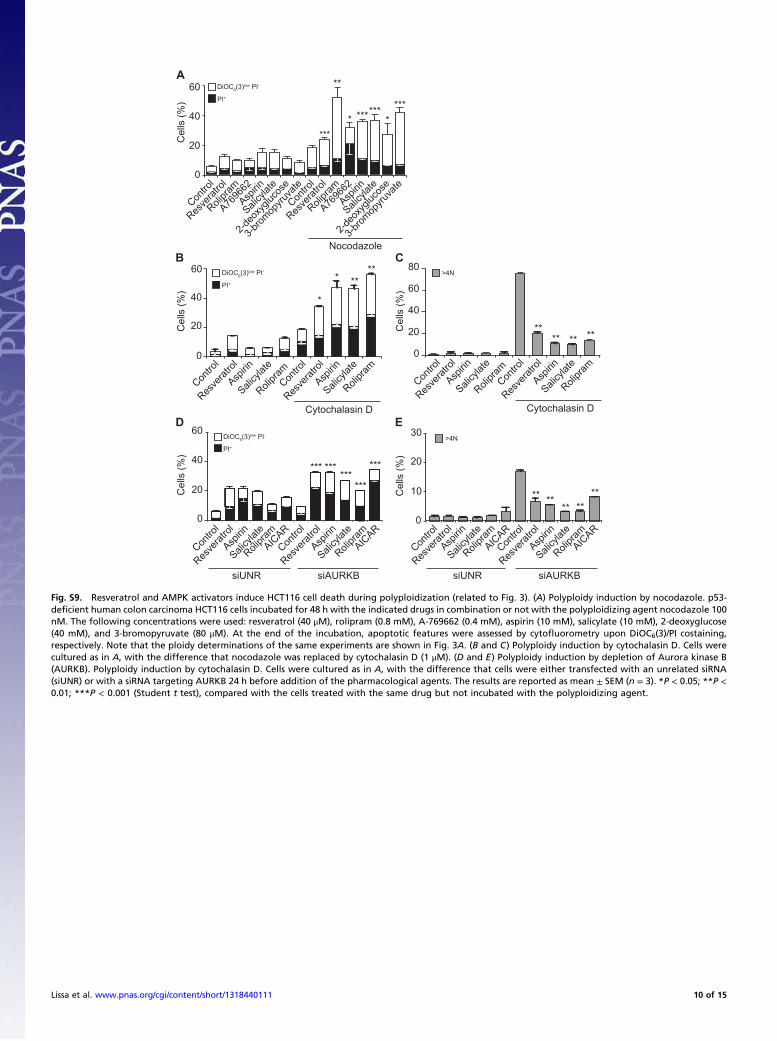
Fig. S9. Resveratrol and AMPK activators induce HCT116 cell death during polyploidization (related to Fig. 3). (A) Polyploidy induction by nocodazole. p53-deficient human colon carcinoma HCT116 cells incubated for 48 h with the indicated drugs in combination or not with the polyploidizing agent nocodazole 100nM. The following concentrations were used: resveratrol (40 μM), rolipram (0.8 mM), A-769662 (0.4 mM), aspirin (10 mM), salicylate (10 mM), 2-deoxyglucose(40 mM), and 3-bromopyruvate (80 μM). At the end of the incubation, apoptotic features were assessed by cytofluorometry upon DiOC6(3)/PI costaining,respectively. Note that the ploidy determinations of the same experiments are shown in Fig. 3A. (B and C) Polyploidy induction by cytochalasin D. Cells werecultured as in A, with the difference that nocodazole was replaced by cytochalasin D (1 μM). (D and E) Polyploidy induction by depletion of Aurora kinase B(AURKB). Polyploidy induction by cytochalasin D. Cells were cultured as in A, with the difference that cells were either transfected with an unrelated siRNA(siUNR) or with a siRNA targeting AURKB 24 h before addition of the pharmacological agents. The results are reported as mean ± SEM (n = 3). *P < 0.05; **P <0.01; ***P < 0.001 (Student t test), compared with the cells treated with the same drug but not incubated with the polyploidizing agent.
Lissa et al. www.pnas.org/cgi/content/short/1318440111 10 of 15
0102030405060708090
100
25 50 25Etodolac Rofecoxib
500
Cel
ls (%
)
(μM)
HCT116DiOC3(6)low PI-
PI+
D T
25 50 25Etodolac Rofecoxib
500(μM)
RKODiOC3(6)low PI-
PI+
D T
Cel
ls (%
)
0
10
20
30
40
50
60
70
0 5 10Mevastatin
***
***
Cel
ls (%
)
B
A
DiOC6(3)low PI
PI+
D T
***
**
0
10
20
30
40
50
60
70
Cel
ls (%
)
0 5 10Simvastatin
DiOC6(3)low PI-
PI+
D T
0102030405060708090
100
(μM)
(μM)
D
C
-
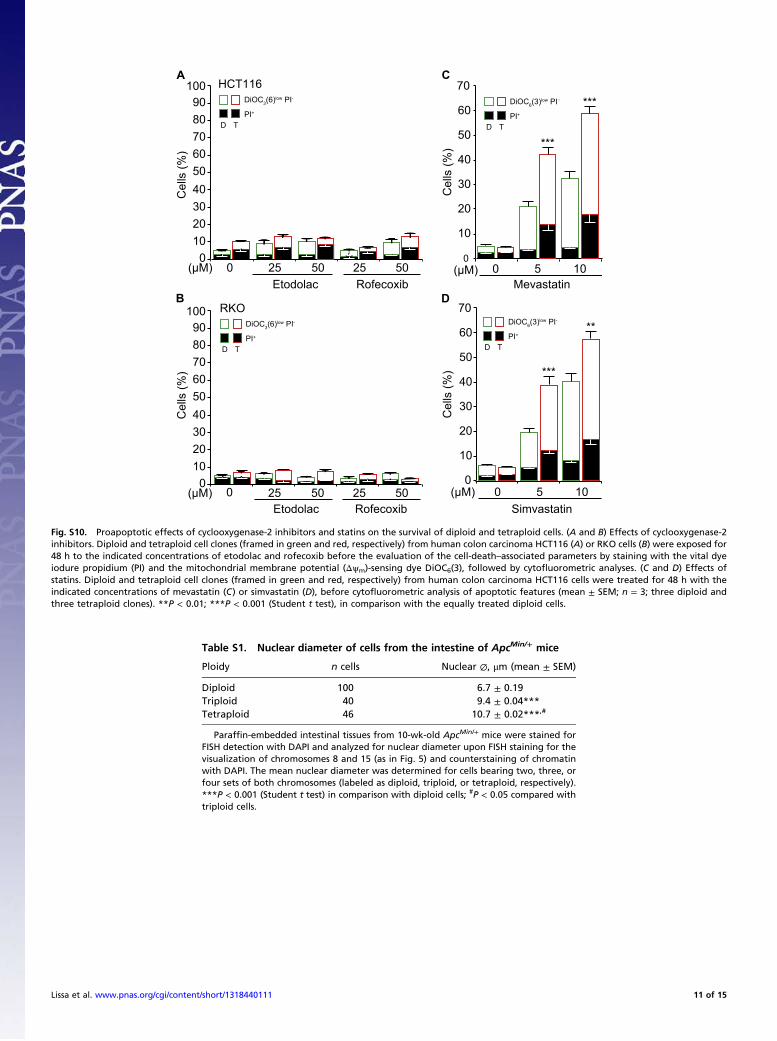
Fig. S10. Proapoptotic effects of cyclooxygenase-2 inhibitors and statins on the survival of diploid and tetraploid cells. (A and B) Effects of cyclooxygenase-2inhibitors. Diploid and tetraploid cell clones (framed in green and red, respectively) from human colon carcinoma HCT116 (A) or RKO cells (B) were exposed for48 h to the indicated concentrations of etodolac and rofecoxib before the evaluation of the cell-death–associated parameters by staining with the vital dyeiodure propidium (PI) and the mitochondrial membrane potential (Δψm)-sensing dye DiOC6(3), followed by cytofluorometric analyses. (C and D) Effects ofstatins. Diploid and tetraploid cell clones (framed in green and red, respectively) from human colon carcinoma HCT116 cells were treated for 48 h with theindicated concentrations of mevastatin (C) or simvastatin (D), before cytofluorometric analysis of apoptotic features (mean ± SEM; n = 3; three diploid andthree tetraploid clones). **P < 0.01; ***P < 0.001 (Student t test), in comparison with the equally treated diploid cells.
Table S1. Nuclear diameter of cells from the intestine of ApcMin/+ mice
Ploidy n cells Nuclear ∅, μm (mean ± SEM)
Diploid 100 6.7 ± 0.19Triploid 40 9.4 ± 0.04***Tetraploid 46 10.7 ± 0.02***,#
Paraffin-embedded intestinal tissues from 10-wk-old ApcMin/+ mice were stained forFISH detection with DAPI and analyzed for nuclear diameter upon FISH staining for thevisualization of chromosomes 8 and 15 (as in Fig. 5) and counterstaining of chromatinwith DAPI. The mean nuclear diameter was determined for cells bearing two, three, orfour sets of both chromosomes (labeled as diploid, triploid, or tetraploid, respectively).***P < 0.001 (Student t test) in comparison with diploid cells; #P < 0.05 compared withtriploid cells.
Lissa et al. www.pnas.org/cgi/content/short/1318440111 11 of 15
Movie S1. Interphase apoptosis of HCT116 tetraploid cells treated with resveratrol. Human colon carcinoma HCT116 tetraploid cells, stably expressing H2B-GFP, were treated with 40 μM resveratrol for 41 h.
Movie S1
Lissa et al. www.pnas.org/cgi/content/short/1318440111 12 of 15
Movie S2. Postmitotic apoptosis of HCT116 tetraploid cells treated with resveratrol. Human colon carcinoma HCT116 tetraploid cells, stably expressing H2B-GFP, were treated with 40 μM resveratrol for 41 h.
Movie S2
Lissa et al. www.pnas.org/cgi/content/short/1318440111 13 of 15
Movie S3. Polyploidization of p53−/− HCT116 cells treated with nocodazole. Human colon carcinoma p53−/− HCT116 cells, stably expressing H2B-GFP, weretreated with nocodazole for 72 h.
Movie S3
Movie S4. Interphase apoptosis of p53−/− HCT116 cells treated with nocodazole and resveratrol. Human colon carcinoma p53−/− HCT116 cells, stably ex-pressing H2B-GFP, were treated with nocodazole in combination with 40 μM resveratrol for 72 h.
Movie S4
Lissa et al. www.pnas.org/cgi/content/short/1318440111 14 of 15
Movie S5. Mitotic apoptosis of p53−/− HCT116 cells treated with nocodazole and resveratrol. Human colon carcinoma p53−/− HCT116 cells, stably expressingH2B-GFP, were treated with nocodazole in combination with 40 μM resveratrol for 72 h.
Movie S5
Lissa et al. www.pnas.org/cgi/content/short/1318440111 15 of 15
Top Related