


γλώσσες
Σελίδες
Νομικός

CrystEngComm
PAPER
Cite this: CrystEngComm, 2016, 18,
4720
Received 12th March 2016,Accepted 9th May 2016
DOI: 10.1039/c6ce00573j
www.rsc.org/crystengcomm
Structural- and optical-properties analysis ofsingle crystalline hematite (α-Fe2O3) nanocubesprepared by one-pot hydrothermal approach
Nur Maisarah Abdul Rashid,a Choonyian Haw,a Weesiong Chiu,*a
Noor Hamizah Khanis,a Aliff Rohaizad,a PoiSim Khiewb and Saadah Abdul Rahman*a
High quality single crystal hematite (α-Fe2O3) nanocubes with average dimensions of 40 nm were success-
fully synthesized by a facile one-pot hydrothermal method. Systematic analyses were performed to investi-
gate the morphological-, structural- and optical-properties of the as-synthesized α-Fe2O3 nanocubes.
Continuous formation and hourly monitoring towards proper arrangement of single crystal α-Fe2O3 nano-
cubes was observed throughout the hydrothermal heating process of 180 °C from 4 h to 12 h. The proba-
ble growth mechanism on the formation of cubic nanostructures is also proposed. Electron micrographs
show the cubic α-Fe2O3 synthesized at the most optimum 8 h hydrothermal heating duration are indeed
produced in high-yield with a well-defined cubical shape. The typical rhombohedral structure of cubic
α-Fe2O3 was evident from the XRD pattern. The SAED pattern indicates that the α-Fe2O3 nanocubes are
single-crystalline in nature, with lattice-fringes and a d-spacing value of 3.6 Å. The optical characterization
reveals that α-Fe2O3 nanocubes show strong visible-light absorption with a band gap energy of ∼2.1 eV
while the photoluminescence emission spectra depicts a mono-peak centered at ∼590 nm. Both the SAED
pattern and UV-vis spectra show a strong correlation with the standard α-Fe2O3. The as-synthesized
α-Fe2O3 single crystal is of high quality that potentially could be used as a visible-light active nanomaterial
in renewable energy device applications.
1.0 Introduction
Rational design and synthesis of metal oxide nanocrystalswith tunable shape and properties have attracted enormousresearch interest for their unique size and shape-dependentintrinsic physicochemical properties. In particular, metal ox-ide semiconductor nanocrystals have been identified as im-portant materials with potential applications in a wide rangeof fields (optical, electrical, magnetic, catalytic, chemical,etc.).1–5 Hematite (α-Fe2O3) is among one of the most interest-ing n-type metal oxide semiconductors with an opticalbandgap of 2.1 eV.6,7 Due to its prevalence, hardness,chemical- and thermal-stability, and environmentally benig-nity, it has become an attractive material in a spectrum ofsemiconducting applications. In addition, its ability to absorblight makes it a particularly attractive material for use in solarenergy conversion.8,9 α-Fe2O3 is isostructural with corundum,
Al2O3, which is trigonal (hexagonal scalenohedral, symbol 3̄2/m) with space group R3̄c and lattice parameters a = 5.0356 Å,c = 13.7489 Å, having Fe3+ ions occupy 2/3 of its octahedralsites that are confined by the nearly ideal hexagonal closed-pack O lattice.10 The dense hexagonal close packing of oxygencombined with the interstitially positioned iron yields a verydense structure (5.26 g cm−3) exhibiting a high polarizabilityand high refractive index (3.15).11 Attributed to its layeredstructure also generates complex behaviour when interactingwith photons and electrons, it is of interest among re-searchers to exploit α-Fe2O3 nanocrystals in numerous prom-ising applications, such as gas sensors,12 catalysts/photo-catalysts,13 electrode materials in lithium secondarybatteries,14 magnetic recording media,15 photo-assistedelectrolysis of water,16 and optical and electromagnetic de-vices as well as environmental remediation in wastewatertreatment.17–19
It is noted that the morphology and size of α-Fe2O3 have agreat impact on its intrinsic physicochemical properties andthus determine its application.20 Therefore, much effort hasbeen made in the design of α-Fe2O3 materials with a desiredstructure and morphology such as zero-dimensional (0D)nanoparticles,21 one-dimensional (1D) nanowires,22 nano-belts,23 nanorods,24 nanotubes,25 two-dimensional (2D)
4720 | CrystEngComm, 2016, 18, 4720–4732 This journal is © The Royal Society of Chemistry 2016
a Low Dimensional Materials Research Centre, Department of Physics, University
of Malaya, 50603 Kuala Lumpur, Malaysia. E-mail: [email protected],
[email protected] of Chemical Engineering, Faculty of Engineering, University of
Nottingham Malaysia Campus, Jalan Broga, 43500 Semenyih, Selangor Darul
Ehsan, Malaysia
CrystEngComm, 2016, 18, 4720–4732 | 4721This journal is © The Royal Society of Chemistry 2016
nanorings,26 nanoflakes,27 three-dimensional (3D) nano-cubes,28 urchin-like nanostructures,29 nanoflowers,30 and etc.In particular, well-defined single crystalline α-Fe2O3 nano-cubes exposing specific facets are demonstrated to be ex-tremely notable due to the highly reactive surfaces and excel-lent electron mobility.31–33 In terms of crystallinity nature, asingle crystalline α-Fe2O3 has a continuous crystal lattice forits entire nanostructure. The crystal lattice arrangement isendless until the edge of the atomic arrays, with no grainboundaries observed. Such a continuous atomic array indeedrenders several advantages especially the aspect of its congru-ent electronic properties. For instance, the absence of grainboundaries in the crystal structure are found to be able to ac-celerate the movement of electric charges in a circuit espe-cially in solar cells and PEC cells.34 Additionally, single crys-tallinity also allows a longer lifetime of electron–hole pairswhich could enhance the efficiency in the aforementionedapplications.35 As in the case of gas sensor application, a sin-gle crystalline α-Fe2O3 nanostructure is found to be able to re-duce instability problems associated with grain coalescenceand drift in electrical properties,36 which alternatively im-prove its sensitivity and stability. Therefore, it is worth notingthat the advantageous characteristics can be harnessedthrough such a structure that would enhance and diversifyits performance.
To date, a myriad of chemical and physical methods havebeen developed for the synthesis of single crystalline α-Fe2O3
nanocubes. These methods include a sonochemical route,37
thermal decomposition of inorganic precursors,38 forced hy-drolysis,39 electrospinning,40 and a hydrothermal approach.41
Compared with other fabrication techniques, hydrothermalsynthesis is considered as the most robust method and hasattracted a rapidly increasing interest for the preparation ofsingle crystalline α-Fe2O3 nanocubes due to several merits:the products have a high purity and excellent crystallinity,morphologies can be easily tuned, a relatively low reactiontemperature and readily available for scale-up production.For example, Pu and co-workers have successfully synthesizedα-Fe2O3 nanocubes by a templating method, in which theyemployed the cationic capping agent/surfactant cetyltrimethylammonium bromide (CTAB) and showed that con-centration variation of the precursor could lead to differentsizes and shapes of α-Fe2O3. In this study, the rod-likeβ-FeOOH precursors were firstly obtained by varying FeCl3concentration ranging from 0.01 to 0.05 M at 120 °C, andthen the precursors aggregated into raft-like particles andthereby transformed to α-Fe2O3 cubic particles.5 Mitra et al.have reported the controlled synthesis of α-Fe2O3 microcubicparticles by pH-controlled hydrolysis of Fe(NO3)3·9H2O withthe use of ethylenediamine as the basic ligand to facilitatethe formation of cubic samples,42 whereas Su et al. used am-monium acetate in FeCl3·6H2O aqueous solution as the cap-ping agent to produce α-Fe2O3 at 160 °C for 24 h.43 In addi-tion to this, Ma and colleagues synthesized single-crystalα-Fe2O3 nanocubes by the use of diethylene glycol (DEG) at200 °C for 10 h in Li ion battery applications.44 Very recently,
Patra and his group used a proportional amount of sodiumsalicylate and NaOH/water to prepare single crystallineα-Fe2O3 nanocubic particles via a hydrothermal route for 36h at 423 K and investigated the facet-dependent photoredoxcatalytic activity.45 However, most of the aforementioned syn-thetic routes tend to involve the use of organic surfactants,which means a much more complicated process includingcomplete template removal at elevated temperature isneeded. Furthermore, solvents used are either potentiallyhazardous or a rather complicated protocol is involved, andsome synthesis methods are often time-consuming (>24 h).It is therefore necessary to investigate further the growth ofsingle crystalline α-Fe2O3 nanocubes and conveniently sortthe particle size and desired morphology through a facile,simple, economic, and straightforward strategy in a hydro-thermal method.
In the experiment reported herein, driven by the demandfor one pot facile hydrothermal synthesis of single crystallineα-Fe2O3 nanocubes with well-defined morphology and scruti-nizing its size- and morphology-dependent properties, weemployed the chloride-based cation Fe3+ that was reactedwith the oleate functional group in the presence ofoleylamine (OAm). In the present work, it is noteworthy that:(i) the current synthetic method is very simple and straight-forward. The synthetic scheme involved only a one-step pro-cess that does not require high temperature or high pressure.(ii) It is particularly interesting to highlight that only the re-action time was varied in the range of 4 h to 12 h at a con-stant temperature, in contrast to other typical hydrothermalsynthesis of 24 h or a few days. The morphological evolutionof the nanostructures and their corresponding growth pro-cesses were able to be elucidated. Thereafter, detailed discus-sion based on the insightful analysis of the shape and struc-ture was also presented. (iii) We report on the shape- andsize-selective synthesis of single crystalline α-Fe2O3 nano-cubes with good reproducibility without the use of additionalcapping agents or surfactants. Instead, we have used a mix-ture of solvents with OAm as one of the key elements to de-termine the final shape of single crystalline α-Fe2O3
nanocubes.46
Previously, many experimental and theoretical studies pri-marily focused on the size and morphology of the α-Fe2O3
nanostructures.47–49 Since α-Fe2O3 is well-known for its vari-ous applications. Hence, one of the most important aims ofthis paper was to present a study of the time-dependent mor-phological evolution of α-Fe2O3 and its transformation from0D to 3D (cubic shape). Finally, the high quality singlecrystalline α-Fe2O3 nanocubes are characterized by using vari-ous analytical tools to investigate the structural- and optical-properties of α-Fe2O3 nanocubes in a much more detailedmanner. The as-obtained information is compared with thatof commercial α-Fe2O3 nanoparticles to show the novelty ofthe as-synthesized product. In addition, the possible transfor-mation mechanism of the α-Fe2O3 through a “1D → 3D”mode was also proposed in the following sections. Thedetailed crystallographic-, structural- and optical-properties of
CrystEngComm Paper
4722 | CrystEngComm, 2016, 18, 4720–4732 This journal is © The Royal Society of Chemistry 2016
the as-prepared α-Fe2O3 nanocubes presented are of funda-mental importance to comprehend the shape and growth ofsingle crystallinity of α-Fe2O3 nanocubes and thus provide di-rect correlation between the shape and exposed facet-controlled properties to its applications in a future study.
2.0 Experimental
All the chemicals used in the experiments were of analyticalgrade and no further purification was required. Potassiumoleate (C18H33KO2, Sigma Aldrich, ≥87%), ferric chloridehexahydrate (FeCl3·6H2O, Merck), Oleylamine (C18H35NH2,Sigma Aldrich, 70%) and absolute ethanol (C2H5OH, HmbGChemicals) were obtained. In this study, all the chemical re-actions were carried out in deionized water.
2.1 Synthesis of α-Fe2O3 nanocubes
Hematite (α-Fe2O3) cubic nanocrystals were synthesized usinga hydrothermal method. This experimental method of synthe-sis was carried out at different durations and the sampleswere collected every 2 h. The remaining factors were keptconstant while synthesizing the nanocrystals. Typically, amixture consisting of 3.33 mmol of potassium oleate wasdissolved in 5.34 mL ethanol with the addition of 1 mLoleylamine (OAm). Subsequently, the mixture was transferredinto a Teflon-lined stainless steel autoclave that has beenpre-loaded with 10.67 mL deionized water and 1.11 mmol ofFeCl3·6H2O aqueous solution. The resultant reagents werestirred continuously at room temperature for 2 hours until areddish solution was formed. Then, the autoclave was sealedand hydrothermally treated at 180 °C for different heatingtimes (4 h, 6 h, 8 h, 10 h and 12 h). After the finite inductionperiod, the autoclave was left to cool down naturally. Theresulting dark red precipitate was collected by centrifugationand washed several times with ethanol. Finally, this synthe-sized material was dried in an oven at 55 °C for 24 h.
2.2 Characterizations
The size, shape, morphology, chemical composition, struc-tural features and optical properties of the nanocrystals wereinvestigated by using different analytical characterizationtechniques. We systematically observed the time-dependentmorphological transformation of α-Fe2O3 nanocrystal struc-ture via TEM images and SAED patterns with a JEOL JEM-2100F instrument operated at 200 kV. In order to observe theyield of α-Fe2O3 nanocubes in large quantities, a field-emission scanning electron microscope (FESEM, HitachiSU8000 with the operation voltage of 2 kV) was employed. In-formation relating to the elemental mapping and elementalcomposition was studied by using energy dispersive X-rayanalysis (EDXA, Oxford Instrument). The bulk-crystallinityand phase identification of the samples were characterizedby X-ray powder diffractometer (XRD, PANalytical EMPY-REAN, 40 kV/35 mA with Cu Kα irradiation at λ = 1.5406 Å).The scanning process covered an angular range from 10° to
80° with a scanning rate of 0.02° per minute. In addition, astudy of phonon vibration mode was conducted by means ofa Renishaw inVia Raman Microscope equipped with a LeicaDMLM microscope (objective lens of 50× (UV)). A 514 nmHeCd laser source was subjected onto the samples for 30 s at50 mW of laser power. The spectra were collected within therange of 150 to 800 cm−1 by subjecting the samples to thebeam source at room temperature. The X-ray photoelectronspectroscopy (XPS) measurement was performed by usingsynchrotron radiation from photoemission spectroscopy(PES) beamline no. 3.2a at the Synchrotron Light Research In-stitute, Thailand in order to further study the chemical ele-ments and bonding of the single crystalline α-Fe2O3 nano-cubes. The PES system was employed with a Thermo VGScientific CLAM2 electron spectrometer and functioned inthe conditions of maximum photon energy of 600 eV with akinetic energy step of 1 eV for a wide scan and 0.1 eV for anarrow scan. Optical absorption spectra were analyzed by anultra violet-near infrared spectrophotometer (UV-vis-NIR,Perkin Elmer Lambda 950). The photoluminescence (PL)spectra were obtained by using Ar+ laser as the excitationsource operated at a wavelength of 325 nm.
3.0 Results and discussion
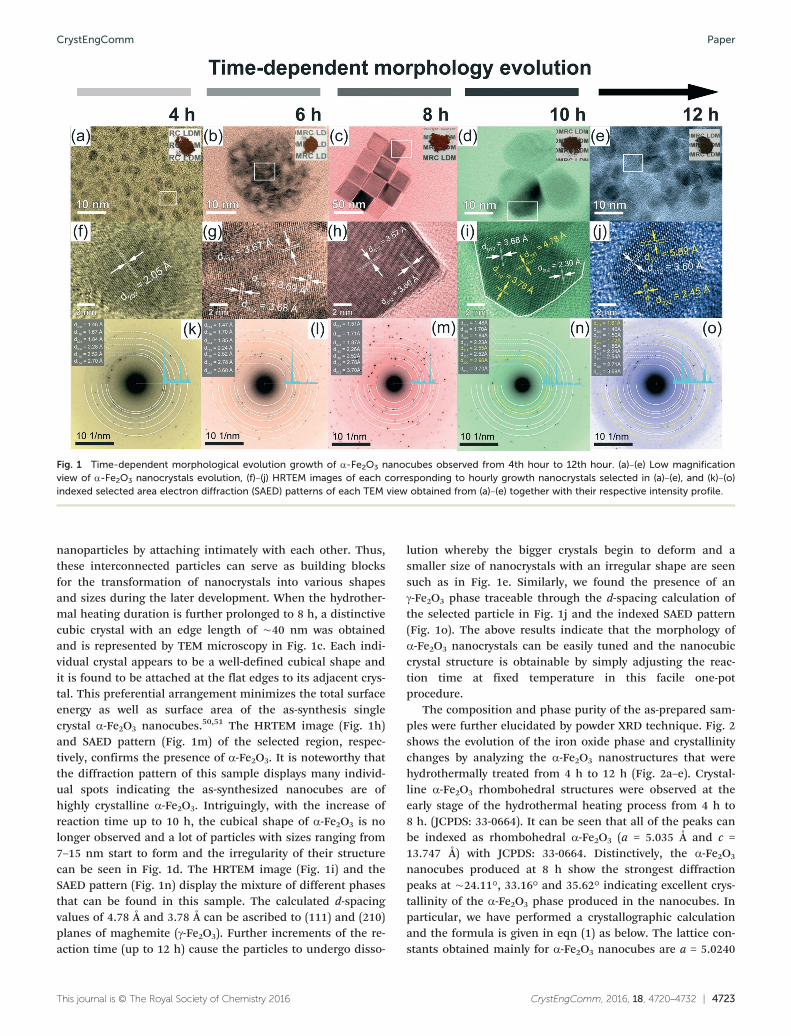
To acquire insight into the details of morphological evolu-tionary growth events and the formation of single crystallineα-Fe2O3 nanocubes, we have performed a time-dependent ob-servation of the crystal growth in FeCl3 solution under hydro-thermal conditions at 180 °C. We have withdrawn samplesfrom the reaction solution at various intervals (4 h, 6 h, 8 h,10 h, and 12 h). A series of TEM images of the as-preparedsamples are presented in Fig. 1a–e. Continuous formation to-wards the proper arrangement of α-Fe2O3 nanocubes from0-D quantum dots to 3-D cubic shapes was observed through-out the heating process starting from the 4th hour until the8th hour at a constant temperature of 180 °C. At the 4thhour, it was clear that a large number of quantum dots witha particle size ranging from 2 to 5 nm were synthesized(Fig. 1a). Many tiny spots with a clear contrast difference ineach spherical particle were acquired. A closer inspection of aselected particle reveals that the interplanar distance of 2.05Å belongs to the (202) plane of α-Fe2O3 as depicted in Fig. 1f.The corresponding selected area electron diffraction (SAED)ring patterns together with the intensity profile (Fig. 1k) ofthe spherical α-Fe2O3 particle also reveal a set of diffractionspots of (104), (110), (006), (024), (116) and (300) planes. Asthe SAED pattern can provide the internal crystal informationof the whole particle, it can thus be concluded that the quan-tum dots are of α-Fe2O3 primary particles while no detectableamounts of impurity were produced. After 6 h, these individ-ual particles started to undergo coalescence and spontane-ously aggregated into a larger size of particle to form a clus-ter. The corresponding d-spacing values of (012) planesobtained from different individual particles (Fig. 1g) revealthat the cluster is indeed composed of α-Fe2O3 primary
CrystEngCommPaper
CrystEngComm, 2016, 18, 4720–4732 | 4723This journal is © The Royal Society of Chemistry 2016
nanoparticles by attaching intimately with each other. Thus,these interconnected particles can serve as building blocksfor the transformation of nanocrystals into various shapesand sizes during the later development. When the hydrother-mal heating duration is further prolonged to 8 h, a distinctivecubic crystal with an edge length of ∼40 nm was obtainedand is represented by TEM microscopy in Fig. 1c. Each indi-vidual crystal appears to be a well-defined cubical shape andit is found to be attached at the flat edges to its adjacent crys-tal. This preferential arrangement minimizes the total surfaceenergy as well as surface area of the as-synthesis singlecrystal α-Fe2O3 nanocubes.50,51 The HRTEM image (Fig. 1h)and SAED pattern (Fig. 1m) of the selected region, respec-tively, confirms the presence of α-Fe2O3. It is noteworthy thatthe diffraction pattern of this sample displays many individ-ual spots indicating the as-synthesized nanocubes are ofhighly crystalline α-Fe2O3. Intriguingly, with the increase ofreaction time up to 10 h, the cubical shape of α-Fe2O3 is nolonger observed and a lot of particles with sizes ranging from7–15 nm start to form and the irregularity of their structurecan be seen in Fig. 1d. The HRTEM image (Fig. 1i) and theSAED pattern (Fig. 1n) display the mixture of different phasesthat can be found in this sample. The calculated d-spacingvalues of 4.78 Å and 3.78 Å can be ascribed to (111) and (210)planes of maghemite (γ-Fe2O3). Further increments of the re-action time (up to 12 h) cause the particles to undergo disso-
lution whereby the bigger crystals begin to deform and asmaller size of nanocrystals with an irregular shape are seensuch as in Fig. 1e. Similarly, we found the presence of anγ-Fe2O3 phase traceable through the d-spacing calculation ofthe selected particle in Fig. 1j and the indexed SAED pattern(Fig. 1o). The above results indicate that the morphology ofα-Fe2O3 nanocrystals can be easily tuned and the nanocubiccrystal structure is obtainable by simply adjusting the reac-tion time at fixed temperature in this facile one-potprocedure.
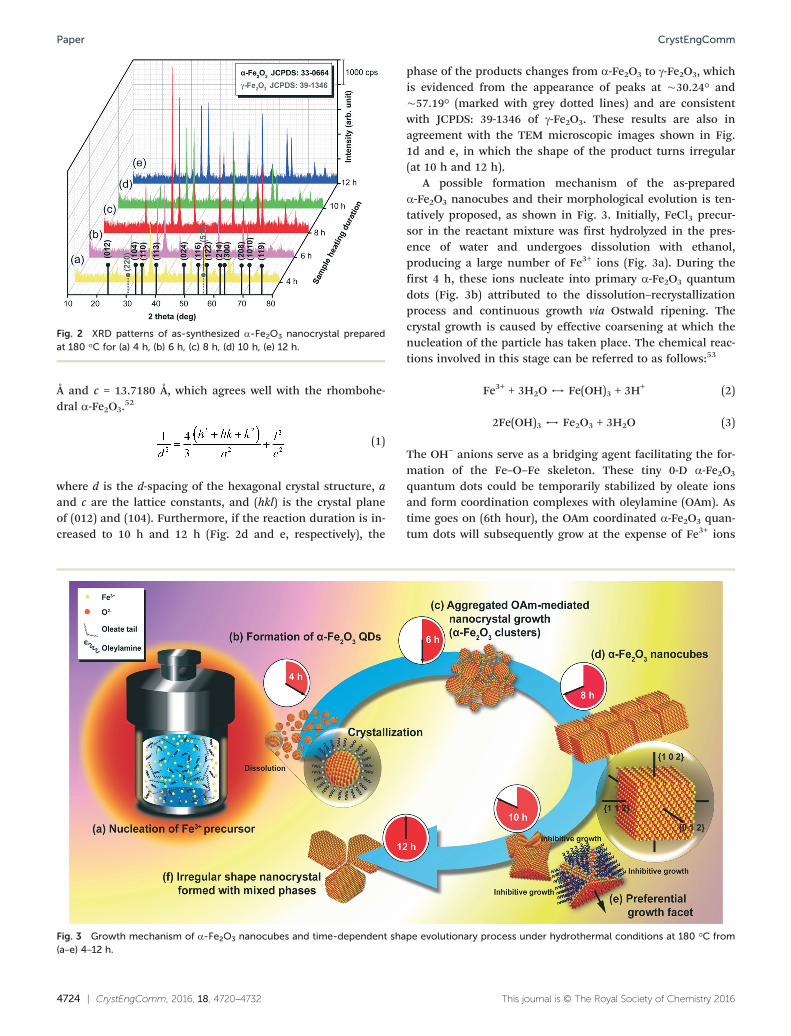
The composition and phase purity of the as-prepared sam-ples were further elucidated by powder XRD technique. Fig. 2shows the evolution of the iron oxide phase and crystallinitychanges by analyzing the α-Fe2O3 nanostructures that werehydrothermally treated from 4 h to 12 h (Fig. 2a–e). Crystal-line α-Fe2O3 rhombohedral structures were observed at theearly stage of the hydrothermal heating process from 4 h to8 h. (JCPDS: 33-0664). It can be seen that all of the peaks canbe indexed as rhombohedral α-Fe2O3 (a = 5.035 Å and c =13.747 Å) with JCPDS: 33-0664. Distinctively, the α-Fe2O3
nanocubes produced at 8 h show the strongest diffractionpeaks at ∼24.11°, 33.16° and 35.62° indicating excellent crys-tallinity of the α-Fe2O3 phase produced in the nanocubes. Inparticular, we have performed a crystallographic calculationand the formula is given in eqn (1) as below. The lattice con-stants obtained mainly for α-Fe2O3 nanocubes are a = 5.0240
Fig. 1 Time-dependent morphological evolution growth of α-Fe2O3 nanocubes observed from 4th hour to 12th hour. (a)–(e) Low magnificationview of α-Fe2O3 nanocrystals evolution, (f)–(j) HRTEM images of each corresponding to hourly growth nanocrystals selected in (a)–(e), and (k)–(o)indexed selected area electron diffraction (SAED) patterns of each TEM view obtained from (a)–(e) together with their respective intensity profile.
CrystEngComm Paper
4724 | CrystEngComm, 2016, 18, 4720–4732 This journal is © The Royal Society of Chemistry 2016
Å and c = 13.7180 Å, which agrees well with the rhombohe-dral α-Fe2O3.
52
(1)
where d is the d-spacing of the hexagonal crystal structure, aand c are the lattice constants, and (hkl) is the crystal planeof (012) and (104). Furthermore, if the reaction duration is in-creased to 10 h and 12 h (Fig. 2d and e, respectively), the
phase of the products changes from α-Fe2O3 to γ-Fe2O3, whichis evidenced from the appearance of peaks at ∼30.24° and∼57.19° (marked with grey dotted lines) and are consistentwith JCPDS: 39-1346 of γ-Fe2O3. These results are also inagreement with the TEM microscopic images shown in Fig.1d and e, in which the shape of the product turns irregular(at 10 h and 12 h).
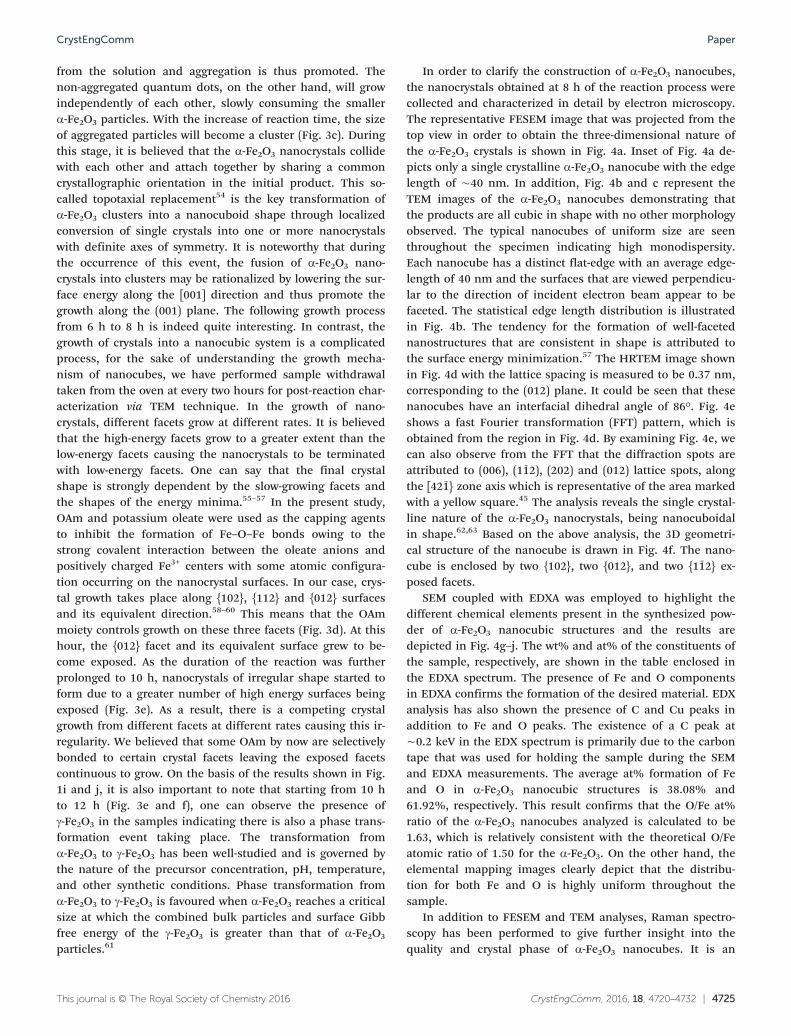
A possible formation mechanism of the as-preparedα-Fe2O3 nanocubes and their morphological evolution is ten-tatively proposed, as shown in Fig. 3. Initially, FeCl3 precur-sor in the reactant mixture was first hydrolyzed in the pres-ence of water and undergoes dissolution with ethanol,producing a large number of Fe3+ ions (Fig. 3a). During thefirst 4 h, these ions nucleate into primary α-Fe2O3 quantumdots (Fig. 3b) attributed to the dissolution–recrystallizationprocess and continuous growth via Ostwald ripening. Thecrystal growth is caused by effective coarsening at which thenucleation of the particle has taken place. The chemical reac-tions involved in this stage can be referred to as follows:53
Fe3+ + 3H2O ↔ Fe(OH)3 + 3H+ (2)
2Fe(OH)3 ↔ Fe2O3 + 3H2O (3)
The OH− anions serve as a bridging agent facilitating the for-mation of the Fe–O–Fe skeleton. These tiny 0-D α-Fe2O3
quantum dots could be temporarily stabilized by oleate ionsand form coordination complexes with oleylamine (OAm). Astime goes on (6th hour), the OAm coordinated α-Fe2O3 quan-tum dots will subsequently grow at the expense of Fe3+ ions
Fig. 2 XRD patterns of as-synthesized α-Fe2O3 nanocrystal preparedat 180 °C for (a) 4 h, (b) 6 h, (c) 8 h, (d) 10 h, (e) 12 h.
Fig. 3 Growth mechanism of α-Fe2O3 nanocubes and time-dependent shape evolutionary process under hydrothermal conditions at 180 °C from(a–e) 4–12 h.
CrystEngCommPaper
CrystEngComm, 2016, 18, 4720–4732 | 4725This journal is © The Royal Society of Chemistry 2016
from the solution and aggregation is thus promoted. Thenon-aggregated quantum dots, on the other hand, will growindependently of each other, slowly consuming the smallerα-Fe2O3 particles. With the increase of reaction time, the sizeof aggregated particles will become a cluster (Fig. 3c). Duringthis stage, it is believed that the α-Fe2O3 nanocrystals collidewith each other and attach together by sharing a commoncrystallographic orientation in the initial product. This so-called topotaxial replacement54 is the key transformation ofα-Fe2O3 clusters into a nanocuboid shape through localizedconversion of single crystals into one or more nanocrystalswith definite axes of symmetry. It is noteworthy that duringthe occurrence of this event, the fusion of α-Fe2O3 nano-crystals into clusters may be rationalized by lowering the sur-face energy along the [001] direction and thus promote thegrowth along the (001) plane. The following growth processfrom 6 h to 8 h is indeed quite interesting. In contrast, thegrowth of crystals into a nanocubic system is a complicatedprocess, for the sake of understanding the growth mecha-nism of nanocubes, we have performed sample withdrawaltaken from the oven at every two hours for post-reaction char-acterization via TEM technique. In the growth of nano-crystals, different facets grow at different rates. It is believedthat the high-energy facets grow to a greater extent than thelow-energy facets causing the nanocrystals to be terminatedwith low-energy facets. One can say that the final crystalshape is strongly dependent by the slow-growing facets andthe shapes of the energy minima.55–57 In the present study,OAm and potassium oleate were used as the capping agentsto inhibit the formation of Fe–O–Fe bonds owing to thestrong covalent interaction between the oleate anions andpositively charged Fe3+ centers with some atomic configura-tion occurring on the nanocrystal surfaces. In our case, crys-tal growth takes place along {102}, {112} and {012} surfacesand its equivalent direction.58–60 This means that the OAmmoiety controls growth on these three facets (Fig. 3d). At thishour, the {012} facet and its equivalent surface grew to be-come exposed. As the duration of the reaction was furtherprolonged to 10 h, nanocrystals of irregular shape started toform due to a greater number of high energy surfaces beingexposed (Fig. 3e). As a result, there is a competing crystalgrowth from different facets at different rates causing this ir-regularity. We believed that some OAm by now are selectivelybonded to certain crystal facets leaving the exposed facetscontinuous to grow. On the basis of the results shown in Fig.1i and j, it is also important to note that starting from 10 hto 12 h (Fig. 3e and f), one can observe the presence ofγ-Fe2O3 in the samples indicating there is also a phase trans-formation event taking place. The transformation fromα-Fe2O3 to γ-Fe2O3 has been well-studied and is governed bythe nature of the precursor concentration, pH, temperature,and other synthetic conditions. Phase transformation fromα-Fe2O3 to γ-Fe2O3 is favoured when α-Fe2O3 reaches a criticalsize at which the combined bulk particles and surface Gibbfree energy of the γ-Fe2O3 is greater than that of α-Fe2O3
particles.61
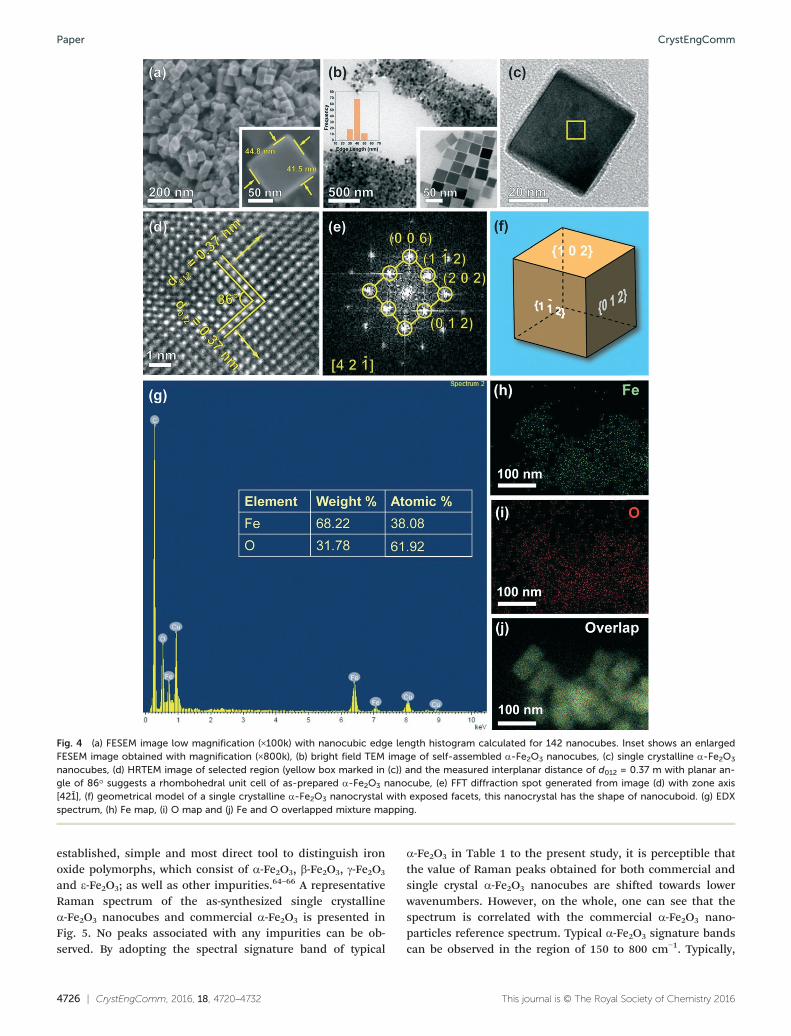
In order to clarify the construction of α-Fe2O3 nanocubes,the nanocrystals obtained at 8 h of the reaction process werecollected and characterized in detail by electron microscopy.The representative FESEM image that was projected from thetop view in order to obtain the three-dimensional nature ofthe α-Fe2O3 crystals is shown in Fig. 4a. Inset of Fig. 4a de-picts only a single crystalline α-Fe2O3 nanocube with the edgelength of ∼40 nm. In addition, Fig. 4b and c represent theTEM images of the α-Fe2O3 nanocubes demonstrating thatthe products are all cubic in shape with no other morphologyobserved. The typical nanocubes of uniform size are seenthroughout the specimen indicating high monodispersity.Each nanocube has a distinct flat-edge with an average edge-length of 40 nm and the surfaces that are viewed perpendicu-lar to the direction of incident electron beam appear to befaceted. The statistical edge length distribution is illustratedin Fig. 4b. The tendency for the formation of well-facetednanostructures that are consistent in shape is attributed tothe surface energy minimization.57 The HRTEM image shownin Fig. 4d with the lattice spacing is measured to be 0.37 nm,corresponding to the (012) plane. It could be seen that thesenanocubes have an interfacial dihedral angle of 86°. Fig. 4eshows a fast Fourier transformation (FFT) pattern, which isobtained from the region in Fig. 4d. By examining Fig. 4e, wecan also observe from the FFT that the diffraction spots areattributed to (006), (11̄2), (202) and (012) lattice spots, alongthe [421̄} zone axis which is representative of the area markedwith a yellow square.45 The analysis reveals the single crystal-line nature of the α-Fe2O3 nanocrystals, being nanocuboidalin shape.62,63 Based on the above analysis, the 3D geometri-cal structure of the nanocube is drawn in Fig. 4f. The nano-cube is enclosed by two {102}, two {012}, and two {11̄2} ex-posed facets.
SEM coupled with EDXA was employed to highlight thedifferent chemical elements present in the synthesized pow-der of α-Fe2O3 nanocubic structures and the results aredepicted in Fig. 4g–j. The wt% and at% of the constituents ofthe sample, respectively, are shown in the table enclosed inthe EDXA spectrum. The presence of Fe and O componentsin EDXA confirms the formation of the desired material. EDXanalysis has also shown the presence of C and Cu peaks inaddition to Fe and O peaks. The existence of a C peak at∼0.2 keV in the EDX spectrum is primarily due to the carbontape that was used for holding the sample during the SEMand EDXA measurements. The average at% formation of Feand O in α-Fe2O3 nanocubic structures is 38.08% and61.92%, respectively. This result confirms that the O/Fe at%ratio of the α-Fe2O3 nanocubes analyzed is calculated to be1.63, which is relatively consistent with the theoretical O/Featomic ratio of 1.50 for the α-Fe2O3. On the other hand, theelemental mapping images clearly depict that the distribu-tion for both Fe and O is highly uniform throughout thesample.
In addition to FESEM and TEM analyses, Raman spectro-scopy has been performed to give further insight into thequality and crystal phase of α-Fe2O3 nanocubes. It is an
CrystEngComm Paper
4726 | CrystEngComm, 2016, 18, 4720–4732 This journal is © The Royal Society of Chemistry 2016
established, simple and most direct tool to distinguish ironoxide polymorphs, which consist of α-Fe2O3, β-Fe2O3, γ-Fe2O3
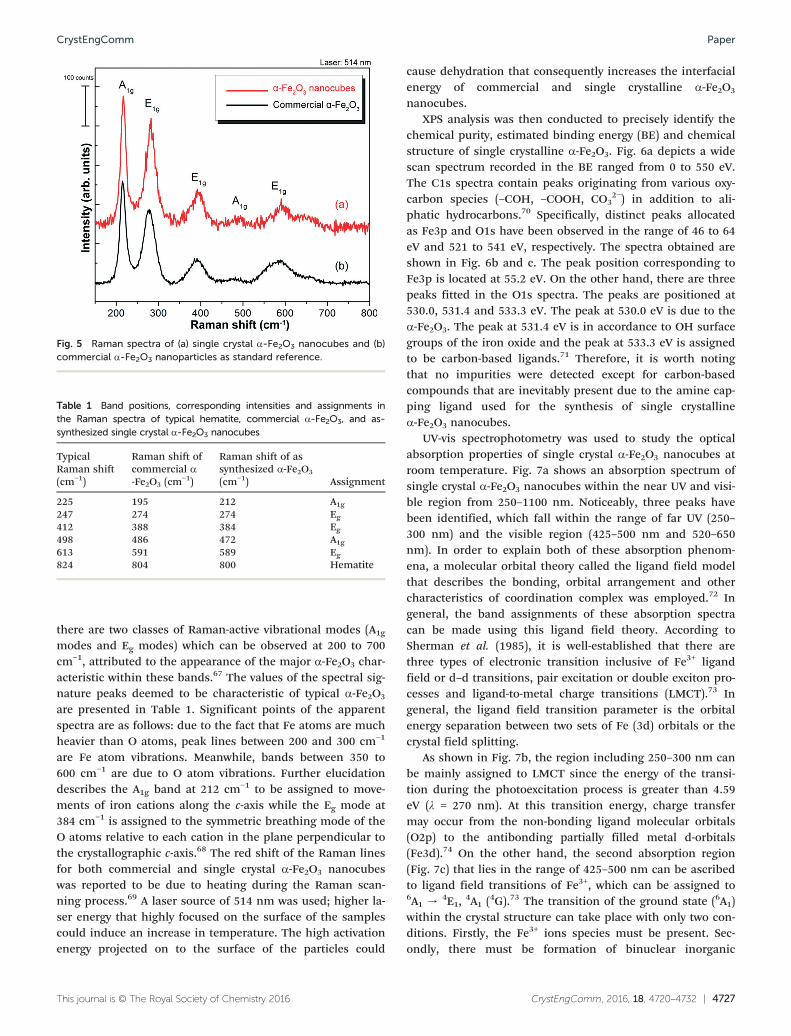
and ε-Fe2O3; as well as other impurities.64–66 A representativeRaman spectrum of the as-synthesized single crystallineα-Fe2O3 nanocubes and commercial α-Fe2O3 is presented inFig. 5. No peaks associated with any impurities can be ob-served. By adopting the spectral signature band of typical
α-Fe2O3 in Table 1 to the present study, it is perceptible thatthe value of Raman peaks obtained for both commercial andsingle crystal α-Fe2O3 nanocubes are shifted towards lowerwavenumbers. However, on the whole, one can see that thespectrum is correlated with the commercial α-Fe2O3 nano-particles reference spectrum. Typical α-Fe2O3 signature bandscan be observed in the region of 150 to 800 cm−1. Typically,
Fig. 4 (a) FESEM image low magnification (×100k) with nanocubic edge length histogram calculated for 142 nanocubes. Inset shows an enlargedFESEM image obtained with magnification (×800k), (b) bright field TEM image of self-assembled α-Fe2O3 nanocubes, (c) single crystalline α-Fe2O3
nanocubes, (d) HRTEM image of selected region (yellow box marked in (c)) and the measured interplanar distance of d012 = 0.37 m with planar an-gle of 86° suggests a rhombohedral unit cell of as-prepared α-Fe2O3 nanocube, (e) FFT diffraction spot generated from image (d) with zone axis[421̄], (f) geometrical model of a single crystalline α-Fe2O3 nanocrystal with exposed facets, this nanocrystal has the shape of nanocuboid. (g) EDXspectrum, (h) Fe map, (i) O map and (j) Fe and O overlapped mixture mapping.
CrystEngCommPaper
CrystEngComm, 2016, 18, 4720–4732 | 4727This journal is © The Royal Society of Chemistry 2016
there are two classes of Raman-active vibrational modes (A1g
modes and Eg modes) which can be observed at 200 to 700cm−1, attributed to the appearance of the major α-Fe2O3 char-acteristic within these bands.67 The values of the spectral sig-nature peaks deemed to be characteristic of typical α-Fe2O3
are presented in Table 1. Significant points of the apparentspectra are as follows: due to the fact that Fe atoms are muchheavier than O atoms, peak lines between 200 and 300 cm−1
are Fe atom vibrations. Meanwhile, bands between 350 to600 cm−1 are due to O atom vibrations. Further elucidationdescribes the A1g band at 212 cm−1 to be assigned to move-ments of iron cations along the c-axis while the Eg mode at384 cm−1 is assigned to the symmetric breathing mode of theO atoms relative to each cation in the plane perpendicular tothe crystallographic c-axis.68 The red shift of the Raman linesfor both commercial and single crystal α-Fe2O3 nanocubeswas reported to be due to heating during the Raman scan-ning process.69 A laser source of 514 nm was used; higher la-ser energy that highly focused on the surface of the samplescould induce an increase in temperature. The high activationenergy projected on to the surface of the particles could
cause dehydration that consequently increases the interfacialenergy of commercial and single crystalline α-Fe2O3
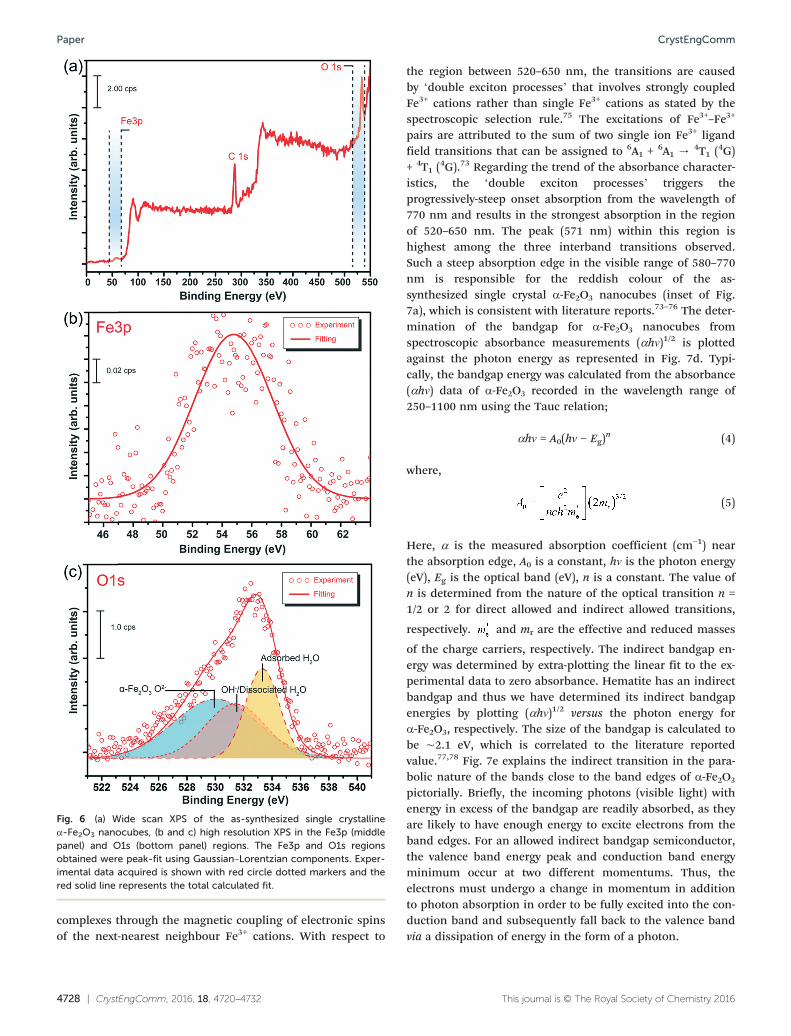
nanocubes.XPS analysis was then conducted to precisely identify the
chemical purity, estimated binding energy (BE) and chemicalstructure of single crystalline α-Fe2O3. Fig. 6a depicts a widescan spectrum recorded in the BE ranged from 0 to 550 eV.The C1s spectra contain peaks originating from various oxy-carbon species (–COH, –COOH, CO3
2−) in addition to ali-phatic hydrocarbons.70 Specifically, distinct peaks allocatedas Fe3p and O1s have been observed in the range of 46 to 64eV and 521 to 541 eV, respectively. The spectra obtained areshown in Fig. 6b and c. The peak position corresponding toFe3p is located at 55.2 eV. On the other hand, there are threepeaks fitted in the O1s spectra. The peaks are positioned at530.0, 531.4 and 533.3 eV. The peak at 530.0 eV is due to theα-Fe2O3. The peak at 531.4 eV is in accordance to OH surfacegroups of the iron oxide and the peak at 533.3 eV is assignedto be carbon-based ligands.71 Therefore, it is worth notingthat no impurities were detected except for carbon-basedcompounds that are inevitably present due to the amine cap-ping ligand used for the synthesis of single crystallineα-Fe2O3 nanocubes.
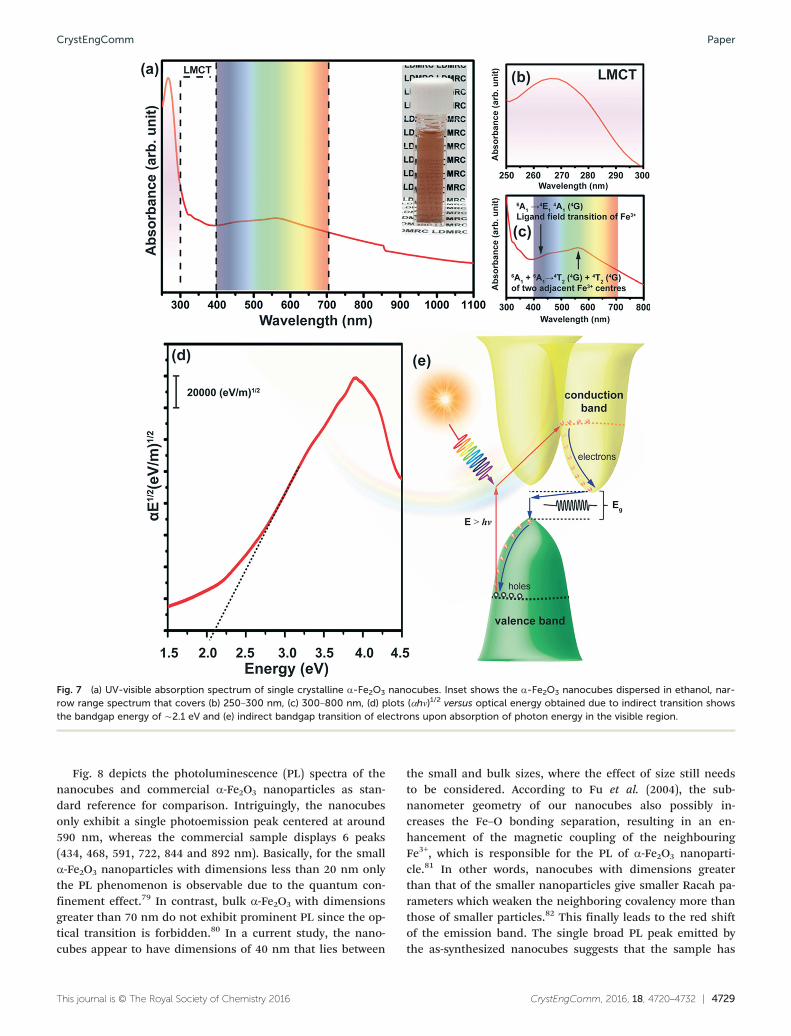
UV-vis spectrophotometry was used to study the opticalabsorption properties of single crystal α-Fe2O3 nanocubes atroom temperature. Fig. 7a shows an absorption spectrum ofsingle crystal α-Fe2O3 nanocubes within the near UV and visi-ble region from 250–1100 nm. Noticeably, three peaks havebeen identified, which fall within the range of far UV (250–300 nm) and the visible region (425–500 nm and 520–650nm). In order to explain both of these absorption phenom-ena, a molecular orbital theory called the ligand field modelthat describes the bonding, orbital arrangement and othercharacteristics of coordination complex was employed.72 Ingeneral, the band assignments of these absorption spectracan be made using this ligand field theory. According toSherman et al. (1985), it is well-established that there arethree types of electronic transition inclusive of Fe3+ ligandfield or d–d transitions, pair excitation or double exciton pro-cesses and ligand-to-metal charge transitions (LMCT).73 Ingeneral, the ligand field transition parameter is the orbitalenergy separation between two sets of Fe (3d) orbitals or thecrystal field splitting.
As shown in Fig. 7b, the region including 250–300 nm canbe mainly assigned to LMCT since the energy of the transi-tion during the photoexcitation process is greater than 4.59eV (λ = 270 nm). At this transition energy, charge transfermay occur from the non-bonding ligand molecular orbitals(O2p) to the antibonding partially filled metal d-orbitals(Fe3d).74 On the other hand, the second absorption region(Fig. 7c) that lies in the range of 425–500 nm can be ascribedto ligand field transitions of Fe3+, which can be assigned to6A1 → 4E1,
4A1 (4G).73 The transition of the ground state (6A1)within the crystal structure can take place with only two con-ditions. Firstly, the Fe3+ ions species must be present. Sec-ondly, there must be formation of binuclear inorganic
Fig. 5 Raman spectra of (a) single crystal α-Fe2O3 nanocubes and (b)commercial α-Fe2O3 nanoparticles as standard reference.
Table 1 Band positions, corresponding intensities and assignments inthe Raman spectra of typical hematite, commercial α-Fe2O3, and as-synthesized single crystal α-Fe2O3 nanocubes
TypicalRaman shift(cm−1)
Raman shift ofcommercial α-Fe2O3 (cm
−1)
Raman shift of assynthesized α-Fe2O3
(cm−1) Assignment
225 195 212 A1g247 274 274 Eg412 388 384 Eg498 486 472 A1g613 591 589 Eg824 804 800 Hematite
CrystEngComm Paper
4728 | CrystEngComm, 2016, 18, 4720–4732 This journal is © The Royal Society of Chemistry 2016
complexes through the magnetic coupling of electronic spinsof the next-nearest neighbour Fe3+ cations. With respect to
the region between 520–650 nm, the transitions are causedby ‘double exciton processes’ that involves strongly coupledFe3+ cations rather than single Fe3+ cations as stated by thespectroscopic selection rule.75 The excitations of Fe3+–Fe3+
pairs are attributed to the sum of two single ion Fe3+ ligandfield transitions that can be assigned to 6A1 + 6A1 → 4T1 (4G)+ 4T1 (
4G).73 Regarding the trend of the absorbance character-istics, the ‘double exciton processes’ triggers theprogressively-steep onset absorption from the wavelength of770 nm and results in the strongest absorption in the regionof 520–650 nm. The peak (571 nm) within this region ishighest among the three interband transitions observed.Such a steep absorption edge in the visible range of 580–770nm is responsible for the reddish colour of the as-synthesized single crystal α-Fe2O3 nanocubes (inset of Fig.7a), which is consistent with literature reports.73–76 The deter-mination of the bandgap for α-Fe2O3 nanocubes fromspectroscopic absorbance measurements (αhν)1/2 is plottedagainst the photon energy as represented in Fig. 7d. Typi-cally, the bandgap energy was calculated from the absorbance(αhν) data of α-Fe2O3 recorded in the wavelength range of250–1100 nm using the Tauc relation;
αhν = A0(hν − Eg)n (4)
where,
(5)
Here, α is the measured absorption coefficient (cm−1) nearthe absorption edge, A0 is a constant, hν is the photon energy(eV), Eg is the optical band (eV), n is a constant. The value ofn is determined from the nature of the optical transition n =1/2 or 2 for direct allowed and indirect allowed transitions,
respectively. and mr are the effective and reduced masses
of the charge carriers, respectively. The indirect bandgap en-ergy was determined by extra-plotting the linear fit to the ex-perimental data to zero absorbance. Hematite has an indirectbandgap and thus we have determined its indirect bandgapenergies by plotting (αhν)1/2 versus the photon energy forα-Fe2O3, respectively. The size of the bandgap is calculated tobe ∼2.1 eV, which is correlated to the literature reportedvalue.77,78 Fig. 7e explains the indirect transition in the para-bolic nature of the bands close to the band edges of α-Fe2O3
pictorially. Briefly, the incoming photons (visible light) withenergy in excess of the bandgap are readily absorbed, as theyare likely to have enough energy to excite electrons from theband edges. For an allowed indirect bandgap semiconductor,the valence band energy peak and conduction band energyminimum occur at two different momentums. Thus, theelectrons must undergo a change in momentum in additionto photon absorption in order to be fully excited into the con-duction band and subsequently fall back to the valence bandvia a dissipation of energy in the form of a photon.
Fig. 6 (a) Wide scan XPS of the as-synthesized single crystallineα-Fe2O3 nanocubes, (b and c) high resolution XPS in the Fe3p (middlepanel) and O1s (bottom panel) regions. The Fe3p and O1s regionsobtained were peak-fit using Gaussian–Lorentzian components. Exper-imental data acquired is shown with red circle dotted markers and thered solid line represents the total calculated fit.
CrystEngCommPaper
CrystEngComm, 2016, 18, 4720–4732 | 4729This journal is © The Royal Society of Chemistry 2016
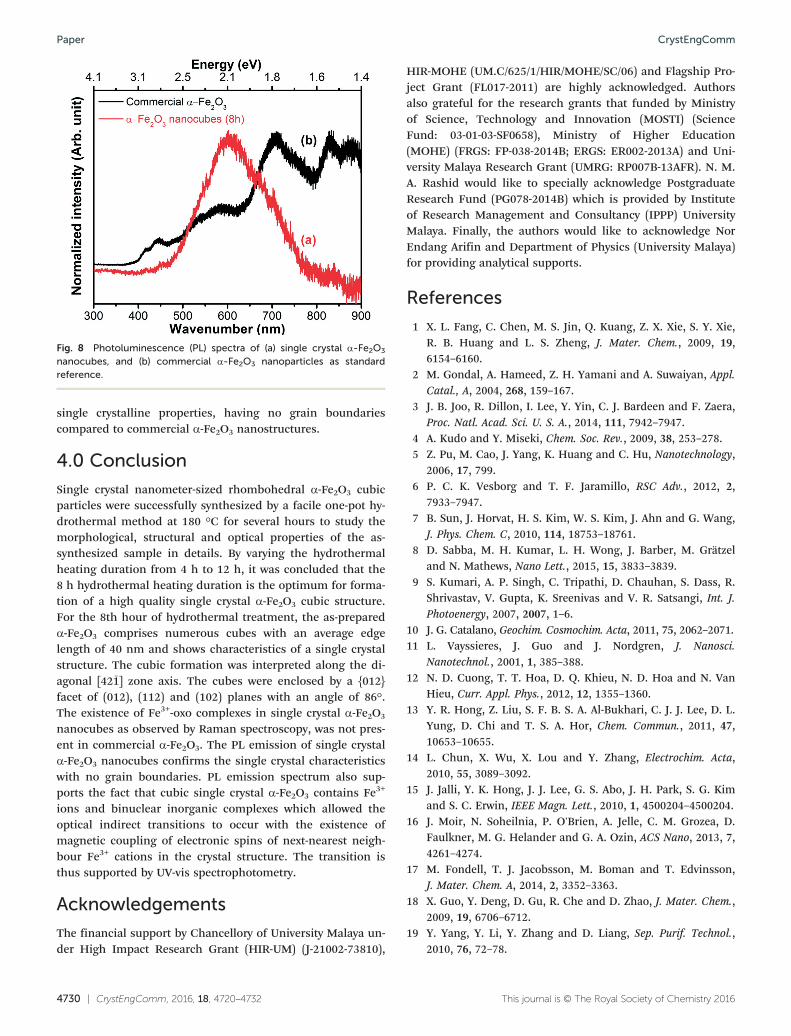
Fig. 8 depicts the photoluminescence (PL) spectra of thenanocubes and commercial α-Fe2O3 nanoparticles as stan-dard reference for comparison. Intriguingly, the nanocubesonly exhibit a single photoemission peak centered at around590 nm, whereas the commercial sample displays 6 peaks(434, 468, 591, 722, 844 and 892 nm). Basically, for the smallα-Fe2O3 nanoparticles with dimensions less than 20 nm onlythe PL phenomenon is observable due to the quantum con-finement effect.79 In contrast, bulk α-Fe2O3 with dimensionsgreater than 70 nm do not exhibit prominent PL since the op-tical transition is forbidden.80 In a current study, the nano-cubes appear to have dimensions of 40 nm that lies between
the small and bulk sizes, where the effect of size still needsto be considered. According to Fu et al. (2004), the sub-nanometer geometry of our nanocubes also possibly in-creases the Fe–O bonding separation, resulting in an en-hancement of the magnetic coupling of the neighbouringFe3+, which is responsible for the PL of α-Fe2O3 nanoparti-cle.81 In other words, nanocubes with dimensions greaterthan that of the smaller nanoparticles give smaller Racah pa-rameters which weaken the neighboring covalency more thanthose of smaller particles.82 This finally leads to the red shiftof the emission band. The single broad PL peak emitted bythe as-synthesized nanocubes suggests that the sample has
Fig. 7 (a) UV-visible absorption spectrum of single crystalline α-Fe2O3 nanocubes. Inset shows the α-Fe2O3 nanocubes dispersed in ethanol, nar-row range spectrum that covers (b) 250–300 nm, (c) 300–800 nm, (d) plots (αhν)1/2 versus optical energy obtained due to indirect transition showsthe bandgap energy of ∼2.1 eV and (e) indirect bandgap transition of electrons upon absorption of photon energy in the visible region.
CrystEngComm Paper
4730 | CrystEngComm, 2016, 18, 4720–4732 This journal is © The Royal Society of Chemistry 2016
single crystalline properties, having no grain boundariescompared to commercial α-Fe2O3 nanostructures.
4.0 Conclusion
Single crystal nanometer-sized rhombohedral α-Fe2O3 cubicparticles were successfully synthesized by a facile one-pot hy-drothermal method at 180 °C for several hours to study themorphological, structural and optical properties of the as-synthesized sample in details. By varying the hydrothermalheating duration from 4 h to 12 h, it was concluded that the8 h hydrothermal heating duration is the optimum for forma-tion of a high quality single crystal α-Fe2O3 cubic structure.For the 8th hour of hydrothermal treatment, the as-preparedα-Fe2O3 comprises numerous cubes with an average edgelength of 40 nm and shows characteristics of a single crystalstructure. The cubic formation was interpreted along the di-agonal [421̄] zone axis. The cubes were enclosed by a {012}facet of (012), (112) and (102) planes with an angle of 86°.The existence of Fe3+-oxo complexes in single crystal α-Fe2O3
nanocubes as observed by Raman spectroscopy, was not pres-ent in commercial α-Fe2O3. The PL emission of single crystalα-Fe2O3 nanocubes confirms the single crystal characteristicswith no grain boundaries. PL emission spectrum also sup-ports the fact that cubic single crystal α-Fe2O3 contains Fe3+
ions and binuclear inorganic complexes which allowed theoptical indirect transitions to occur with the existence ofmagnetic coupling of electronic spins of next-nearest neigh-bour Fe3+ cations in the crystal structure. The transition isthus supported by UV-vis spectrophotometry.
Acknowledgements
The financial support by Chancellory of University Malaya un-der High Impact Research Grant (HIR-UM) (J-21002-73810),
HIR-MOHE (UM.C/625/1/HIR/MOHE/SC/06) and Flagship Pro-ject Grant (FL017-2011) are highly acknowledged. Authorsalso grateful for the research grants that funded by Ministryof Science, Technology and Innovation (MOSTI) (ScienceFund: 03-01-03-SF0658), Ministry of Higher Education(MOHE) (FRGS: FP-038-2014B; ERGS: ER002-2013A) and Uni-versity Malaya Research Grant (UMRG: RP007B-13AFR). N. M.A. Rashid would like to specially acknowledge PostgraduateResearch Fund (PG078-2014B) which is provided by Instituteof Research Management and Consultancy (IPPP) UniversityMalaya. Finally, the authors would like to acknowledge NorEndang Arifin and Department of Physics (University Malaya)for providing analytical supports.
References
1 X. L. Fang, C. Chen, M. S. Jin, Q. Kuang, Z. X. Xie, S. Y. Xie,R. B. Huang and L. S. Zheng, J. Mater. Chem., 2009, 19,6154–6160.
2 M. Gondal, A. Hameed, Z. H. Yamani and A. Suwaiyan, Appl.Catal., A, 2004, 268, 159–167.
3 J. B. Joo, R. Dillon, I. Lee, Y. Yin, C. J. Bardeen and F. Zaera,Proc. Natl. Acad. Sci. U. S. A., 2014, 111, 7942–7947.
4 A. Kudo and Y. Miseki, Chem. Soc. Rev., 2009, 38, 253–278.5 Z. Pu, M. Cao, J. Yang, K. Huang and C. Hu, Nanotechnology,
2006, 17, 799.6 P. C. K. Vesborg and T. F. Jaramillo, RSC Adv., 2012, 2,
7933–7947.7 B. Sun, J. Horvat, H. S. Kim, W. S. Kim, J. Ahn and G. Wang,
J. Phys. Chem. C, 2010, 114, 18753–18761.8 D. Sabba, M. H. Kumar, L. H. Wong, J. Barber, M. Grätzel
and N. Mathews, Nano Lett., 2015, 15, 3833–3839.9 S. Kumari, A. P. Singh, C. Tripathi, D. Chauhan, S. Dass, R.
Shrivastav, V. Gupta, K. Sreenivas and V. R. Satsangi, Int. J.Photoenergy, 2007, 2007, 1–6.
10 J. G. Catalano, Geochim. Cosmochim. Acta, 2011, 75, 2062–2071.11 L. Vayssieres, J. Guo and J. Nordgren, J. Nanosci.
Nanotechnol., 2001, 1, 385–388.12 N. D. Cuong, T. T. Hoa, D. Q. Khieu, N. D. Hoa and N. Van
Hieu, Curr. Appl. Phys., 2012, 12, 1355–1360.13 Y. R. Hong, Z. Liu, S. F. B. S. A. Al-Bukhari, C. J. J. Lee, D. L.
Yung, D. Chi and T. S. A. Hor, Chem. Commun., 2011, 47,10653–10655.
14 L. Chun, X. Wu, X. Lou and Y. Zhang, Electrochim. Acta,2010, 55, 3089–3092.
15 J. Jalli, Y. K. Hong, J. J. Lee, G. S. Abo, J. H. Park, S. G. Kimand S. C. Erwin, IEEE Magn. Lett., 2010, 1, 4500204–4500204.
16 J. Moir, N. Soheilnia, P. O'Brien, A. Jelle, C. M. Grozea, D.Faulkner, M. G. Helander and G. A. Ozin, ACS Nano, 2013, 7,4261–4274.
17 M. Fondell, T. J. Jacobsson, M. Boman and T. Edvinsson,J. Mater. Chem. A, 2014, 2, 3352–3363.
18 X. Guo, Y. Deng, D. Gu, R. Che and D. Zhao, J. Mater. Chem.,2009, 19, 6706–6712.
19 Y. Yang, Y. Li, Y. Zhang and D. Liang, Sep. Purif. Technol.,2010, 76, 72–78.
Fig. 8 Photoluminescence (PL) spectra of (a) single crystal α-Fe2O3
nanocubes, and (b) commercial α-Fe2O3 nanoparticles as standardreference.
CrystEngCommPaper
CrystEngComm, 2016, 18, 4720–4732 | 4731This journal is © The Royal Society of Chemistry 2016
20 B. Issa, I. M. Obaidat, B. A. Albiss and Y. Haik, Int. J. Mol.Sci., 2013, 14, 21266–21305.
21 H. Xia, C. Hong, B. Li, B. Zhao, Z. Lin, M. Zheng, S. V.Savilov and S. M. Aldoshin, Adv. Funct. Mater., 2015, 25,627–635.
22 R. Wang, Y. Chen, Y. Fu, H. Zhang and C. Kisielowski,J. Phys. Chem. B, 2005, 109, 12245–12249.
23 P. Basnet, G. K. Larsen, R. P. Jadeja, Y. C. Hung and Y.Zhao, ACS Appl. Mater. Interfaces, 2013, 5, 2085–2095.
24 S. Lian, E. Wang, Z. Kang, Y. Bai, L. Gao, M. Jiang, C. Huand L. Xu, Solid State Commun., 2004, 129, 485–490.
25 T. Mushove, T. M. Breault and L. T. Thompson, Ind. Eng.Chem. Res., 2015, 54, 4285–4292.
26 C. Jia, L. Sun, F. Luo, X. Han, L. J. Heyderman, Z. Yan, C.Yan, K. Zheng, Z. Zhang, M. Takano, N. Hayashi, M.Eltschka, M. Kläui, U. Rüdiger, T. Kasama, L. Cervera-Gontard, R. E. Dunin-Borkowski, G. Tzvetkov and J. Raabe,J. Am. Chem. Soc., 2008, 130, 16968–16977.
27 R. Rajendran, Z. Yaakob, M. Pudukudy, M. S. A. Rahamanand K. Sopian, J. Alloys Compd., 2014, 608, 207–212.
28 T. Wang, S. Zhou, C. Zhang, J. Lian, Y. Liang and W. Yuan,New J. Chem., 2014, 38, 46–49.
29 B. Wang, J. S. Chen and X. W. Lou, J. Mater. Chem.,2012, 22, 9466–9468.
30 S. Zeng, K. Tang, T. Li, Z. Liang, D. Wang, Y. Wang, Y. Qiand W. Zhou, J. Phys. Chem. C, 2008, 112, 4836–4843.
31 H. Liang, X. Jiang, Z. Qi, W. Chen, Z. Wu, B. Xu, Z. Wang, J.Mi and Q. Li, Nanoscale, 2014, 6, 7199–7203.
32 Y. Zhang, S. Jiang, W. Song, P. Zhou, H. Ji, W. Ma, W. Hao,C. Chen and J. Zhao, Energy Environ. Sci., 2015, 8,1231–1236.
33 N. Adelstein, J. B. Neaton, M. Asta and L. C. De Jonghe,Phys. Rev. B: Condens. Matter Mater. Phys., 2014, 89, 245115.
34 S. D. Kharade, N. B. Pawar, K. V. Khot, P. B. Patil, S. S. Mali,C. K. Hong, P. S. Patil and P. N. Bhosale, RSC Adv., 2016, 6,24985–24994.
35 C. Liu, H. Tang, J. Li, W. Li, Y. Yang, Y. Li and Q. Chen, RSCAdv., 2015, 5, 35506–35512.
36 M. Barroso, S. R. Pendlebury, A. J. Cowan and J. R. Durrant,Chem. Sci., 2013, 4, 2724–2734.
37 J. H. Bang and K. S. Suslick, J. Am. Chem. Soc., 2007, 129,2242–2243.
38 S. B. Wang, Y. L. Min and S. H. Yu, J. Phys. Chem. C,2007, 111, 3551–3554.
39 V. Malik, B. Grobety, V. Trappe, H. Dietsch and P.Schurtenberger, Colloids Surf., A, 2014, 445, 21–29.
40 C. Eid, D. Luneau, V. Salles, R. Asmar, Y. Monteil, A. Khouryand A. Brioude, J. Phys. Chem. C, 2011, 115, 17643–17646.
41 M. Zhu, Y. Wang, D. Meng, X. Qin and G. Diao, J. Phys.Chem. C, 2012, 116, 16276–16285.
42 S. Mitra, D. Soumen, M. Kalyan and C. Subhadra,Nanotechnology, 2007, 18, 275608.
43 C. Su, H. Wang and X. Liu, Cryst. Res. Technol., 2011, 46,209–214.
44 X. Ma, M. Zhang, C. Liang, Y. Li, J. Wu and R. Che, ACSAppl. Mater. Interfaces, 2015, 7, 24191–24196.
45 A. K. Patra, S. K. Kundu, A. Bhaumik and D. Kim, Nanoscale,2016, 8, 365–377.
46 S. Mourdikoudis and L. M. Liz-Marzán, Chem. Mater.,2013, 25, 1465–1476.
47 A. Satoh and Y. Sakuda, Colloids Surf., A, 2014, 460, 473–482.48 A. Satoh, Colloids Surf., A, 2015, 483, 341–351.49 P. Dias, A. Vilanova, T. Lopes, L. Andrade and A. Mendes,
Nano Energy, 2016, 23, 70–79.50 X. Feng, D. C. Sayle, Z. L. Wang, M. S. Paras, B. Santora,
A. C. Sutorik, T. X. T. Sayle, Y. Yang, Y. Ding, X. Wang andY.-S. Her, Science, 2006, 312, 1504–1508.
51 V. M. Huxter, A. Lee, S. S. Lo and G. D. Scholes, Nano Lett.,2009, 9, 405–409.
52 R. D. Rodriguez, D. Demaille, E. Lacaze, J. Jupille, C. Chaneacand J.-P. Jolivet, J. Phys. Chem. C, 2007, 111, 16866–16870.
53 P. Li, X. Yan, Z. He, J. Ji, J. Hu, G. Li, K. Lian and W. Zhang,CrystEngComm, 2016, 18, 1752–1759.
54 L. S. Dent Glasser, F. P. Glasser and H. F. W. Taylor, Q. Rev.,Chem. Soc., 1962, 16(4), 343.
55 Y. Xia, Y. Xiong, B. Lim and S. E. Skrabalak, Angew. Chem.,Int. Ed., 2009, 48, 60–103.
56 T. Kovačević, A. Reinhold and H. Briesen, Cryst. Growth Des.,2014, 14, 1666–1675.
57 N. J. Bacon, M. B. Baker and B. D. Swanson, Q. J. R.Meteorol. Soc., 2003, 129, 1903–1927.
58 W. Wu, R. Hao, F. Liu, X. Su and Y. Hou, J. Mater. Chem. A,2013, 1, 6888–6894.
59 S. Rehman, W. Yang, F. Liu, Y. Hong, T. Wang and Y. Hou,Inorg. Chem. Front., 2015, 2, 576–583.
60 F. Liu, J. Zhu, Y. Hou and S. Gao, Chin. Phys. B, 2013, 22,107503.
61 S. Xiong, W. Qi, B. Huang, M. Wang and L. Wei, J. Phys.Chem. C, 2011, 115, 10365–10369.
62 L. Yu, C. Yang and Y. Hou, Nanoscale, 2014, 6, 10638–10642.63 F. Liu, Y. Hou and S. Gao, Chem. Soc. Rev., 2014, 43,
8098–8113.64 M. Lübbe, A. M. Gigler, R. W. Stark and W. Moritz, Surf. Sci.,
2010, 604, 679–685.65 M. Hanesch, Geophys. J. Int., 2009, 177, 941–948.66 A. M. Jubb and H. C. Allen, ACS Appl. Mater. Interfaces,
2010, 2, 2804–2812.67 D. L. A. de Faria and F. N. Lopes, Vib. Spectrosc., 2007, 45,
117–121.68 H. Zhu, J. Deng, J. Chen, R. Yu and X. Xing, J. Mater. Chem.
A, 2014, 2, 3008–3014.69 Y. El Mendili, J. F. Bardeau, N. Randrianantoandro, F.
Grasset and J. M. Greneche, J. Phys. Chem. C, 2012, 116,23785–23792.
70 J. Liu, H. Cao, J. Xiong and Z. Cheng, CrystEngComm,2012, 14, 5140–5144.
71 J. D. Desai, H. M. Pathan, S. K. Min, K. D. Jung and O. S.Joo, Appl. Surf. Sci., 2005, 252, 1870–1875.
72 P. Liao and E. A. Carter, J. Phys. Chem. C, 2011, 115,20795–20805.
73 D. M. Sherman and T. D. Waite, Am. Mineral., 1985, 70,1262.
CrystEngComm Paper

4732 | CrystEngComm, 2016, 18, 4720–4732 This journal is © The Royal Society of Chemistry 2016
74 A. M. Jubb and H. C. Allen, ACS Appl. Mater. Interfaces,2010, 2, 2804–2812.
75 L. Lu, L. Li, X. Wang and G. Li, J. Phys. Chem. B, 2005, 109,17151–17156.
76 M. Lübbe, A. M. Gigler, R. W. Stark and W. Moritz, Surf. Sci.,2010, 604, 679–685.
77 R. H. Misho and W. A. Murad, Sol. Energy Mater. Sol. Cells,1992, 27, 335–345.
78 B. Tang, G. Wang, L. Zhuo, J. Ge and L. Cui, Inorg. Chem.,2006, 45, 5196–5200.
79 L. M. Fu, Z. Y. Wu, X. C. Ai, J. P. Zhang, Y. X. Nie, S. S. Xie,G. Z. Yang and B. S. Zou, J. Chem. Phys., 2004, 120,3406–3413.
80 C. T. Chen and B. D. Cahan, J. Opt. Soc. Am., 1981, 71,932–934.
81 L. M. Fu, Z. Y. Wu, X. C. Ai, J. P. Zhang, Y. X. Nie, S. S. Xie,G. Z. Yang and B. S. Zou, J. Chem. Phys., 2004, 120,3406–3413.
82 L. Lu, L. P. Li, X. J. Wang and G. S. Li, J. Phys. Chem. B,2005, 109, 17151–17156.
CrystEngCommPaper
Top Related