

γλώσσες
Σελίδες
Νομικός

1
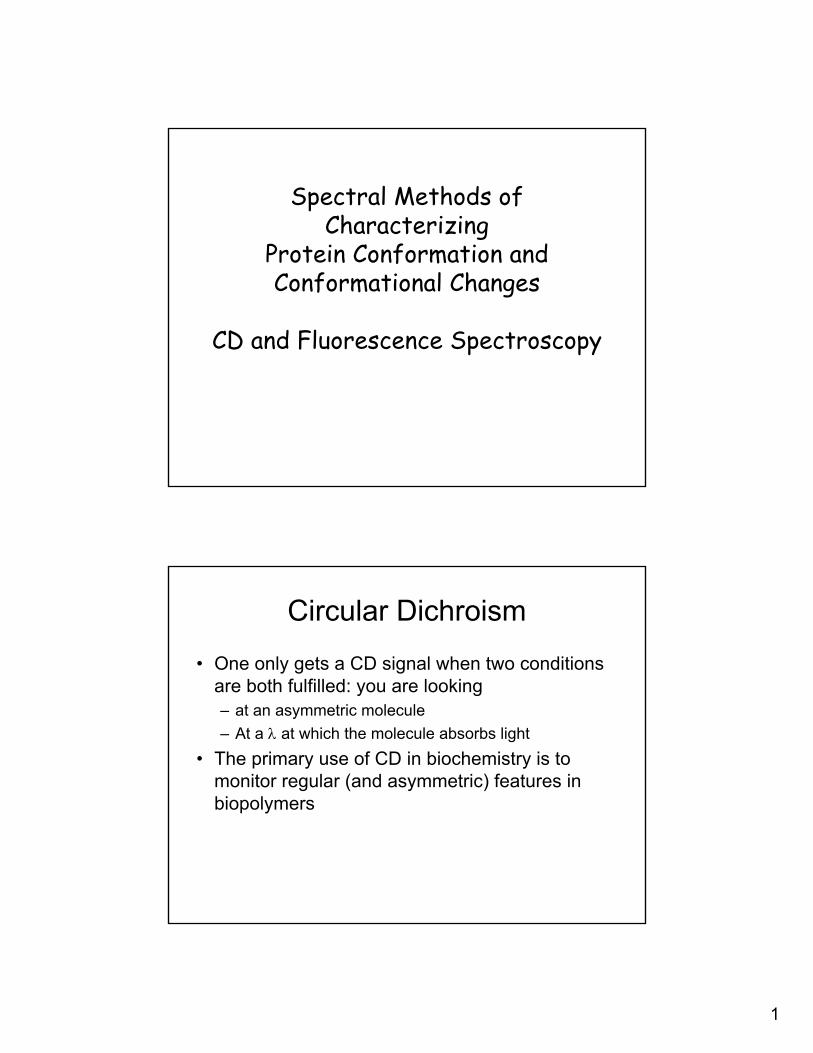
Spectral Methods of Characterizing
Protein Conformation and Conformational Changes
CD and Fluorescence Spectroscopy
Circular Dichroism
• One only gets a CD signal when two conditions are both fulfilled: you are looking– at an asymmetric molecule– At a λ at which the molecule absorbs light
• The primary use of CD in biochemistry is to monitor regular (and asymmetric) features in biopolymers
2
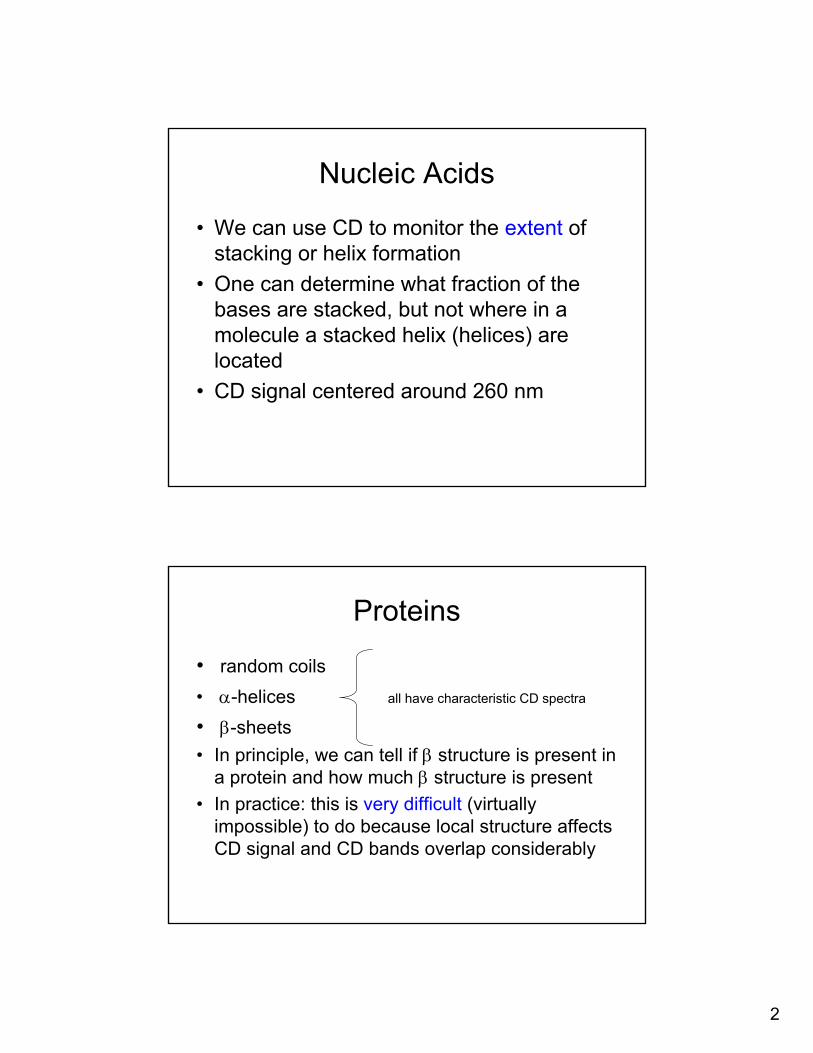
Nucleic Acids
• We can use CD to monitor the extent of stacking or helix formation
• One can determine what fraction of the bases are stacked, but not where in a molecule a stacked helix (helices) are located
• CD signal centered around 260 nm
Proteins
• random coils• α-helices all have characteristic CD spectra
• β-sheets• In principle, we can tell if β structure is present in
a protein and how much β structure is present• In practice: this is very difficult (virtually
impossible) to do because local structure affects CD signal and CD bands overlap considerably
3
• The theory of CD is not well-developed, and one cannot take a CD spectrum and determine precisely the percentage of protein that is α-helix
– This CANNOT BE DONE !!
– CD cannot be use to provide an absolute structure. But it is extremely good at determining changes in the structure.
Conformational changes• The origin of changes in CD signal will be:
– α-helix less α-helix (or vice versa)– α-helix random coil “– β-sheet random coil “
– stacked NA unstacked NA “
• But you will not be able (usually) to identify exactly where the change occurred, or what happened– CD tells “if”, not “what” or “where”
4
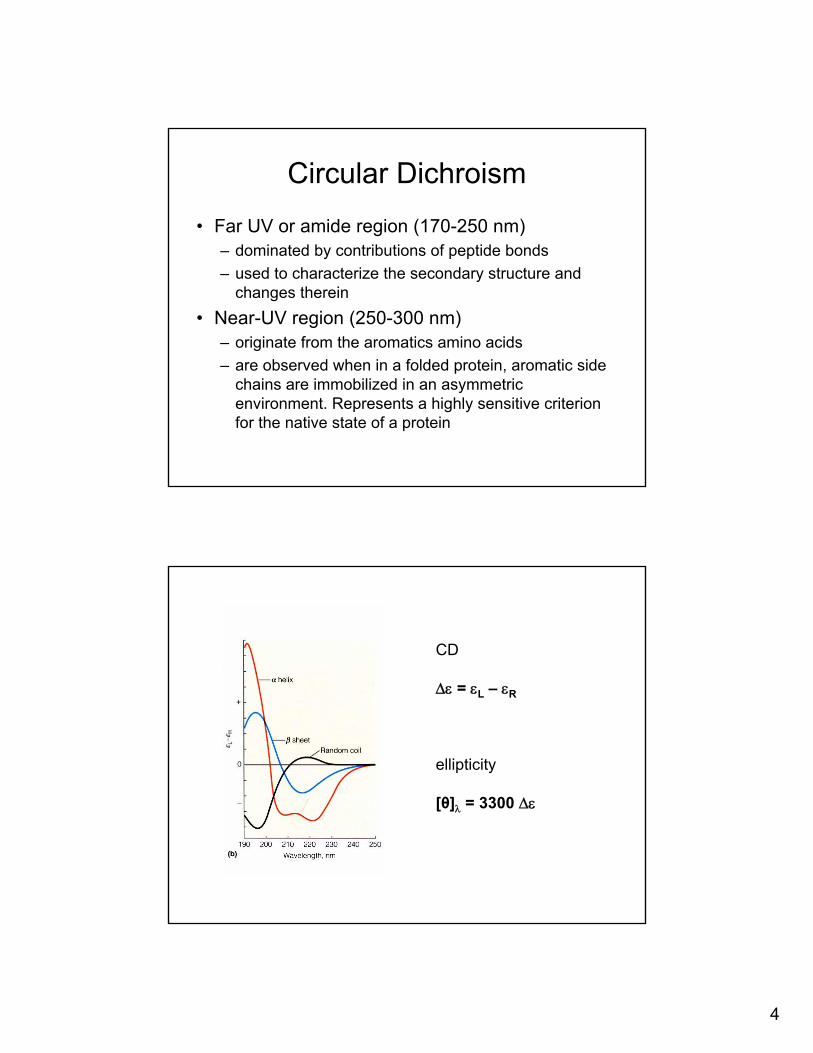
Circular Dichroism
• Far UV or amide region (170-250 nm)– dominated by contributions of peptide bonds– used to characterize the secondary structure and
changes therein• Near-UV region (250-300 nm)
– originate from the aromatics amino acids– are observed when in a folded protein, aromatic side
chains are immobilized in an asymmetric environment. Represents a highly sensitive criterion for the native state of a protein
CD
Δε = εL – εR
ellipticity
[θ]λ = 3300 Δε
5
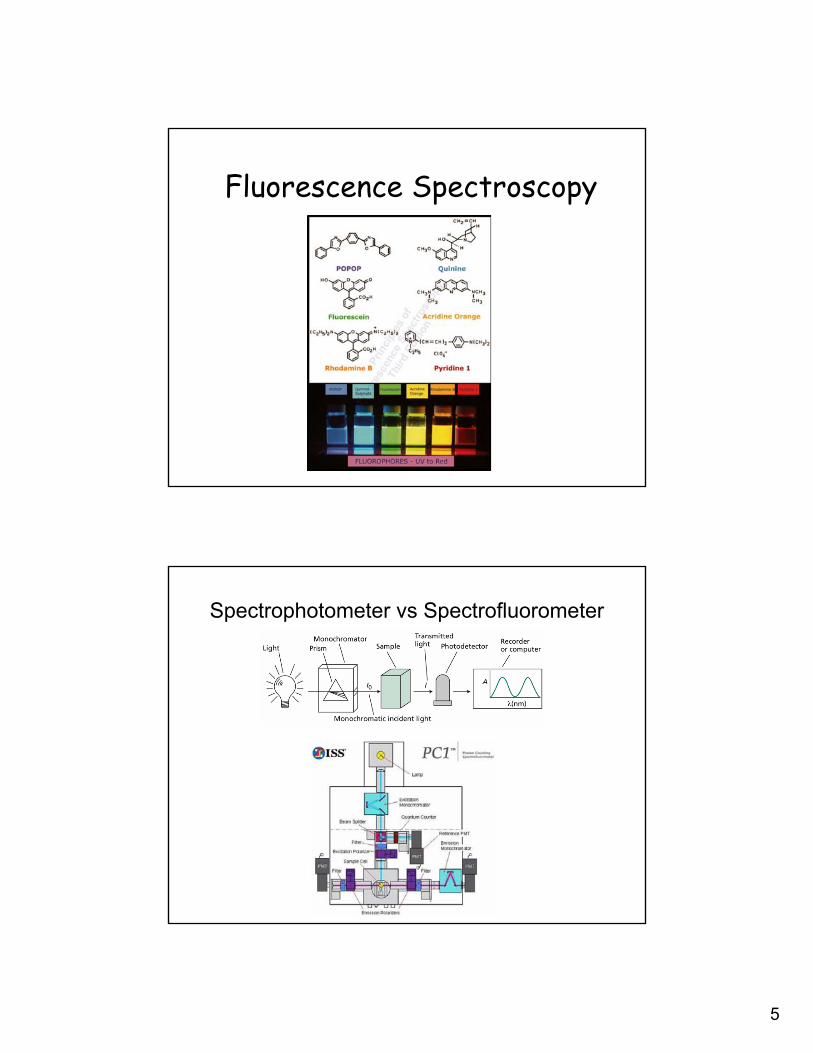
Fluorescence Spectroscopy
Spectrophotometer vs Spectrofluorometer
6
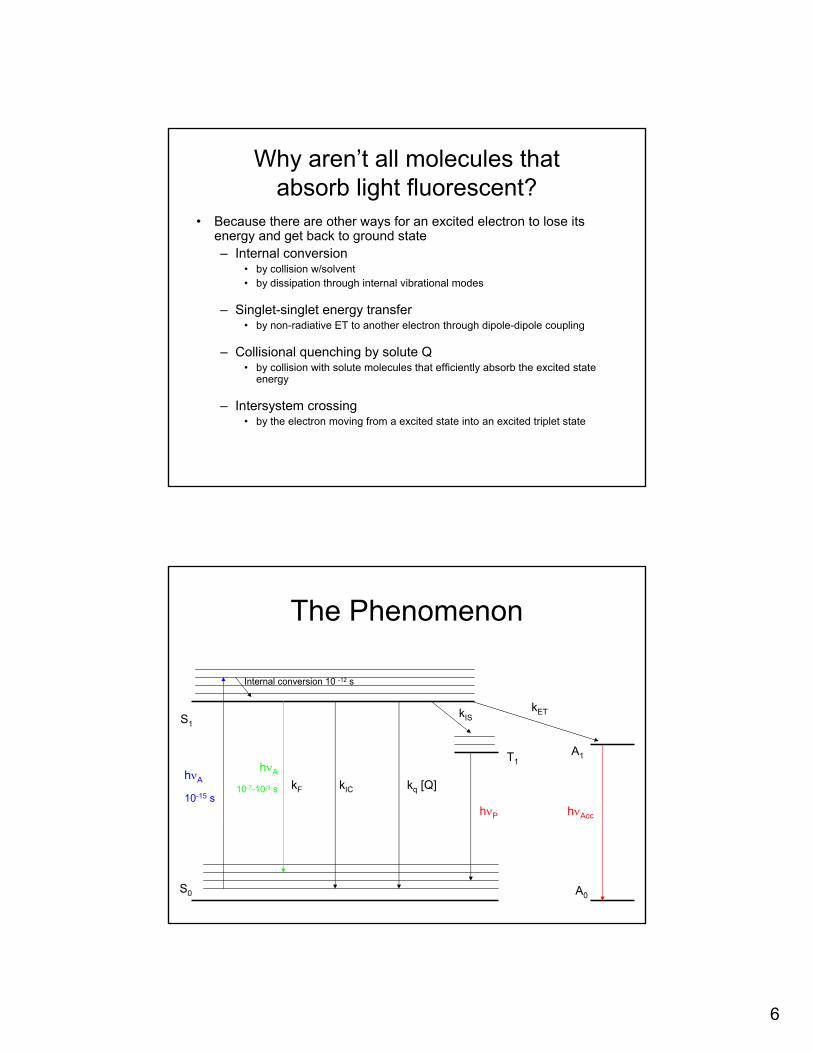
Why aren’t all molecules that absorb light fluorescent?
• Because there are other ways for an excited electron to lose itsenergy and get back to ground state– Internal conversion
• by collision w/solvent• by dissipation through internal vibrational modes
– Singlet-singlet energy transfer• by non-radiative ET to another electron through dipole-dipole coupling
– Collisional quenching by solute Q• by collision with solute molecules that efficiently absorb the excited state
energy
– Intersystem crossing• by the electron moving from a excited state into an excited triplet state
The Phenomenon
S0
S1
A1
A0
hνA
10-15 s
hνA
10-7-10-9 s kF kIC kq [Q]
hνAcc
kET
Internal conversion 10 -12 s
T1
kIS
hνP
7
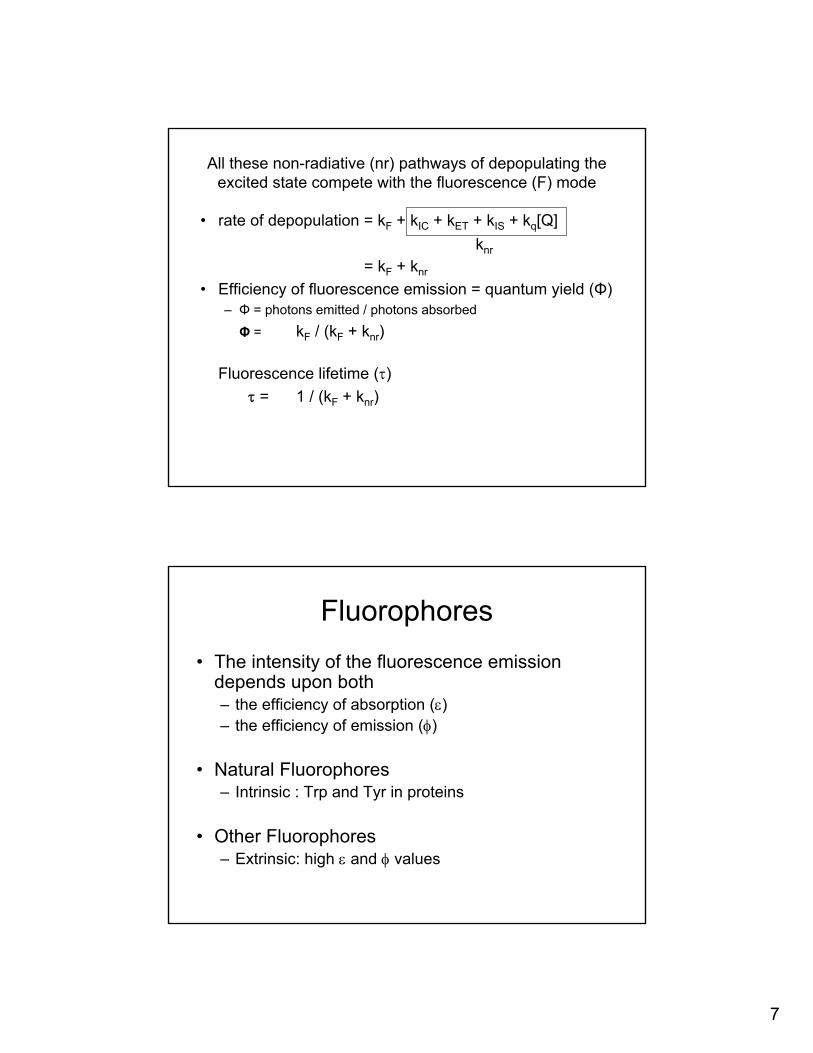
All these non-radiative (nr) pathways of depopulating the excited state compete with the fluorescence (F) mode
• rate of depopulation = kF + kIC + kET + kIS + kq[Q]
= kF + knr
• Efficiency of fluorescence emission = quantum yield (Φ)– Φ = photons emitted / photons absorbed
Φ = kF / (kF + knr)
Fluorescence lifetime (τ)τ = 1 / (kF + knr)
knr
Fluorophores• The intensity of the fluorescence emission
depends upon both– the efficiency of absorption (ε)– the efficiency of emission (φ)
• Natural Fluorophores– Intrinsic : Trp and Tyr in proteins
• Other Fluorophores– Extrinsic: high ε and φ values
8
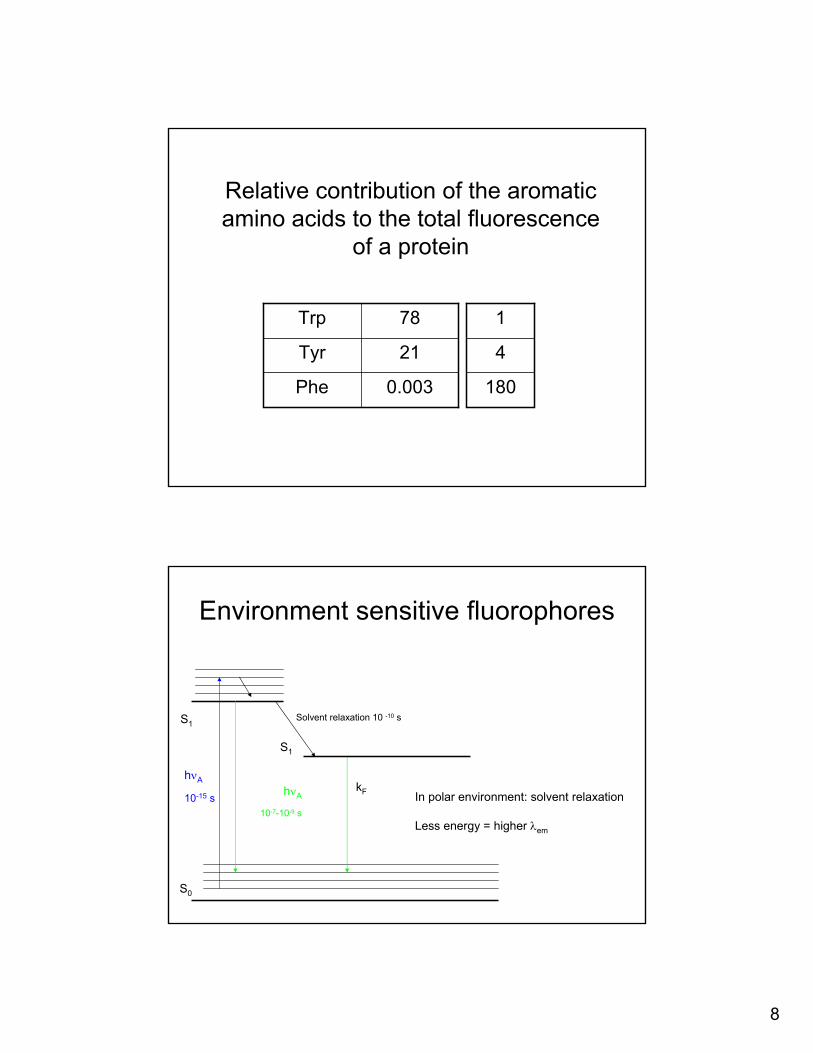
Relative contribution of the aromatic amino acids to the total fluorescence
of a protein
0.003Phe
21Tyr
78Trp
180
4
1
Environment sensitive fluorophores
S0
S1
hνA
10-15 s hνA
10-7-10-9 s
kF
Solvent relaxation 10 -10 s
S1
In polar environment: solvent relaxation
Less energy = higher λem
9
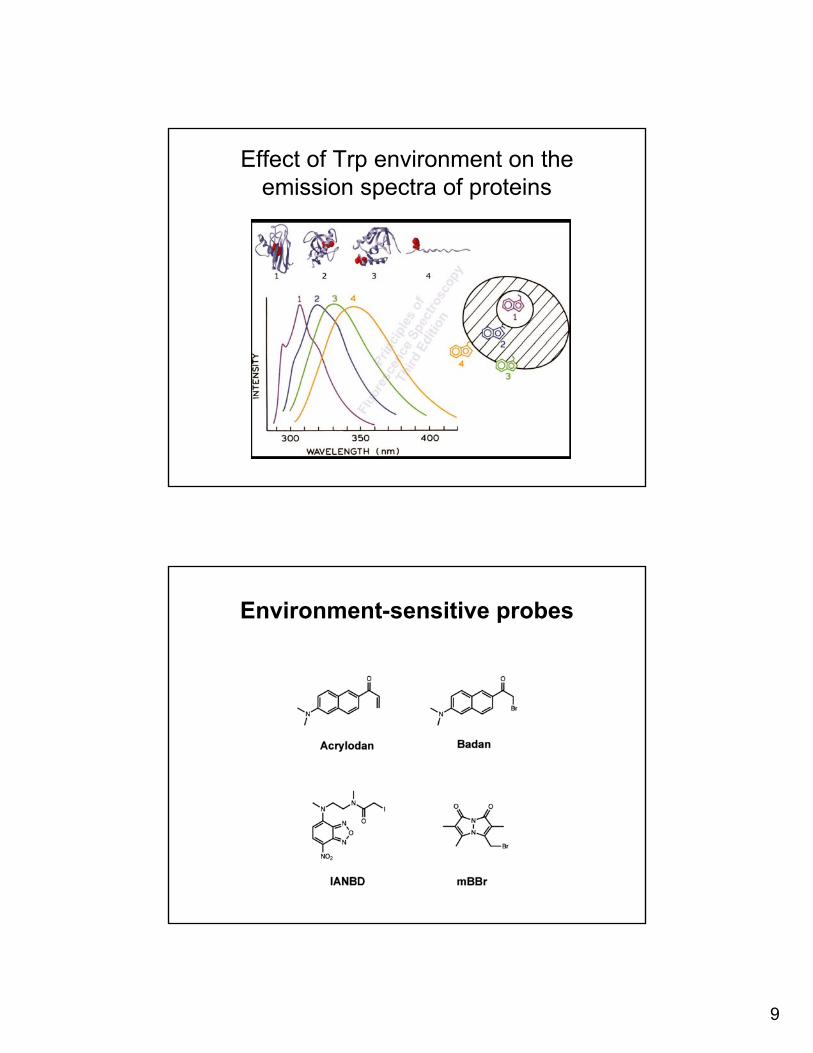
Effect of Trp environment on the emission spectra of proteins
Environment-sensitive probes
10
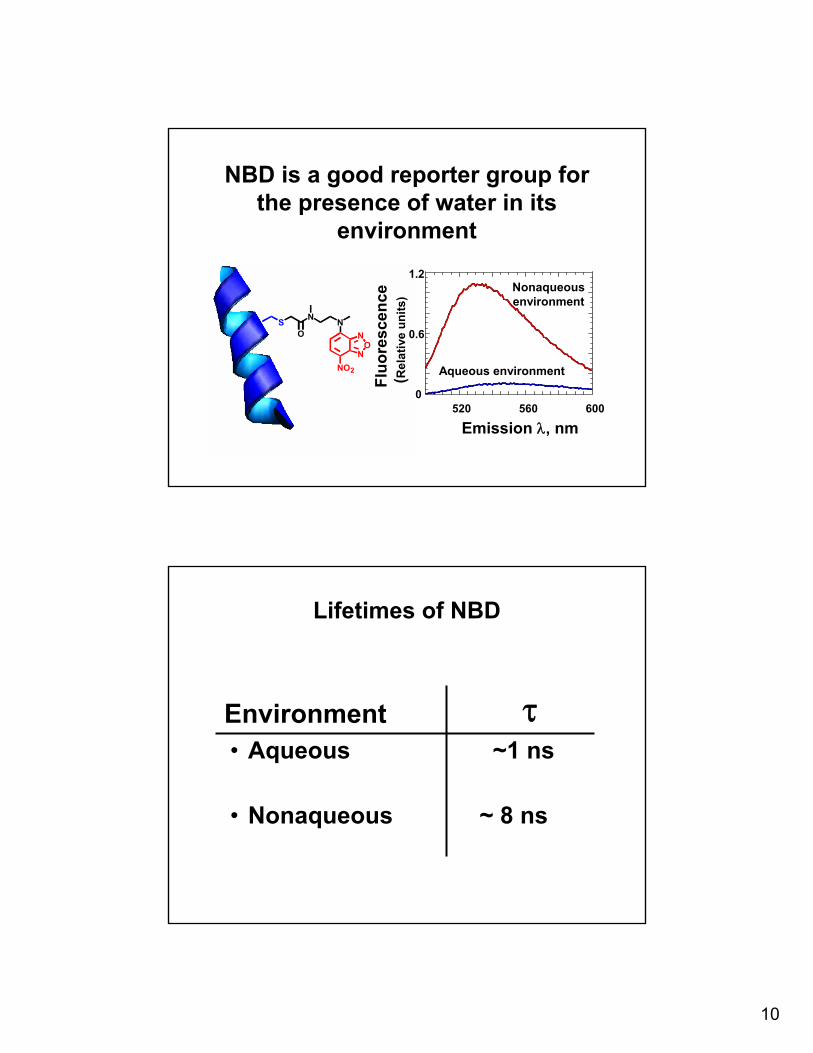
0
0.6
1.2
520 560 600
Emission λ, nm
Nonaqueous environment
Aqueous environmentFl
uore
scen
ce(R
elat
ive
units
)
NBD is a good reporter group for the presence of water in its
environment
S N
ON
NO
N
NO2
Lifetimes of NBD
• Aqueous ~1 ns
• Nonaqueous ~ 8 ns
Environment τ
11
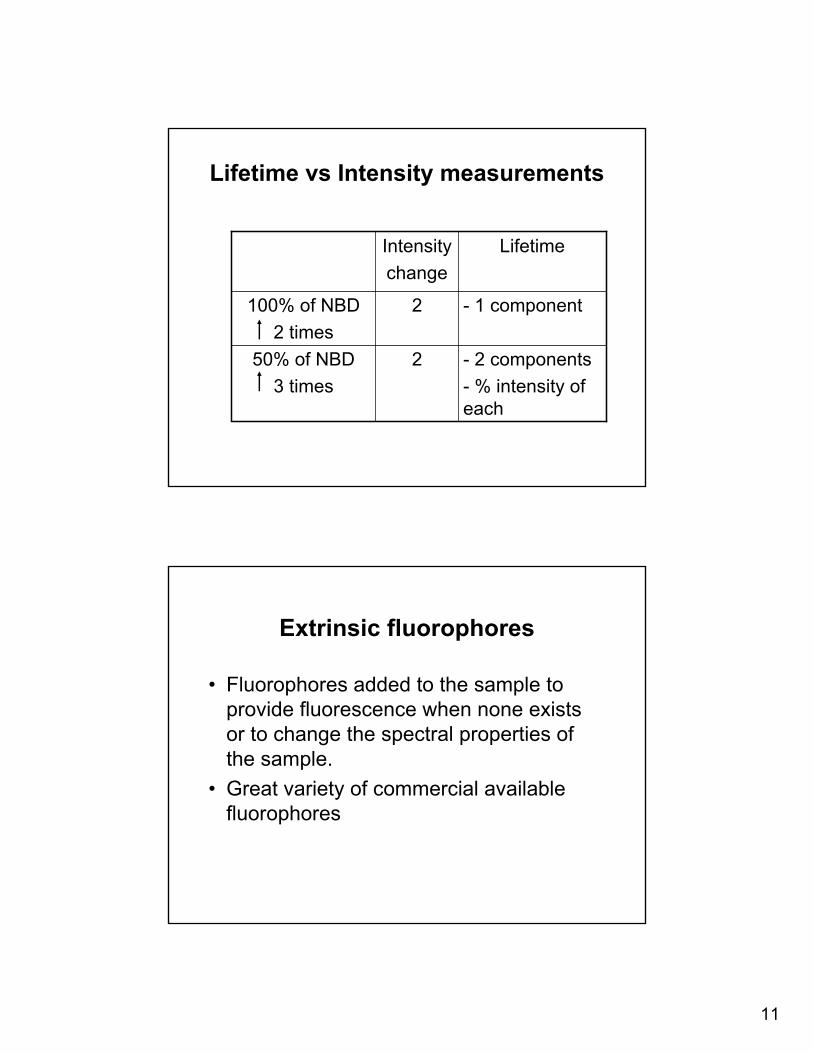
Lifetime vs Intensity measurements
- 2 components- % intensity of each
250% of NBD3 times
- 1 component2100% of NBD2 times
LifetimeIntensitychange
Extrinsic fluorophores
• Fluorophores added to the sample to provide fluorescence when none exists or to change the spectral properties of the sample.
• Great variety of commercial available fluorophores
12
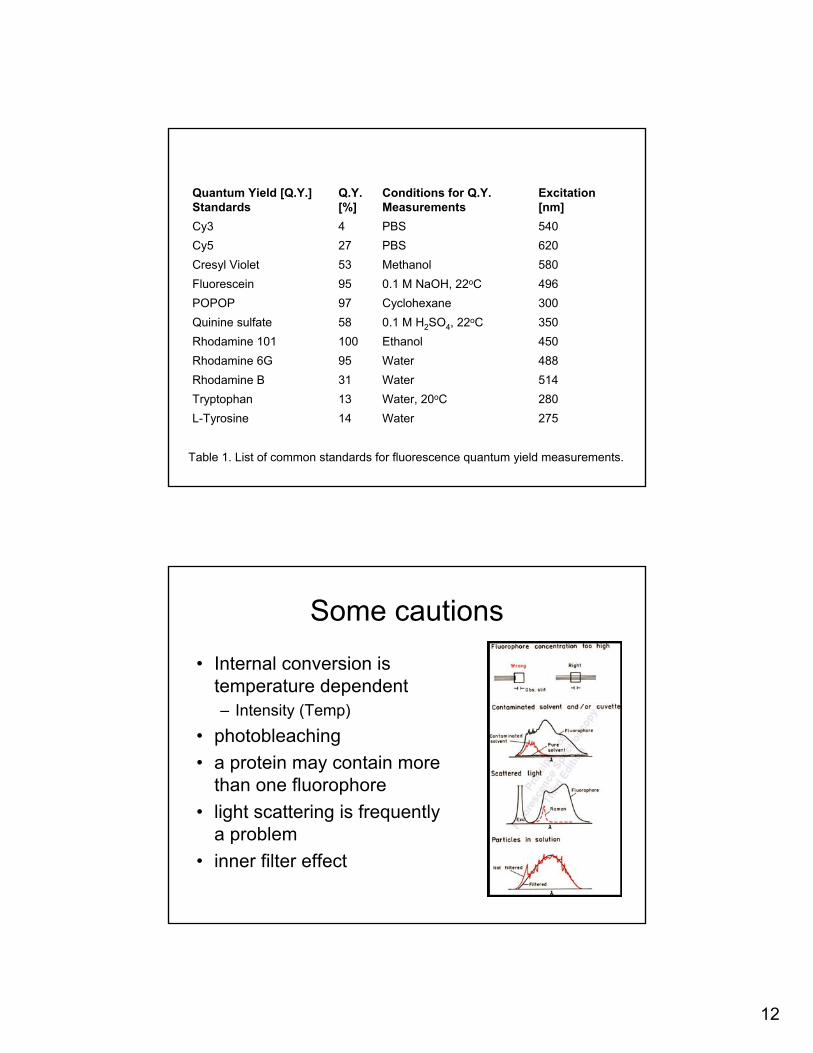
275Water14L-Tyrosine280Water, 20oC13Tryptophan514Water31Rhodamine B488Water95Rhodamine 6G450Ethanol100Rhodamine 1013500.1 M H2SO4, 22oC58Quinine sulfate300Cyclohexane97POPOP4960.1 M NaOH, 22oC95Fluorescein580Methanol53Cresyl Violet620PBS27Cy5540PBS4Cy3
Excitation [nm]
Conditions for Q.Y. Measurements
Q.Y. [%]
Quantum Yield [Q.Y.] Standards
Table 1. List of common standards for fluorescence quantum yield measurements.
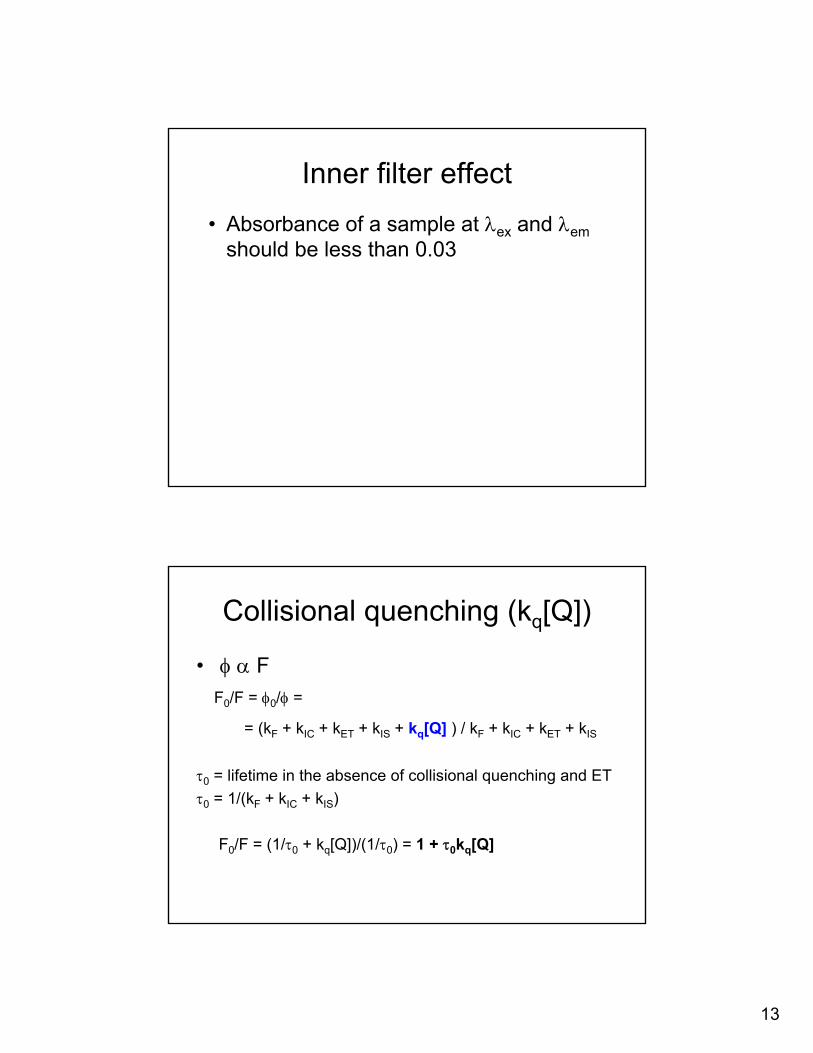
Some cautions
• Internal conversion is temperature dependent– Intensity (Temp)
• photobleaching• a protein may contain more
than one fluorophore• light scattering is frequently
a problem• inner filter effect
13
Inner filter effect• Absorbance of a sample at λex and λem
should be less than 0.03
Collisional quenching (kq[Q])
• φ α FF0/F = φ0/φ =
= (kF + kIC + kET + kIS + kq[Q] ) / kF + kIC + kET + kIS
τ0 = lifetime in the absence of collisional quenching and ETτ0 = 1/(kF + kIC + kIS)
F0/F = (1/τ0 + kq[Q])/(1/τ0) = 1 + τ0kq[Q]
14
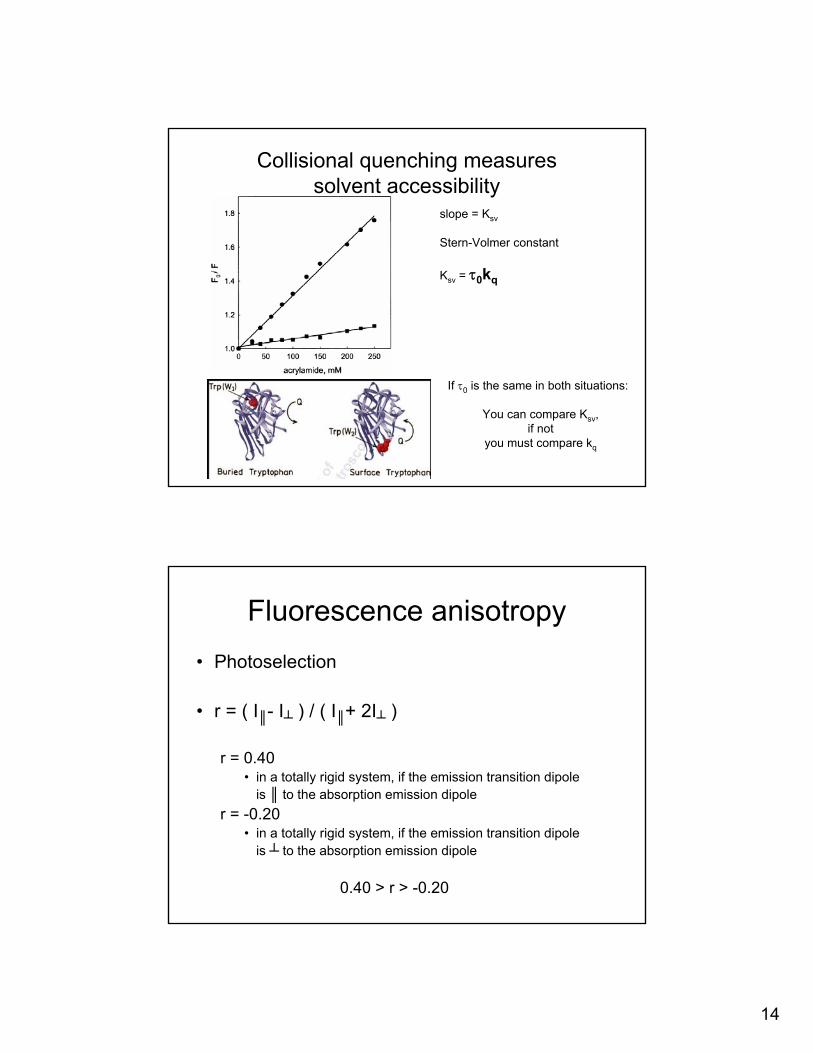
Collisional quenching measures solvent accessibility
slope = Ksv
Stern-Volmer constant
Ksv = τ0kq
If τ0 is the same in both situations:
You can compare Ksv, if not
you must compare kq
Fluorescence anisotropy• Photoselection
• r = ( I║- I┴ ) / ( I║+ 2I┴ )
r = 0.40• in a totally rigid system, if the emission transition dipole
is ║ to the absorption emission dipoler = -0.20
• in a totally rigid system, if the emission transition dipole is ┴ to the absorption emission dipole
0.40 > r > -0.20
Top Related