


γλώσσες
Σελίδες
Νομικός

Gunnar Lindström, CiS report, CERN 29-Nov-01
• Optimization of DOFZ for manufacturing process
• Cost effectiveness, how much [O] is enough?
• <111> vs. <100>, influence on surface properties
• Hidden parameters affecting radiation hardness(example: HCl vs. TCA)
• Czochralski silicon, a possible alternative?
Material: FZ: Wacker, Cz: Sumitomo
Processing: CiS Erfurt, process very similar to ATLAS wedge Test diodes multi g.r.(HH) + test fields(Dortmund)
Material characterization:IR: ITME Warsaw, B. SurmaSIMS: SIMS Lab Warsaw, A. Barcz4-point probe and management: ITME, E. NossarzewskaDLTS, C/V + I/V: Uni-HH
Radiation damage studies (Uni-HH):Irradiations with p (PS-CERN), n (TRIGA-Ljubljana),Co-60 Gamma (BNL, collab. with Z. Li, E. Verbitskaja)Tools: DLTS + Laplace-DLTS, TSC, TCT, C/V + I/V-annealing, Simulation-studies
Project started: November 2000First irradiations: p (July + Sept. 01), n (Oct. 01), γγγγ (Sept. 01)
Preliminary Results of the CiS-HH SRD ProjectG. Lindström*, E. Fretwurst*, I. Pintilie, R. Röder♣, J. Stahl*
* Uni-Hamburg, guest from NIMP, Bucharest, ♣CiS Institute for Microsensors, Erfurt
Gunnar Lindström, CiS report, CERN 29-Nov-01
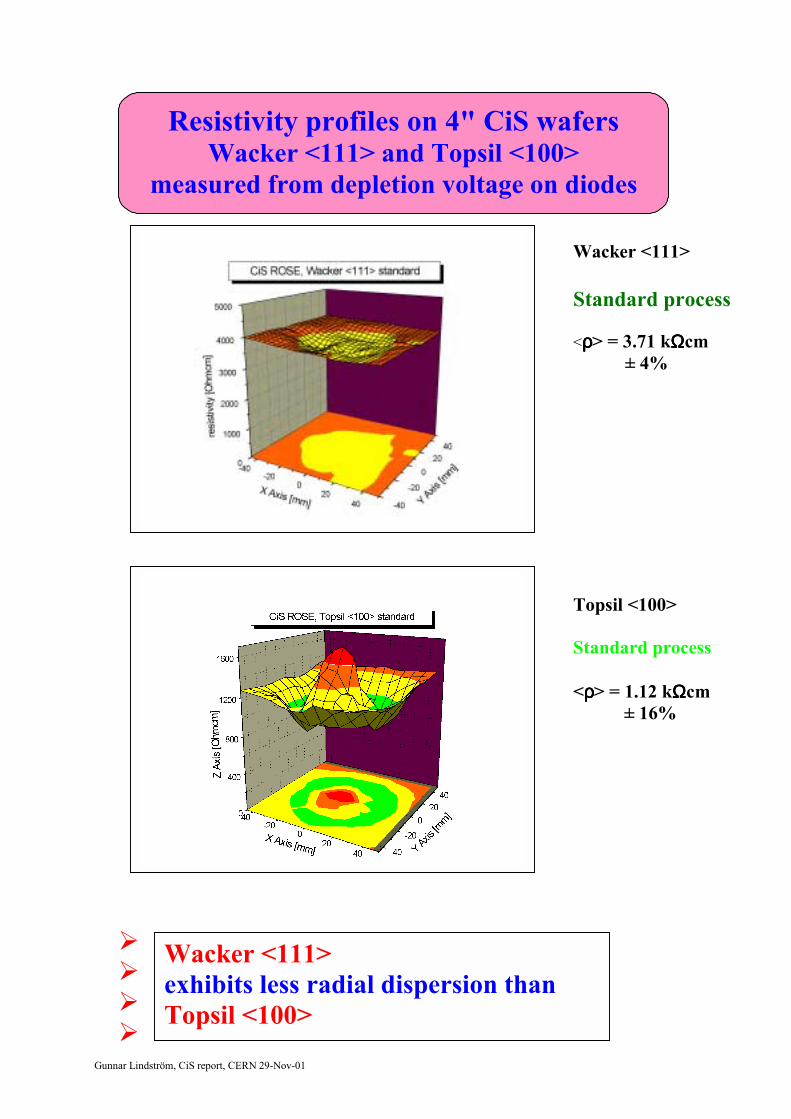
Wacker <111>
Standard process
<ρρρρ> = 3.71 kΩΩΩΩcm ± 4%
Topsil <100>
Standard process
<ρρρρ> = 1.12 kΩΩΩΩcm ± 16%
! ! ! !
Resistivity profiles on 4" CiS wafersWacker <111> and Topsil <100>
measured from depletion voltage on diodes
Wacker <111>exhibits less radial dispersion thanTopsil <100>
Gunnar Lindström, CiS report, CERN 29-Nov-01
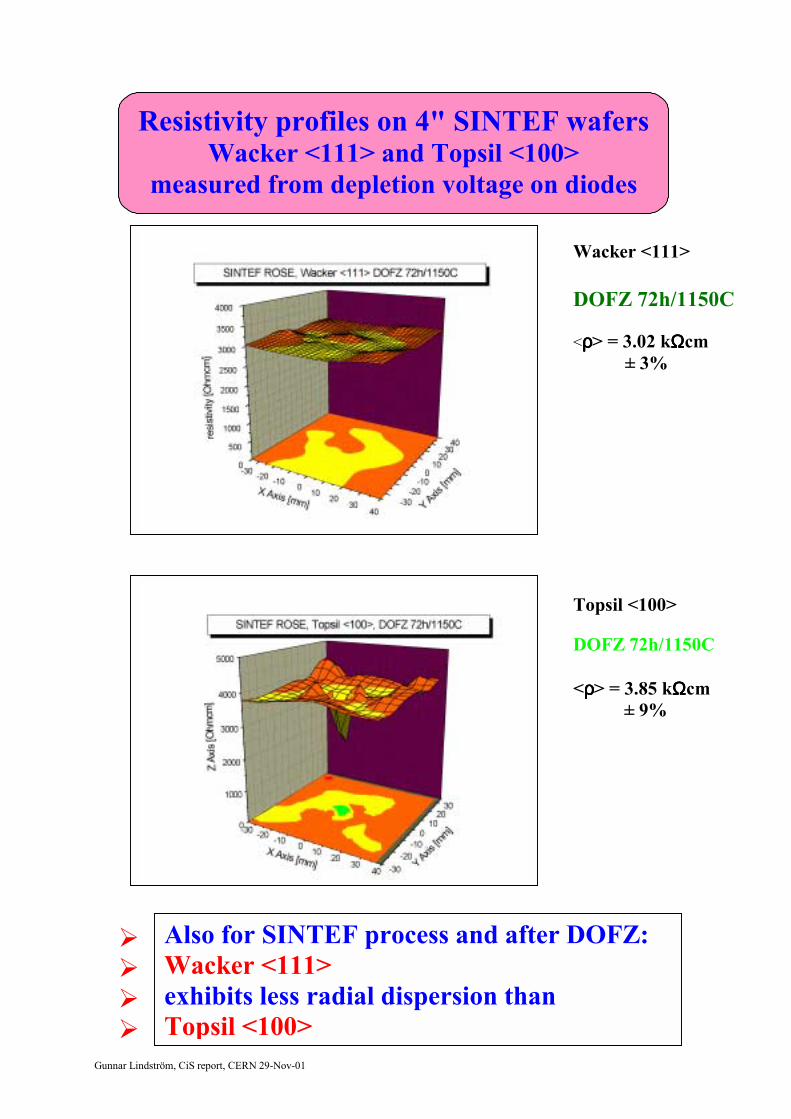
Wacker <111>
DOFZ 72h/1150C
<ρρρρ> = 3.02 kΩΩΩΩcm ± 3%
Topsil <100>
DOFZ 72h/1150C
<ρρρρ> = 3.85 kΩΩΩΩcm ± 9%
! ! ! !
Resistivity profiles on 4" SINTEF wafersWacker <111> and Topsil <100>
measured from depletion voltage on diodes
Also for SINTEF process and after DOFZ:Wacker <111>exhibits less radial dispersion thanTopsil <100>
Gunnar Lindström, CiS report, CERN 29-Nov-01
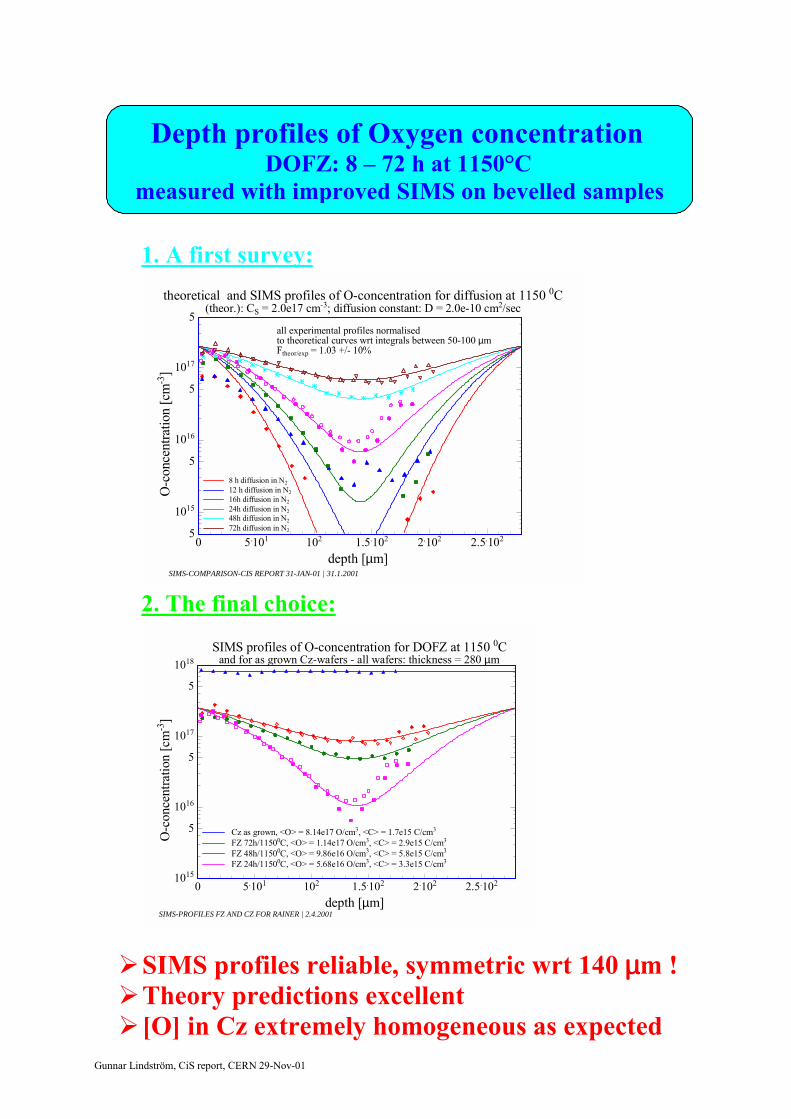
1. A first survey:
2. The final choice:
! SIMS profiles reliable, symmetric wrt 140 µµµµm !! Theory predictions excellent! [O] in Cz extremely homogeneous as expected
Depth profiles of Oxygen concentration DOFZ: 8 72 h at 1150°C
measured with improved SIMS on bevelled samples
0 5.101 102 1.5.102 2.102 2.5.102
depth [µm]
5
1015
5
1016
5
1017
5
O-c
once
ntra
tion
[cm
-3]
8 h diffusion in N28 h diffusion in N212 h diffusion in N212 h diffusion in N216h diffusion in N216h diffusion in N224h diffusion in N224h diffusion in N248h diffusion in N248h diffusion in N272h diffusion in N272h diffusion in N2
all experimental profiles normalised all experimental profiles normalised to theoretical curves wrt integrals between 50-100 µmto theoretical curves wrt integrals between 50-100 µmFtheor/exp = 1.03 +/- 10%Ftheor/exp = 1.03 +/- 10%
theoretical and SIMS profiles of O-concentration for diffusion at 1150 0C(theor.): CS = 2.0e17 cm-3; diffusion constant: D = 2.0e-10 cm2/sec
SIMS-COMPARISON-CIS REPORT 31-JAN-01 | 31.1.2001
0 5.101 102 1.5.102 2.102 2.5.102
depth [µm]
1015
5
1016
5
1017
5
1018
O-c
once
ntra
tion
[cm
-3]
Cz as grown, <O> = 8.14e17 O/cm3, <C> = 1.7e15 C/cm3Cz as grown, <O> = 8.14e17 O/cm3, <C> = 1.7e15 C/cm3
FZ 72h/11500C, <O> = 1.14e17 O/cm3, <C> = 2.9e15 C/cm3FZ 72h/11500C, <O> = 1.14e17 O/cm3, <C> = 2.9e15 C/cm3
FZ 48h/11500C, <O> = 9.86e16 O/cm3, <C> = 5.8e15 C/cm3FZ 48h/11500C, <O> = 9.86e16 O/cm3, <C> = 5.8e15 C/cm3
FZ 24h/11500C, <O> = 5.68e16 O/cm3, <C> = 3.3e15 C/cm3FZ 24h/11500C, <O> = 5.68e16 O/cm3, <C> = 3.3e15 C/cm3
SIMS profiles of O-concentration for DOFZ at 1150 0Cand for as grown Cz-wafers - all wafers: thickness = 280 µm
SIMS-PROFILES FZ AND CZ FOR RAINER | 2.4.2001
Gunnar Lindström, CiS report, CERN 29-Nov-01
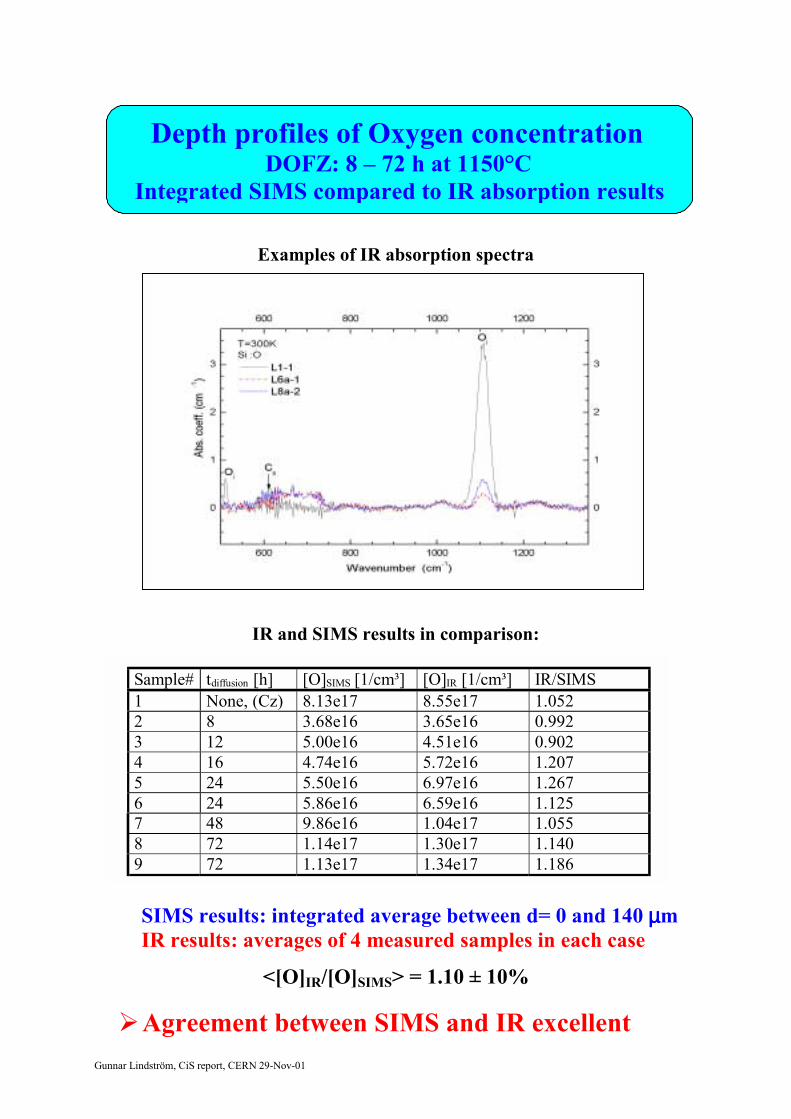
Examples of IR absorption spectra
IR and SIMS results in comparison:
SIMS results: integrated average between d= 0 and 140 µµµµmIR results: averages of 4 measured samples in each case
<[O]IR/[O]SIMS> = 1.10 ± 10%
! Agreement between SIMS and IR excellent
Depth profiles of Oxygen concentration DOFZ: 8 72 h at 1150°C
Integrated SIMS compared to IR absorption results
Sample# t diffusion [h] [O] SIMS [1/cm³] [O] IR [1/cm³] IR/SIMS 1 None, (Cz) 8.13e17 8.55e17 1.052 2 8 3.68e16 3.65e16 0.992 3 12 5.00e16 4.51e16 0.902 4 16 4.74e16 5.72e16 1.207 5 24 5.50e16 6.97e16 1.267 6 24 5.86e16 6.59e16 1.125 7 48 9.86e16 1.04e17 1.055 8 72 1.14e17 1.30e17 1.140 9 72 1.13e17 1.34e17 1.186
Gunnar Lindström, CiS report, CERN 29-Nov-01
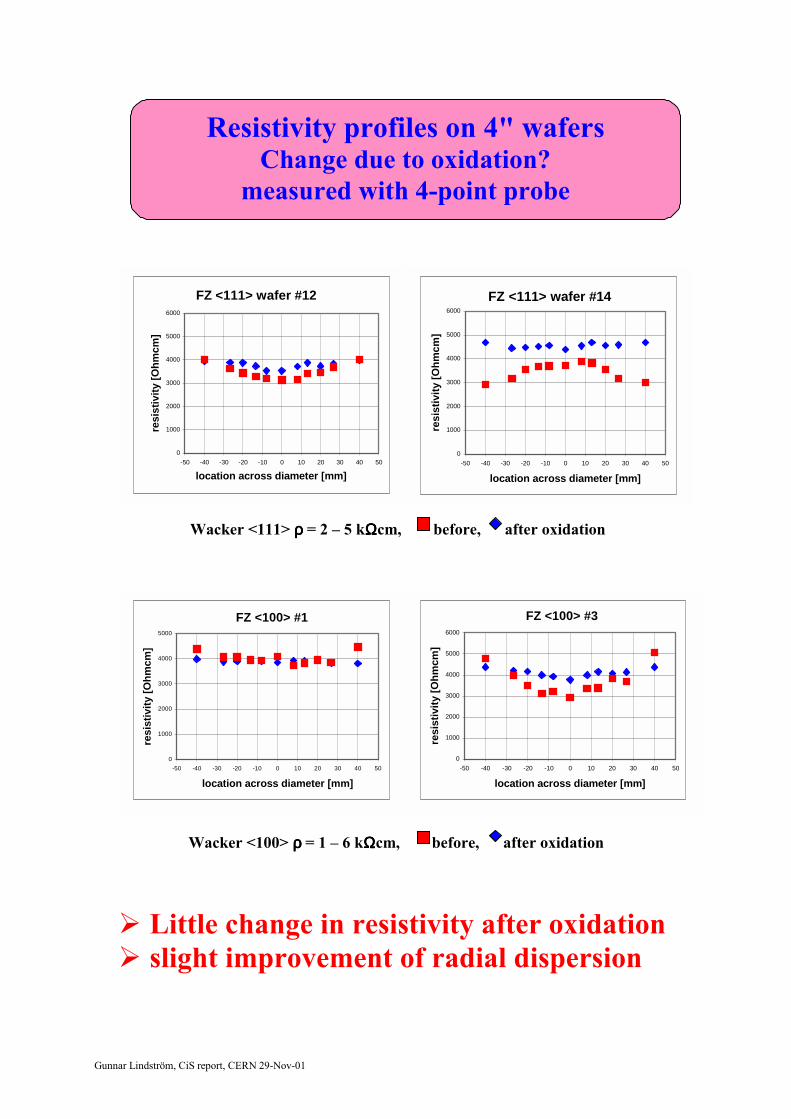
Wacker <111> ρρρρ = 2 5 kΩΩΩΩcm, before, after oxidation
Wacker <100> ρρρρ = 1 6 kΩΩΩΩcm, before, after oxidation
! Little change in resistivity after oxidation! slight improvement of radial dispersion
Resistivity profiles on 4" wafersChange due to oxidation?
measured with 4-point probe
FZ <111> wafer #12
0
1000
2000
3000
4000
5000
6000
-50 -40 -30 -20 -10 0 10 20 30 40 50
location across diameter [mm]
resi
stiv
ity [O
hmcm
]
FZ <111> wafer #14
0
1000
2000
3000
4000
5000
6000
-50 -40 -30 -20 -10 0 10 20 30 40 50
location across diameter [mm]
resi
stiv
ity [O
hmcm
]
FZ <100> #3
0
1000
2000
3000
4000
5000
6000
-50 -40 -30 -20 -10 0 10 20 30 40 50
location across diameter [mm]
resi
stiv
ity [O
hmcm
]
FZ <100> #1
0
1000
2000
3000
4000
5000
-50 -40 -30 -20 -10 0 10 20 30 40 50
location across diameter [mm]
resi
stiv
ity [O
hmcm
]
Gunnar Lindström, CiS report, CERN 29-Nov-01
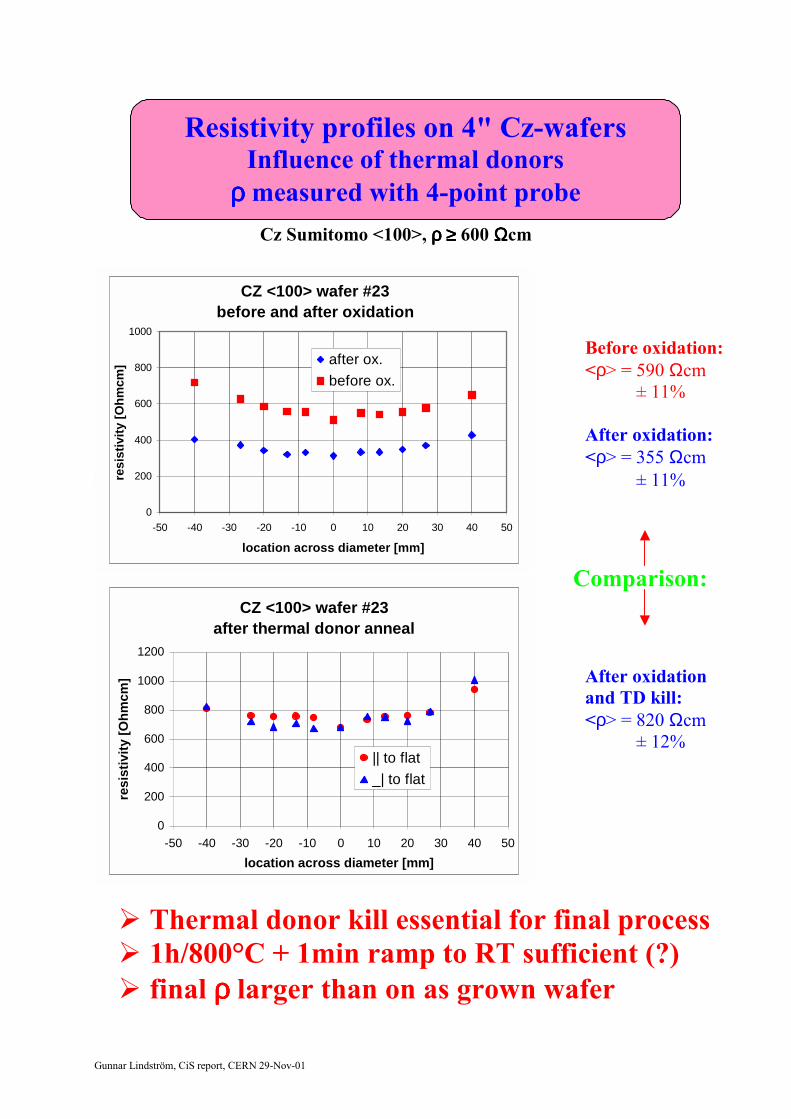
Cz Sumitomo <100>, ρρρρ ≥≥≥≥ 600 ΩΩΩΩcm
Before oxidation:<ρ> = 590 Ωcm
± 11%
After oxidation:<ρ> = 355 Ωcm
kΩcm kΩcm ± 11%
Comparison:
After oxidationand TD kill:<ρ> = 820 Ωcm ± 12%
! Thermal donor kill essential for final process! 1h/800°C + 1min ramp to RT sufficient (?)! final ρρρρ larger than on as grown wafer
Resistivity profiles on 4" Cz-wafersInfluence of thermal donors
ρρρρ measured with 4-point probe
CZ <100> wafer #23before and after oxidation
0
200
400
600
800
1000
-50 -40 -30 -20 -10 0 10 20 30 40 50
location across diameter [mm]
resi
stiv
ity [O
hmcm
] after ox. before ox.
CZ <100> wafer #23after thermal donor anneal
0
200
400
600
800
1000
1200
-50 -40 -30 -20 -10 0 10 20 30 40 50location across diameter [mm]
resi
stiv
ity [O
hmcm
]
|| to flat_| to flat
Gunnar Lindström, CiS report, CERN 29-Nov-01
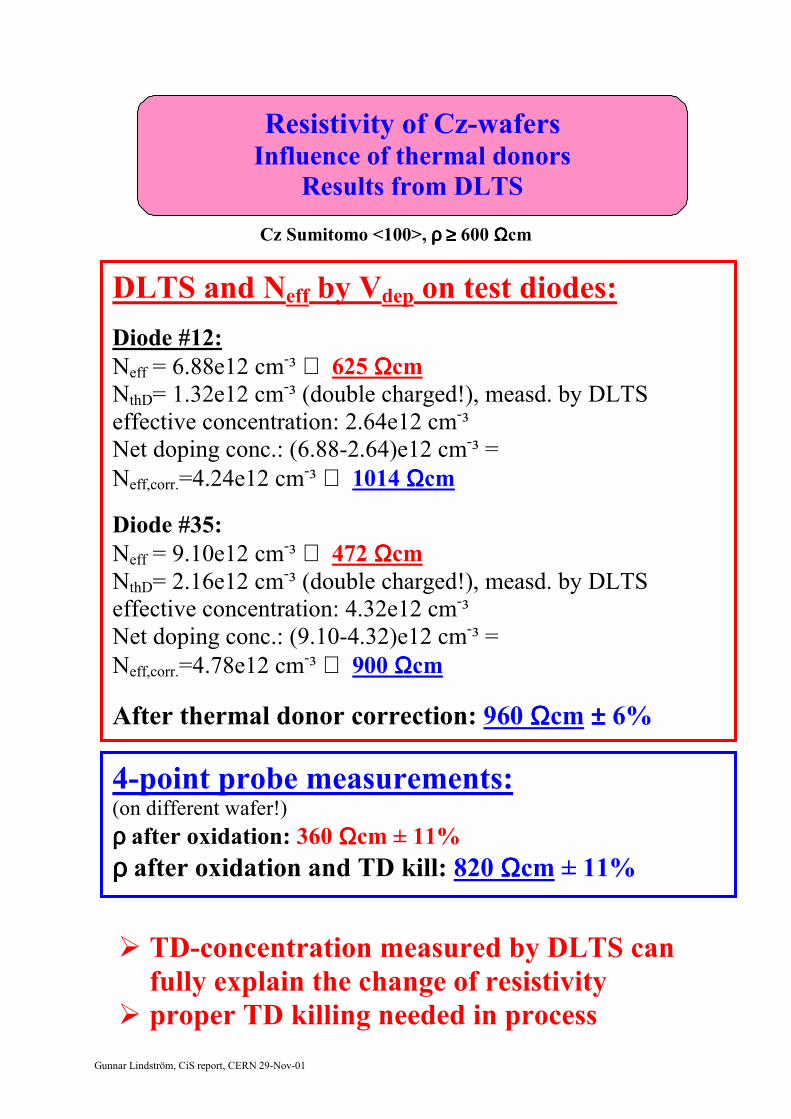
Cz Sumitomo <100>, ρρρρ ≥≥≥≥ 600 ΩΩΩΩcm
! TD-concentration measured by DLTS can fully explain the change of resistivity
! proper TD killing needed in process
DLTS and Neff by Vdep on test diodes:Diode #12:Neff = 6.88e12 cm-³ ⇒ 625 ΩΩΩΩcmNthD= 1.32e12 cm-³ (double charged!), measd. by DLTSeffective concentration: 2.64e12 cm-³Net doping conc.: (6.88-2.64)e12 cm-³ =Neff,corr.=4.24e12 cm-³ ⇒ 1014 ΩΩΩΩcm
Diode #35:Neff = 9.10e12 cm-³ ⇒ 472 ΩΩΩΩcmNthD= 2.16e12 cm-³ (double charged!), measd. by DLTSeffective concentration: 4.32e12 cm-³Net doping conc.: (9.10-4.32)e12 cm-³ =Neff,corr.=4.78e12 cm-³ ⇒ 900 ΩΩΩΩcm
After thermal donor correction: 960 ΩΩΩΩcm ±±±± 6%
4-point probe measurements:(on different wafer!)ρρρρ after oxidation: 360 ΩΩΩΩcm ± 11%ρρρρ after oxidation and TD kill: 820 ΩΩΩΩcm ± 11%
Resistivity of Cz-wafersInfluence of thermal donors
Results from DLTS
Gunnar Lindström, CiS report, CERN 29-Nov-01
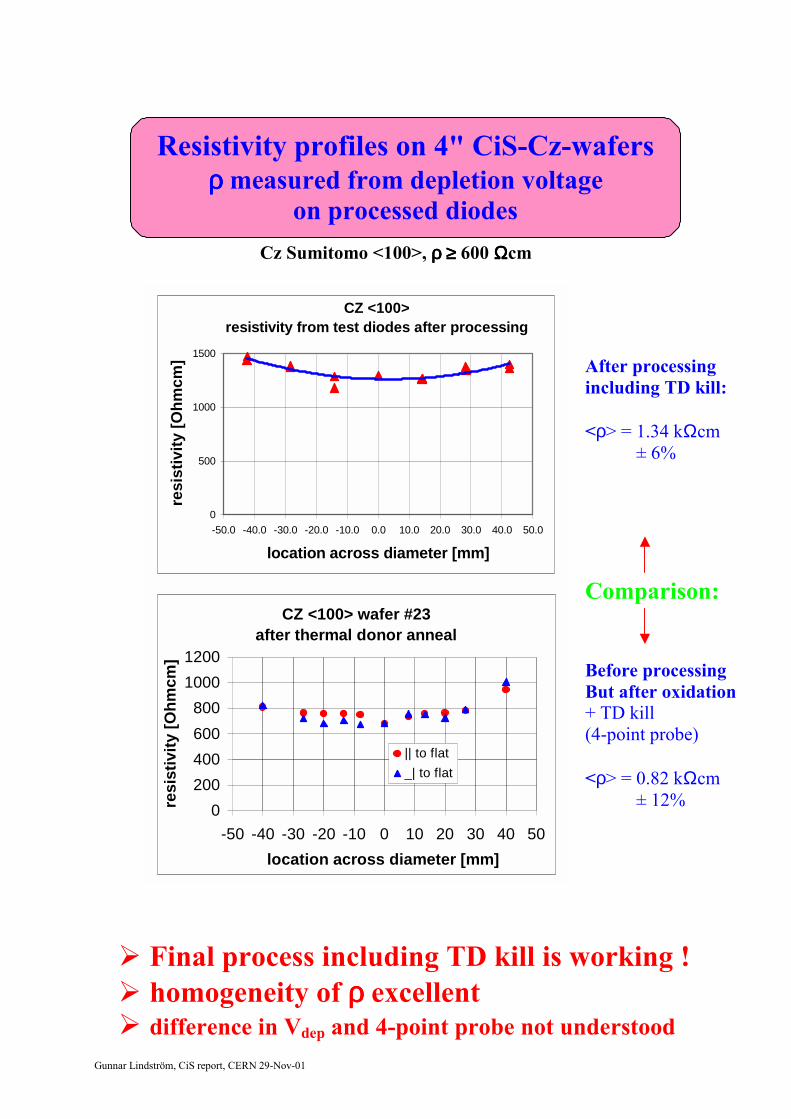
Cz Sumitomo <100>, ρρρρ ≥≥≥≥ 600 ΩΩΩΩcm
After processing including TD kill:
<ρ> = 1.34 kΩcm ± 6%
Comparison:
Before processingBut after oxidation+ TD kill(4-point probe)
<ρ> = 0.82 kΩcm ± 12%
! Final process including TD kill is working !! homogeneity of ρρρρ excellent! difference in Vdep and 4-point probe not understood
Resistivity profiles on 4" CiS-Cz-wafersρρρρ measured from depletion voltage
on processed diodes
CZ <100> wafer #23after thermal donor anneal
0200400600800
10001200
-50 -40 -30 -20 -10 0 10 20 30 40 50location across diameter [mm]
resi
stiv
ity [O
hmcm
]
|| to flat_| to flat
CZ <100> resistivity from test diodes after processing
0
500
1000
1500
-50.0 -40.0 -30.0 -20.0 -10.0 0.0 10.0 20.0 30.0 40.0 50.0
location across diameter [mm]
resi
stiv
ity [O
hmcm
]
Gunnar Lindström, CiS report, CERN 29-Nov-01
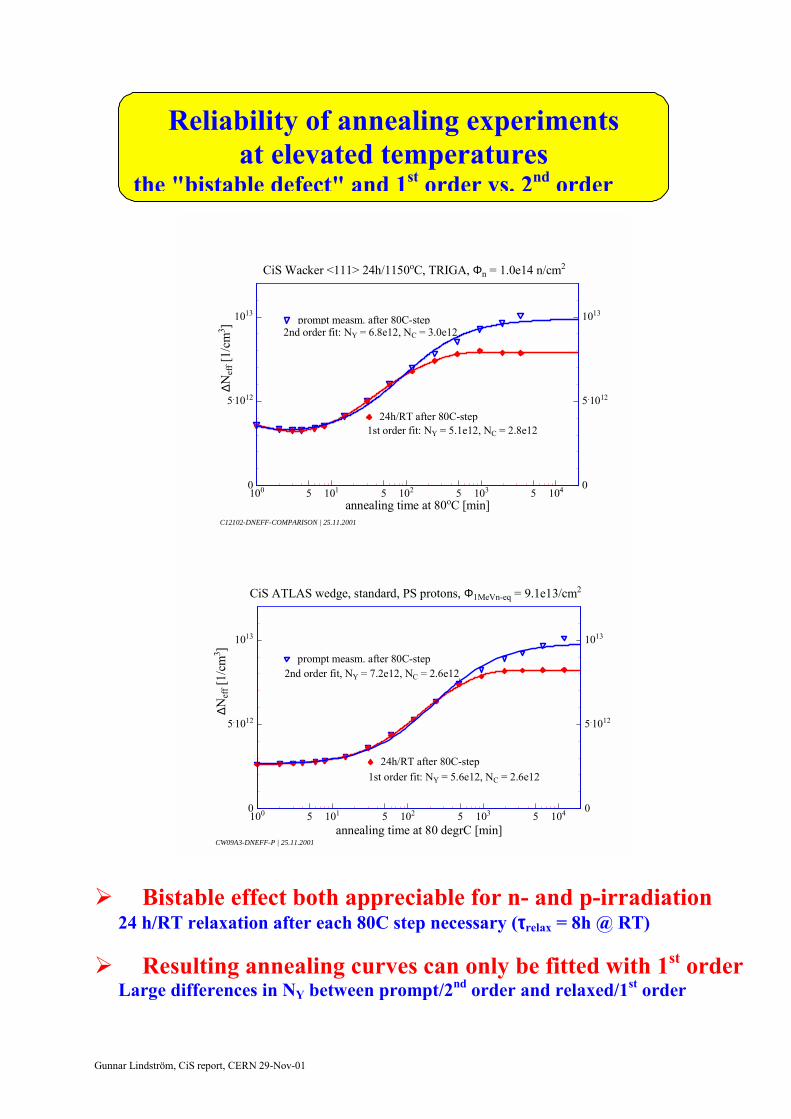
! Bistable effect both appreciable for n- and p-irradiation24 h/RT relaxation after each 80C step necessary (ττττrelax = 8h @ RT)
! Resulting annealing curves can only be fitted with 1st orderLarge differences in NY between prompt/2nd order and relaxed/1st order
Reliability of annealing experimentsat elevated temperatures
the "bistable defect" and 1st order vs. 2nd order
100 5 101 5 102 5 103 5 104
annealing time at 80 degrC [min]
0
5.1012
1013
∆Nef
f [1/
cm3 ]
0
5.1012
1013
prompt measm. after 80C-stepprompt measm. after 80C-step2nd order fit, NY = 7.2e12, NC = 2.6e122nd order fit, NY = 7.2e12, NC = 2.6e12
24h/RT after 80C-step24h/RT after 80C-step1st order fit: NY = 5.6e12, NC = 2.6e121st order fit: NY = 5.6e12, NC = 2.6e12
CiS ATLAS wedge, standard, PS protons, Φ1MeVn-eq = 9.1e13/cm2
CW09A3-DNEFF-P | 25.11.2001
100 5 101 5 102 5 103 5 104
annealing time at 80oC [min]
0
5.1012
1013
∆Nef
f [1/
cm3 ]
0
5.1012
1013prompt measm. after 80C-stepprompt measm. after 80C-step
2nd order fit: NY = 6.8e12, NC = 3.0e122nd order fit: NY = 6.8e12, NC = 3.0e12
24h/RT after 80C-step24h/RT after 80C-step1st order fit: NY = 5.1e12, NC = 2.8e121st order fit: NY = 5.1e12, NC = 2.8e12
CiS Wacker <111> 24h/1150oC, TRIGA, Φn = 1.0e14 n/cm2
C12102-DNEFF-COMPARISON | 25.11.2001
Gunnar Lindström, CiS report, CERN 29-Nov-01
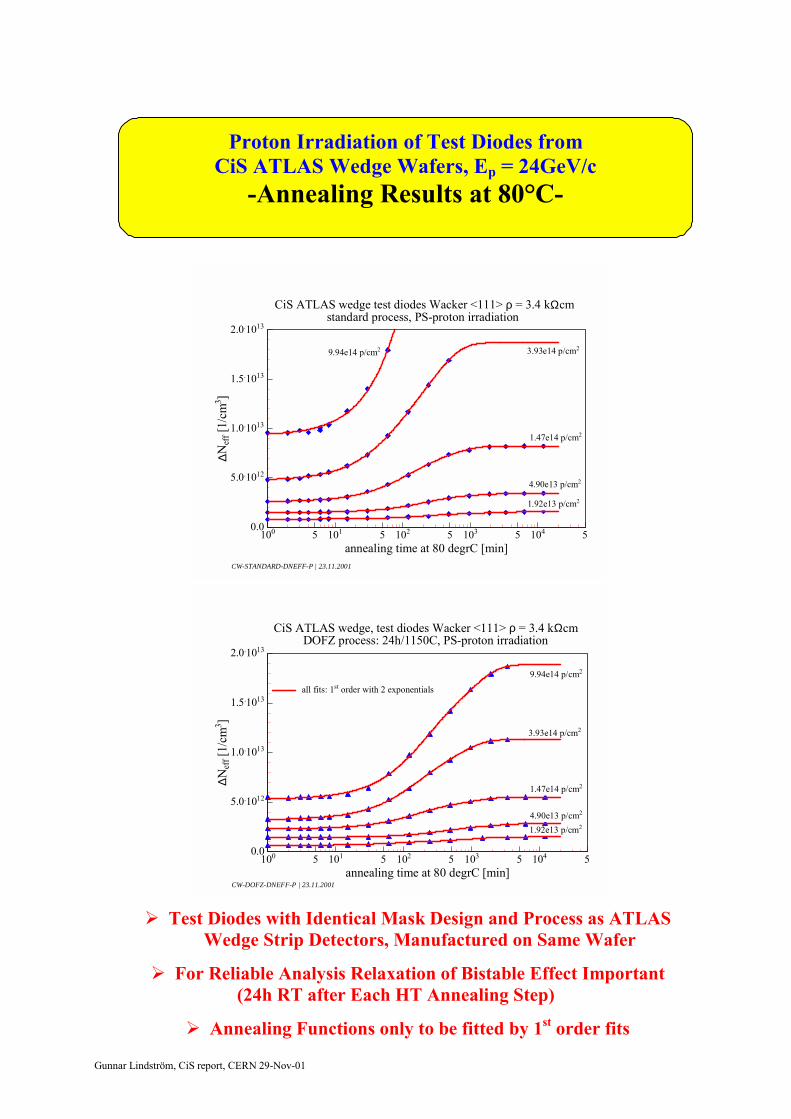
! Test Diodes with Identical Mask Design and Process as ATLASWedge Strip Detectors, Manufactured on Same Wafer
! For Reliable Analysis Relaxation of Bistable Effect Important(24h RT after Each HT Annealing Step)
! Annealing Functions only to be fitted by 1st order fits
Proton Irradiation of Test Diodes fromCiS ATLAS Wedge Wafers, Ep = 24GeV/c
-Annealing Results at 80°C-
100 5 101 5 102 5 103 5 104 5annealing time at 80 degrC [min]
0.0
5.0.1012
1.0.1013
1.5.1013
2.0.1013
∆Nef
f [1/
cm3 ]
1.92e13 p/cm21.92e13 p/cm2
4.90e13 p/cm24.90e13 p/cm2
1.47e14 p/cm21.47e14 p/cm2
3.93e14 p/cm23.93e14 p/cm29.94e14 p/cm29.94e14 p/cm2
CiS ATLAS wedge test diodes Wacker <111> ρ = 3.4 kΩcmstandard process, PS-proton irradiation
CW-STANDARD-DNEFF-P | 23.11.2001
100 5 101 5 102 5 103 5 104 5annealing time at 80 degrC [min]
0.0
5.0.1012
1.0.1013
1.5.1013
2.0.1013
∆ Nef
f [1/
cm3 ]
1.92e13 p/cm21.92e13 p/cm2
all fits: 1st order with 2 exponentialsall fits: 1st order with 2 exponentials
9.94e14 p/cm29.94e14 p/cm2
3.93e14 p/cm23.93e14 p/cm2
1.47e14 p/cm21.47e14 p/cm2
4.90e13 p/cm24.90e13 p/cm2
CiS ATLAS wedge, test diodes Wacker <111> ρ = 3.4 kΩcmDOFZ process: 24h/1150C, PS-proton irradiation
CW-DOFZ-DNEFF-P | 23.11.2001
Gunnar Lindström, CiS report, CERN 29-Nov-01
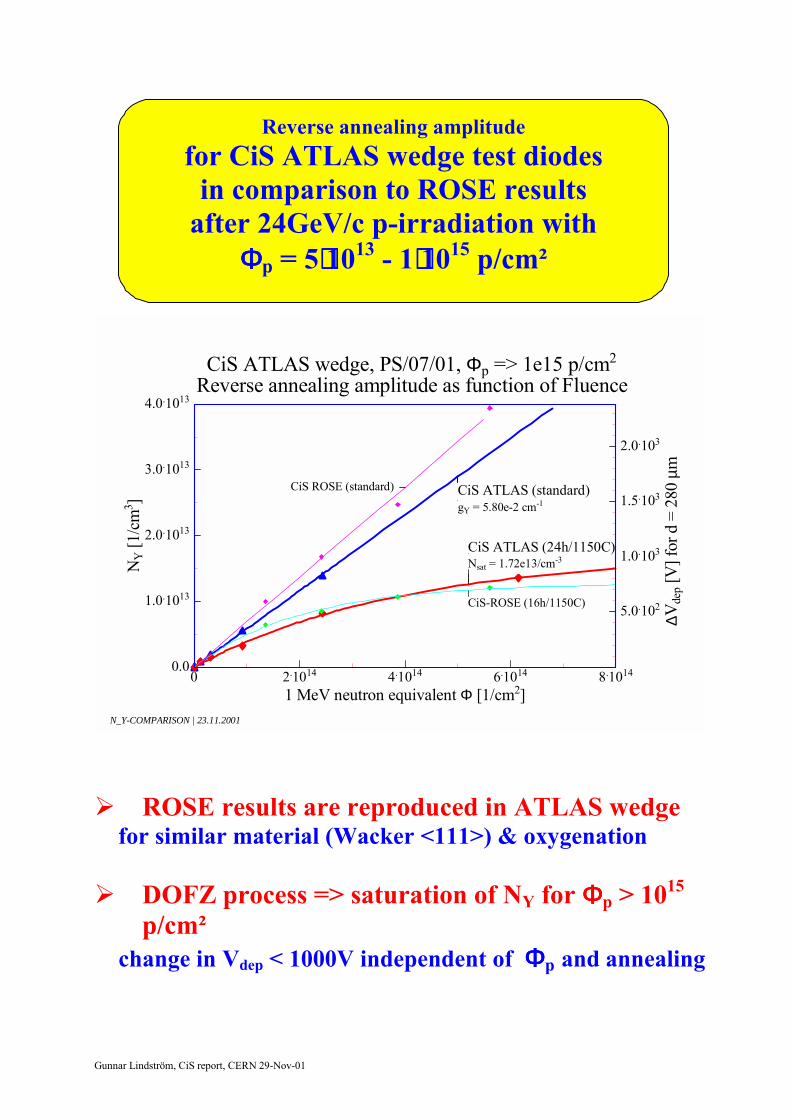
! ROSE results are reproduced in ATLAS wedgefor similar material (Wacker <111>) & oxygenation
! DOFZ process => saturation of NY for ΦΦΦΦp > 1015
p/cm² change in Vdep < 1000V independent of ΦΦΦΦp and annealing
Reverse annealing amplitudefor CiS ATLAS wedge test diodes
in comparison to ROSE resultsafter 24GeV/c p-irradiation with
ΦΦΦΦp = 5⋅⋅⋅⋅1013 - 1⋅⋅⋅⋅1015 p/cm²
0 2.1014 4.1014 6.1014 8.1014
1 MeV neutron equivalent Φ [1/cm2]
0.0
1.0.1013
2.0.1013
3.0.1013
4.0.1013
NY [1
/cm
3 ]
5.0.102
1.0.103
1.5.103
2.0.103
∆Vde
p [V
] for
d =
280
µm
gY = 5.80e-2 cm-1gY = 5.80e-2 cm-1CiS ATLAS (standard)CiS ATLAS (standard)
CiS ATLAS (24h/1150C)CiS ATLAS (24h/1150C)Nsat = 1.72e13/cm-3Nsat = 1.72e13/cm-3
CiS-ROSE (16h/1150C)CiS-ROSE (16h/1150C)
CiS ROSE (standard)CiS ROSE (standard)
CiS ATLAS wedge, PS/07/01, Φp => 1e15 p/cm2
Reverse annealing amplitude as function of Fluence
N_Y-COMPARISON | 23.11.2001
Gunnar Lindström, CiS report, CERN 29-Nov-01
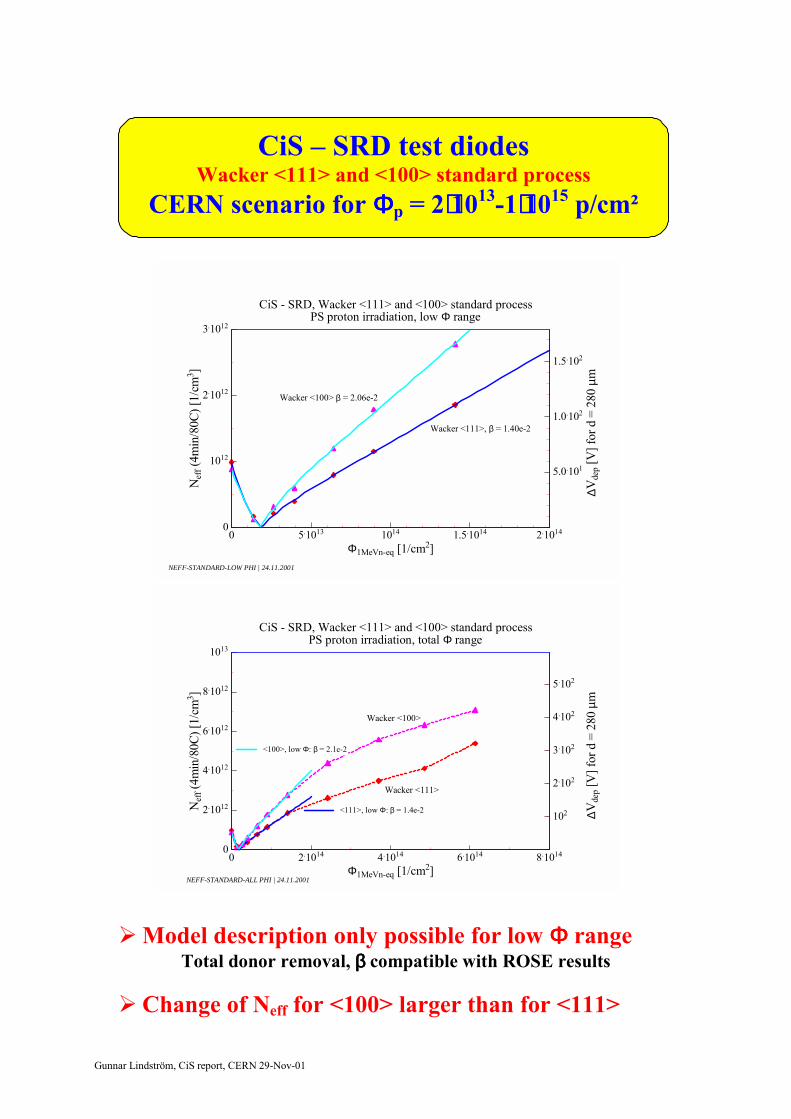
! Model description only possible for low ΦΦΦΦ rangeTotal donor removal, ββββ compatible with ROSE results
! Change of Neff for <100> larger than for <111>
CiS SRD test diodesWacker <111> and <100> standard process
CERN scenario for ΦΦΦΦp = 2⋅⋅⋅⋅1013-1⋅⋅⋅⋅1015 p/cm²
0 5.1013 1014 1.5.1014 2.1014
Φ1MeVn-eq [1/cm2]
0
1012
2.1012
3.1012
Nef
f (4m
in/8
0C) [
1/cm
3 ]
5.0.101
1.0.102
1.5.102
∆Vde
p [V
] for
d =
280
µm
Wacker <111>, β = 1.40e-2Wacker <111>, β = 1.40e-2
Wacker <100> β = 2.06e-2Wacker <100> β = 2.06e-2
CiS - SRD, Wacker <111> and <100> standard processPS proton irradiation, low Φ range
NEFF-STANDARD-LOW PHI | 24.11.2001
0 2.1014 4.1014 6.1014 8.1014
Φ1MeVn-eq [1/cm2]
0
2.1012
4.1012
6.1012
8.1012
1013
Nef
f (4m
in/8
0C) [
1/cm
3 ]
102
2.102
3.102
4.102
5.102
∆ Vde
p [V
] for
d =
280
µm
Wacker <111>Wacker <111>
<111>, low Φ: β = 1.4e-2<111>, low Φ: β = 1.4e-2
Wacker <100>Wacker <100>
<100>, low Φ: β = 2.1e-2<100>, low Φ: β = 2.1e-2
CiS - SRD, Wacker <111> and <100> standard processPS proton irradiation, total Φ range
NEFF-STANDARD-ALL PHI | 24.11.2001
Gunnar Lindström, CiS report, CERN 29-Nov-01
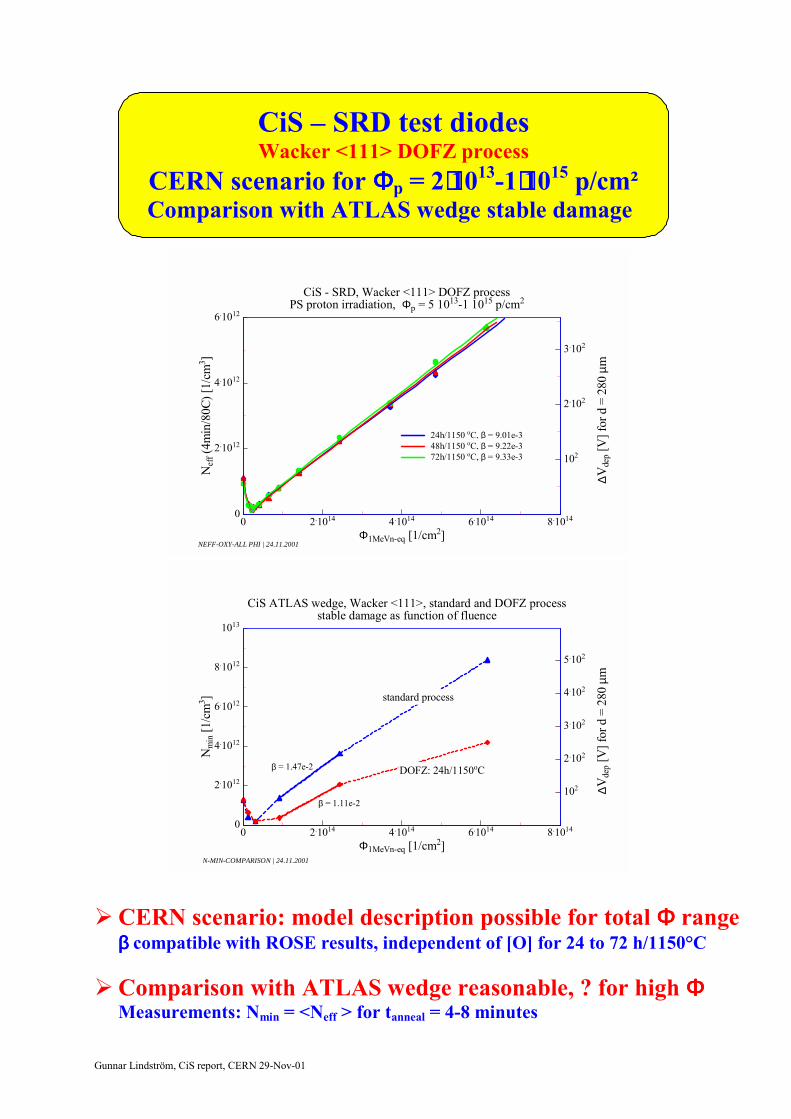
! CERN scenario: model description possible for total ΦΦΦΦ rangeββββ compatible with ROSE results, independent of [O] for 24 to 72 h/1150°C
! Comparison with ATLAS wedge reasonable, ? for high ΦΦΦΦMeasurements: Nmin = <Neff > for tanneal = 4-8 minutes
CiS SRD test diodesWacker <111> DOFZ process
CERN scenario for ΦΦΦΦp = 2⋅⋅⋅⋅1013-1⋅⋅⋅⋅1015 p/cm² Comparison with ATLAS wedge stable damage
0 2.1014 4.1014 6.1014 8.1014
Φ1MeVn-eq [1/cm2]
0
2.1012
4.1012
6.1012
Nef
f (4m
in/8
0C) [
1/cm
3 ]
102
2.102
3.102
∆ Vde
p [V
] for
d =
280
µm
24h/1150 oC, β = 9.01e-324h/1150 oC, β = 9.01e-348h/1150 oC, β = 9.22e-348h/1150 oC, β = 9.22e-372h/1150 oC, β = 9.33e-372h/1150 oC, β = 9.33e-3
CiS - SRD, Wacker <111> DOFZ processPS proton irradiation, Φp = 5 1013-1 1015 p/cm2
NEFF-OXY-ALL PHI | 24.11.2001
0 2.1014 4.1014 6.1014 8.1014
Φ1MeVn-eq [1/cm2]
0
2.1012
4.1012
6.1012
8.1012
1013
Nm
in [1
/cm
3 ]
102
2.102
3.102
4.102
5.102
∆Vde
p [V
] for
d =
280
µm
standard processstandard process
DOFZ: 24h/1150oC DOFZ: 24h/1150oC β = 1.47e-2β = 1.47e-2
β = 1.11e-2β = 1.11e-2
CiS ATLAS wedge, Wacker <111>, standard and DOFZ processstable damage as function of fluence
N-MIN-COMPARISON | 24.11.2001
Gunnar Lindström, CiS report, CERN 29-Nov-01
This talk:• SRD project is getting under way!• Wacker FZ shows less ρρρρ dispersion than Topsil• Resistivity not affected by DOFZ process• New SIMS technique reliable, [O]-results ≡≡≡≡ IR• Reliable annealing only after relax of bistable defect• Analysis reveals 1st instead of previous 2nd order• Extracted parameters compatible with ROSE results• Cz can be used for processing taking care of TD
Many thanks to: M.Moll, M.Glaser (CERN), V. Cindro (JSI);E. Nossarzewska, B. Surma (ITME), A. Barcz (ITE) and M.Zielinski (SIMS Lab, Warsaw)
Further Results:• SIMS, see talk given by A. Barcz• Characterization of unirradiated diodes: J. Stahl• Co-60 gamma irradiation macroscopic: E. Fretwurst• Co-60 gamma irradiation microscopic: I. Pintilie
Summary
Top Related