

![[PPT]PowerPoint Presentation - ITU: Committed to … · Web viewLightning flashes provide a high current (hundreds kA) in a very short time (μs), releasing a very high power in the](https://static.fdocument.org/doc/165x107/5ad34fd37f8b9a482c8d7dce/pptpowerpoint-presentation-itu-committed-to-viewlightning-flashes-provide.jpg)


γλώσσες
Σελίδες
Νομικός

Phase Changes
Chapter 11
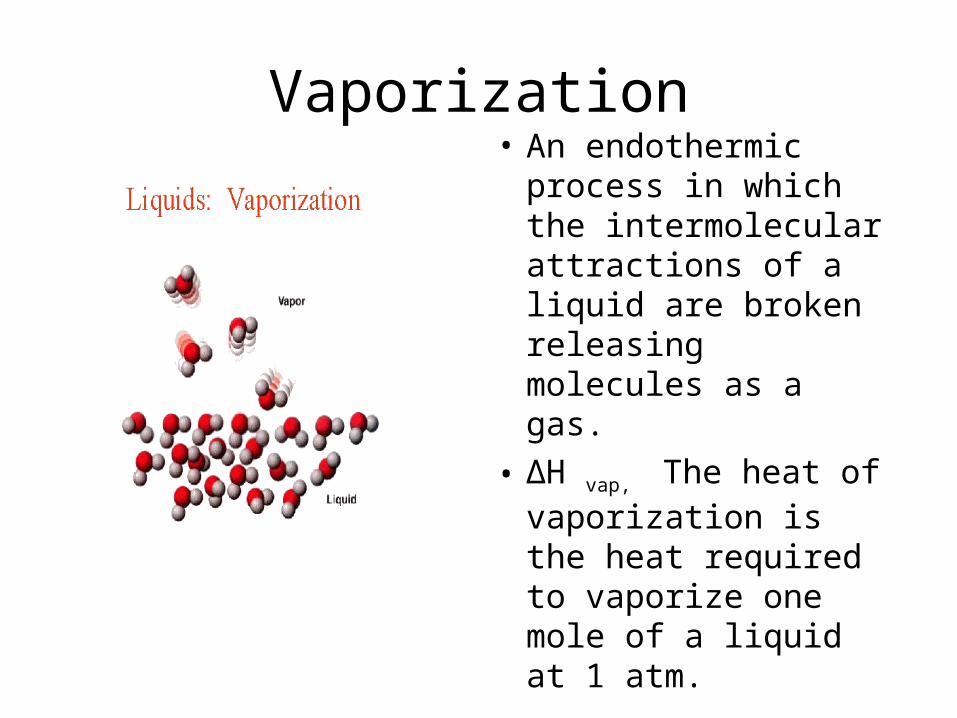
Vaporization• An endothermic
process in which the intermolecular attractions of a liquid are broken releasing molecules as a gas.
• ΔH vap, The heat of vaporization is the heat required to vaporize one mole of a liquid at 1 atm.
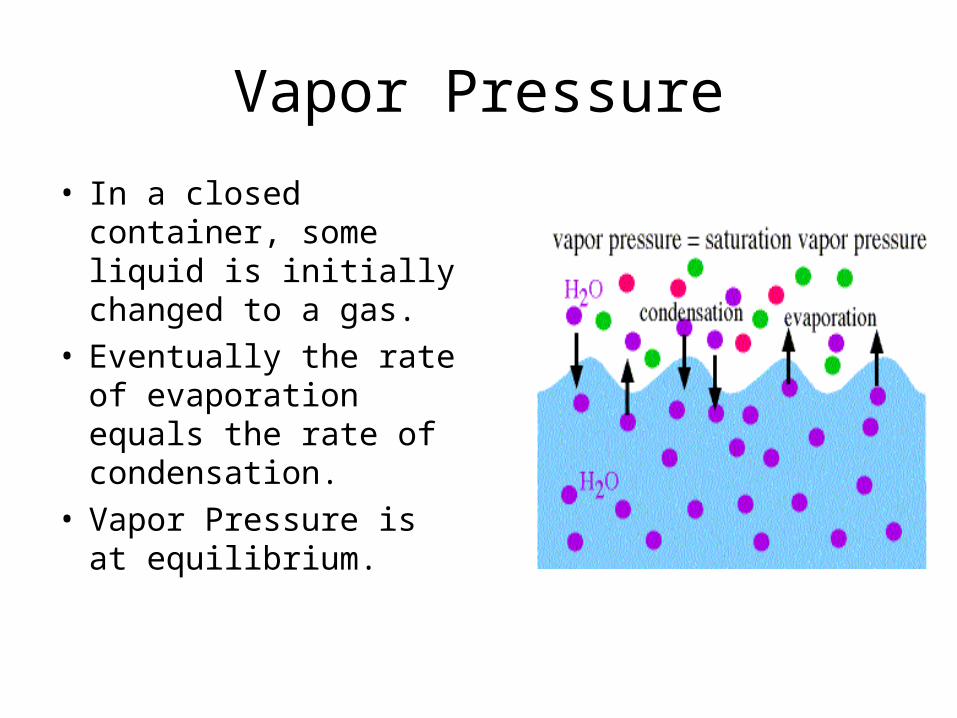
Vapor Pressure
• In a closed container, some liquid is initially changed to a gas.
• Eventually the rate of evaporation equals the rate of condensation.
• Vapor Pressure is at equilibrium.
Vapor Pressure
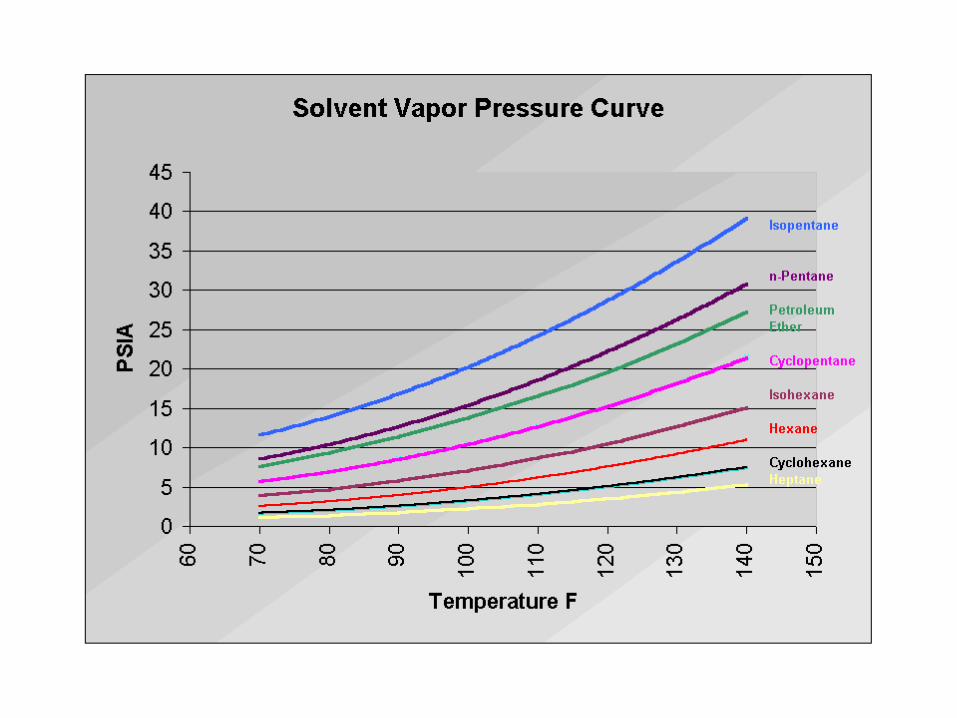
• Vapor pressure varies depending on the volatility of a liquid.
• Volatility is the ease of a liquid to form a gas.
• Liquids with low IMF’s have high volatility. Large molecules tend not to be volatile.
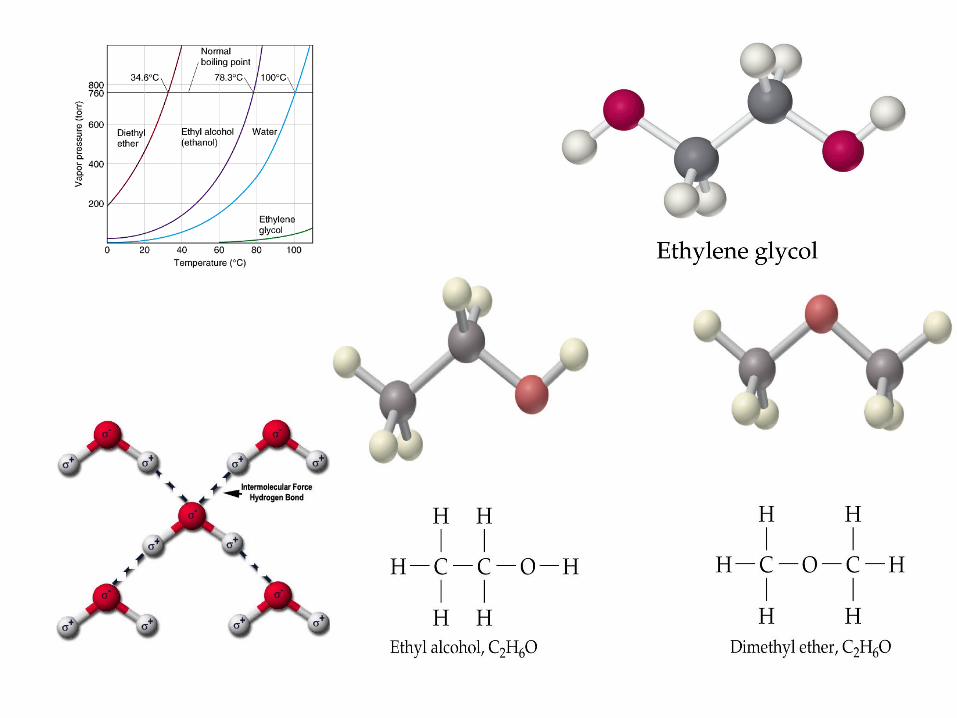
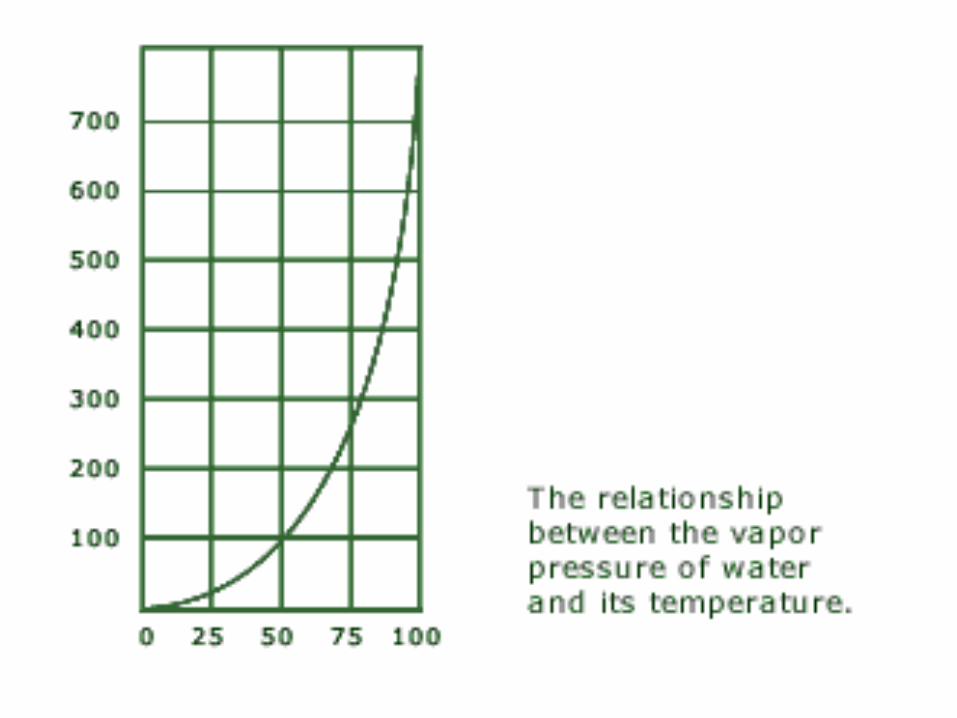
• Water is a small molecule, but is not highly volatile. Why?
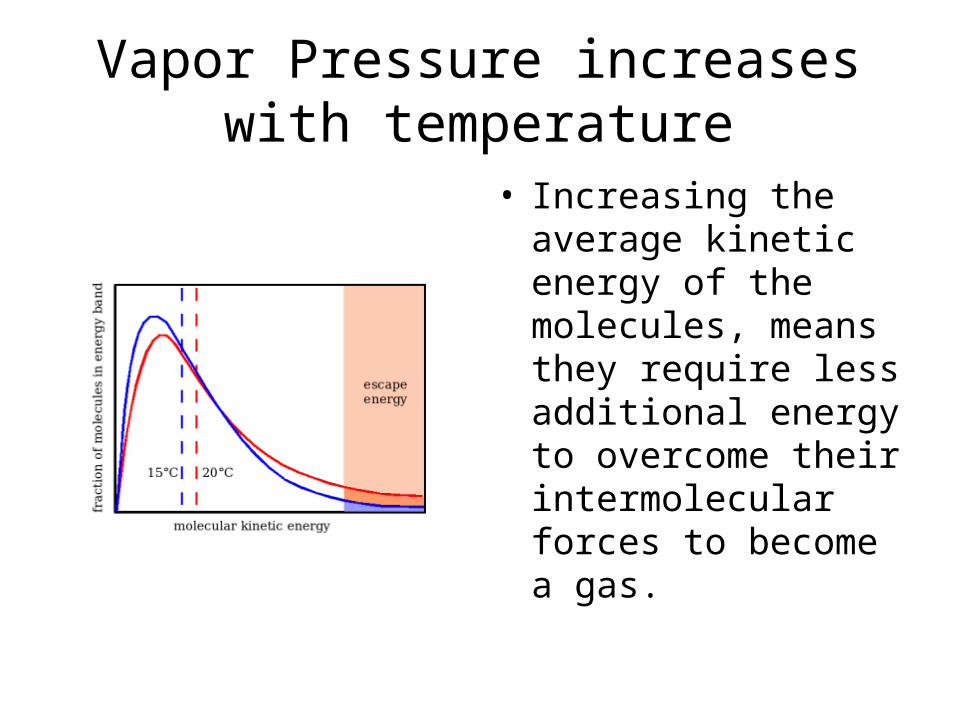
Vapor Pressure increases with temperature
• Increasing the average kinetic energy of the molecules, means they require less additional energy to overcome their intermolecular forces to become a gas.
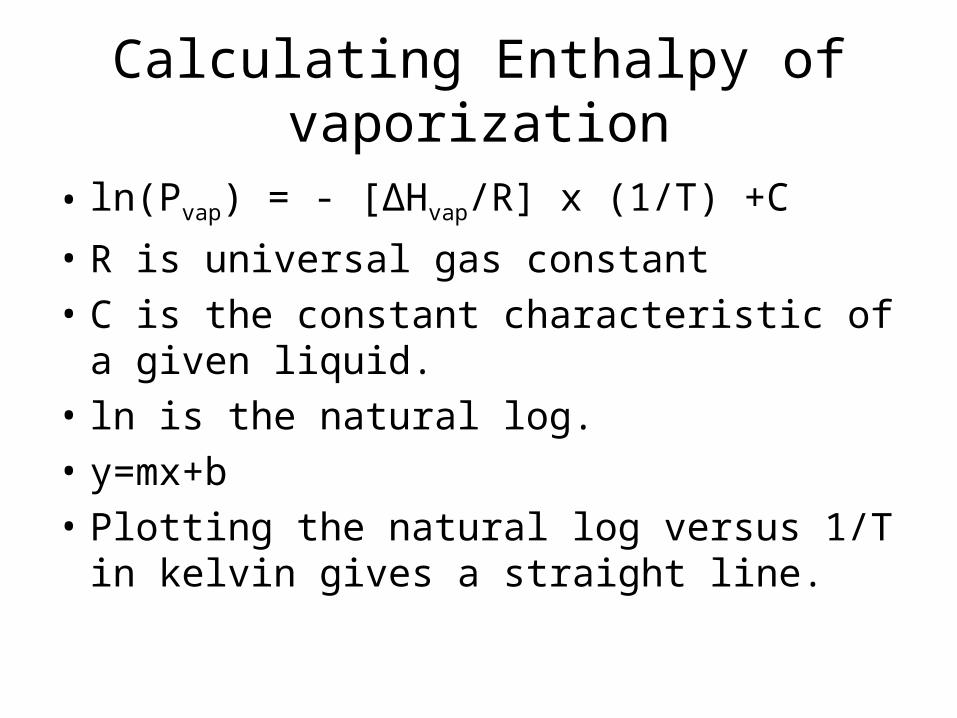
Calculating Enthalpy of vaporization
• ln(Pvap) = - [ΔHvap/R] x (1/T) +C
• R is universal gas constant
• C is the constant characteristic of a given liquid.
• ln is the natural log.
• y=mx+b
• Plotting the natural log versus 1/T in kelvin gives a straight line.
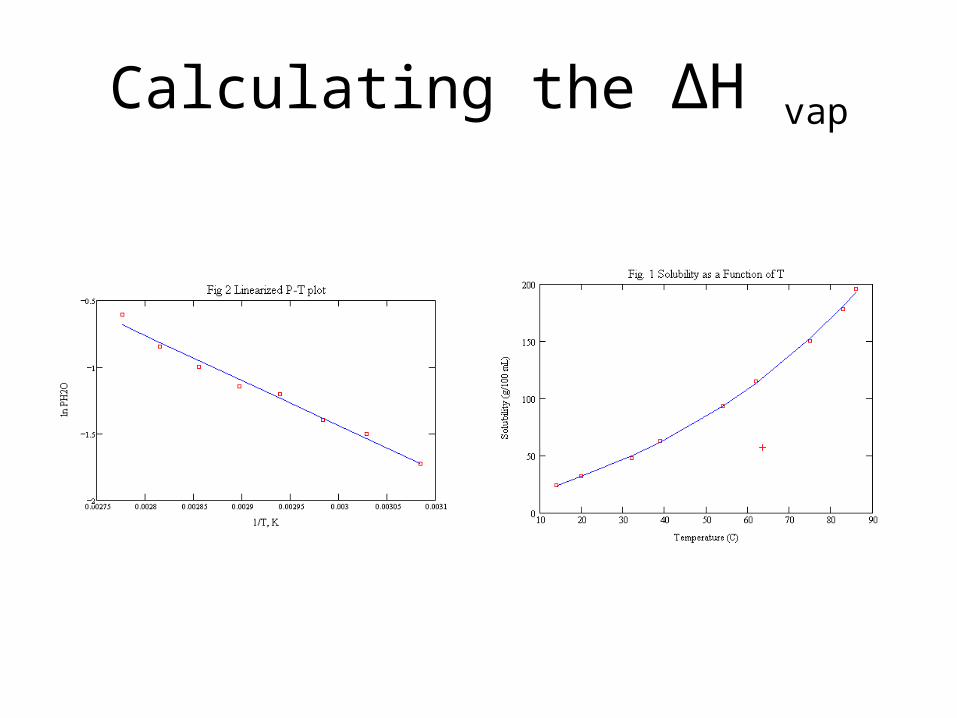
Calculating the ΔH vap
Changes of State
• Vaporization
• Condensation
• Fusion
• Solidification
• Sublimation
• Deposition
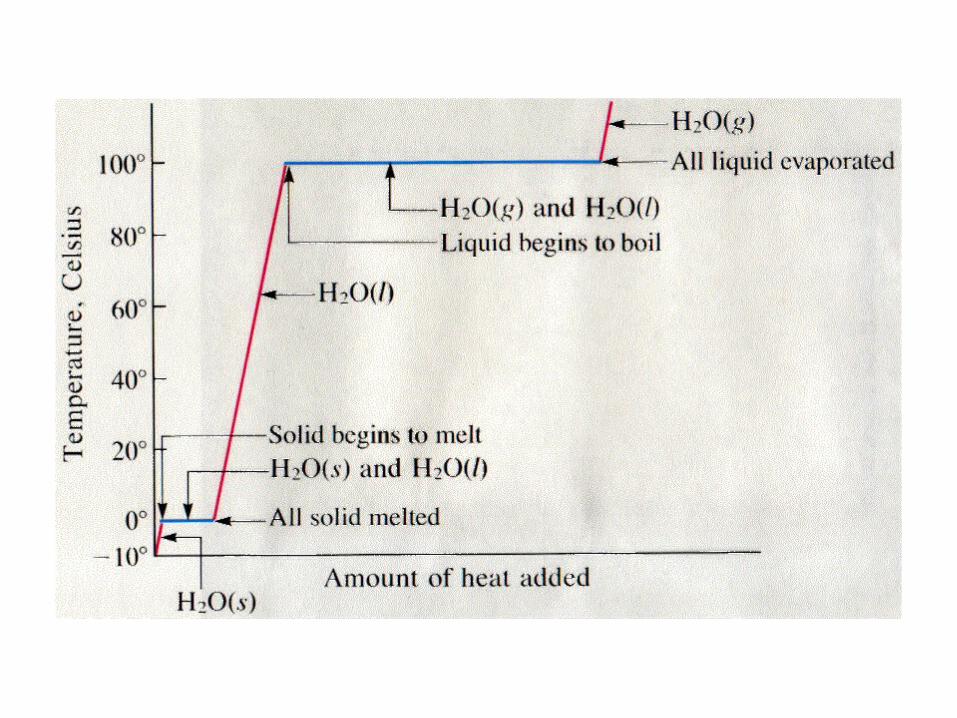
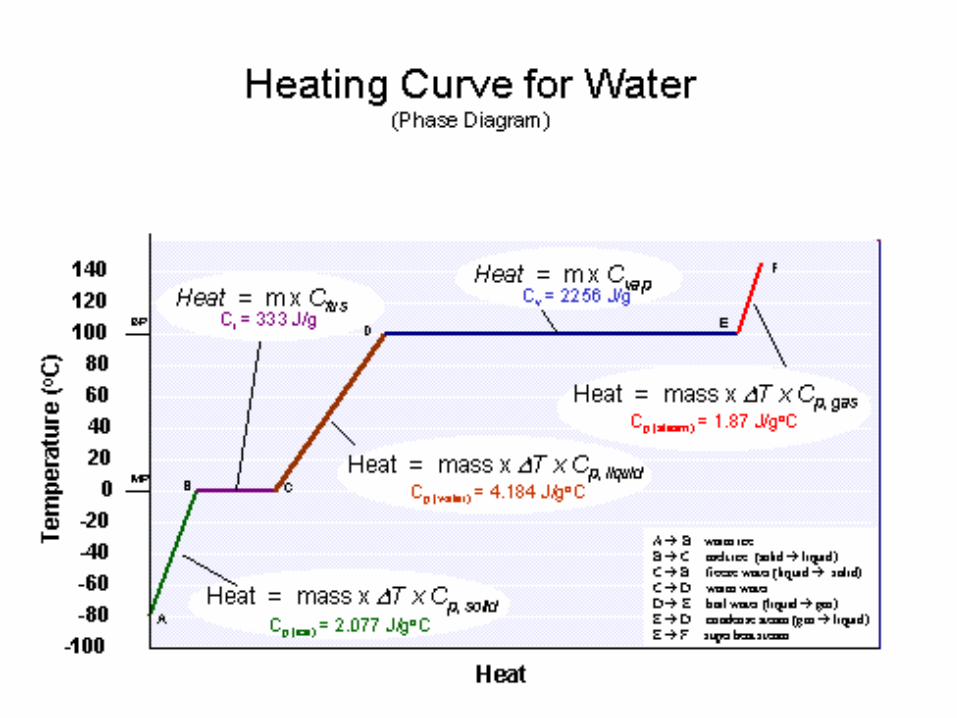
Heating curve
• Energy can be converted into a heat change of a substance.
• Energy is also required to change the state of a substance.
• This change in energy is plotted in a Heating Curve.
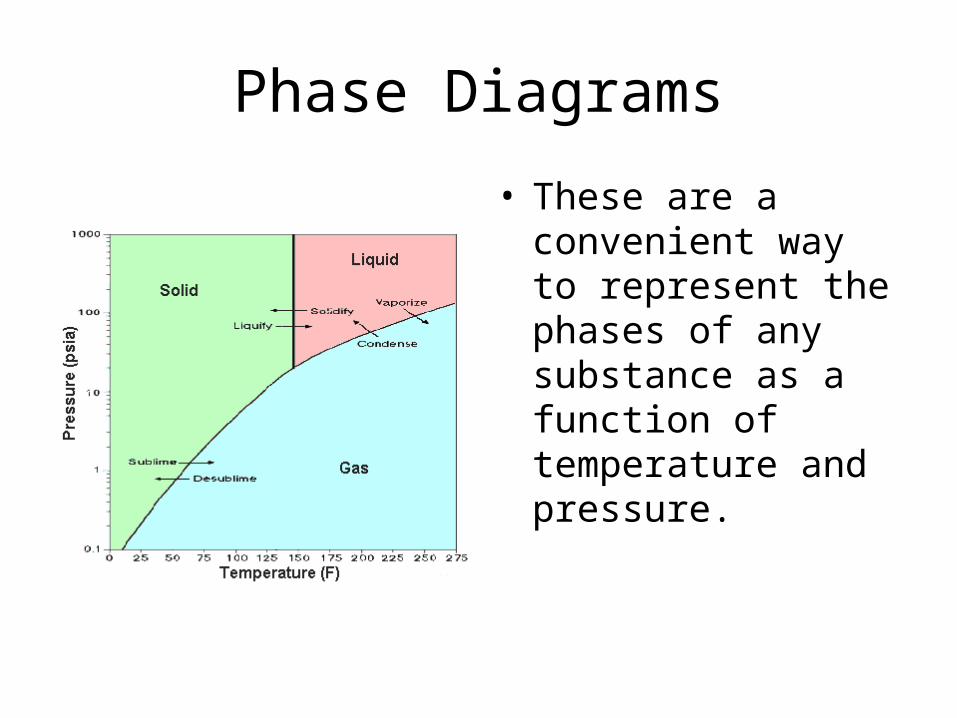
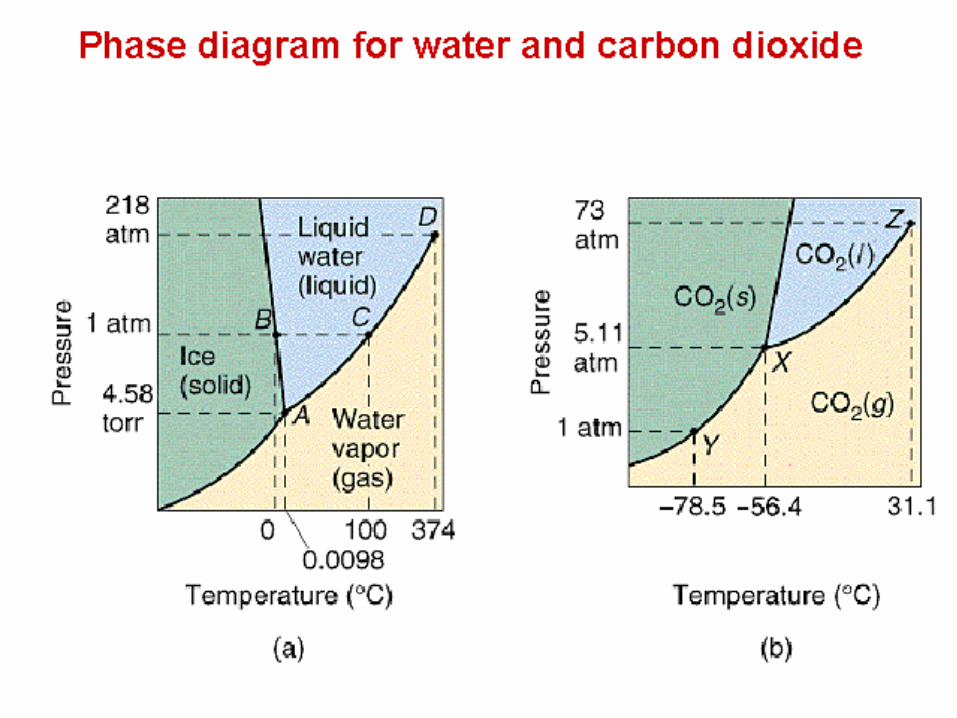
Phase Diagrams
• These are a convenient way to represent the phases of any substance as a function of temperature and pressure.
Phase Diagrams
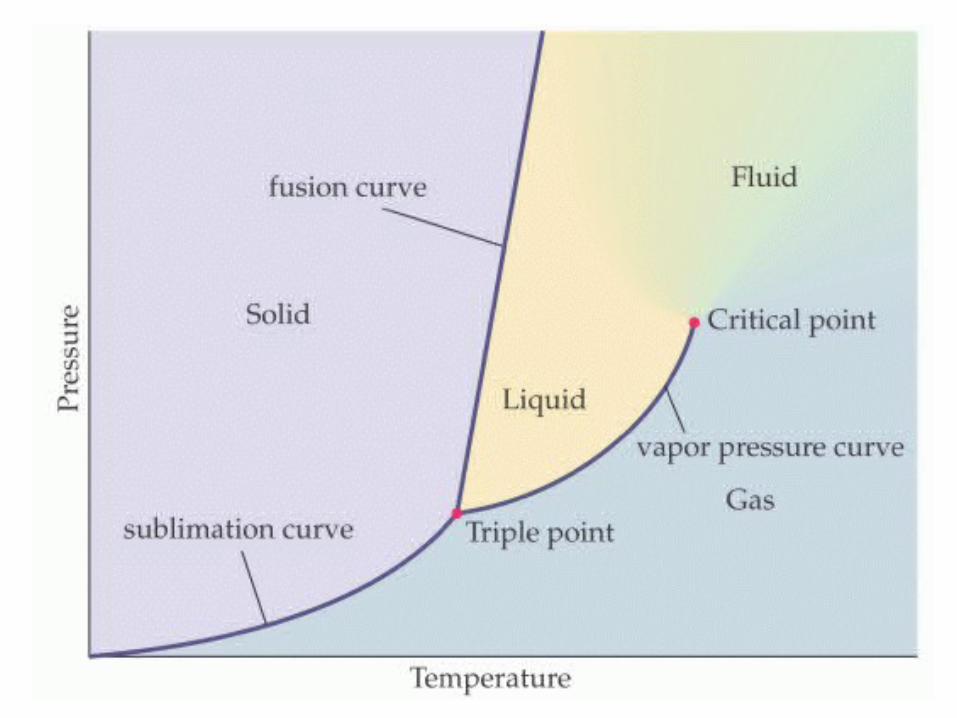
• The Triple Point is the temperature and pressure that a substance can exist as all three states of matter (solid, liquid and gas) as all three have the same vapor pressure.
• The Critical Temperature is defined as the temperature above which the vapor cannot exist as a liquid no matter what pressure is applied.
• The Critical Pressure is the pressure required to condense a vapor at the critical temperature.
• Together the critical temperature and critical pressure make the Critical Point.
• The melting point at 1 atm is the Normal Melting Point.
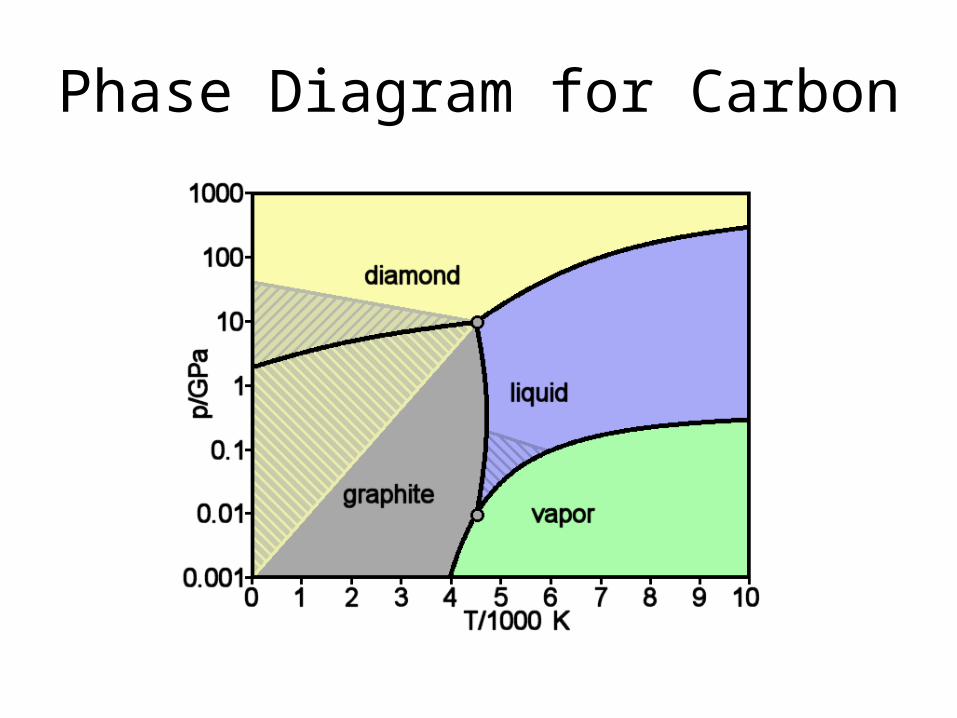
Phase Diagram for Carbon
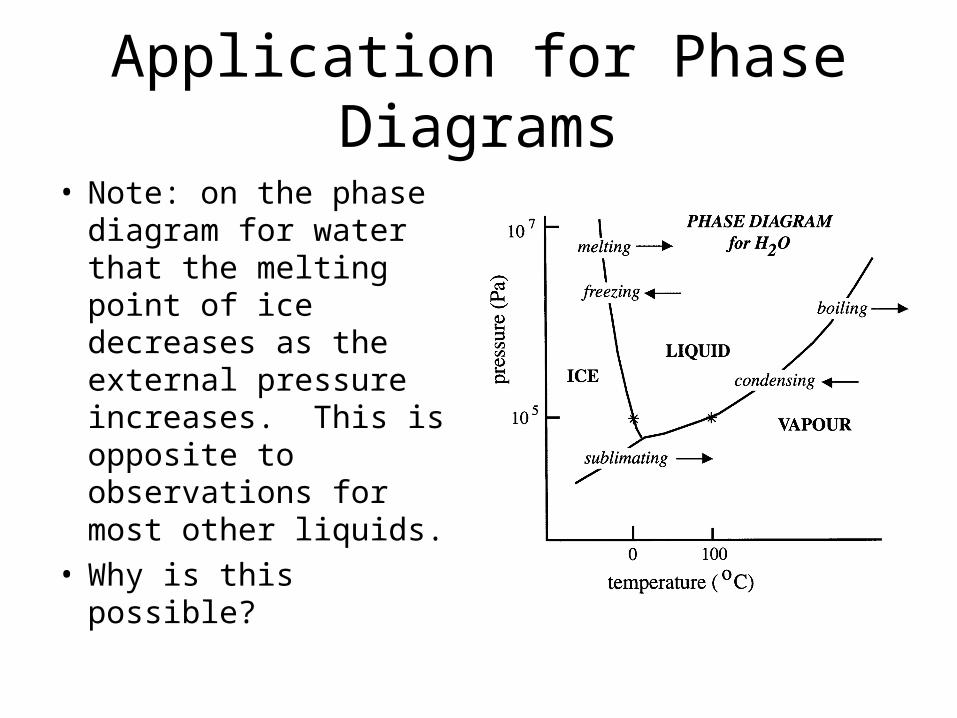
Application for Phase Diagrams
• Note: on the phase diagram for water that the melting point of ice decreases as the external pressure increases. This is opposite to observations for most other liquids.
• Why is this possible?
Phase Diagrams
• For ice skating, the narrow blade exerts a large external energy on the ice melting it beneath the blade, and refreezing as the blade leaves the surface. This allows the smooth gliding action.
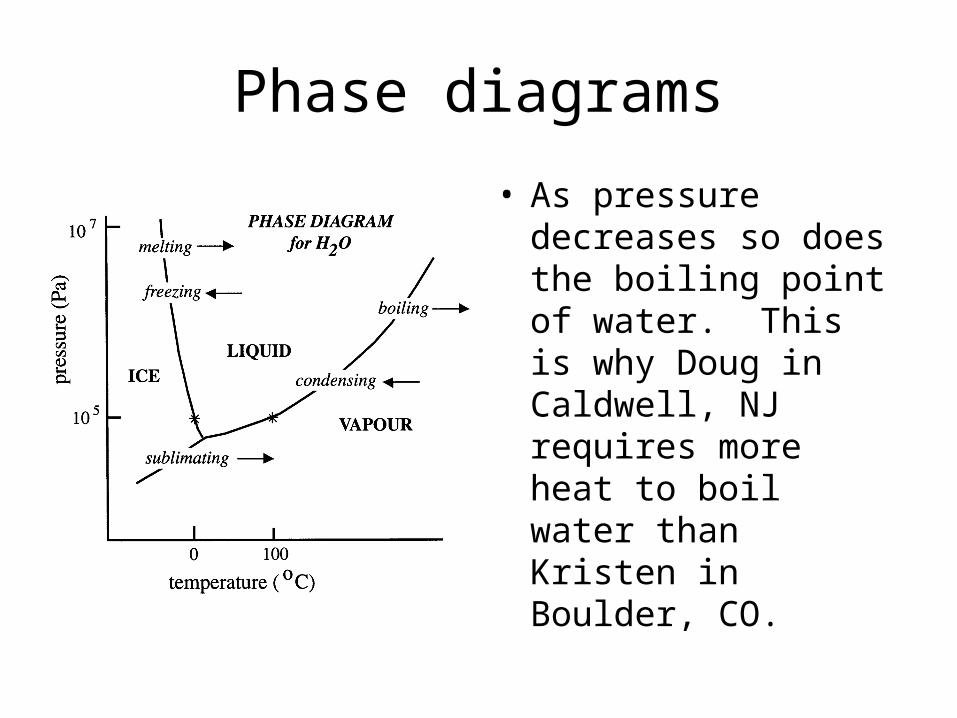
Phase diagrams
• As pressure decreases so does the boiling point of water. This is why Doug in Caldwell, NJ requires more heat to boil water than Kristen in Boulder, CO.
Top Related