


γλώσσες
Σελίδες
Νομικός

Peptide Secondary Structure Folding Reaction Coordinate: Correlation between UVRaman Amide III Frequency, Ψ Ramachandran Angle, and Hydrogen Bonding
Aleksandr V. Mikhonin, Sergei V. Bykov, Nataliya S. Myshakina, and Sanford A. Asher*Department of Chemistry, UniVersity of Pittsburgh, Pittsburgh, PennsylVania 15260
ReceiVed: August 15, 2005; In Final Form: NoVember 10, 2005
We used UV resonance Raman (UVRR) spectroscopy to quantitatively correlate the peptide bond AmIII3frequency to its Ψ Ramachandran angle and to the number and types of amide hydrogen bonds at differenttemperatures. This information allows us to develop a family of relationships to directly estimate the ΨRamachandran angle from measured UVRR AmIII3 frequencies for peptide bonds (PBs) with known hydrogenbonding (HB). These relationships ignore the more modest Φ Ramachandran angle dependence and allowdetermination of theΨ angle with a standard error of (8°, if the HB state of a PB is known. This is normallythe case if a known secondary structure motif is studied. Further, if the HB state of a PB in water is unknown,the extreme alterations in such a state could additionally bias the Ψ angle by (6°. The resulting ability tomeasure Ψ spectroscopically will enable new incisive protein conformational studies, especially in the fieldof protein folding. This is because any attempt to understand reaction mechanisms requires elucidation of therelevant reaction coordinate(s). The Ψ angle is precisely the reaction coordinate that determines secondarystructure changes. As shown elsewhere (Mikhonin et al. J. Am. Chem. Soc. 2005, 127, 7712), this correlationcan be used to determine portions of the energy landscape along the Ψ reaction coordinate.
Introduction
The various techniques of molecular spectroscopy constitutethe toolset used by scientists for investigating molecularconformations and reaction mechanisms. These various spec-troscopic techniques require quantitative correlations betweenthe spectral parameters measured and the molecular conforma-tional parameters. NMR and especially multidimensional NMRtechniques are certainly the most powerful spectroscopicmethods for solution studies.1-13 The origin of the power ofNMR derives from its ultrahigh spectral resolutions and becausethe important spin interactions can be accurately modeled interms of distances between atoms. The NMR techniques arecertainly the gold standard methods for studying systems at highconcentrations where the dynamical questions probed are slowerthan the microsecond time scale.14,15In contrast, optical spectroscopic methods are used for lower
concentration samples and for systems controlled by fasterdynamics. For example, vibrational spectroscopic techniques canoften be easily applied to studying low concentrations ofspecies,16-21 as well as to probe both very fast (femtosecond)and very slow processes.22-34 Unfortunately, the resultingvibrational spectroscopic information cannot as easily beinterpreted to obtain quantitative information on molecularconformation.35 Although it is possible to calculate normalmodes of large molecules in a vacuum, the uncertainties in thesecalculated frequencies and their assignments in the condensedphase prevent interpreting these results in terms of the moleculargeometry present in the condensed phase. In general, thevibrational spectra are interpreted through indirect empiricalarguments. It is unusual to be able to interpret vibrational spectraquantitatively by correlating measured vibrational spectralparameters to bond lengths, angles, etc.36,37
In the work here we have determined the frequency depen-dence of the Amide III (AmIII) band observed in the ∼200 nmUV resonance Raman (UVRR) spectra of peptides and proteinson theΨ Ramachandran angle, which largely defines the peptidebond secondary structure.22,38,39 The understanding of thedependence of the AmIII band on the Ψ Ramachandran anglehas a long and distinguished history; almost 30 years ago Lordproposed that the AmIII band correlates with the peptidesecondary structure.40 During the succeeding years, numerousinvestigators have used this band to determine protein andpeptide secondary structure.38,39,41-58
Recently Asher et al.47 theoretically examined the dependenceof the AmIII band on the Ψ angle and discovered that thisdependence resulted from coupling between the peptide bondN-H and CR-H in-plane bends. They found that this couplingvaried sinusoidally withΨ angle. They also discovered that therewas much less dependence of the AmIII band on the ΦRamachandran angle.47,59 They also carefully examined42 theamide III region of peptides and proteins and assigned a numberof the bands in this region. They assigned one band in thisspectral region, the AmIII3 band, to the vibration whosefrequency varies with the Ψ angle.43,60 Further, they alsorecently showed that this Raman band derives from independentcontributions from individual peptide bonds in the peptide andprotein; there is no evidence of coupling of this vibrationbetween adjacent peptide bonds,61,62 unlike the commonly usedAmI band.61,63
These observations are important because they indicate thatthe AmIII3 band may be uniquely useful in peptide and proteinconformational studies. This band is easily observed because itis strongly enhanced by resonance excitation in the peptide bond∼200 nm π f π* transitions.39,64-66 Further, we showed thatthis band can be selectively measured for a single peptide bondby isotope editing the peptide or protein by replacing the CR-H
* To whom correspondence may be sent. Phone: 412-624-8570. Fax:412-624-0588. E-mail: [email protected].
1928 J. Phys. Chem. B 2006, 110, 1928-1943
10.1021/jp054593h CCC: $33.50 © 2006 American Chemical SocietyPublished on Web 01/10/2006
by CR-D.42,47,67,68 The high S/N difference spectrum directlydisplays the AmIII3 frequency.In the work here we carefully examined the dependence of
this AmIII3 frequency on hydrogen bonding (HB), to separatethe HB dependence from the Ψ angle dependence. This allowsus to propose a family of relationships which can be used todetermine the Ψ angle directly from the measured AmIII3frequency with a typical accuracy of (8°, assuming a knownHB state (however, see discussion below).We are optimistic that these relationships will be very useful
for protein conformational studies, especially in the field ofprotein folding. This is because any attempt to understandreaction mechanisms, such as, for example, protein folding,requires elucidation of the relevant reaction coordinate(s). TheΨ angle is precisely the reaction coordinate that determinessecondary structure changes. As shown elsewhere60 the cor-relation we propose can be used to experimentally determinefeatures of the energy landscape along this Ψ reaction coordi-nate. Such an experimental insight into a protein conformationand energy landscape is crucially needed, since there are still alot of unresolved questions regarding the theoretical modelingof protein folding despite remarkable recent achievments.69-71
Experimental Section
Sample Preparation. N-Methylacetamide (NMA, >99%pure) was purchased from Sigma Chemicals (St. Louis, MO)and used as received without any further purification. Neat liquidNMA (∼13 M) and 0.13 M NMA in water solutions were used.As described elsewhere,43 the 21-residue alanine-based pep-
tide AAAAA(AAARA)3A (AP) was prepared (HPLC pure) atthe Pittsburgh Peptide Facility by using the solid-state peptidesynthesis method. The AP solutions in water contained 1 mg/mL concentrations of AP, and 0.2 M concentrations of sodiumperchlorate, which was used as an internal intensity andfrequency standard.22,29 All Raman spectra were normalized tothe intensity of the ClO4- Raman band (932 cm-1).The undecapeptide XAO (MW ) 985) was prepared (HPLC
pure) at the Pittsburgh Peptide Facility by using the solid-statepeptide synthesis method. The sequence of this peptide is Ac-XXAAAAAAAOO-amide, where all amino acids are in theirL form, A is alanine, X is diaminobutyric acid (side chain CH2-CH2NH3+), and O is ornithine (side chain (CH2)3NH3+). Weused 1 mg/mL solutions of XAO-peptide containing 0.15 M ofsodium perchlorate. The UVRR spectra of XAO were alsonormalized to the ClO4- Raman band intensity.As described elsewhere,60 poly-L-lysine HCl (PLL, MWvis
) 28 500, MWLALLS ) 20 200) and the sodium salt of poly-L-glutamic acid (PGA, MWvis ) 17 000, MWmALLS ) 8853)were purchased from Sigma Chemical and used as received.Solution spectra of PLL and PGA were measured at pH ) 2and pH ) 9, respectively, to ensure the absence of R-helixcontributions. The mixed PLL and PGA neutral pH samplesolutions contained identical concentrations of lysine andglutamic acid residues. These samples were freshly preparedbefore the Raman measurements. The total peptide concentra-tions were kept below 0.3 mg/mL to avoid gel formation.UV Resonance Raman Instrumentation. The Raman in-
strumentation has been described in detail elsewhere.22,72 ACoherent Infinity Nd:YAG laser produced 355 nm (thirdharmonic) 3 ns pulses at 100 Hz. This beam was Raman shiftedto 204 nm (fifth anti-Stokes) by using a 1 m tube filled withhydrogen (60 psi). A Pellin Broca prism was used to select the204 nm excitation beam. The Raman scattered light was imagedinto a subtractive double spectrometer,72 and the UV light was
detected by a Princeton Instruments solar blind ICCD cameraor a Roper Scientific UV CCD camera. All samples weremeasured in a thermostated free surface flow stream.
Results and Discussion
Dependence of AmIII3 Frequency on RamachandranAngles and Hydrogen Bonding. The amide III (AmIII) bandregion is complex. We recently examined this spectral regionin detail and identified a band, which we call AmIII3 and whichis most sensitive to the peptide bond conformation.42 As brieflydiscussed in the Introduction, the peptide bond (PB) AmIII3frequency depends on its secondary structure which is definedby its Ψ and Φ Ramachandran angles.43,47,59,73 The AmIII3frequency also depends on whether the PB hydrogen bonds(HBs) to water (HBP-W),74-77 or to other PBs (HBP-P).77-81Although there is a modest Φ angle AmIII3 frequency depen-dence, our studies to date show that the Ψ dependencedominates.43,47,59 We discuss the relative Ψ and Φ angulardependencies in detail below. In addition, PB HBs to water leadsto a characteristic temperature dependence22,29,42,43 that derivesfrom anharmonicities25,82-87 in the PB and water HB potentialfunctions (see Appendix for detail). Thus, we write
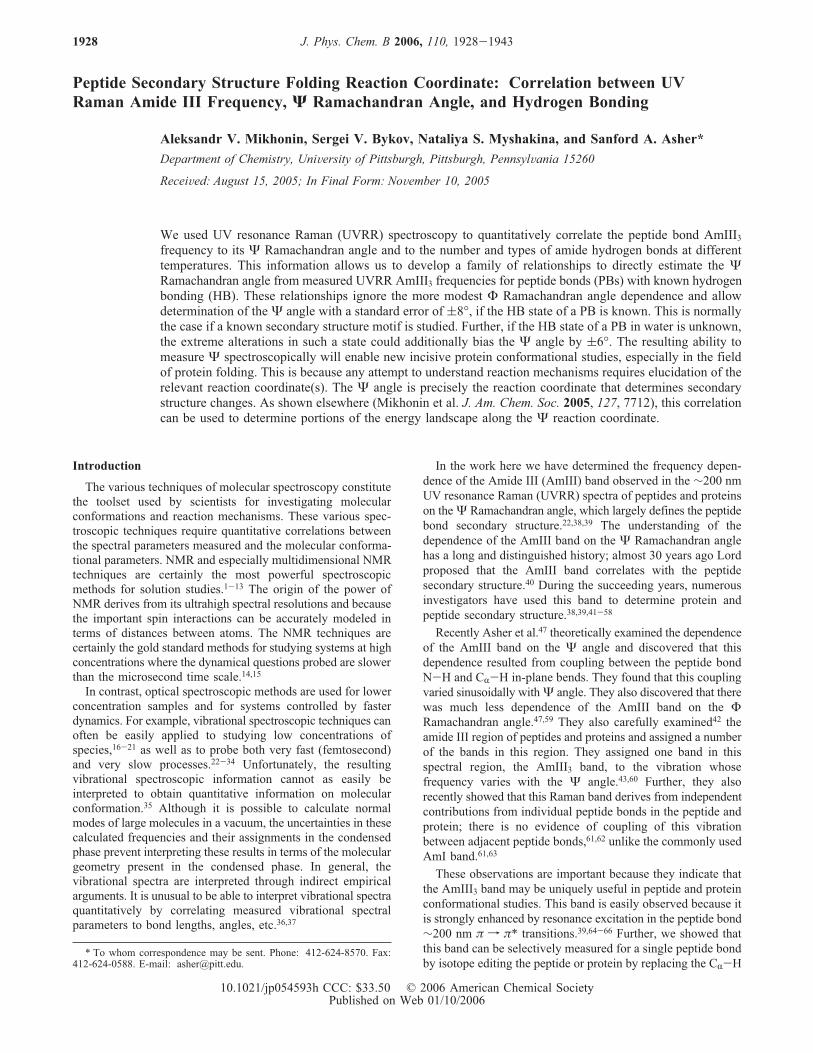
AmIII3 Frequency Dependence on Coupling betweenCR-H and N-H Bending Motions. We showed earlier thatthe conformational sensitivity of the AmIII3 band derives fromcoupling between the N-H and CR-H bending motions.47 Forexample, for �-strand-like Ψ and Φ Ramachandran angles theN-H and CR-H bonds are approximately cis (Figure 1), which
Figure 1. Model of a polypeptide chain (A) at �-strand-like and (B)at R-helix-like Ψ and Φ Ramachandran angles. The distance betweenCR-H and N-H hydrogens depends on the Ψ Ramachandran angle.
νIII3 ) νIII3(ψ,φ,HBP-P,HBP-W,T) (1)
Peptide Secondary Structure Folding Reaction Coordinate J. Phys. Chem. B, Vol. 110, No. 4, 2006 1929
gives rise to strong N-H to CR-H bend coupling. In contrast,for R-helix-like Ψ and Φ Ramachandran angles the N-H andCR-H bonds are approximately trans (Figure 1), and the N-Hto CR-H coupling disappears. The stronger the coupling, thelower the AmIII3 frequency, as explained in detail elsewhere.47This coupling between the N-H and CR-H bending motions
can be completely removed by CR-D isotopic substitutionbecause of the dramatically lowered CR-D bending frequency.Ala-ala (AA) in water exists in a PPII-like conformation withΨ and Φ angles of 132° and -67°, respectively.88 The N-Hand CR-H bending motions strongly couple. CR-D isotopicsubstitution in AA47 results in a 68 cm-1 upshift of the AmIII3band frequency from 1270 to 1338 cm-1. This occurs becauseof the loss of this strong coupling between the N-H and CR-Hbending motions. This shift upon CR deuteration is also observedin the 21-residue mainly ala peptide (AP). Natural abundanceAP in its unfolded state (essentially PPII,Ψ ≈ 145°,Φ ≈ -75°)shows the AmIII3 band at 1252 cm-1 (at 0 °C).42,43 2,3,3,3-D4isotopic substitution (CR-D, CD3) results in a ∼74 cm-1 upshiftof the AmIII3 band to ∼1326 cm-1.42The extreme lowest frequency experimental value observed
to date for the AmIII3 frequency of 1227 cm-1 occurs inantiparallel �-sheet PB in water (Ψ ≈ 135°,Φ ≈ -139°) formedby PLL and PGA mixtures. Thus, it appears that the AmIII3frequency can be shifted by a maximum of ∼100 cm-1 due tothis coupling of CR-H and N-H bending motions.The physical origin of this Ψ angle AmIII3 frequency
dependence is that the hydrogen van der Waals radii in theCR-H and N-H bonds are in contact for positive Ψ angles(Figure 1), and the distance between the two H atoms shows asinusoidal angular dependence. The coupling of these bendingmotions increases with the proximity of the hydrogen atoms.The coupling of bending motion causes a splitting of thevibrations into a high- and low-frequency component, the AmIII3band, and an anomalously enhanced CR-H bending band whichcontains additional motions such as CO-N stretching.Relative Impact of the Ψ and Φ Ramachandran Angles
on the AmIII3 Frequency. Although the projections of theN-H and CR-H bending motions on each other (and as a resultthe degree of coupling between them) depend on both the Ψand Φ Ramachandran angles, an examination of a model of apeptide bond (Figure 1) clearly shows that for the allowedregions of the Ramachandran plot only the Ψ angle directlyalters the distance between the two hydrogens, while theΦ anglehas little direct impact. Thus, for steric reasons alone we expectlittle influence on the AmIII3 frequency due to variations inthe Φ angle.Asher et al.47 theoretically investigated the Ψ angular
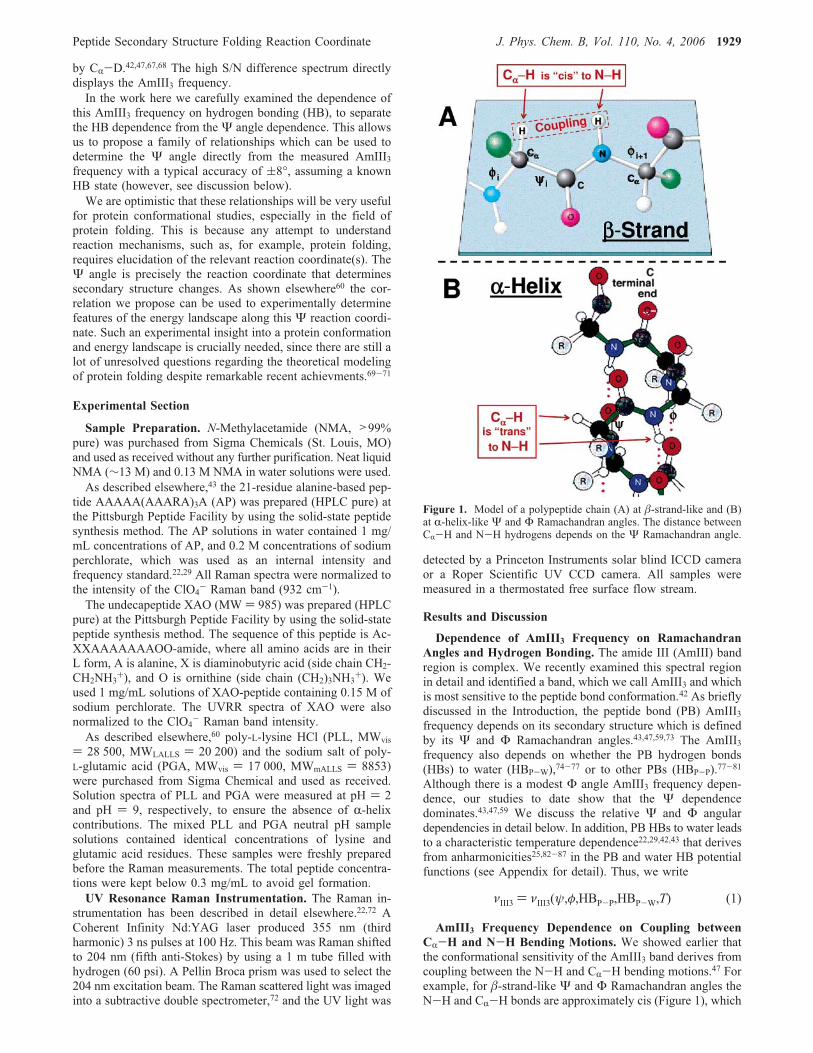
dependence of AmIII3 frequency in isolated alanine methylamide(AMA). AMA geometry was optimized at fixedΨ angles usingGaussian 98W, and then the vibrational frequencies werecalculated. This approach revealed the strong dependence ofthe AmIII frequency on theΨ Ramachandran angle with a ∼61cm-1 total span of calculated AmIII frequencies (∼74 cm-1 spanfrom sinusoidal fit of these calculated data points, Figure 2).Mirkin and Krimm73 theoretically examined the Ψ and Φ
frequency dependence of the AmIII band of “alanine dipeptide”(N-acetyl-L-alanine-N-methylamide). They concentrated on pep-tide bond 2, whose frequencies were close to those measuredexperimentally. Although Mirkin and Krimm claim in theirconclusions, that AmIII frequency shows strong dependence onboth Ψ and Φ Ramachandran angles, we note that the impactof changes in theΦ angle is relatively modest if we only includethe allowed regions of the Ramachandran plot (Figure 3).
In the allowed regions of Ramachandran plot, Mirkin andKrimm73 calculated a 25-40 cm-1 AmIII frequency span overthe allowed Ψ angles for fixed Φ angles (Figures 3 and 4).This 25-40 cm-1 Ψ angular frequency variation is somewhatlower than the 61 cm-1 span we47 estimated for AMA. However,it is ∼3-fold greater than the 6-16 cm-1 AmIII frequencydependence calculated for the Φ angular dependence for fixedΨ angles over the allowed regions of the Ramachandran plot(Figures 3 and 4).In addition, the largest 16 cm-1 span in the AmIII frequency
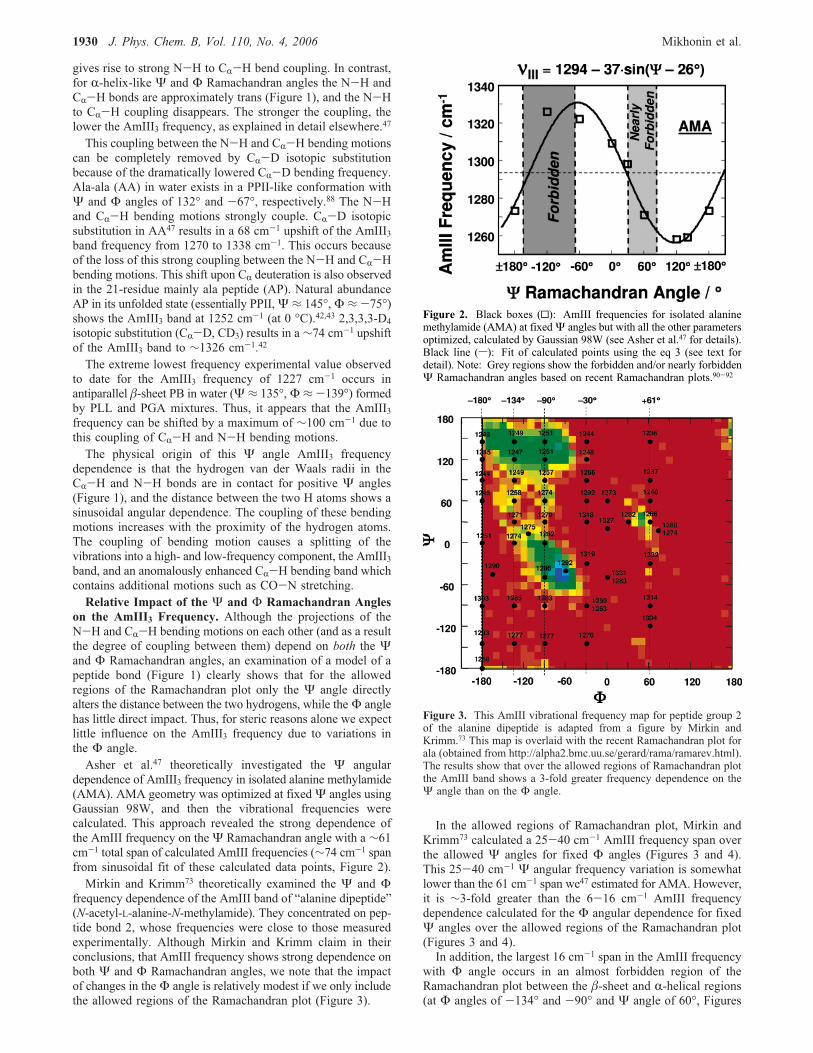
with Φ angle occurs in an almost forbidden region of theRamachandran plot between the �-sheet and R-helical regions(at Φ angles of -134° and -90° and Ψ angle of 60°, Figures
Figure 2. Black boxes (0): AmIII frequencies for isolated alaninemethylamide (AMA) at fixedΨ angles but with all the other parametersoptimized, calculated by Gaussian 98W (see Asher et al.47 for details).Black line (s): Fit of calculated points using the eq 3 (see text fordetail). Note: Grey regions show the forbidden and/or nearly forbiddenΨ Ramachandran angles based on recent Ramachandran plots.90-92
Figure 3. This AmIII vibrational frequency map for peptide group 2of the alanine dipeptide is adapted from a figure by Mirkin andKrimm.73 This map is overlaid with the recent Ramachandran plot forala (obtained from http://alpha2.bmc.uu.se/gerard/rama/ramarev.html).The results show that over the allowed regions of Ramachandran plotthe AmIII band shows a 3-fold greater frequency dependence on theΨ angle than on the Φ angle.
1930 J. Phys. Chem. B, Vol. 110, No. 4, 2006 Mikhonin et al.
3 and 4). In contrast, in the R-helical region of the Ramachan-dran plot the AmIII frequency of alanine dipeptide shows nomore than 8 cm-1 Φ angular span, while in the �-strand regionof the Ramachandran plot the AmIII frequency shows no morethan 6 cm-1 Φ dependence (Figure 3).Figure 4, which shows Mirkin and Krimm’s73 Ψ angular
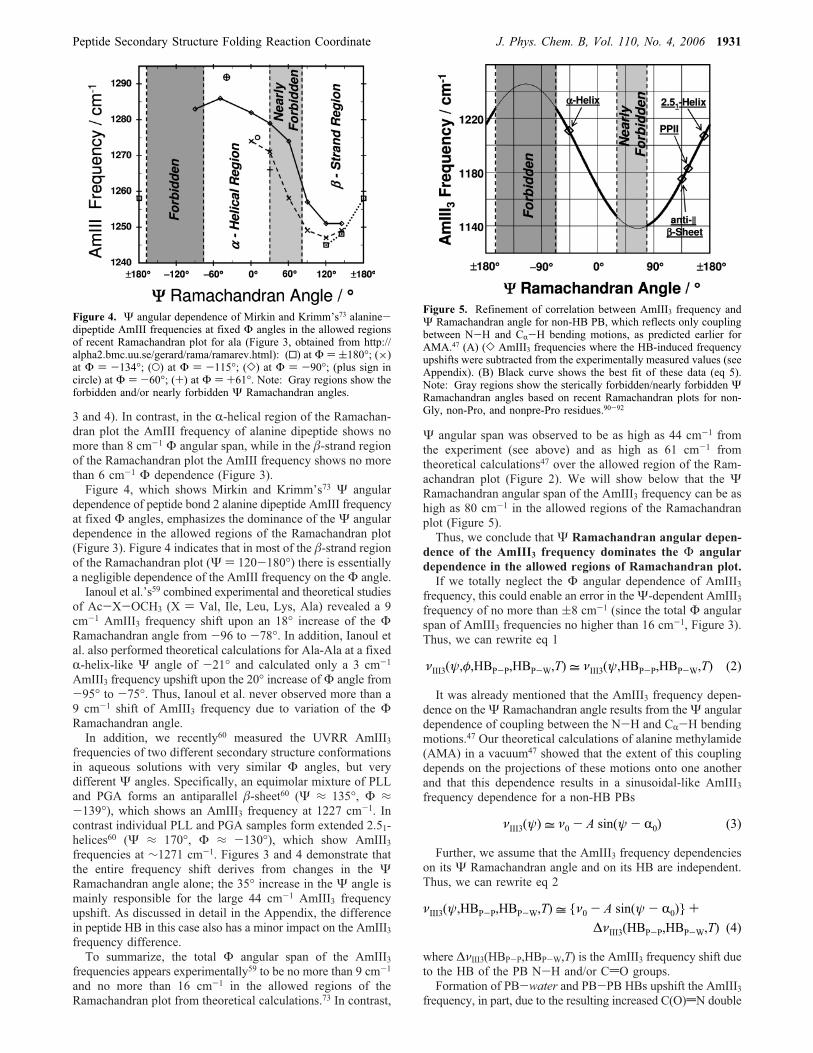
dependence of peptide bond 2 alanine dipeptide AmIII frequencyat fixed Φ angles, emphasizes the dominance of the Ψ angulardependence in the allowed regions of the Ramachandran plot(Figure 3). Figure 4 indicates that in most of the �-strand regionof the Ramachandran plot (Ψ ) 120-180°) there is essentiallya negligible dependence of the AmIII frequency on the Φ angle.Ianoul et al.’s59 combined experimental and theoretical studies
of Ac-X-OCH3 (X ) Val, Ile, Leu, Lys, Ala) revealed a 9cm-1 AmIII3 frequency shift upon an 18° increase of the ΦRamachandran angle from -96 to -78°. In addition, Ianoul etal. also performed theoretical calculations for Ala-Ala at a fixedR-helix-like Ψ angle of -21° and calculated only a 3 cm-1
AmIII3 frequency upshift upon the 20° increase ofΦ angle from-95° to -75°. Thus, Ianoul et al. never observed more than a9 cm-1 shift of AmIII3 frequency due to variation of the ΦRamachandran angle.In addition, we recently60 measured the UVRR AmIII3
frequencies of two different secondary structure conformationsin aqueous solutions with very similar Φ angles, but verydifferent Ψ angles. Specifically, an equimolar mixture of PLLand PGA forms an antiparallel �-sheet60 (Ψ ≈ 135°, Φ ≈-139°), which shows an AmIII3 frequency at 1227 cm-1. Incontrast individual PLL and PGA samples form extended 2.51-helices60 (Ψ ≈ 170°, Φ ≈ -130°), which show AmIII3frequencies at ∼1271 cm-1. Figures 3 and 4 demonstrate thatthe entire frequency shift derives from changes in the ΨRamachandran angle alone; the 35° increase in the Ψ angle ismainly responsible for the large 44 cm-1 AmIII3 frequencyupshift. As discussed in detail in the Appendix, the differencein peptide HB in this case also has a minor impact on the AmIII3frequency difference.To summarize, the total Φ angular span of the AmIII3
frequencies appears experimentally59 to be no more than 9 cm-1
and no more than 16 cm-1 in the allowed regions of theRamachandran plot from theoretical calculations.73 In contrast,
Ψ angular span was observed to be as high as 44 cm-1 fromthe experiment (see above) and as high as 61 cm-1 fromtheoretical calculations47 over the allowed region of the Ram-achandran plot (Figure 2). We will show below that the ΨRamachandran angular span of the AmIII3 frequency can be ashigh as 80 cm-1 in the allowed regions of the Ramachandranplot (Figure 5).Thus, we conclude that Ψ Ramachandran angular depen-
dence of the AmIII3 frequency dominates the Φ angulardependence in the allowed regions of Ramachandran plot.If we totally neglect the Φ angular dependence of AmIII3
frequency, this could enable an error in theΨ-dependent AmIII3frequency of no more than (8 cm-1 (since the total Φ angularspan of AmIII3 frequencies no higher than 16 cm-1, Figure 3).Thus, we can rewrite eq 1
It was already mentioned that the AmIII3 frequency depen-dence on theΨ Ramachandran angle results from theΨ angulardependence of coupling between the N-H and CR-H bendingmotions.47 Our theoretical calculations of alanine methylamide(AMA) in a vacuum47 showed that the extent of this couplingdepends on the projections of these motions onto one anotherand that this dependence results in a sinusoidal-like AmIII3frequency dependence for a non-HB PBs
Further, we assume that the AmIII3 frequency dependencieson its Ψ Ramachandran angle and on its HB are independent.Thus, we can rewrite eq 2
where ΔνIII3(HBP-P,HBP-W,T) is the AmIII3 frequency shift dueto the HB of the PB N-H and/or CdO groups.Formation of PB-water and PB-PB HBs upshift the AmIII3
frequency, in part, due to the resulting increased C(O)dN double
Figure 4. Ψ angular dependence of Mirkin and Krimm’s73 alanine-dipeptide AmIII frequencies at fixed Φ angles in the allowed regionsof recent Ramachandran plot for ala (Figure 3, obtained from http://alpha2.bmc.uu.se/gerard/rama/ramarev.html): (0) at Φ ) (180°; (×)at Φ ) -134°; (O) at Φ ) -115°; (]) at Φ ) -90°; (plus sign incircle) at Φ ) -60°; (+) at Φ ) +61°. Note: Gray regions show theforbidden and/or nearly forbidden Ψ Ramachandran angles.
Figure 5. Refinement of correlation between AmIII3 frequency andΨ Ramachandran angle for non-HB PB, which reflects only couplingbetween N-H and CR-H bending motions, as predicted earlier forAMA.47 (A) (] AmIII3 frequencies where the HB-induced frequencyupshifts were subtracted from the experimentally measured values (seeAppendix). (B) Black curve shows the best fit of these data (eq 5).Note: Gray regions show the sterically forbidden/nearly forbidden ΨRamachandran angles based on recent Ramachandran plots for non-Gly, non-Pro, and nonpre-Pro residues.90-92
νIII3(ψ,φ,HBP-P,HBP-W,T) = νIII3(ψ,HBP-P,HBP-W,T) (2)
νIII3(ψ) = ν0 - A sin(ψ - R0) (3)
νIII3(ψ,HBP-P,HBP-W,T) = {ν0 - A sin(ψ - R0)} +ΔνIII3(HBP-P,HBP-W,T) (4)
Peptide Secondary Structure Folding Reaction Coordinate J. Phys. Chem. B, Vol. 110, No. 4, 2006 1931
bond character.75,76 The magnitude of this AmIII3 frequencyupshift depends on whether CdO and/or N-H sites HB andwhether these HB occur to water or to other PB. The Appendixbelow details our determinations of the AmIII3 frequency shiftsdue to HB for all the common PB conformations and HBpatterns. These considerations allow us to write three familiesof eqs 5, 6A-D, and 7A-C which display the dependence ofthe AmIII3 frequency on the Ψ angle, on the PB HB and ontemperature. These relationships and Figures 5-7 can be usedto determine the Ψ angle of a particular PB from itsexperimentally determined AmIII3 frequency, given itsknown HB state with an error as discussed below. In addition,we also developed the “average” eq 6E, if the HB state of a PBin water is unknown.Determining these correlations between the AmIII3 frequency
and PB HB requires detailed considerations of the many HBstates (see Appendix). To make the results of our study easilyaccessible to the reader, we first discuss the conclusions. Weleave the discussion of the detailed considerations of thedifferent HB patterns to a lengthy Appendix, which mustbe examined in order to judge the reliability of our conclu-sions.The relationships given below by eqs 5 (for non-HB PB in a
vacuum), 6A-D (PB in aqueous solutions), and 7A-C (PB in
the absence of water) are shown in Figures 5, 6, and 7,respectively.Correlation between AmIII3 Frequency and Ψ Rama-
chandran Angle in the Absence of HB.We measured the UVRAmIII3 frequencies for the AP R-helix42,89 (∼1263 cm-1, 0 °C),XAO PPII42,43 (1247 cm-1, 0 °C), PLL and PGA 2.51-helix60(∼1271 cm-1, 0 °C), and PLL-PGA mixture antiparallel�-sheet60 (∼1227 cm-1, 0 °C) conformations of differentpolypeptides in aqueous solutions. Each of these conformationshas known Ramachandran angles (Table 1).We can calculate the AmIII3 frequencies that would result
from the above peptide conformations in the fictitious casewhere the PB did not partake in any HB at all. This would bedone by subtracting the HB-induced AmIII3 frequency shifts(Table 2), determined in the Appendix, from the experimentallymeasured AmIII3 frequencies in aqueous solutions (Table 1).The resulting AmIII3 frequencies for non-HB PB at correspond-ing Ψ Ramachandran angles are shown in the second columnof Table 1. Removal of this HB dependence then allows us torefine our theoretically calculated frequency dependence of theAmIII3 band on theΨ angle dependent coupling between N-Hand CR-H bends (eq 3).By fitting the above four “non-HB” data points to eq 3, we
obtain the following semiempirical relationship, which relates
TABLE 1: Dependence of AmIII3 Frequencies on Hydrogen Bonding (HB) for Different Secondary Structures at 20 °C (unlessstated otherwise) under Conditions Specified
AmIII3 frequency (cm-1)without any PB-PBand PB-water HB(in a vacuum)
with PB-PB HB,but withoutPB-water HB
in water, butwithout anyPB-PB HB
both in waterand withPB-PB HB
PPII(Ψ ) 145°,Φ ) -75°)
1183 N/A 1247a N/A
2.51-helix(Ψ ) 170°,Φ ) -130°)
1207 N/A 1271a N/A
R-helixinternal residues(Ψ ) -47°,Φ ) -57°)
1211 1258a N/A 1263a
R-helixthree terminal residues onC-terminus site
(Ψ ) -47°,Φ ) -57°)
1211 1246 N/A 1266
R-helixthree terminal residues onN-terminus site
(Ψ ) -47°,Φ ) -57°)
1211 1223 N/A 1272
anti-| �-sheetall residues, which are two end-onPB-PB H-bonded (see text)
(Ψ ) 135°,Φ ) -139°)
1175 1222 N/A 1227a
anti-| �-sheet 1175 1210 N/A 1230residues from exterior strands(Ψ ) 135°,Φ ) -139°)
1175 1184 N/A 1236
aMeasured Experimentally. The Appendix describes these frequency assignments in detail.
TABLE 2: AmIII3 Frequency Upshifts for Different Peptide Secondary Structures Due to PB-Water and PB-PB HB at 0 °Cwith Respect to Non-HB PB in Vacuum
AmIII3 frequency upshift due to PB-water HBat specific sites,a cm-1
AmIII3 frequency upshiftdue to PB-PB HB at specific
sites,a cm-1
secondary structure ΔνA ΔνB ΔνC ΔνD,D* total ΔνE ΔνF total
total AmIII3frequency upshiftdue to HB, cm-1
PPII 15 33 16 N/A 64 N/A N/A N/A 642.51-helix 15 33 16 N/A 64 N/A N/A N/A 64extended �-strand 15 33 16 N/A 64 N/A N/A N/A 64AP solid state R-helix (dehydrated) N/A N/A N/A N/A N/A 35 12 47 47AP R-helix in water N/A N/A N/A 5 5 35 12 47 52PLL-PGA mixture anti-| �-sheet N/A N/A N/A 5 5 35 12 47 52a See Figures 10 and 15-17 as well as Appendix for detail.
1932 J. Phys. Chem. B, Vol. 110, No. 4, 2006 Mikhonin et al.
the AmIII3 frequency to theΨ Ramachandran angle dependentcoupling between N-H and CR-H bending motions
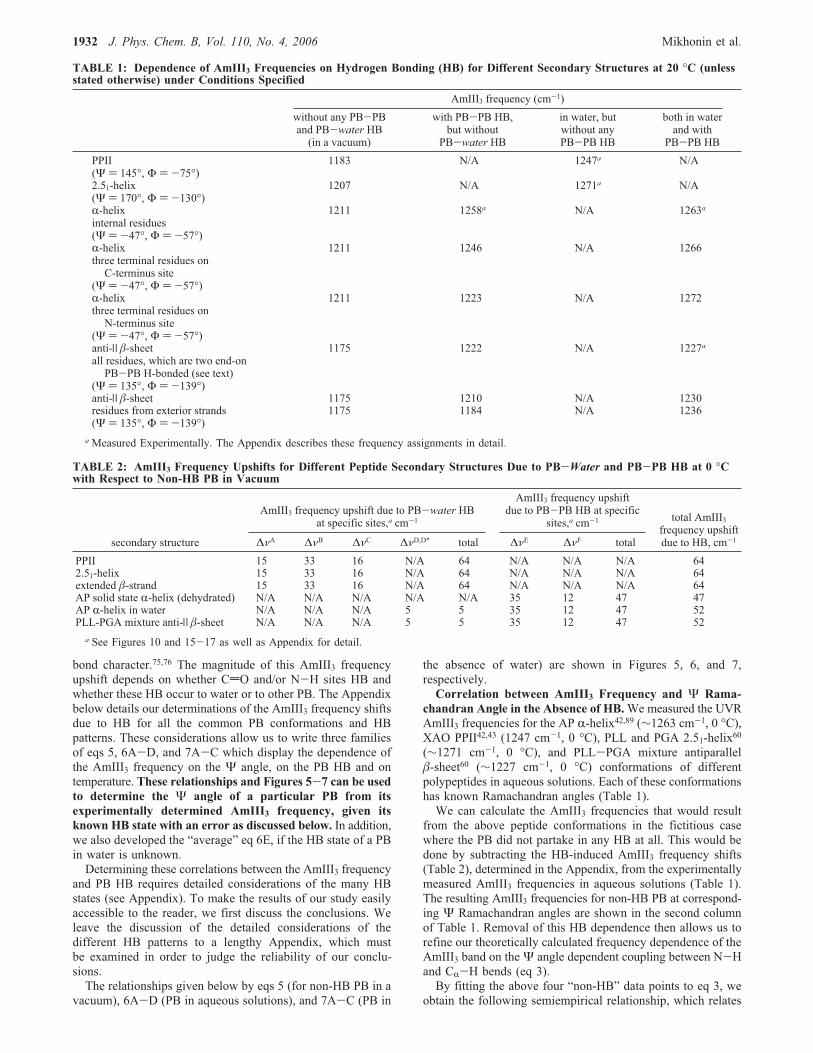
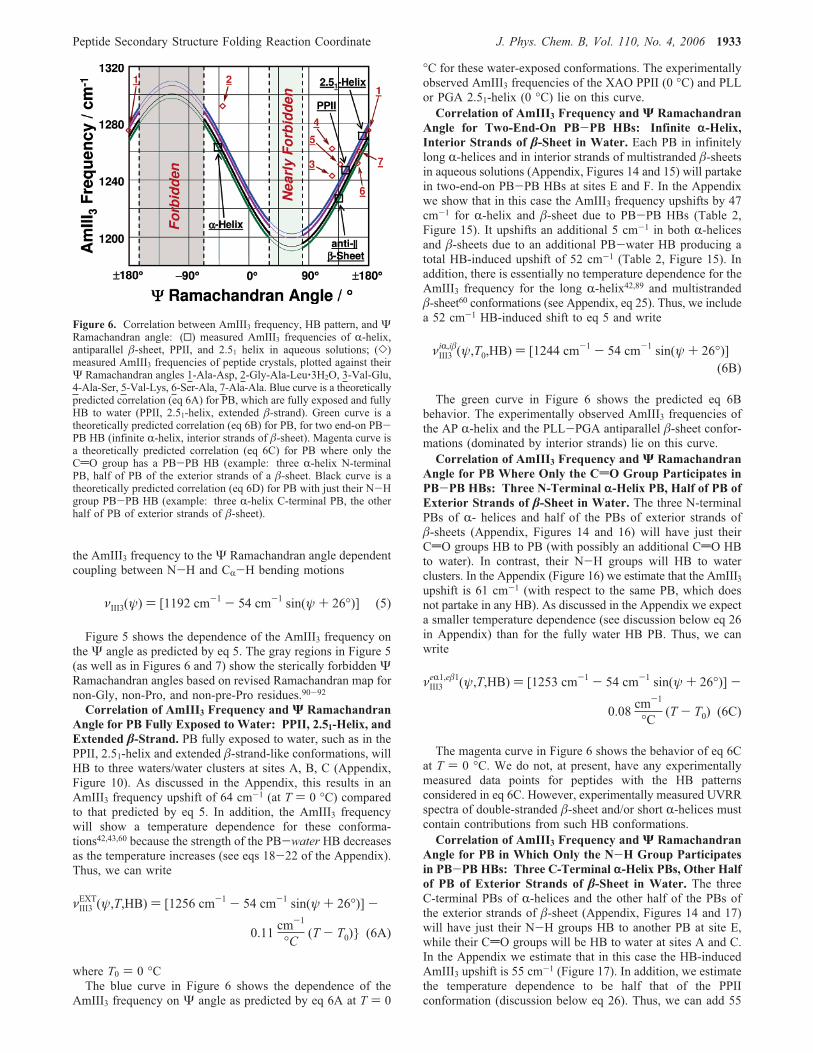
Figure 5 shows the dependence of the AmIII3 frequency onthe Ψ angle as predicted by eq 5. The gray regions in Figure 5(as well as in Figures 6 and 7) show the sterically forbidden ΨRamachandran angles based on revised Ramachandran map fornon-Gly, non-Pro, and non-pre-Pro residues.90-92Correlation of AmIII3 Frequency and Ψ Ramachandran
Angle for PB Fully Exposed to Water: PPII, 2.51-Helix, andExtended �-Strand. PB fully exposed to water, such as in thePPII, 2.51-helix and extended �-strand-like conformations, willHB to three waters/water clusters at sites A, B, C (Appendix,Figure 10). As discussed in the Appendix, this results in anAmIII3 frequency upshift of 64 cm-1 (at T ) 0 °C) comparedto that predicted by eq 5. In addition, the AmIII3 frequencywill show a temperature dependence for these conforma-tions42,43,60 because the strength of the PB-water HB decreasesas the temperature increases (see eqs 18-22 of the Appendix).Thus, we can write
where T0 ) 0 °CThe blue curve in Figure 6 shows the dependence of the
AmIII3 frequency on Ψ angle as predicted by eq 6A at T ) 0
°C for these water-exposed conformations. The experimentallyobserved AmIII3 frequencies of the XAO PPII (0 °C) and PLLor PGA 2.51-helix (0 °C) lie on this curve.Correlation of AmIII3 Frequency and Ψ Ramachandran
Angle for Two-End-On PB-PB HBs: Infinite r-Helix,Interior Strands of �-Sheet in Water. Each PB in infinitelylong R-helices and in interior strands of multistranded �-sheetsin aqueous solutions (Appendix, Figures 14 and 15) will partakein two-end-on PB-PB HBs at sites E and F. In the Appendixwe show that in this case the AmIII3 frequency upshifts by 47cm-1 for R-helix and �-sheet due to PB-PB HBs (Table 2,Figure 15). It upshifts an additional 5 cm-1 in both R-helicesand �-sheets due to an additional PB-water HB producing atotal HB-induced upshift of 52 cm-1 (Table 2, Figure 15). Inaddition, there is essentially no temperature dependence for theAmIII3 frequency for the long R-helix42,89 and multistranded�-sheet60 conformations (see Appendix, eq 25). Thus, we includea 52 cm-1 HB-induced shift to eq 5 and write
The green curve in Figure 6 shows the predicted eq 6Bbehavior. The experimentally observed AmIII3 frequencies ofthe AP R-helix and the PLL-PGA antiparallel �-sheet confor-mations (dominated by interior strands) lie on this curve.Correlation of AmIII3 Frequency and Ψ Ramachandran
Angle for PB Where Only the CdO Group Participates inPB-PB HBs: Three N-Terminal r-Helix PB, Half of PB ofExterior Strands of �-Sheet in Water. The three N-terminalPBs of R- helices and half of the PBs of exterior strands of�-sheets (Appendix, Figures 14 and 16) will have just theirCdO groups HB to PB (with possibly an additional CdO HBto water). In contrast, their N-H groups will HB to waterclusters. In the Appendix (Figure 16) we estimate that the AmIII3upshift is 61 cm-1 (with respect to the same PB, which doesnot partake in any HB). As discussed in the Appendix we expecta smaller temperature dependence (see discussion below eq 26in Appendix) than for the fully water HB PB. Thus, we canwrite
The magenta curve in Figure 6 shows the behavior of eq 6Cat T ) 0 °C. We do not, at present, have any experimentallymeasured data points for peptides with the HB patternsconsidered in eq 6C. However, experimentally measured UVRRspectra of double-stranded �-sheet and/or short R-helices mustcontain contributions from such HB conformations.Correlation of AmIII3 Frequency and Ψ Ramachandran
Angle for PB in Which Only the N-H Group Participatesin PB-PB HBs: Three C-Terminal r-Helix PBs, Other Halfof PB of Exterior Strands of �-Sheet in Water. The threeC-terminal PBs of R-helices and the other half of the PBs ofthe exterior strands of �-sheet (Appendix, Figures 14 and 17)will have just their N-H groups HB to another PB at site E,while their CdO groups will be HB to water at sites A and C.In the Appendix we estimate that in this case the HB-inducedAmIII3 upshift is 55 cm-1 (Figure 17). In addition, we estimatethe temperature dependence to be half that of the PPIIconformation (discussion below eq 26). Thus, we can add 55
Figure 6. Correlation between AmIII3 frequency, HB pattern, and ΨRamachandran angle: (0) measured AmIII3 frequencies of R-helix,antiparallel �-sheet, PPII, and 2.51 helix in aqueous solutions; (])measured AmIII3 frequencies of peptide crystals, plotted against theirΨ Ramachandran angles 1-Ala-Asp, 2-Gly-Ala-Leu‚3H2O, 3-Val-Glu,4-Ala-Ser, 5-Val-Lys, 6-Ser-Ala, 7-Ala-Ala. Blue curve is a theoreticallypredicted correlation (eq 6A) for PB, which are fully exposed and fullyHB to water (PPII, 2.51-helix, extended �-strand). Green curve is atheoretically predicted correlation (eq 6B) for PB, for two end-on PB-PB HB (infinite R-helix, interior strands of �-sheet). Magenta curve isa theoretically predicted correlation (eq 6C) for PB where only theCdO group has a PB-PB HB (example: three R-helix N-terminalPB, half of PB of the exterior strands of a �-sheet. Black curve is atheoretically predicted correlation (eq 6D) for PB with just their N-Hgroup PB-PB HB (example: three R-helix C-terminal PB, the otherhalf of PB of exterior strands of �-sheet).
νIII3iR,i�(ψ,T0,HB) ) [1244 cm
-1 - 54 cm-1 sin(ψ + 26°)](6B)
νIII3eR1,e�1(ψ,T,HB) ) [1253 cm-1 - 54 cm-1 sin(ψ + 26°)] -
0.08 cm-1
°C (T - T0) (6C)
νIII3(ψ) ) [1192 cm-1 - 54 cm-1 sin(ψ + 26°)] (5)
νIII3EXT(ψ,T,HB) ) [1256 cm-1 - 54 cm-1 sin(ψ + 26°)] -
0.11 cm-1
°C (T - T0)} (6A)
Peptide Secondary Structure Folding Reaction Coordinate J. Phys. Chem. B, Vol. 110, No. 4, 2006 1933
cm-1 HB-induced upshift as well as the temperature-dependentterm to eq 5 and write
The black curve in Figure 6 shows the behavior of eq 6D.We do not, at present, have any experimentally measured datapoints for peptides with the HB patterns considered in eq 6D.However, experimentally measured UVRR spectra of double-stranded �-sheet and/or short R-helices will contain contributionsfrom these HB conformations.Correlation of AmIII3 Frequency and Ψ Angle for a PB
in Water If Its HB State Is Unknown. If the HB state of aPB in aqueous solution is unknown, we suggest the use of eq6E, which is the “average” of eqs 6A-D. This will minimizethe error in determination of the Ψ Ramachandran angle andwill allow the estimation of the Ψ angle with the error boundsdiscussed below.
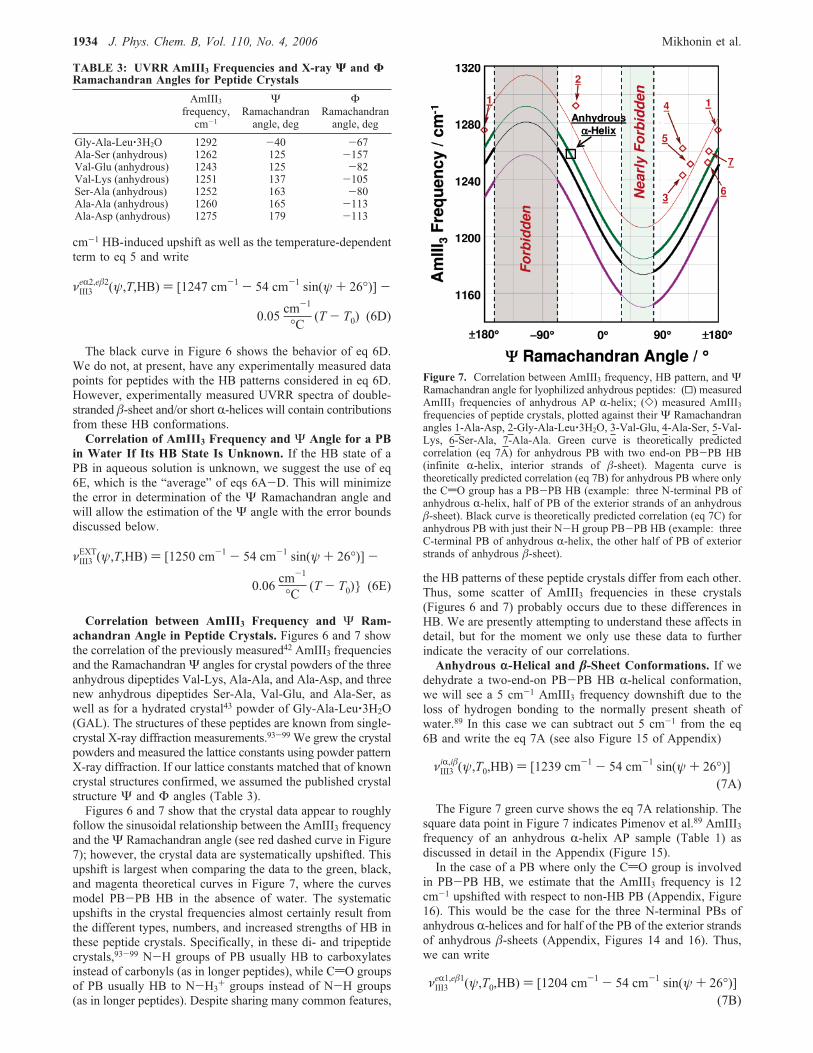
Correlation between AmIII3 Frequency and Ψ Ram-achandran Angle in Peptide Crystals. Figures 6 and 7 showthe correlation of the previously measured42 AmIII3 frequenciesand the RamachandranΨ angles for crystal powders of the threeanhydrous dipeptides Val-Lys, Ala-Ala, and Ala-Asp, and threenew anhydrous dipeptides Ser-Ala, Val-Glu, and Ala-Ser, aswell as for a hydrated crystal43 powder of Gly-Ala-Leu‚3H2O(GAL). The structures of these peptides are known from single-crystal X-ray diffraction measurements.93-99 We grew the crystalpowders and measured the lattice constants using powder patternX-ray diffraction. If our lattice constants matched that of knowncrystal structures confirmed, we assumed the published crystalstructure Ψ and Φ angles (Table 3).Figures 6 and 7 show that the crystal data appear to roughly
follow the sinusoidal relationship between the AmIII3 frequencyand theΨ Ramachandran angle (see red dashed curve in Figure7); however, the crystal data are systematically upshifted. Thisupshift is largest when comparing the data to the green, black,and magenta theoretical curves in Figure 7, where the curvesmodel PB-PB HB in the absence of water. The systematicupshifts in the crystal frequencies almost certainly result fromthe different types, numbers, and increased strengths of HB inthese peptide crystals. Specifically, in these di- and tripeptidecrystals,93-99 N-H groups of PB usually HB to carboxylatesinstead of carbonyls (as in longer peptides), while CdO groupsof PB usually HB to N-H3+ groups instead of N-H groups(as in longer peptides). Despite sharing many common features,
the HB patterns of these peptide crystals differ from each other.Thus, some scatter of AmIII3 frequencies in these crystals(Figures 6 and 7) probably occurs due to these differences inHB. We are presently attempting to understand these affects indetail, but for the moment we only use these data to furtherindicate the veracity of our correlations.Anhydrous r-Helical and �-Sheet Conformations. If we
dehydrate a two-end-on PB-PB HB R-helical conformation,we will see a 5 cm-1 AmIII3 frequency downshift due to theloss of hydrogen bonding to the normally present sheath ofwater.89 In this case we can subtract out 5 cm-1 from the eq6B and write the eq 7A (see also Figure 15 of Appendix)
The Figure 7 green curve shows the eq 7A relationship. Thesquare data point in Figure 7 indicates Pimenov et al.89 AmIII3frequency of an anhydrous R-helix AP sample (Table 1) asdiscussed in detail in the Appendix (Figure 15).In the case of a PB where only the CdO group is involved
in PB-PB HB, we estimate that the AmIII3 frequency is 12cm-1 upshifted with respect to non-HB PB (Appendix, Figure16). This would be the case for the three N-terminal PBs ofanhydrous R-helices and for half of the PB of the exterior strandsof anhydrous �-sheets (Appendix, Figures 14 and 16). Thus,we can write
TABLE 3: UVRR AmIII3 Frequencies and X-ray Ψ and ΦRamachandran Angles for Peptide Crystals
AmIII3frequency,cm-1
ΨRamachandranangle, deg
ΦRamachandranangle, deg
Gly-Ala-Leu‚3H2O 1292 -40 -67Ala-Ser (anhydrous) 1262 125 -157Val-Glu (anhydrous) 1243 125 -82Val-Lys (anhydrous) 1251 137 -105Ser-Ala (anhydrous) 1252 163 -80Ala-Ala (anhydrous) 1260 165 -113Ala-Asp (anhydrous) 1275 179 -113
Figure 7. Correlation between AmIII3 frequency, HB pattern, and ΨRamachandran angle for lyophilized anhydrous peptides: (0) measuredAmIII3 frequencies of anhydrous AP R-helix; (]) measured AmIII3frequencies of peptide crystals, plotted against their Ψ Ramachandranangles 1-Ala-Asp, 2-Gly-Ala-Leu‚3H2O, 3-Val-Glu, 4-Ala-Ser, 5-Val-Lys, 6-Ser-Ala, 7-Ala-Ala. Green curve is theoretically predictedcorrelation (eq 7A) for anhydrous PB with two end-on PB-PB HB(infinite R-helix, interior strands of �-sheet). Magenta curve istheoretically predicted correlation (eq 7B) for anhydrous PB where onlythe CdO group has a PB-PB HB (example: three N-terminal PB ofanhydrous R-helix, half of PB of the exterior strands of an anhydrous�-sheet). Black curve is theoretically predicted correlation (eq 7C) foranhydrous PB with just their N-H group PB-PB HB (example: threeC-terminal PB of anhydrous R-helix, the other half of PB of exteriorstrands of anhydrous �-sheet).
νIII3iR,i�(ψ,T0,HB) ) [1239 cm
-1 - 54 cm-1 sin(ψ + 26°)](7A)
νIII3eR1,e�1(ψ,T0,HB) ) [1204 cm
-1 - 54 cm-1 sin(ψ + 26°)](7B)
νIII3eR2,e�2(ψ,T,HB) ) [1247 cm-1 - 54 cm-1 sin(ψ + 26°)] -
0.05 cm-1
°C (T - T0) (6D)
νIII3EXT(ψ,T,HB) ) [1250 cm-1 - 54 cm-1 sin(ψ + 26°)] -
0.06 cm-1
°C (T - T0)} (6E)
1934 J. Phys. Chem. B, Vol. 110, No. 4, 2006 Mikhonin et al.
The Figure 7 magenta curve shows the eq 7B relationship.In the case of PB, where only the NH group is PB-PB HB,
we estimate the AmIII3 frequency to be 35 cm-1 upshifted withrespect to non-HB PB (Appendix, Figure 17). This would bethe case for the three C-terminal PB of anhydrous R-helix andhalf of the PB of the exterior strands of the anhydrous �-sheet(Figures 14 and 17 of Appendix). Thus, we can write
The black curve in Figure 7 shows the eq 7C relationship.The impact of different HB patterns, reflected by eqs 7A-
C, produces much greater differences in AmIII3 frequenciesunder anhydrous conditions compared to those in aqueoussolutions (compare Figures 6 and 7), since PB-water HB-induced AmIII3 frequency upshifts do not compensate for thedifferences in PB-PB HB-induced upshifts. It should be alsonoted that eqs 7A-C behavior will only dominate the behaviorof relatively long, anhydrous, lyophilized peptides.Thus, the families of eqs 6A-D and 7A-C predict the
correlation between the AmIII3 frequency and the Ψ angle forthe common conformations of peptides and proteins. If the HBis known for a particular PB, the appropriate equation can beused to determine its Ψ angle from the observed AmIII3frequency. In the case where the HB state of a PB in aqueoussolution is unknown, one can use eq 6E. These relationshipswill become less accurate if the PB has an unusual Φ angle orunusual HB pattern (see below).Prediction of UVRR AmIII3 Frequencies of Other Sec-
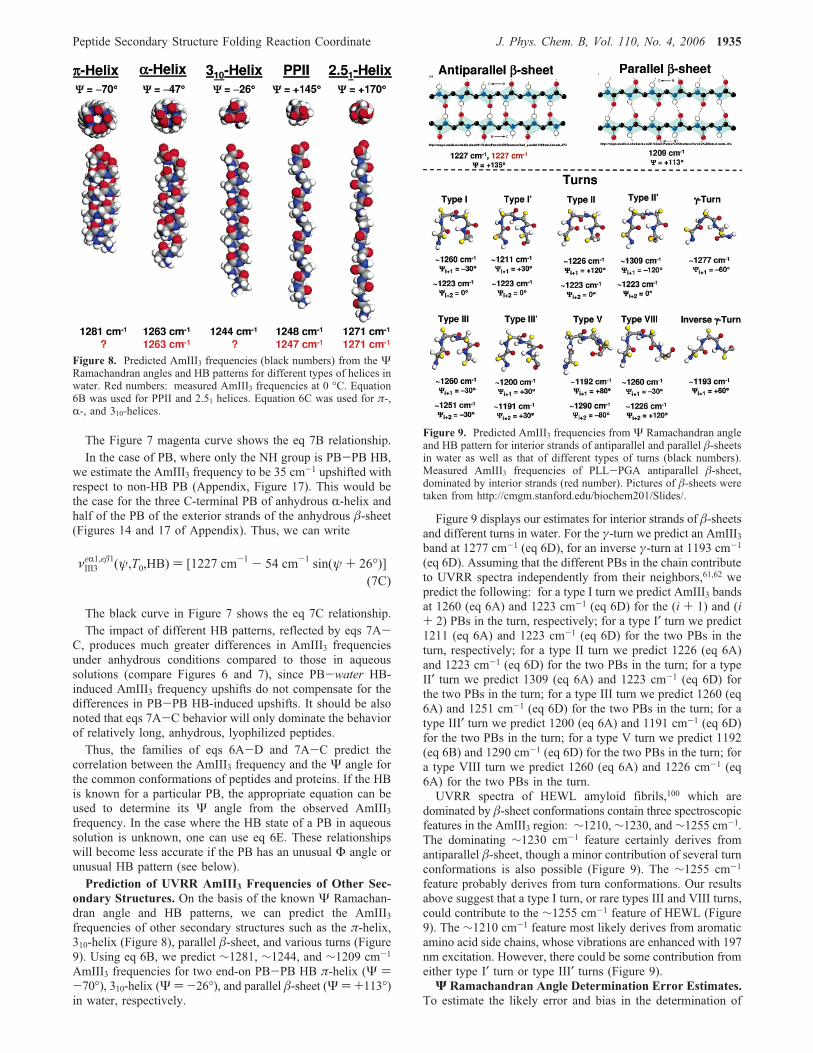
ondary Structures. On the basis of the known Ψ Ramachan-dran angle and HB patterns, we can predict the AmIII3frequencies of other secondary structures such as the π-helix,310-helix (Figure 8), parallel �-sheet, and various turns (Figure9). Using eq 6B, we predict ∼1281, ∼1244, and ∼1209 cm-1
AmIII3 frequencies for two end-on PB-PB HB π-helix (Ψ )-70°), 310-helix (Ψ )-26°), and parallel �-sheet (Ψ )+113°)in water, respectively.
Figure 9 displays our estimates for interior strands of �-sheetsand different turns in water. For the γ-turn we predict an AmIII3band at 1277 cm-1 (eq 6D), for an inverse γ-turn at 1193 cm-1
(eq 6D). Assuming that the different PBs in the chain contributeto UVRR spectra independently from their neighbors,61,62 wepredict the following: for a type I turn we predict AmIII3 bandsat 1260 (eq 6A) and 1223 cm-1 (eq 6D) for the (i + 1) and (i+ 2) PBs in the turn, respectively; for a type I′ turn we predict1211 (eq 6A) and 1223 cm-1 (eq 6D) for the two PBs in theturn, respectively; for a type II turn we predict 1226 (eq 6A)and 1223 cm-1 (eq 6D) for the two PBs in the turn; for a typeII′ turn we predict 1309 (eq 6A) and 1223 cm-1 (eq 6D) forthe two PBs in the turn; for a type III turn we predict 1260 (eq6A) and 1251 cm-1 (eq 6D) for the two PBs in the turn; for atype III′ turn we predict 1200 (eq 6A) and 1191 cm-1 (eq 6D)for the two PBs in the turn; for a type V turn we predict 1192(eq 6B) and 1290 cm-1 (eq 6D) for the two PBs in the turn; fora type VIII turn we predict 1260 (eq 6A) and 1226 cm-1 (eq6A) for the two PBs in the turn.UVRR spectra of HEWL amyloid fibrils,100 which are
dominated by �-sheet conformations contain three spectroscopicfeatures in the AmIII3 region: ∼1210,∼1230, and∼1255 cm-1.The dominating ∼1230 cm-1 feature certainly derives fromantiparallel �-sheet, though a minor contribution of several turnconformations is also possible (Figure 9). The ∼1255 cm-1
feature probably derives from turn conformations. Our resultsabove suggest that a type I turn, or rare types III and VIII turns,could contribute to the ∼1255 cm-1 feature of HEWL (Figure9). The ∼1210 cm-1 feature most likely derives from aromaticamino acid side chains, whose vibrations are enhanced with 197nm excitation. However, there could be some contribution fromeither type I′ turn or type III′ turns (Figure 9).
Ψ Ramachandran Angle Determination Error Estimates.To estimate the likely error and bias in the determination of
Figure 8. Predicted AmIII3 frequencies (black numbers) from the ΨRamachandran angles and HB patterns for different types of helices inwater. Red numbers: measured AmIII3 frequencies at 0 °C. Equation6B was used for PPII and 2.51 helices. Equation 6C was used for π-,R-, and 310-helices.
νIII3eR1,e�1(ψ,T0,HB) ) [1227 cm
-1 - 54 cm-1 sin(ψ + 26°)](7C)
Figure 9. Predicted AmIII3 frequencies from Ψ Ramachandran angleand HB pattern for interior strands of antiparallel and parallel �-sheetsin water as well as that of different types of turns (black numbers).Measured AmIII3 frequencies of PLL-PGA antiparallel �-sheet,dominated by interior strands (red number). Pictures of �-sheets weretaken from http://cmgm.stanford.edu/biochem201/Slides/.
Peptide Secondary Structure Folding Reaction Coordinate J. Phys. Chem. B, Vol. 110, No. 4, 2006 1935
theΨ angle from the Raman measurements, we have to analyzethe likely errors in the determination of the AmIII3 frequencyof the peptide bond of interest, as well as the error associatedwith the theoretical relationships that neglect theΦ dependenceof the AmIII3 frequency. In the simplest case, where we haveonly one amide bond, our error is determined by the error inresolving the AmIII3 band from the AmIII2 band and otheradjacent interfering bands. In the case of homopeptides we oftenattempt to determine the band frequency from a particularconformation, which presents the increased complexity ofresolving between the AmIII3 bands of multiple conformations.Finally, we expect to be challenged by the case where wespecifically examine the AmIII3 band of a particular peptidebond in a polypeptide or protein. In this case, for example, weisotopically substitute the CR-H of that peptide bond andcompare the spectra of the natural abundance and the isotopicderivative to model the difference spectrum to selectivelydetermine the peptide bond AmIII3 frequency.Thus, the likely error is very sample dependent and derives
from the spectral S/N and the reliability of our modeling. Infitting, the resulting standard deviation of the fit depends onpeak overlap and spectral S/N. Typically our spectral fitting,assuming Voigt profiles, calculates standard deviations of ∼2-3cm-1 in the majority of cases; it is never more than ∼7 cm-1,even in the most unfavorable cases. The derivative of the Ψangle with respect to the AmIII3 frequency: ∂Ψ/∂ν = 1°/cm-1
over essentially all of the allowed values of Ψ (Figures 5-7).Thus, we obtain measurement error standard deviations in thedetermined Ψ angles of ∼2-3° for most cases and extremestandard deviations of ∼7° for rare unfavorable cases.The error associated with neglecting the Φ angle also gives
rise to the uncertainty in the Ψ angle determination. Ianoul etal.59 theoretically and experimentally showed that different Φangles could cause a maximum 9 cm-1 shift of the AmIII3frequency, while Mirkin and Krimm73 indicates a potential spanof AmIII frequency as much as 16 cm-1 in the allowed regionsof Ramachandran plot (Figure 3). However, in the �-strandregion of the Ramachandran plot we find that a Φ span is lessthan ∼6 cm-1, while that in the R-helix region is less than ∼8cm-1 (Figure 3). Thus, the extreme maximum spans of Ψ anglewhich could occur by neglecting the Φ angle is ∼16°. Thus,the extreme standard error of Ψ angle associated with theneglecting theΦ angle is(8° (for an averageΦ angle). Further,for the most abundant secondary structure motifs from theR-helical and �-strand regions of the Ramachandran plot, theΦ angle associated errors are only (4° and (3°, respectively.Additional bias can occur if we do not know the HB state of
a PB in water. This could give rise to a bias of the AmIII3frequency of (6 cm-1, which would lead to a Ψ angle bias of(6° in eq 6E. Thus, a typical UV Raman measurement of atypical sample would find a random error of e(8° in theΨ angle, assuming a known HB state. However, extremealterations in the unknown HB state of a PB in water couldadditionally bias the Ψ angle by (6°.
Conclusions
We used UV resonance Raman spectroscopy to investigatethe dependence of the AmIII3 frequency on the Ψ Ramachan-dran angle and on the nature of PB HBs. These results allowus to formulate relationships that allow us to estimate the ΨRamachandran angles from observed AmIII3 frequencies forboth aqueous solutions of peptides and proteins as well as forthe anhydrous states of peptides and proteins. A typical Ramanmeasurement of a typical sample would find a random error
of e(8° in the Ψ angle, assuming a known HB state.However, if the HB state of a PB in water is unknown, extremealterations in such a state could additionally bias the Ψ angleby (6°.We are optimistic that these relationships will be very useful
for protein conformational studies, especially in the field ofprotein folding. This is because any attempt to understandreaction mechanisms, such as protein folding, requires elucida-tion of the relevant reaction coordinate(s). The Ψ angle isprecisely the reaction coordinate that determines secondarystructure changes. As shown elsewhere,60 the correlation wepropose can be used to determine features of the energylandscape along this Ψ reaction coordinate.
Acknowledgment. We thank Dr. Igor Lednev, Dr. SimonLovell, and Dr. Anatoli Ianoul for helpful discussions as wellas NIH Grant 8 RO1 EB002053021 for financial support.
Appendix
In this Appendix we carefully investigate the dependence ofAmIII3 frequency on the Ψ Ramachandran angle, the peptidebond-water hydrogen bonding (PB-water HB), and the peptidebond-peptide bond hydrogen bonding (PB-PB HB) based onboth experimental and theoretical studies. These considerationsallow us to quantitatively characterize the HB-induced AmIII3frequency shifts (summarized in Table 2) in the cases of thecommon protein/peptide secondary structure conformations.Then, we subtract these HB-induced shifts from the experi-mentally measured UVRR AmIII3 frequencies for pure second-ary structure conformations (Table 1), to refine Asher et al.’stheoretically predicted47 sinusoidal correlation between theAmIII3 frequency and the Ψ Ramachandran angle (eq 3). Thereason we neglect the Φ angular dependence of AmIII3frequency is explained in great detail above.Dependence of AmIII3 Frequency on PB HB. In N-
methylacetamide (NMA), theoretical calculations75,76 show thatthe formation of a single N-H PB-water HB upshifts theAmIII band by ∼17-20 cm-1, while formation of a CdO PB-water HB upshifts the AmIII frequency only 11-13 cm-1.Qualitatively, similar shifts should occur for PB-PB HB.However, N-H group PB-PB HB are somewhat stronger thanPB-water N-H group HB.101 In contrast, CdO group PB-PB HB have strengths similar to individual PB-water CdOHB.101 To complicate things, the total AmIII frequency shiftnonlinearly depends both on the number of PB HB formed andon their individual strengths.75,76 For example, three simulta-neous waters HB to a PB result in a larger AmIII frequencyupshift than the sum of upshifts of the individual HBs.Recently42 we identified the AmIII3 band in peptides and
proteins, the normal mode composition of which is essentiallysimilar to that of “classical” AmIII band of NMA. Figure 10,which shows the possible water HB geometries to a PB,indicates the estimated hydrogen bond AmIII3 frequency shiftfor each possibility.PB-water HB gives rise to a large temperature dependence
of the AmIII3 frequency22,29,42,43 due to anharmonicities.25,82-87A significantly smaller temperature dependence of the AmIII3frequency occurs for R-helix and �-sheet peptides because theyare extensively PB-PB HB.22,42,43,60,89 This difference occursbetween NMA dissolved in water and pure NMA, where thepure NMA HBs only to other NMA molecules (Table 4).Figure 11 compares the 204 nm UVRR spectra of neat liquid
NMA to a 0.13 M solution (1 vol %) of NMA in water at highand low temperatures. We find that the neat NMA AmII and
1936 J. Phys. Chem. B, Vol. 110, No. 4, 2006 Mikhonin et al.
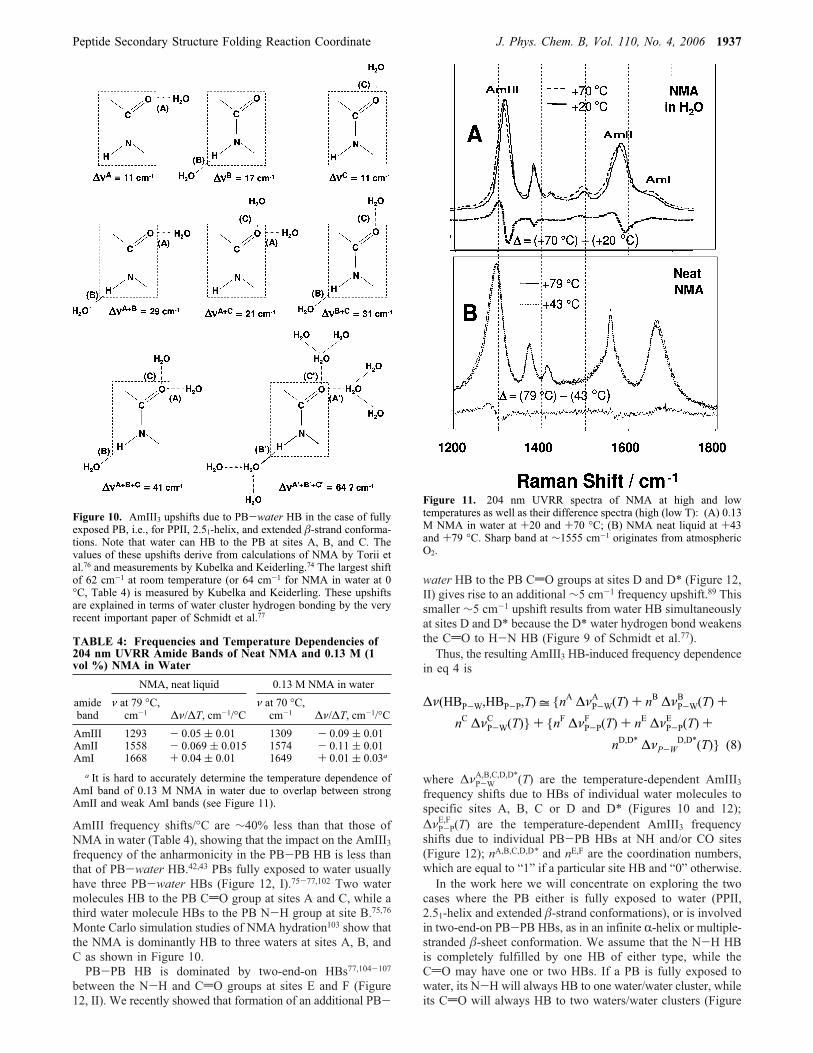
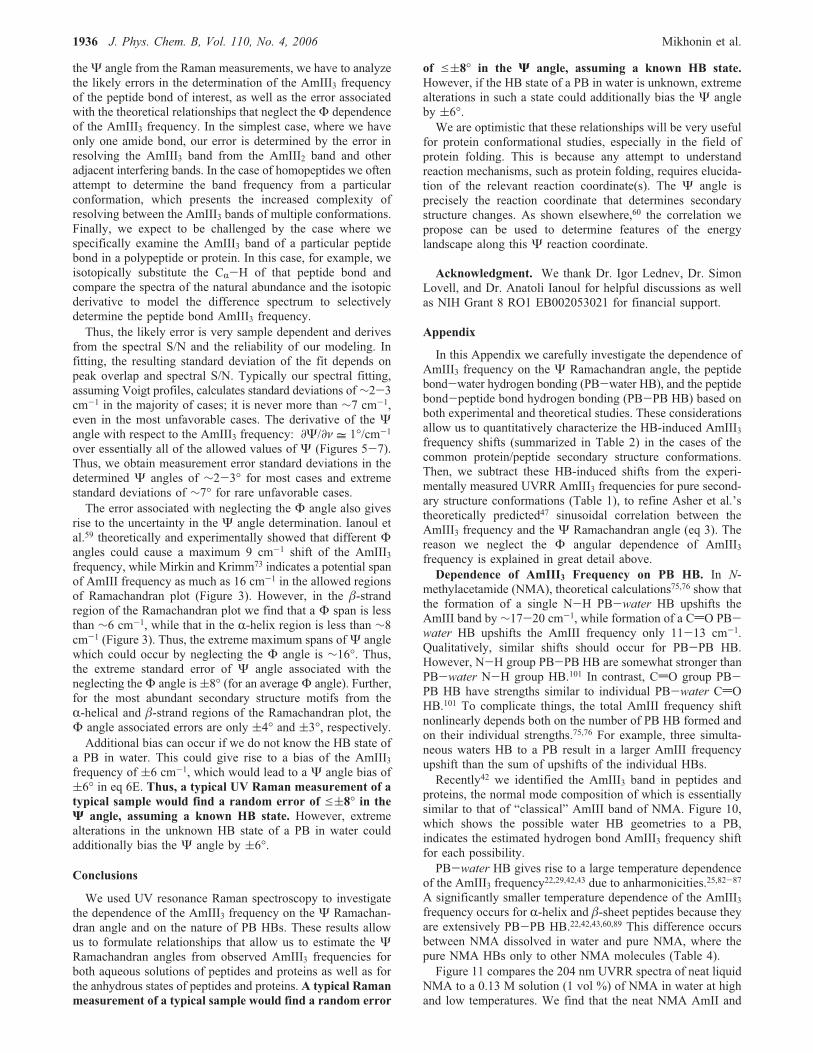
AmIII frequency shifts/°C are ∼40% less than that those ofNMA in water (Table 4), showing that the impact on the AmIII3frequency of the anharmonicity in the PB-PB HB is less thanthat of PB-water HB.42,43 PBs fully exposed to water usuallyhave three PB-water HBs (Figure 12, I).75-77,102 Two watermolecules HB to the PB CdO group at sites A and C, while athird water molecule HBs to the PB N-H group at site B.75,76Monte Carlo simulation studies of NMA hydration103 show thatthe NMA is dominantly HB to three waters at sites A, B, andC as shown in Figure 10.PB-PB HB is dominated by two-end-on HBs77,104-107
between the N-H and CdO groups at sites E and F (Figure12, II). We recently showed that formation of an additional PB-
water HB to the PB CdO groups at sites D and D* (Figure 12,II) gives rise to an additional ∼5 cm-1 frequency upshift.89 Thissmaller ∼5 cm-1 upshift results from water HB simultaneouslyat sites D and D* because the D* water hydrogen bond weakensthe CdO to H-N HB (Figure 9 of Schmidt et al.77).Thus, the resulting AmIII3 HB-induced frequency dependence
in eq 4 is
where ΔνP-WA,B,C,D,D*(T) are the temperature-dependent AmIII3
frequency shifts due to HBs of individual water molecules tospecific sites A, B, C or D and D* (Figures 10 and 12);ΔνP-P
E,F (T) are the temperature-dependent AmIII3 frequencyshifts due to individual PB-PB HBs at NH and/or CO sites(Figure 12); nA,B,C,D,D* and nE,F are the coordination numbers,which are equal to “1” if a particular site HB and “0” otherwise.In the work here we will concentrate on exploring the two
cases where the PB either is fully exposed to water (PPII,2.51-helix and extended �-strand conformations), or is involvedin two-end-on PB-PB HBs, as in an infinite R-helix or multiple-stranded �-sheet conformation. We assume that the N-H HBis completely fulfilled by one HB of either type, while theCdO may have one or two HBs. If a PB is fully exposed towater, its N-H will always HB to one water/water cluster, whileits CdO will always HB to two waters/water clusters (Figure
Figure 10. AmIII3 upshifts due to PB-water HB in the case of fullyexposed PB, i.e., for PPII, 2.51-helix, and extended �-strand conforma-tions. Note that water can HB to the PB at sites A, B, and C. Thevalues of these upshifts derive from calculations of NMA by Torii etal.76 and measurements by Kubelka and Keiderling.74 The largest shiftof 62 cm-1 at room temperature (or 64 cm-1 for NMA in water at 0°C, Table 4) is measured by Kubelka and Keiderling. These upshiftsare explained in terms of water cluster hydrogen bonding by the veryrecent important paper of Schmidt et al.77
TABLE 4: Frequencies and Temperature Dependencies of204 nm UVRR Amide Bands of Neat NMA and 0.13 M (1vol %) NMA in Water
NMA, neat liquid 0.13 M NMA in wateramideband
ν at 79 °C,cm-1 Δν/ΔT, cm-1/°C
ν at 70 °C,cm-1 Δν/ΔT, cm-1/°C
AmIII 1293 - 0.05 ( 0.01 1309 - 0.09 ( 0.01AmII 1558 - 0.069 ( 0.015 1574 - 0.11 ( 0.01AmI 1668 + 0.04 ( 0.01 1649 + 0.01 ( 0.03a
a It is hard to accurately determine the temperature dependence ofAmI band of 0.13 M NMA in water due to overlap between strongAmII and weak AmI bands (see Figure 11).
Figure 11. 204 nm UVRR spectra of NMA at high and lowtemperatures as well as their difference spectra (high (low T): (A) 0.13M NMA in water at +20 and +70 °C; (B) NMA neat liquid at +43and +79 °C. Sharp band at ∼1555 cm-1 originates from atmosphericO2.
Δν(HBP-W,HBP-P,T) = {nA ΔνP-WA (T) + nB ΔνP-W
B (T) +nC ΔνP-W
C (T)} + {nF ΔνP-PF (T) + nE ΔνP-P
E (T) +nD,D* ΔνP-W
D,D*(T)} (8)
Peptide Secondary Structure Folding Reaction Coordinate J. Phys. Chem. B, Vol. 110, No. 4, 2006 1937
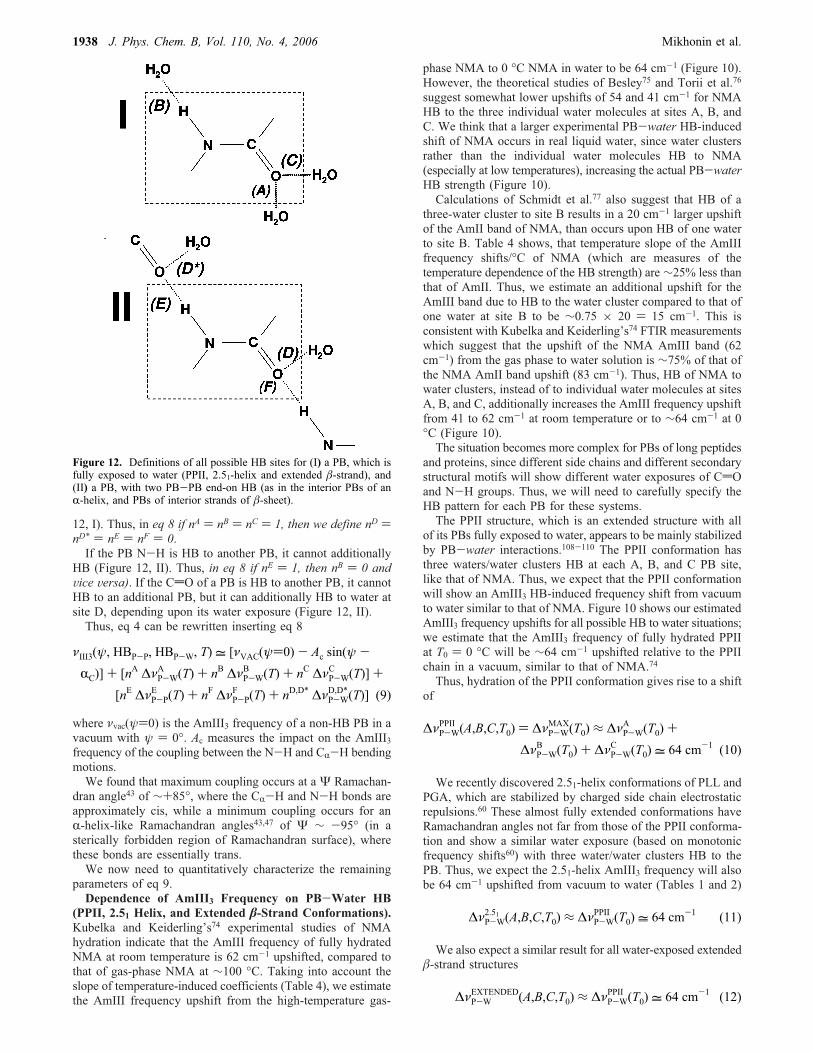
12, I). Thus, in eq 8 if nA ) nB ) nC ) 1, then we define nD )nD* ) nE ) nF ) 0.If the PB N-H is HB to another PB, it cannot additionally
HB (Figure 12, II). Thus, in eq 8 if nE ) 1, then nB ) 0 andVice Versa). If the CdO of a PB is HB to another PB, it cannotHB to an additional PB, but it can additionally HB to water atsite D, depending upon its water exposure (Figure 12, II).Thus, eq 4 can be rewritten inserting eq 8
where νvac(ψ)0) is the AmIII3 frequency of a non-HB PB in avacuum with ψ ) 0°. Ac measures the impact on the AmIII3frequency of the coupling between the N-H and CR-H bendingmotions.We found that maximum coupling occurs at a Ψ Ramachan-
dran angle43 of ∼+85°, where the CR-H and N-H bonds areapproximately cis, while a minimum coupling occurs for anR-helix-like Ramachandran angles43,47 of Ψ ∼ -95° (in asterically forbidden region of Ramachandran surface), wherethese bonds are essentially trans.We now need to quantitatively characterize the remaining
parameters of eq 9.Dependence of AmIII3 Frequency on PB-Water HB
(PPII, 2.51 Helix, and Extended �-Strand Conformations).Kubelka and Keiderling’s74 experimental studies of NMAhydration indicate that the AmIII frequency of fully hydratedNMA at room temperature is 62 cm-1 upshifted, compared tothat of gas-phase NMA at ∼100 °C. Taking into account theslope of temperature-induced coefficients (Table 4), we estimatethe AmIII frequency upshift from the high-temperature gas-
phase NMA to 0 °C NMA in water to be 64 cm-1 (Figure 10).However, the theoretical studies of Besley75 and Torii et al.76suggest somewhat lower upshifts of 54 and 41 cm-1 for NMAHB to the three individual water molecules at sites A, B, andC. We think that a larger experimental PB-water HB-inducedshift of NMA occurs in real liquid water, since water clustersrather than the individual water molecules HB to NMA(especially at low temperatures), increasing the actual PB-waterHB strength (Figure 10).Calculations of Schmidt et al.77 also suggest that HB of a
three-water cluster to site B results in a 20 cm-1 larger upshiftof the AmII band of NMA, than occurs upon HB of one waterto site B. Table 4 shows, that temperature slope of the AmIIIfrequency shifts/°C of NMA (which are measures of thetemperature dependence of the HB strength) are ∼25% less thanthat of AmII. Thus, we estimate an additional upshift for theAmIII band due to HB to the water cluster compared to that ofone water at site B to be ∼0.75 × 20 ) 15 cm-1. This isconsistent with Kubelka and Keiderling’s74 FTIR measurementswhich suggest that the upshift of the NMA AmIII band (62cm-1) from the gas phase to water solution is ∼75% of that ofthe NMA AmII band upshift (83 cm-1). Thus, HB of NMA towater clusters, instead of to individual water molecules at sitesA, B, and C, additionally increases the AmIII frequency upshiftfrom 41 to 62 cm-1 at room temperature or to ∼64 cm-1 at 0°C (Figure 10).The situation becomes more complex for PBs of long peptides
and proteins, since different side chains and different secondarystructural motifs will show different water exposures of CdOand N-H groups. Thus, we will need to carefully specify theHB pattern for each PB for these systems.The PPII structure, which is an extended structure with all
of its PBs fully exposed to water, appears to be mainly stabilizedby PB-water interactions.108-110 The PPII conformation hasthree waters/water clusters HB at each A, B, and C PB site,like that of NMA. Thus, we expect that the PPII conformationwill show an AmIII3 HB-induced frequency shift from vacuumto water similar to that of NMA. Figure 10 shows our estimatedAmIII3 frequency upshifts for all possible HB to water situations;we estimate that the AmIII3 frequency of fully hydrated PPIIat T0 ) 0 °C will be ∼64 cm-1 upshifted relative to the PPIIchain in a vacuum, similar to that of NMA.74Thus, hydration of the PPII conformation gives rise to a shift
of
We recently discovered 2.51-helix conformations of PLL andPGA, which are stabilized by charged side chain electrostaticrepulsions.60 These almost fully extended conformations haveRamachandran angles not far from those of the PPII conforma-tion and show a similar water exposure (based on monotonicfrequency shifts60) with three water/water clusters HB to thePB. Thus, we expect the 2.51-helix AmIII3 frequency will alsobe 64 cm-1 upshifted from vacuum to water (Tables 1 and 2)
We also expect a similar result for all water-exposed extended�-strand structures
Figure 12. Definitions of all possible HB sites for (I) a PB, which isfully exposed to water (PPII, 2.51-helix and extended �-strand), and(II) a PB, with two PB-PB end-on HB (as in the interior PBs of anR-helix, and PBs of interior strands of �-sheet).
ΔνP-WPPII (A,B,C,T0) ) ΔνP-W
MAX(T0) ≈ ΔνP-WA (T0) +
ΔνP-WB (T0) + ΔνP-W
C (T0) = 64 cm-1 (10)
ΔνP-W2.51 (A,B,C,T0) ≈ ΔνP-W
PPII (T0) = 64 cm-1 (11)
ΔνP-WEXTENDED(A,B,C,T0) ≈ ΔνP-W
PPII (T0) = 64 cm-1 (12)
νIII3(ψ, HBP-P, HBP-W, T) = [νVAC(ψ)0) - Ac sin(ψ -
RC)] + [nA ΔνP-W
A (T) + nB ΔνP-WB (T) + nC ΔνP-W
C (T)] +[nE ΔνP-P
E (T) + nF ΔνP-PF (T) + nD,D* ΔνP-W
D,D*(T)] (9)
1938 J. Phys. Chem. B, Vol. 110, No. 4, 2006 Mikhonin et al.
Assuming that the PB of these extended �-strand-likestructures HB to water clusters, rather than to single watermolecules, we can quantitatively estimate the individual HBAmIII3 upshifts at site A, B, and C from the AmII upshifts ofSchmidt et al.77 The HB-induced upshifts of AmIII3 band are∼75% of the AmII frequency upshifts (see discussion above).However, the sum of the AmIII3 upshifts, estimated from the
Shmidt et al.77 AmII upshifts, is slightly lower than theempirically obtained 64 cm-1 upshift (eq 12). This is consistentwith theoretical studies of Besley75 and Torii et al.,76 whichpropose that the three simultaneous PB-water HBs at sites A,B, and C result in a slightly higher AmIII3 frequency upshiftthan the sum of upshifts due to the individual HBs. Forsimplicity, we neglect this nonlinearity and estimate theparameters in eq 10 as ΔνP-W
A ) 15 cm-1, ΔνP-WB ) 33 cm-1,
and ΔνP-WC ) 16 cm-1 to make their sum equal to 64 cm-1.
Thus, in the case of a fully exposed to water extended �-strandstructure, we write
where T0 ) 0 °C.Dependence of AmIII3 Frequency on Peptide Bond-
Peptide Bond HB in Neat NMA.We can estimate the influenceof PB-PB HBs on the AmIII3 frequency directly from theexperimentally measured AmIII frequencies of neat NMA andNMA in water (Figure 11, Table 4). NMA in water shows a1315 cm-1 AmIII frequency at 0 °C, 64 cm-1 upshifted withrespect to that in a vacuum74 at 1251 cm-1. There seems to besome systematic difference between the gas-phase NMA 1255cm-1 value reported by Kubelka and Keiderling74 and the 1259cm-1 value reported by Mayne and Hudson.111The NMA AmIII frequency upshifts from 1251 cm-1 in the
gas phase to 1295 cm-1 in the neat liquid (at +40 °C) is causedby PB-PB HB. Neat NMA solutions are dominated by NMAclusters with only two PB-PB HBs.104,106,107 Thus, utilizingthe temperature-induced frequency shifts of Table 4, we estimatea 46 cm-1 AmIII3 frequency upshift at 0 °C due to PB-PBHB
since nE ) nF ) 1.Alternatively, Schmidt et al.’s.77 calculations predict a 43
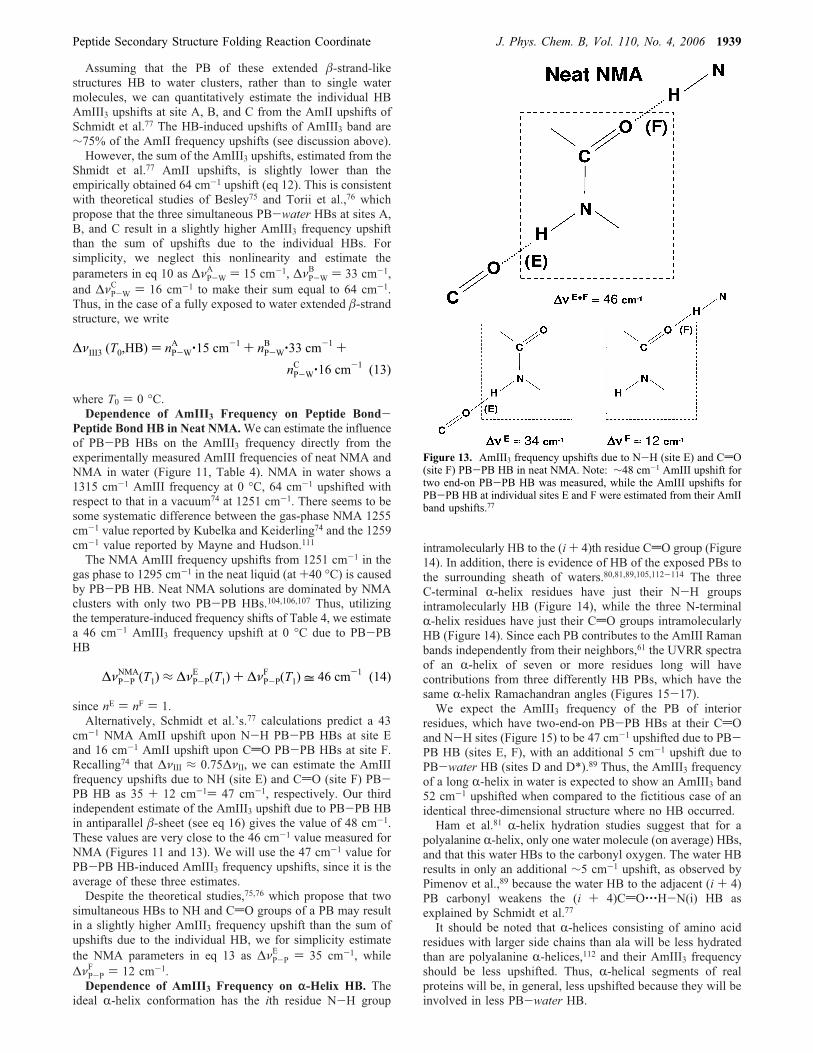
cm-1 NMA AmII upshift upon N-H PB-PB HBs at site Eand 16 cm-1 AmII upshift upon CdO PB-PB HBs at site F.Recalling74 that ΔνIII ≈ 0.75ΔνII, we can estimate the AmIIIfrequency upshifts due to NH (site E) and CdO (site F) PB-PB HB as 35 + 12 cm-1) 47 cm-1, respectively. Our thirdindependent estimate of the AmIII3 upshift due to PB-PB HBin antiparallel �-sheet (see eq 16) gives the value of 48 cm-1.These values are very close to the 46 cm-1 value measured forNMA (Figures 11 and 13). We will use the 47 cm-1 value forPB-PB HB-induced AmIII3 frequency upshifts, since it is theaverage of these three estimates.Despite the theoretical studies,75,76 which propose that two
simultaneous HBs to NH and CdO groups of a PB may resultin a slightly higher AmIII3 frequency upshift than the sum ofupshifts due to the individual HB, we for simplicity estimatethe NMA parameters in eq 13 as ΔνP-P
E ) 35 cm-1, whileΔνP-P
F ) 12 cm-1.Dependence of AmIII3 Frequency on r-Helix HB. The
ideal R-helix conformation has the ith residue N-H group
intramolecularly HB to the (i+ 4)th residue CdO group (Figure14). In addition, there is evidence of HB of the exposed PBs tothe surrounding sheath of waters.80,81,89,105,112-114 The threeC-terminal R-helix residues have just their N-H groupsintramolecularly HB (Figure 14), while the three N-terminalR-helix residues have just their CdO groups intramolecularlyHB (Figure 14). Since each PB contributes to the AmIII Ramanbands independently from their neighbors,61 the UVRR spectraof an R-helix of seven or more residues long will havecontributions from three differently HB PBs, which have thesame R-helix Ramachandran angles (Figures 15-17).We expect the AmIII3 frequency of the PB of interior
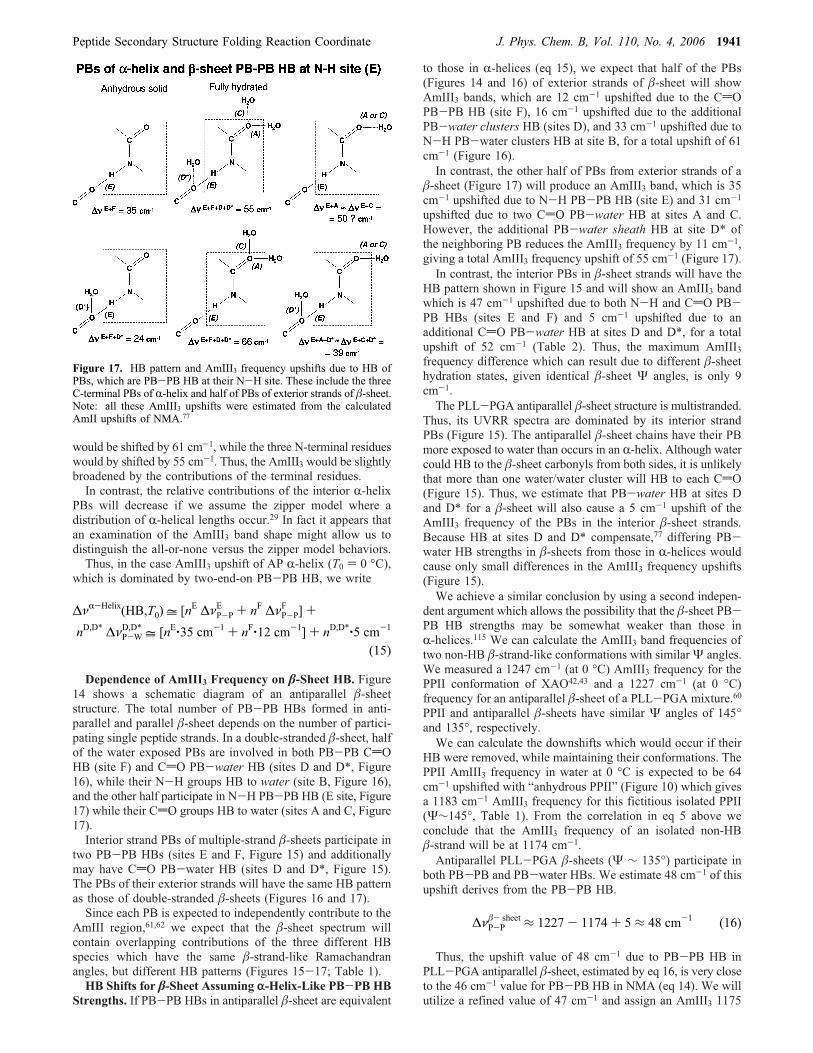
residues, which have two-end-on PB-PB HBs at their CdOand N-H sites (Figure 15) to be 47 cm-1 upshifted due to PB-PB HB (sites E, F), with an additional 5 cm-1 upshift due toPB-water HB (sites D and D*).89 Thus, the AmIII3 frequencyof a long R-helix in water is expected to show an AmIII3 band52 cm-1 upshifted when compared to the fictitious case of anidentical three-dimensional structure where no HB occurred.Ham et al.81 R-helix hydration studies suggest that for a
polyalanine R-helix, only one water molecule (on average) HBs,and that this water HBs to the carbonyl oxygen. The water HBresults in only an additional ∼5 cm-1 upshift, as observed byPimenov et al.,89 because the water HB to the adjacent (i + 4)PB carbonyl weakens the (i + 4)CdO‚‚‚H-N(i) HB asexplained by Schmidt et al.77It should be noted that R-helices consisting of amino acid
residues with larger side chains than ala will be less hydratedthan are polyalanine R-helices,112 and their AmIII3 frequencyshould be less upshifted. Thus, R-helical segments of realproteins will be, in general, less upshifted because they will beinvolved in less PB-water HB.
Figure 13. AmIII3 frequency upshifts due to N-H (site E) and CdO(site F) PB-PB HB in neat NMA. Note: ∼48 cm-1 AmIII upshift fortwo end-on PB-PB HB was measured, while the AmIII upshifts forPB-PB HB at individual sites E and F were estimated from their AmIIband upshifts.77
ΔνIII3 (T0,HB) ) nP-WA ‚15 cm-1 + nP-W
B ‚33 cm-1 +
nP-WC ‚16 cm-1 (13)
ΔνP-PNMA(T1) ≈ ΔνP-P
E (T1) + ΔνP-PF (T1) = 46 cm
-1 (14)
Peptide Secondary Structure Folding Reaction Coordinate J. Phys. Chem. B, Vol. 110, No. 4, 2006 1939
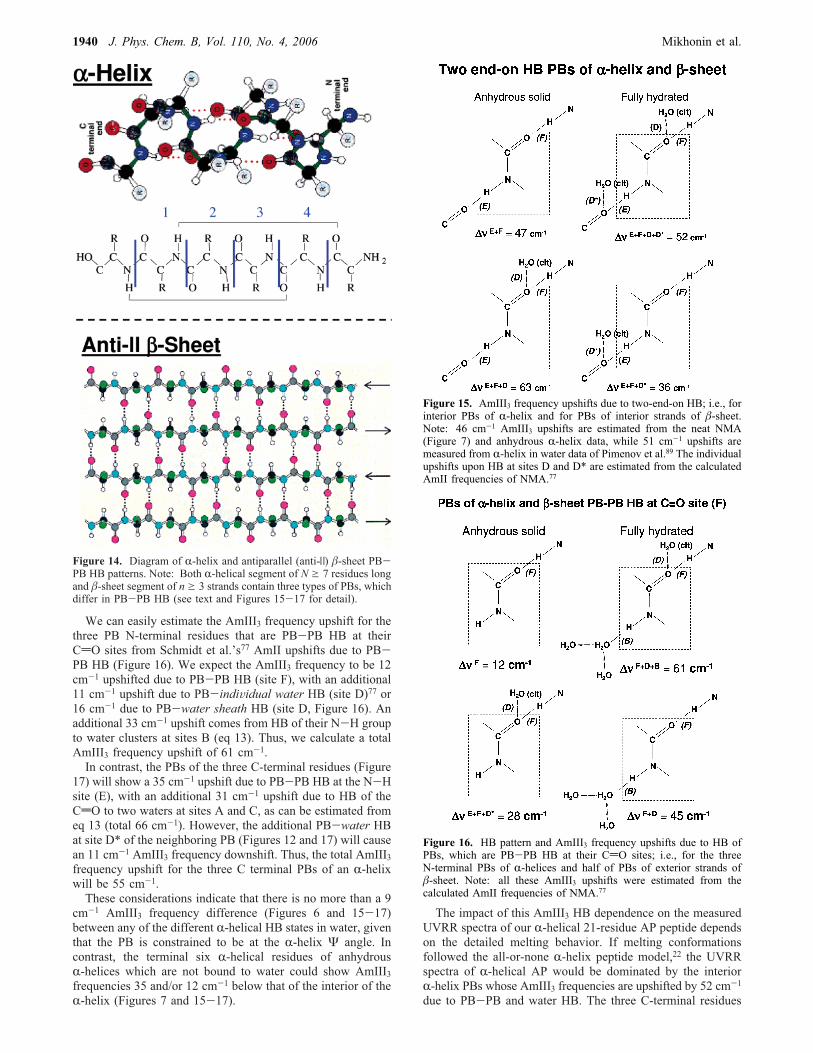
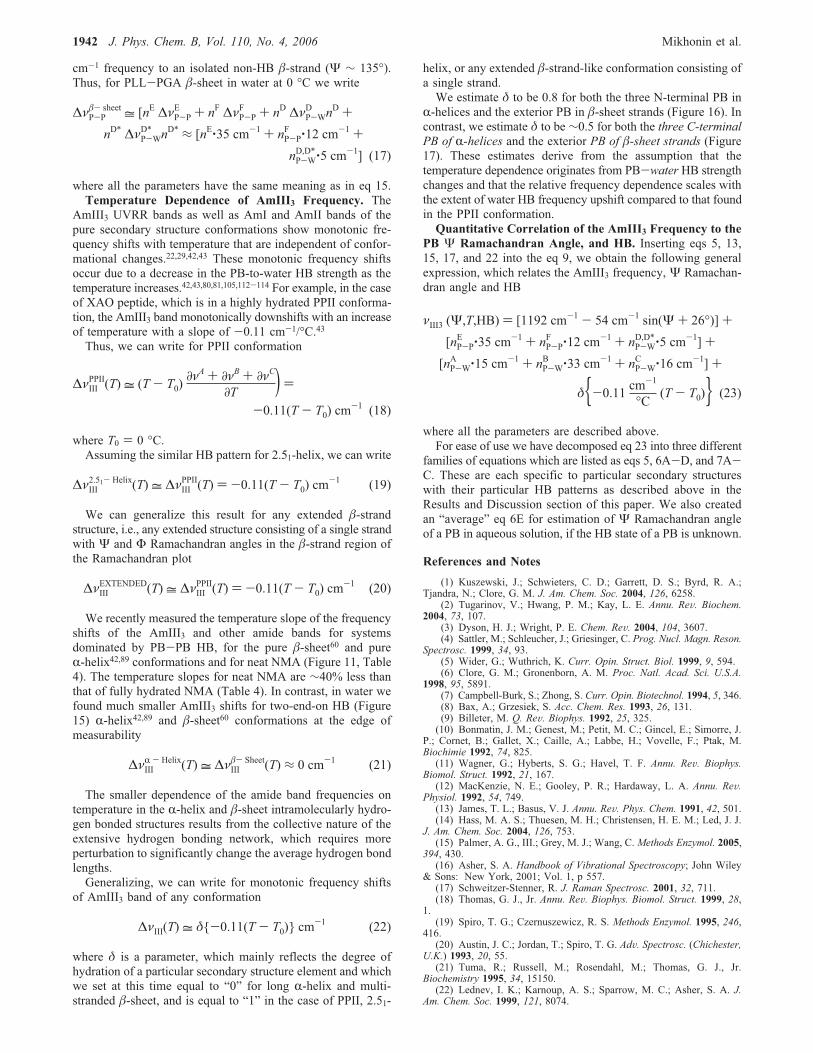
We can easily estimate the AmIII3 frequency upshift for thethree PB N-terminal residues that are PB-PB HB at theirCdO sites from Schmidt et al.’s77 AmII upshifts due to PB-PB HB (Figure 16). We expect the AmIII3 frequency to be 12cm-1 upshifted due to PB-PB HB (site F), with an additional11 cm-1 upshift due to PB-indiVidual water HB (site D)77 or16 cm-1 due to PB-water sheath HB (site D, Figure 16). Anadditional 33 cm-1 upshift comes from HB of their N-H groupto water clusters at sites B (eq 13). Thus, we calculate a totalAmIII3 frequency upshift of 61 cm-1.In contrast, the PBs of the three C-terminal residues (Figure
17) will show a 35 cm-1 upshift due to PB-PB HB at the N-Hsite (E), with an additional 31 cm-1 upshift due to HB of theCdO to two waters at sites A and C, as can be estimated fromeq 13 (total 66 cm-1). However, the additional PB-water HBat site D* of the neighboring PB (Figures 12 and 17) will causean 11 cm-1 AmIII3 frequency downshift. Thus, the total AmIII3frequency upshift for the three C terminal PBs of an R-helixwill be 55 cm-1.These considerations indicate that there is no more than a 9
cm-1 AmIII3 frequency difference (Figures 6 and 15-17)between any of the different R-helical HB states in water, giventhat the PB is constrained to be at the R-helix Ψ angle. Incontrast, the terminal six R-helical residues of anhydrousR-helices which are not bound to water could show AmIII3frequencies 35 and/or 12 cm-1 below that of the interior of theR-helix (Figures 7 and 15-17).
The impact of this AmIII3 HB dependence on the measuredUVRR spectra of our R-helical 21-residue AP peptide dependson the detailed melting behavior. If melting conformationsfollowed the all-or-none R-helix peptide model,22 the UVRRspectra of R-helical AP would be dominated by the interiorR-helix PBs whose AmIII3 frequencies are upshifted by 52 cm-1
due to PB-PB and water HB. The three C-terminal residues
Figure 14. Diagram of R-helix and antiparallel (anti-|) �-sheet PB-PB HB patterns. Note: Both R-helical segment of N g 7 residues longand �-sheet segment of n g 3 strands contain three types of PBs, whichdiffer in PB-PB HB (see text and Figures 15-17 for detail).
Figure 15. AmIII3 frequency upshifts due to two-end-on HB; i.e., forinterior PBs of R-helix and for PBs of interior strands of �-sheet.Note: 46 cm-1 AmIII3 upshifts are estimated from the neat NMA(Figure 7) and anhydrous R-helix data, while 51 cm-1 upshifts aremeasured from R-helix in water data of Pimenov et al.89 The individualupshifts upon HB at sites D and D* are estimated from the calculatedAmII frequencies of NMA.77
Figure 16. HB pattern and AmIII3 frequency upshifts due to HB ofPBs, which are PB-PB HB at their CdO sites; i.e., for the threeN-terminal PBs of R-helices and half of PBs of exterior strands of�-sheet. Note: all these AmIII3 upshifts were estimated from thecalculated AmII frequencies of NMA.77
1940 J. Phys. Chem. B, Vol. 110, No. 4, 2006 Mikhonin et al.
would be shifted by 61 cm-1, while the three N-terminal residueswould by shifted by 55 cm-1. Thus, the AmIII3 would be slightlybroadened by the contributions of the terminal residues.In contrast, the relative contributions of the interior R-helix
PBs will decrease if we assume the zipper model where adistribution of R-helical lengths occur.29 In fact it appears thatan examination of the AmIII3 band shape might allow us todistinguish the all-or-none versus the zipper model behaviors.Thus, in the case AmIII3 upshift of AP R-helix (T0 ) 0 °C),
which is dominated by two-end-on PB-PB HB, we write
Dependence of AmIII3 Frequency on �-Sheet HB. Figure14 shows a schematic diagram of an antiparallel �-sheetstructure. The total number of PB-PB HBs formed in anti-parallel and parallel �-sheet depends on the number of partici-pating single peptide strands. In a double-stranded �-sheet, halfof the water exposed PBs are involved in both PB-PB CdOHB (site F) and CdO PB-water HB (sites D and D*, Figure16), while their N-H groups HB to water (site B, Figure 16),and the other half participate in N-H PB-PB HB (E site, Figure17) while their CdO groups HB to water (sites A and C, Figure17).Interior strand PBs of multiple-strand �-sheets participate in
two PB-PB HBs (sites E and F, Figure 15) and additionallymay have CdO PB-water HB (sites D and D*, Figure 15).The PBs of their exterior strands will have the same HB patternas those of double-stranded �-sheets (Figures 16 and 17).Since each PB is expected to independently contribute to the
AmIII region,61,62 we expect that the �-sheet spectrum willcontain overlapping contributions of the three different HBspecies which have the same �-strand-like Ramachandranangles, but different HB patterns (Figures 15-17; Table 1).HB Shifts for �-Sheet Assuming r-Helix-Like PB-PB HB
Strengths. If PB-PB HBs in antiparallel �-sheet are equivalent
to those in R-helices (eq 15), we expect that half of the PBs(Figures 14 and 16) of exterior strands of �-sheet will showAmIII3 bands, which are 12 cm-1 upshifted due to the CdOPB-PB HB (site F), 16 cm-1 upshifted due to the additionalPB-water clusters HB (sites D), and 33 cm-1 upshifted due toN-H PB-water clusters HB at site B, for a total upshift of 61cm-1 (Figure 16).In contrast, the other half of PBs from exterior strands of a
�-sheet (Figure 17) will produce an AmIII3 band, which is 35cm-1 upshifted due to N-H PB-PB HB (site E) and 31 cm-1
upshifted due to two CdO PB-water HB at sites A and C.However, the additional PB-water sheath HB at site D* ofthe neighboring PB reduces the AmIII3 frequency by 11 cm-1,giving a total AmIII3 frequency upshift of 55 cm-1 (Figure 17).In contrast, the interior PBs in �-sheet strands will have the
HB pattern shown in Figure 15 and will show an AmIII3 bandwhich is 47 cm-1 upshifted due to both N-H and CdO PB-PB HBs (sites E and F) and 5 cm-1 upshifted due to anadditional CdO PB-water HB at sites D and D*, for a totalupshift of 52 cm-1 (Table 2). Thus, the maximum AmIII3frequency difference which can result due to different �-sheethydration states, given identical �-sheet Ψ angles, is only 9cm-1.The PLL-PGA antiparallel �-sheet structure is multistranded.
Thus, its UVRR spectra are dominated by its interior strandPBs (Figure 15). The antiparallel �-sheet chains have their PBmore exposed to water than occurs in an R-helix. Although watercould HB to the �-sheet carbonyls from both sides, it is unlikelythat more than one water/water cluster will HB to each CdO(Figure 15). Thus, we estimate that PB-water HB at sites Dand D* for a �-sheet will also cause a 5 cm-1 upshift of theAmIII3 frequency of the PBs in the interior �-sheet strands.Because HB at sites D and D* compensate,77 differing PB-water HB strengths in �-sheets from those in R-helices wouldcause only small differences in the AmIII3 frequency upshifts(Figure 15).We achieve a similar conclusion by using a second indepen-
dent argument which allows the possibility that the �-sheet PB-PB HB strengths may be somewhat weaker than those inR-helices.115 We can calculate the AmIII3 band frequencies oftwo non-HB �-strand-like conformations with similarΨ angles.We measured a 1247 cm-1 (at 0 °C) AmIII3 frequency for thePPII conformation of XAO42,43 and a 1227 cm-1 (at 0 °C)frequency for an antiparallel �-sheet of a PLL-PGA mixture.60PPII and antiparallel �-sheets have similar Ψ angles of 145°and 135°, respectively.We can calculate the downshifts which would occur if their
HB were removed, while maintaining their conformations. ThePPII AmIII3 frequency in water at 0 °C is expected to be 64cm-1 upshifted with “anhydrous PPII” (Figure 10) which givesa 1183 cm-1 AmIII3 frequency for this fictitious isolated PPII(Ψ∼145°, Table 1). From the correlation in eq 5 above weconclude that the AmIII3 frequency of an isolated non-HB�-strand will be at 1174 cm-1.Antiparallel PLL-PGA �-sheets (Ψ ∼ 135°) participate in
both PB-PB and PB-water HBs. We estimate 48 cm-1 of thisupshift derives from the PB-PB HB.
Thus, the upshift value of 48 cm-1 due to PB-PB HB inPLL-PGA antiparallel �-sheet, estimated by eq 16, is very closeto the 46 cm-1 value for PB-PB HB in NMA (eq 14). We willutilize a refined value of 47 cm-1 and assign an AmIII3 1175
Figure 17. HB pattern and AmIII3 frequency upshifts due to HB ofPBs, which are PB-PB HB at their N-H site. These include the threeC-terminal PBs of R-helix and half of PBs of exterior strands of �-sheet.Note: all these AmIII3 upshifts were estimated from the calculatedAmII upshifts of NMA.77
ΔνR-Helix(HB,T0) = [nE ΔνP-P
E + nF ΔνP-PF ] +
nD,D* ΔνP-WD,D* = [nE‚35 cm-1 + nF‚12 cm-1] + nD,D*‚5 cm-1
(15)
ΔνP-P�- sheet ≈ 1227 - 1174 + 5 ≈ 48 cm-1 (16)
Peptide Secondary Structure Folding Reaction Coordinate J. Phys. Chem. B, Vol. 110, No. 4, 2006 1941
cm-1 frequency to an isolated non-HB �-strand (Ψ ∼ 135°).Thus, for PLL-PGA �-sheet in water at 0 °C we write
where all the parameters have the same meaning as in eq 15.Temperature Dependence of AmIII3 Frequency. The
AmIII3 UVRR bands as well as AmI and AmII bands of thepure secondary structure conformations show monotonic fre-quency shifts with temperature that are independent of confor-mational changes.22,29,42,43 These monotonic frequency shiftsoccur due to a decrease in the PB-to-water HB strength as thetemperature increases.42,43,80,81,105,112-114 For example, in the caseof XAO peptide, which is in a highly hydrated PPII conforma-tion, the AmIII3 band monotonically downshifts with an increaseof temperature with a slope of -0.11 cm-1/°C.43Thus, we can write for PPII conformation
where T0 ) 0 °C.Assuming the similar HB pattern for 2.51-helix, we can write
We can generalize this result for any extended �-strandstructure, i.e., any extended structure consisting of a single strandwith Ψ and Φ Ramachandran angles in the �-strand region ofthe Ramachandran plot
We recently measured the temperature slope of the frequencyshifts of the AmIII3 and other amide bands for systemsdominated by PB-PB HB, for the pure �-sheet60 and pureR-helix42,89 conformations and for neat NMA (Figure 11, Table4). The temperature slopes for neat NMA are ∼40% less thanthat of fully hydrated NMA (Table 4). In contrast, in water wefound much smaller AmIII3 shifts for two-end-on HB (Figure15) R-helix42,89 and �-sheet60 conformations at the edge ofmeasurability
The smaller dependence of the amide band frequencies ontemperature in the R-helix and �-sheet intramolecularly hydro-gen bonded structures results from the collective nature of theextensive hydrogen bonding network, which requires moreperturbation to significantly change the average hydrogen bondlengths.Generalizing, we can write for monotonic frequency shifts
of AmIII3 band of any conformation
where δ is a parameter, which mainly reflects the degree ofhydration of a particular secondary structure element and whichwe set at this time equal to “0” for long R-helix and multi-stranded �-sheet, and is equal to “1” in the case of PPII, 2.51-
helix, or any extended �-strand-like conformation consisting ofa single strand.We estimate δ to be 0.8 for both the three N-terminal PB in
R-helices and the exterior PB in �-sheet strands (Figure 16). Incontrast, we estimate δ to be ∼0.5 for both the three C-terminalPB of R-helices and the exterior PB of �-sheet strands (Figure17). These estimates derive from the assumption that thetemperature dependence originates from PB-water HB strengthchanges and that the relative frequency dependence scales withthe extent of water HB frequency upshift compared to that foundin the PPII conformation.Quantitative Correlation of the AmIII3 Frequency to the
PB Ψ Ramachandran Angle, and HB. Inserting eqs 5, 13,15, 17, and 22 into the eq 9, we obtain the following generalexpression, which relates the AmIII3 frequency, Ψ Ramachan-dran angle and HB
where all the parameters are described above.For ease of use we have decomposed eq 23 into three different
families of equations which are listed as eqs 5, 6A-D, and 7A-C. These are each specific to particular secondary structureswith their particular HB patterns as described above in theResults and Discussion section of this paper. We also createdan “average” eq 6E for estimation of Ψ Ramachandran angleof a PB in aqueous solution, if the HB state of a PB is unknown.
References and Notes(1) Kuszewski, J.; Schwieters, C. D.; Garrett, D. S.; Byrd, R. A.;
Tjandra, N.; Clore, G. M. J. Am. Chem. Soc. 2004, 126, 6258.(2) Tugarinov, V.; Hwang, P. M.; Kay, L. E. Annu. ReV. Biochem.
2004, 73, 107.(3) Dyson, H. J.; Wright, P. E. Chem. ReV. 2004, 104, 3607.(4) Sattler, M.; Schleucher, J.; Griesinger, C. Prog. Nucl. Magn. Reson.
Spectrosc. 1999, 34, 93.(5) Wider, G.; Wuthrich, K. Curr. Opin. Struct. Biol. 1999, 9, 594.(6) Clore, G. M.; Gronenborn, A. M. Proc. Natl. Acad. Sci. U.S.A.
1998, 95, 5891.(7) Campbell-Burk, S.; Zhong, S. Curr. Opin. Biotechnol. 1994, 5, 346.(8) Bax, A.; Grzesiek, S. Acc. Chem. Res. 1993, 26, 131.(9) Billeter, M. Q. ReV. Biophys. 1992, 25, 325.(10) Bonmatin, J. M.; Genest, M.; Petit, M. C.; Gincel, E.; Simorre, J.
P.; Cornet, B.; Gallet, X.; Caille, A.; Labbe, H.; Vovelle, F.; Ptak, M.Biochimie 1992, 74, 825.(11) Wagner, G.; Hyberts, S. G.; Havel, T. F. Annu. ReV. Biophys.
Biomol. Struct. 1992, 21, 167.(12) MacKenzie, N. E.; Gooley, P. R.; Hardaway, L. A. Annu. ReV.
Physiol. 1992, 54, 749.(13) James, T. L.; Basus, V. J. Annu. ReV. Phys. Chem. 1991, 42, 501.(14) Hass, M. A. S.; Thuesen, M. H.; Christensen, H. E. M.; Led, J. J.
J. Am. Chem. Soc. 2004, 126, 753.(15) Palmer, A. G., III.; Grey, M. J.; Wang, C. Methods Enzymol. 2005,
394, 430.(16) Asher, S. A. Handbook of Vibrational Spectroscopy; John Wiley
& Sons: New York, 2001; Vol. 1, p 557.(17) Schweitzer-Stenner, R. J. Raman Spectrosc. 2001, 32, 711.(18) Thomas, G. J., Jr. Annu. ReV. Biophys. Biomol. Struct. 1999, 28,
1.(19) Spiro, T. G.; Czernuszewicz, R. S. Methods Enzymol. 1995, 246,
416.(20) Austin, J. C.; Jordan, T.; Spiro, T. G. AdV. Spectrosc. (Chichester,
U.K.) 1993, 20, 55.(21) Tuma, R.; Russell, M.; Rosendahl, M.; Thomas, G. J., Jr.
Biochemistry 1995, 34, 15150.(22) Lednev, I. K.; Karnoup, A. S.; Sparrow, M. C.; Asher, S. A. J.
Am. Chem. Soc. 1999, 121, 8074.
ΔνP-P�- sheet = [nE ΔνP-P
E + nF ΔνP-PF + nD ΔνP-W
D nD +nD* ΔνP-W
D* nD* ≈ [nE‚35 cm-1 + nP-PF ‚12 cm-1 +
nP-WD,D*‚5 cm-1] (17)
ΔνIIIPPII(T) = (T - T0)
∂νA + ∂νB + ∂νC
∂T ) )-0.11(T - T0) cm
-1 (18)
ΔνIII2.51- Helix(T) = ΔνIII
PPII(T) ) -0.11(T - T0) cm-1 (19)
ΔνIIIEXTENDED(T) = ΔνIII
PPII(T) ) -0.11(T - T0) cm-1 (20)
ΔνIIIR - Helix(T) = ΔνIII
�- Sheet(T) ≈ 0 cm-1 (21)
ΔνIII(T) = δ{-0.11(T - T0)} cm-1 (22)
νIII3 (Ψ,T,HB) ) [1192 cm-1 - 54 cm-1 sin(Ψ + 26°)] +
[nP-PE ‚35 cm-1 + nP-P
F ‚12 cm-1 + nP-WD,D*‚5 cm-1] +
[nP-WA ‚15 cm-1 + nP-W
B ‚33 cm-1 + nP-WC ‚16 cm-1] +
δ{-0.11 cm-1
°C (T - T0)} (23)
1942 J. Phys. Chem. B, Vol. 110, No. 4, 2006 Mikhonin et al.
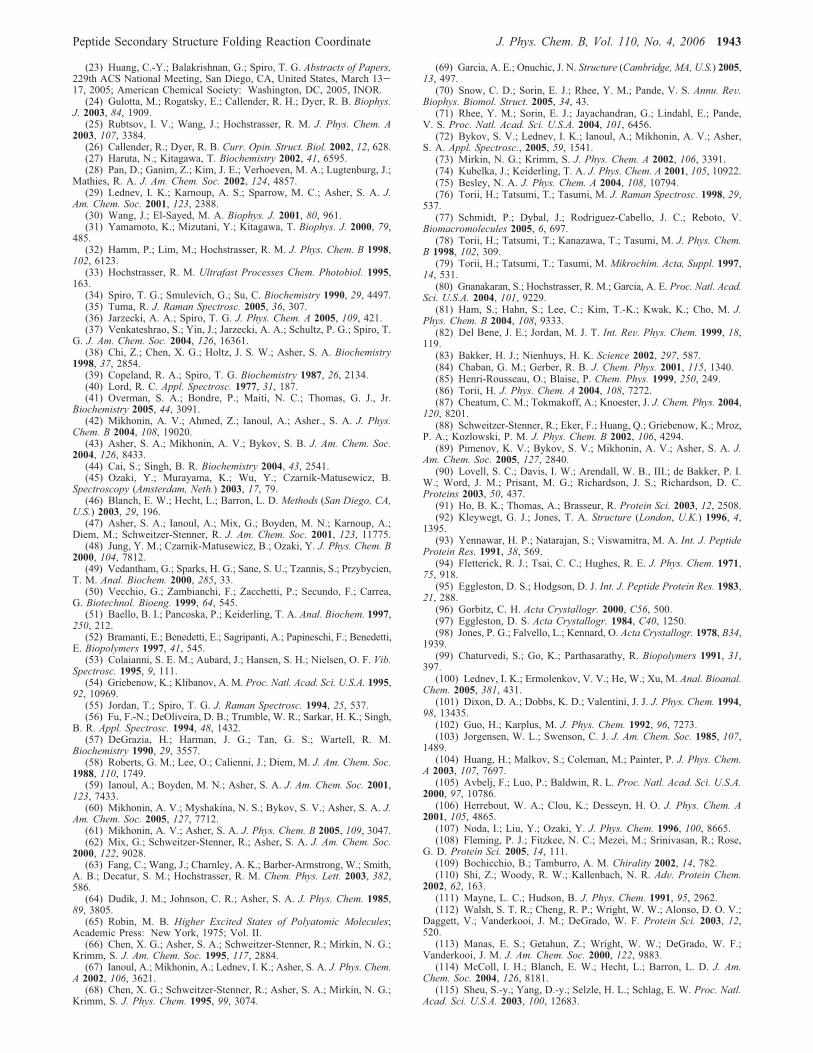
(23) Huang, C.-Y.; Balakrishnan, G.; Spiro, T. G. Abstracts of Papers,229th ACS National Meeting, San Diego, CA, United States, March 13-17, 2005; American Chemical Society: Washington, DC, 2005, INOR.(24) Gulotta, M.; Rogatsky, E.; Callender, R. H.; Dyer, R. B. Biophys.
J. 2003, 84, 1909.(25) Rubtsov, I. V.; Wang, J.; Hochstrasser, R. M. J. Phys. Chem. A
2003, 107, 3384.(26) Callender, R.; Dyer, R. B. Curr. Opin. Struct. Biol. 2002, 12, 628.(27) Haruta, N.; Kitagawa, T. Biochemistry 2002, 41, 6595.(28) Pan, D.; Ganim, Z.; Kim, J. E.; Verhoeven, M. A.; Lugtenburg, J.;
Mathies, R. A. J. Am. Chem. Soc. 2002, 124, 4857.(29) Lednev, I. K.; Karnoup, A. S.; Sparrow, M. C.; Asher, S. A. J.
Am. Chem. Soc. 2001, 123, 2388.(30) Wang, J.; El-Sayed, M. A. Biophys. J. 2001, 80, 961.(31) Yamamoto, K.; Mizutani, Y.; Kitagawa, T. Biophys. J. 2000, 79,
485.(32) Hamm, P.; Lim, M.; Hochstrasser, R. M. J. Phys. Chem. B 1998,
102, 6123.(33) Hochstrasser, R. M. Ultrafast Processes Chem. Photobiol. 1995,
163.(34) Spiro, T. G.; Smulevich, G.; Su, C. Biochemistry 1990, 29, 4497.(35) Tuma, R. J. Raman Spectrosc. 2005, 36, 307.(36) Jarzecki, A. A.; Spiro, T. G. J. Phys. Chem. A 2005, 109, 421.(37) Venkateshrao, S.; Yin, J.; Jarzecki, A. A.; Schultz, P. G.; Spiro, T.
G. J. Am. Chem. Soc. 2004, 126, 16361.(38) Chi, Z.; Chen, X. G.; Holtz, J. S. W.; Asher, S. A. Biochemistry
1998, 37, 2854.(39) Copeland, R. A.; Spiro, T. G. Biochemistry 1987, 26, 2134.(40) Lord, R. C. Appl. Spectrosc. 1977, 31, 187.(41) Overman, S. A.; Bondre, P.; Maiti, N. C.; Thomas, G. J., Jr.
Biochemistry 2005, 44, 3091.(42) Mikhonin, A. V.; Ahmed, Z.; Ianoul, A.; Asher., S. A. J. Phys.
Chem. B 2004, 108, 19020.(43) Asher, S. A.; Mikhonin, A. V.; Bykov, S. B. J. Am. Chem. Soc.
2004, 126, 8433.(44) Cai, S.; Singh, B. R. Biochemistry 2004, 43, 2541.(45) Ozaki, Y.; Murayama, K.; Wu, Y.; Czarnik-Matusewicz, B.
Spectroscopy (Amsterdam, Neth.) 2003, 17, 79.(46) Blanch, E. W.; Hecht, L.; Barron, L. D. Methods (San Diego, CA,
U.S.) 2003, 29, 196.(47) Asher, S. A.; Ianoul, A.; Mix, G.; Boyden, M. N.; Karnoup, A.;
Diem, M.; Schweitzer-Stenner, R. J. Am. Chem. Soc. 2001, 123, 11775.(48) Jung, Y. M.; Czarnik-Matusewicz, B.; Ozaki, Y. J. Phys. Chem. B
2000, 104, 7812.(49) Vedantham, G.; Sparks, H. G.; Sane, S. U.; Tzannis, S.; Przybycien,
T. M. Anal. Biochem. 2000, 285, 33.(50) Vecchio, G.; Zambianchi, F.; Zacchetti, P.; Secundo, F.; Carrea,
G. Biotechnol. Bioeng. 1999, 64, 545.(51) Baello, B. I.; Pancoska, P.; Keiderling, T. A. Anal. Biochem. 1997,
250, 212.(52) Bramanti, E.; Benedetti, E.; Sagripanti, A.; Papineschi, F.; Benedetti,
E. Biopolymers 1997, 41, 545.(53) Colaianni, S. E. M.; Aubard, J.; Hansen, S. H.; Nielsen, O. F. Vib.
Spectrosc. 1995, 9, 111.(54) Griebenow, K.; Klibanov, A. M. Proc. Natl. Acad. Sci. U.S.A. 1995,
92, 10969.(55) Jordan, T.; Spiro, T. G. J. Raman Spectrosc. 1994, 25, 537.(56) Fu, F.-N.; DeOliveira, D. B.; Trumble, W. R.; Sarkar, H. K.; Singh,
B. R. Appl. Spectrosc. 1994, 48, 1432.(57) DeGrazia, H.; Harman, J. G.; Tan, G. S.; Wartell, R. M.
Biochemistry 1990, 29, 3557.(58) Roberts, G. M.; Lee, O.; Calienni, J.; Diem, M. J. Am. Chem. Soc.
1988, 110, 1749.(59) Ianoul, A.; Boyden, M. N.; Asher, S. A. J. Am. Chem. Soc. 2001,
123, 7433.(60) Mikhonin, A. V.; Myshakina, N. S.; Bykov, S. V.; Asher, S. A. J.
Am. Chem. Soc. 2005, 127, 7712.(61) Mikhonin, A. V.; Asher, S. A. J. Phys. Chem. B 2005, 109, 3047.(62) Mix, G.; Schweitzer-Stenner, R.; Asher, S. A. J. Am. Chem. Soc.
2000, 122, 9028.(63) Fang, C.; Wang, J.; Charnley, A. K.; Barber-Armstrong, W.; Smith,
A. B.; Decatur, S. M.; Hochstrasser, R. M. Chem. Phys. Lett. 2003, 382,586.(64) Dudik, J. M.; Johnson, C. R.; Asher, S. A. J. Phys. Chem. 1985,
89, 3805.(65) Robin, M. B. Higher Excited States of Polyatomic Molecules;
Academic Press: New York, 1975; Vol. II.(66) Chen, X. G.; Asher, S. A.; Schweitzer-Stenner, R.; Mirkin, N. G.;
Krimm, S. J. Am. Chem. Soc. 1995, 117, 2884.(67) Ianoul, A.; Mikhonin, A.; Lednev, I. K.; Asher, S. A. J. Phys. Chem.
A 2002, 106, 3621.(68) Chen, X. G.; Schweitzer-Stenner, R.; Asher, S. A.; Mirkin, N. G.;
Krimm, S. J. Phys. Chem. 1995, 99, 3074.
(69) Garcia, A. E.; Onuchic, J. N. Structure (Cambridge, MA, U.S.) 2005,13, 497.(70) Snow, C. D.; Sorin, E. J.; Rhee, Y. M.; Pande, V. S. Annu. ReV.
Biophys. Biomol. Struct. 2005, 34, 43.(71) Rhee, Y. M.; Sorin, E. J.; Jayachandran, G.; Lindahl, E.; Pande,
V. S. Proc. Natl. Acad. Sci. U.S.A. 2004, 101, 6456.(72) Bykov, S. V.; Lednev, I. K.; Ianoul, A.; Mikhonin, A. V.; Asher,
S. A. Appl. Spectrosc., 2005, 59, 1541.(73) Mirkin, N. G.; Krimm, S. J. Phys. Chem. A 2002, 106, 3391.(74) Kubelka, J.; Keiderling, T. A. J. Phys. Chem. A 2001, 105, 10922.(75) Besley, N. A. J. Phys. Chem. A 2004, 108, 10794.(76) Torii, H.; Tatsumi, T.; Tasumi, M. J. Raman Spectrosc. 1998, 29,
537.(77) Schmidt, P.; Dybal, J.; Rodriguez-Cabello, J. C.; Reboto, V.
Biomacromolecules 2005, 6, 697.(78) Torii, H.; Tatsumi, T.; Kanazawa, T.; Tasumi, M. J. Phys. Chem.
B 1998, 102, 309.(79) Torii, H.; Tatsumi, T.; Tasumi, M. Mikrochim. Acta, Suppl. 1997,
14, 531.(80) Gnanakaran, S.; Hochstrasser, R. M.; Garcia, A. E. Proc. Natl. Acad.
Sci. U.S.A. 2004, 101, 9229.(81) Ham, S.; Hahn, S.; Lee, C.; Kim, T.-K.; Kwak, K.; Cho, M. J.
Phys. Chem. B 2004, 108, 9333.(82) Del Bene, J. E.; Jordan, M. J. T. Int. ReV. Phys. Chem. 1999, 18,
119.(83) Bakker, H. J.; Nienhuys, H. K. Science 2002, 297, 587.(84) Chaban, G. M.; Gerber, R. B. J. Chem. Phys. 2001, 115, 1340.(85) Henri-Rousseau, O.; Blaise, P. Chem. Phys. 1999, 250, 249.(86) Torii, H. J. Phys. Chem. A 2004, 108, 7272.(87) Cheatum, C. M.; Tokmakoff, A.; Knoester, J. J. Chem. Phys. 2004,
120, 8201.(88) Schweitzer-Stenner, R.; Eker, F.; Huang, Q.; Griebenow, K.; Mroz,
P. A.; Kozlowski, P. M. J. Phys. Chem. B 2002, 106, 4294.(89) Pimenov, K. V.; Bykov, S. V.; Mikhonin, A. V.; Asher, S. A. J.
Am. Chem. Soc. 2005, 127, 2840.(90) Lovell, S. C.; Davis, I. W.; Arendall, W. B., III.; de Bakker, P. I.
W.; Word, J. M.; Prisant, M. G.; Richardson, J. S.; Richardson, D. C.Proteins 2003, 50, 437.(91) Ho, B. K.; Thomas, A.; Brasseur, R. Protein Sci. 2003, 12, 2508.(92) Kleywegt, G. J.; Jones, T. A. Structure (London, U.K.) 1996, 4,
1395.(93) Yennawar, H. P.; Natarajan, S.; Viswamitra, M. A. Int. J. Peptide
Protein Res. 1991, 38, 569.(94) Fletterick, R. J.; Tsai, C. C.; Hughes, R. E. J. Phys. Chem. 1971,
75, 918.(95) Eggleston, D. S.; Hodgson, D. J. Int. J. Peptide Protein Res. 1983,
21, 288.(96) Gorbitz, C. H. Acta Crystallogr. 2000, C56, 500.(97) Eggleston, D. S. Acta Crystallogr. 1984, C40, 1250.(98) Jones, P. G.; Falvello, L.; Kennard, O. Acta Crystallogr. 1978, B34,
1939.(99) Chaturvedi, S.; Go, K.; Parthasarathy, R. Biopolymers 1991, 31,
397.(100) Lednev, I. K.; Ermolenkov, V. V.; He, W.; Xu, M. Anal. Bioanal.
Chem. 2005, 381, 431.(101) Dixon, D. A.; Dobbs, K. D.; Valentini, J. J. J. Phys. Chem. 1994,
98, 13435.(102) Guo, H.; Karplus, M. J. Phys. Chem. 1992, 96, 7273.(103) Jorgensen, W. L.; Swenson, C. J. J. Am. Chem. Soc. 1985, 107,
1489.(104) Huang, H.; Malkov, S.; Coleman, M.; Painter, P. J. Phys. Chem.
A 2003, 107, 7697.(105) Avbelj, F.; Luo, P.; Baldwin, R. L. Proc. Natl. Acad. Sci. U.S.A.
2000, 97, 10786.(106) Herrebout, W. A.; Clou, K.; Desseyn, H. O. J. Phys. Chem. A
2001, 105, 4865.(107) Noda, I.; Liu, Y.; Ozaki, Y. J. Phys. Chem. 1996, 100, 8665.(108) Fleming, P. J.; Fitzkee, N. C.; Mezei, M.; Srinivasan, R.; Rose,
G. D. Protein Sci. 2005, 14, 111.(109) Bochicchio, B.; Tamburro, A. M. Chirality 2002, 14, 782.(110) Shi, Z.; Woody, R. W.; Kallenbach, N. R. AdV. Protein Chem.
2002, 62, 163.(111) Mayne, L. C.; Hudson, B. J. Phys. Chem. 1991, 95, 2962.(112) Walsh, S. T. R.; Cheng, R. P.; Wright, W. W.; Alonso, D. O. V.;
Daggett, V.; Vanderkooi, J. M.; DeGrado, W. F. Protein Sci. 2003, 12,520.(113) Manas, E. S.; Getahun, Z.; Wright, W. W.; DeGrado, W. F.;
Vanderkooi, J. M. J. Am. Chem. Soc. 2000, 122, 9883.(114) McColl, I. H.; Blanch, E. W.; Hecht, L.; Barron, L. D. J. Am.
Chem. Soc. 2004, 126, 8181.(115) Sheu, S.-y.; Yang, D.-y.; Selzle, H. L.; Schlag, E. W. Proc. Natl.
Acad. Sci. U.S.A. 2003, 100, 12683.
Peptide Secondary Structure Folding Reaction Coordinate J. Phys. Chem. B, Vol. 110, No. 4, 2006 1943
Top Related