


γλώσσες
Σελίδες
Νομικός

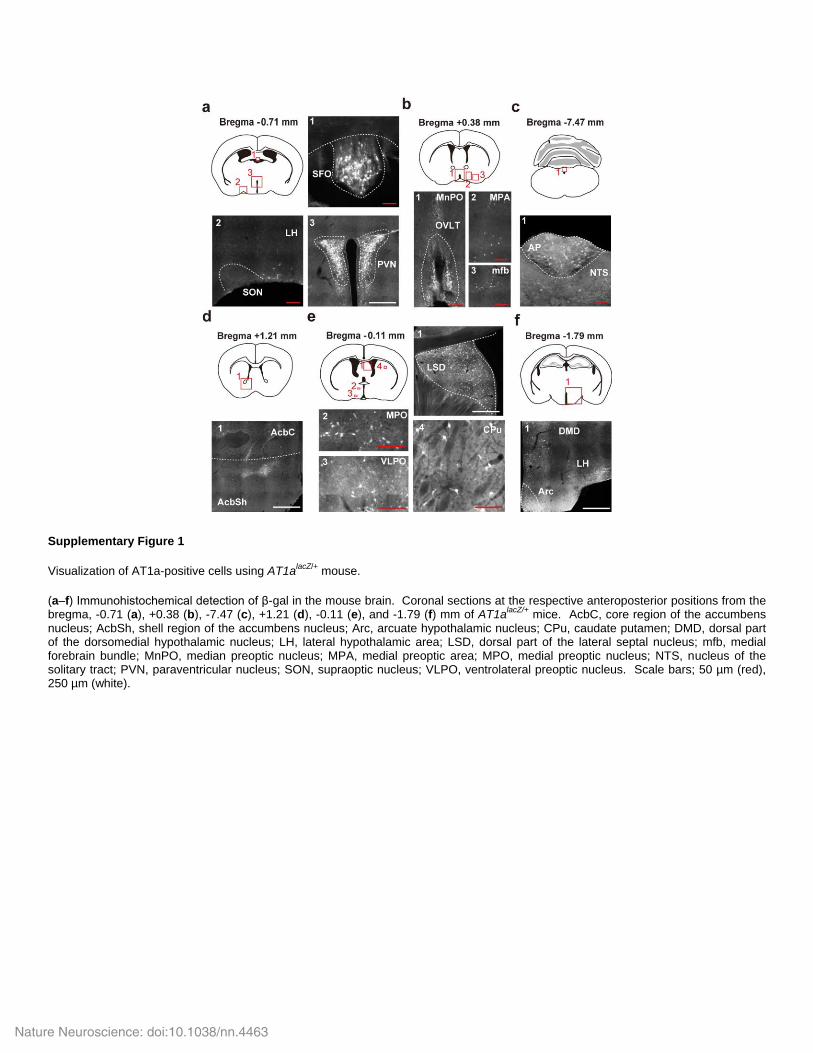
Supplementary Figure 1
Visualization of AT1a-positive cells using AT1alacZ/+
mouse.
(a–f) Immunohistochemical detection of β-gal in the mouse brain. Coronal sections at the respective anteroposterior positions from the bregma, -0.71 (a), +0.38 (b), -7.47 (c), +1.21 (d), -0.11 (e), and -1.79 (f) mm of AT1a
lacZ/+ mice. AcbC, core region of the accumbens
nucleus; AcbSh, shell region of the accumbens nucleus; Arc, arcuate hypothalamic nucleus; CPu, caudate putamen; DMD, dorsal part of the dorsomedial hypothalamic nucleus; LH, lateral hypothalamic area; LSD, dorsal part of the lateral septal nucleus; mfb, medial forebrain bundle; MnPO, median preoptic nucleus; MPA, medial preoptic area; MPO, medial preoptic nucleus; NTS, nucleus of the solitary tract; PVN, paraventricular nucleus; SON, supraoptic nucleus; VLPO, ventrolateral preoptic nucleus. Scale bars; 50 µm (red), 250 µm (white).
Nature Neuroscience: doi:10.1038/nn.4463
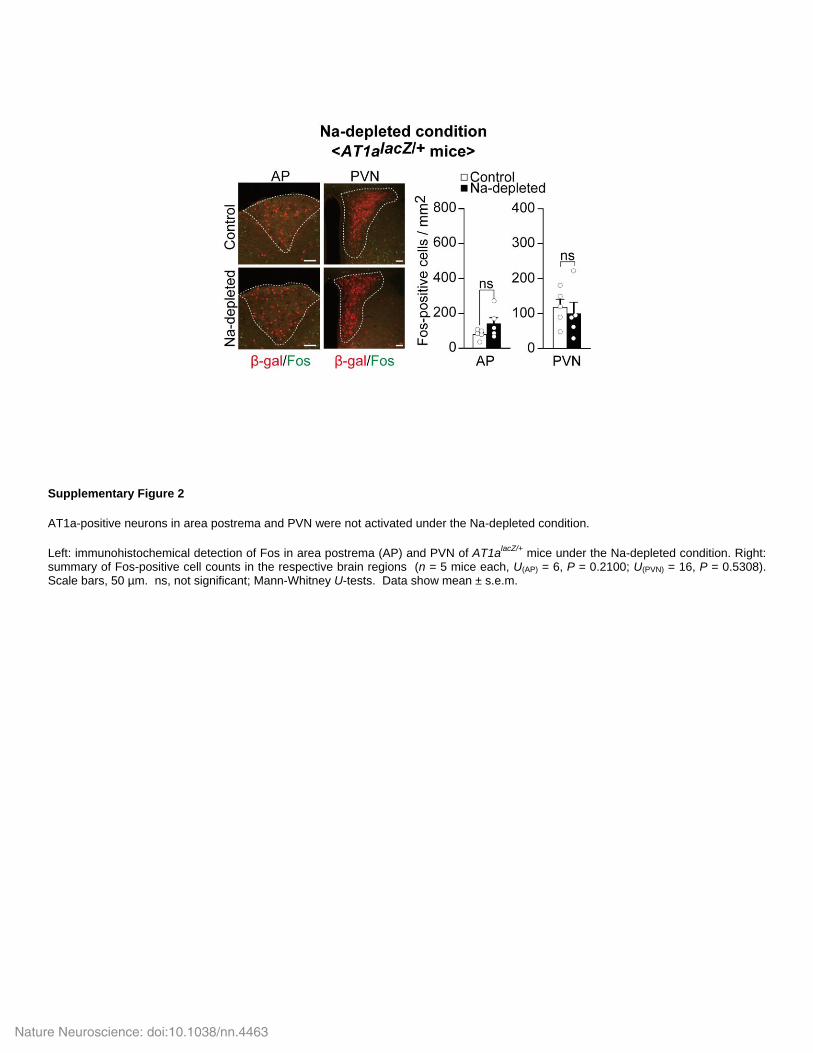
Supplementary Figure 2
AT1a-positive neurons in area postrema and PVN were not activated under the Na-depleted condition.
Left: immunohistochemical detection of Fos in area postrema (AP) and PVN of AT1alacZ/+
mice under the Na-depleted condition. Right: summary of Fos-positive cell counts in the respective brain regions (n = 5 mice each, U(AP) = 6, P = 0.2100; U(PVN) = 16, P = 0.5308). Scale bars, 50 µm. ns, not significant; Mann-Whitney U-tests. Data show mean ± s.e.m.
Nature Neuroscience: doi:10.1038/nn.4463
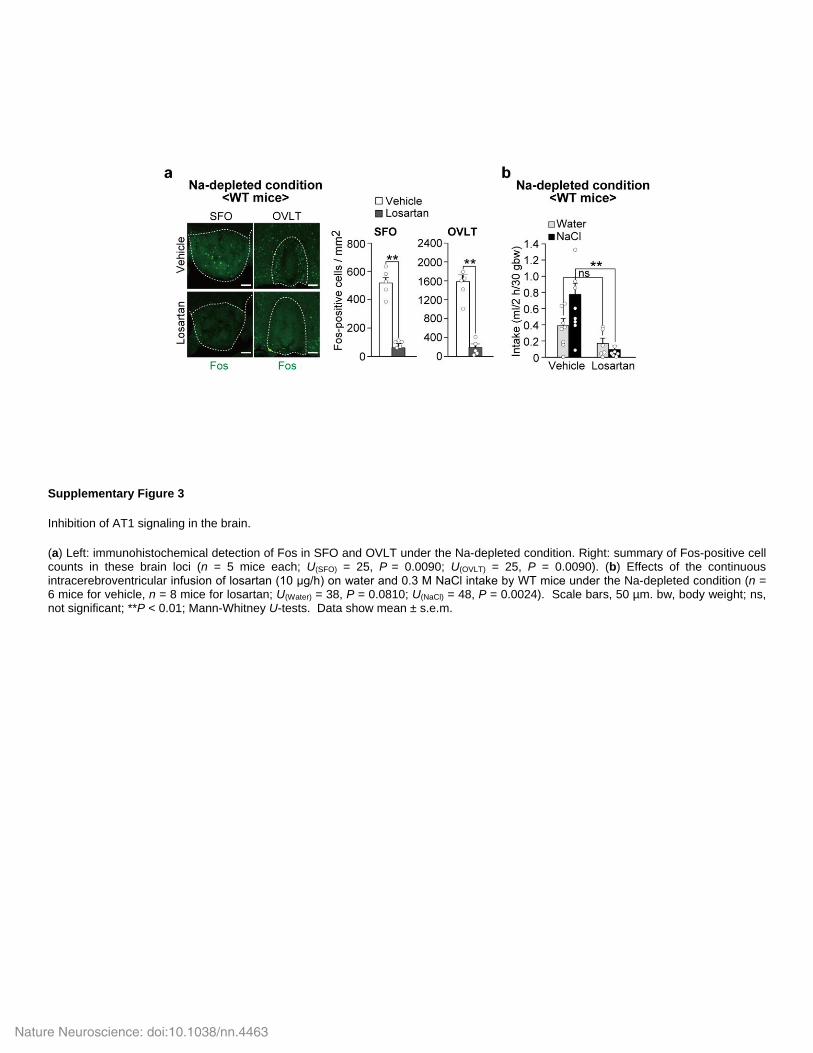
Supplementary Figure 3
Inhibition of AT1 signaling in the brain.
(a) Left: immunohistochemical detection of Fos in SFO and OVLT under the Na-depleted condition. Right: summary of Fos-positive cell counts in these brain loci (n = 5 mice each; U(SFO) = 25, P = 0.0090; U(OVLT) = 25, P = 0.0090). (b) Effects of the continuous intracerebroventricular infusion of losartan (10 μg/h) on water and 0.3 M NaCl intake by WT mice under the Na-depleted condition (n = 6 mice for vehicle, n = 8 mice for losartan; U(Water) = 38, P = 0.0810; U(NaCl) = 48, P = 0.0024). Scale bars, 50 µm. bw, body weight; ns, not significant; **P < 0.01; Mann-Whitney U-tests. Data show mean ± s.e.m.
Nature Neuroscience: doi:10.1038/nn.4463
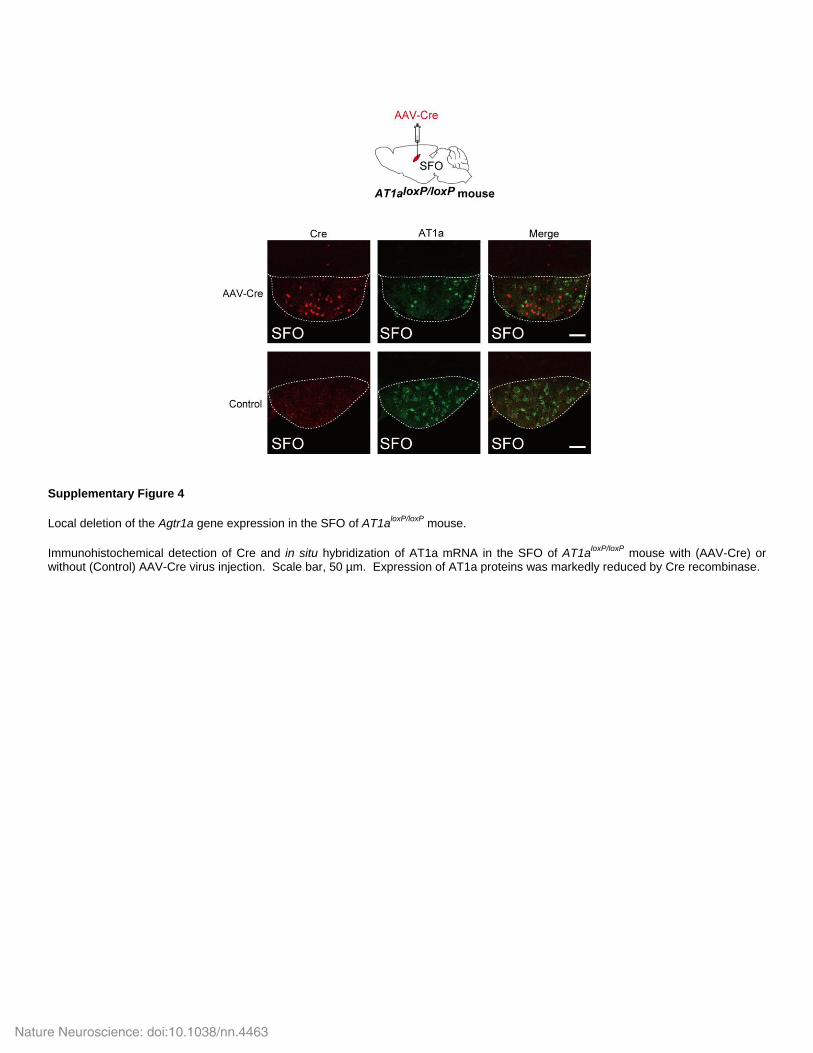
Supplementary Figure 4
Local deletion of the Agtr1a gene expression in the SFO of AT1aloxP/loxP
mouse.
Immunohistochemical detection of Cre and in situ hybridization of AT1a mRNA in the SFO of AT1aloxP/loxP
mouse with (AAV-Cre) or without (Control) AAV-Cre virus injection. Scale bar, 50 µm. Expression of AT1a proteins was markedly reduced by Cre recombinase.
Nature Neuroscience: doi:10.1038/nn.4463
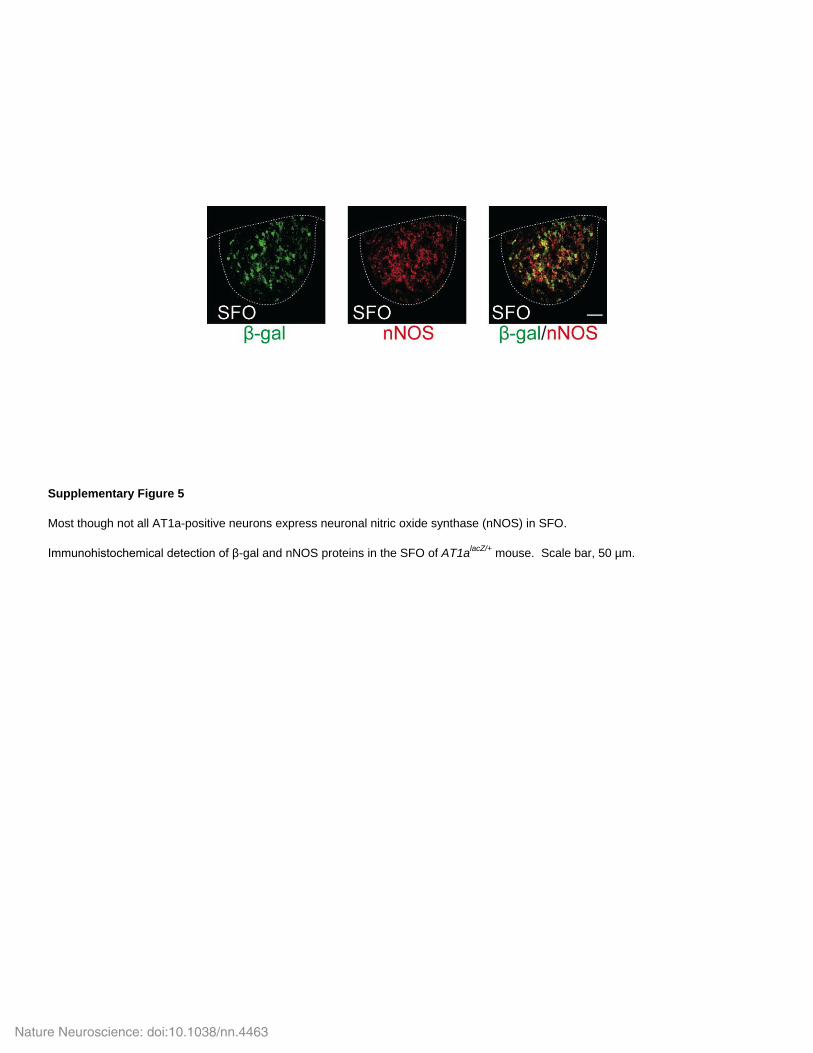
Supplementary Figure 5
Most though not all AT1a-positive neurons express neuronal nitric oxide synthase (nNOS) in SFO.
Immunohistochemical detection of β-gal and nNOS proteins in the SFO of AT1alacZ/+
mouse. Scale bar, 50 µm.
Nature Neuroscience: doi:10.1038/nn.4463
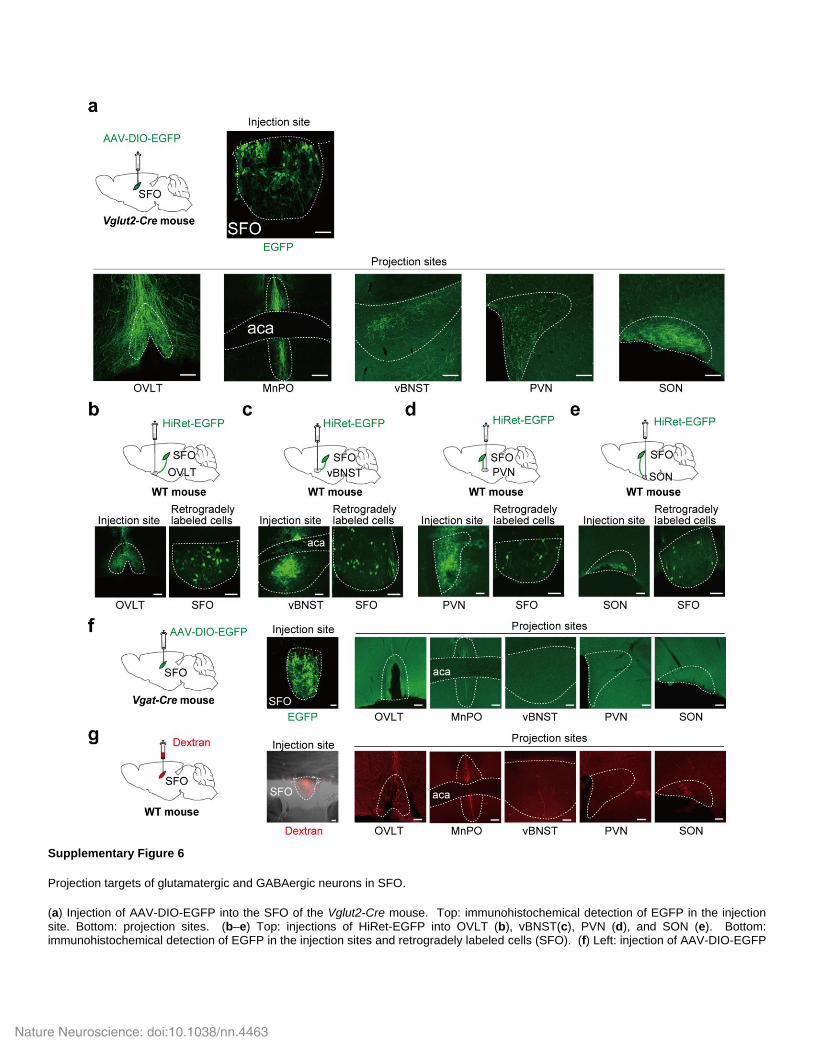
Supplementary Figure 6
Projection targets of glutamatergic and GABAergic neurons in SFO.
(a) Injection of AAV-DIO-EGFP into the SFO of the Vglut2-Cre mouse. Top: immunohistochemical detection of EGFP in the injection site. Bottom: projection sites. (b–e) Top: injections of HiRet-EGFP into OVLT (b), vBNST(c), PVN (d), and SON (e). Bottom: immunohistochemical detection of EGFP in the injection sites and retrogradely labeled cells (SFO). (f) Left: injection of AAV-DIO-EGFP
Nature Neuroscience: doi:10.1038/nn.4463
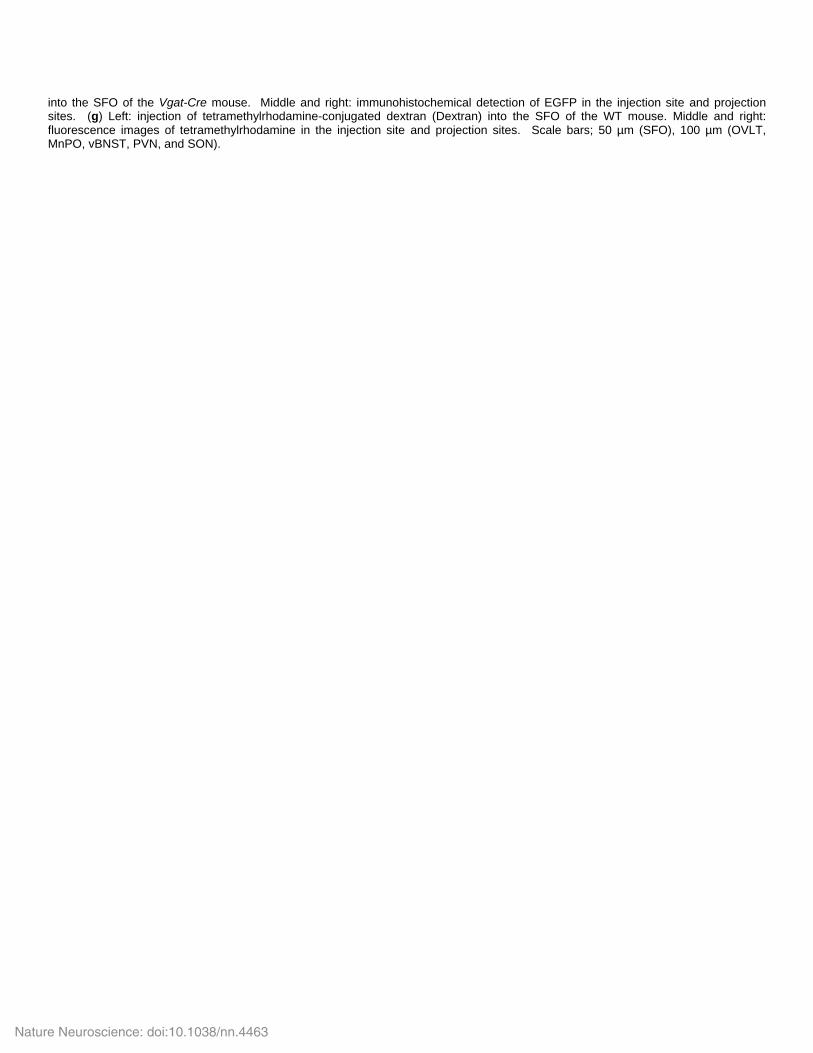
into the SFO of the Vgat-Cre mouse. Middle and right: immunohistochemical detection of EGFP in the injection site and projection sites. (g) Left: injection of tetramethylrhodamine-conjugated dextran (Dextran) into the SFO of the WT mouse. Middle and right: fluorescence images of tetramethylrhodamine in the injection site and projection sites. Scale bars; 50 µm (SFO), 100 µm (OVLT, MnPO, vBNST, PVN, and SON).
Nature Neuroscience: doi:10.1038/nn.4463
Supplementary Figure 7
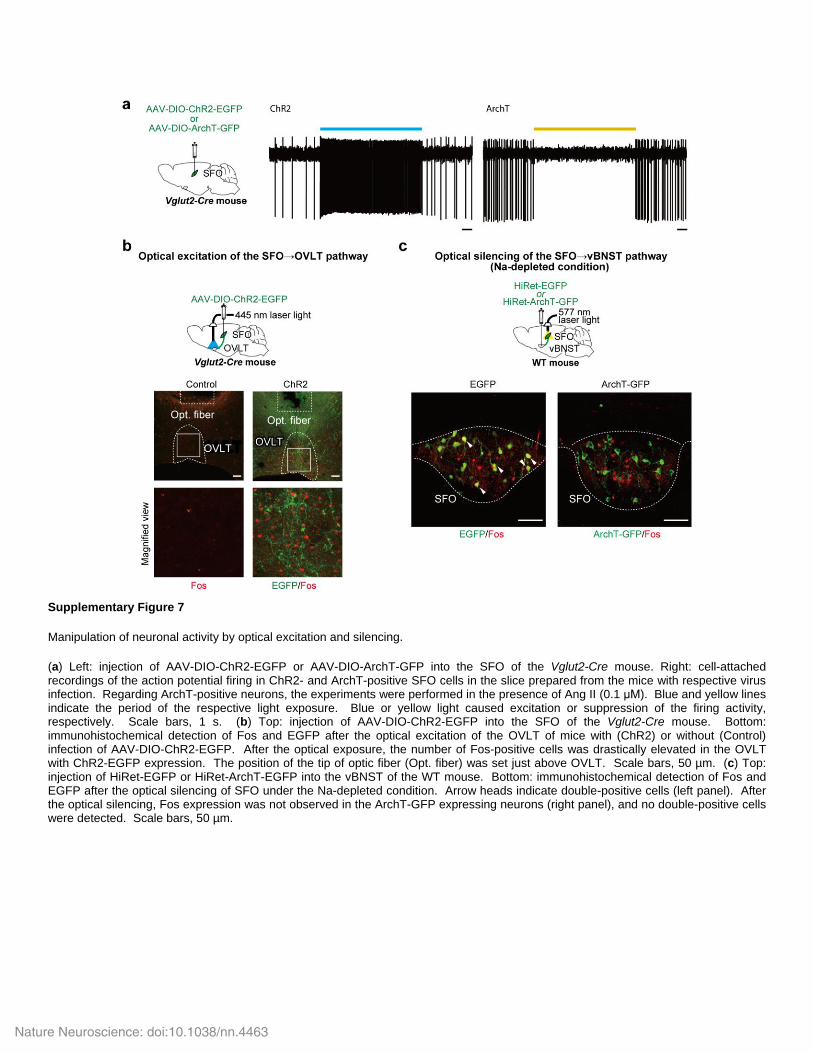
Manipulation of neuronal activity by optical excitation and silencing.
(a) Left: injection of AAV-DIO-ChR2-EGFP or AAV-DIO-ArchT-GFP into the SFO of the Vglut2-Cre mouse. Right: cell-attached recordings of the action potential firing in ChR2- and ArchT-positive SFO cells in the slice prepared from the mice with respective virus infection. Regarding ArchT-positive neurons, the experiments were performed in the presence of Ang II (0.1 μM). Blue and yellow lines indicate the period of the respective light exposure. Blue or yellow light caused excitation or suppression of the firing activity, respectively. Scale bars, 1 s. (b) Top: injection of AAV-DIO-ChR2-EGFP into the SFO of the Vglut2-Cre mouse. Bottom: immunohistochemical detection of Fos and EGFP after the optical excitation of the OVLT of mice with (ChR2) or without (Control) infection of AAV-DIO-ChR2-EGFP. After the optical exposure, the number of Fos-positive cells was drastically elevated in the OVLT with ChR2-EGFP expression. The position of the tip of optic fiber (Opt. fiber) was set just above OVLT. Scale bars, 50 µm. (c) Top: injection of HiRet-EGFP or HiRet-ArchT-EGFP into the vBNST of the WT mouse. Bottom: immunohistochemical detection of Fos and EGFP after the optical silencing of SFO under the Na-depleted condition. Arrow heads indicate double-positive cells (left panel). After the optical silencing, Fos expression was not observed in the ArchT-GFP expressing neurons (right panel), and no double-positive cells were detected. Scale bars, 50 µm.
Nature Neuroscience: doi:10.1038/nn.4463
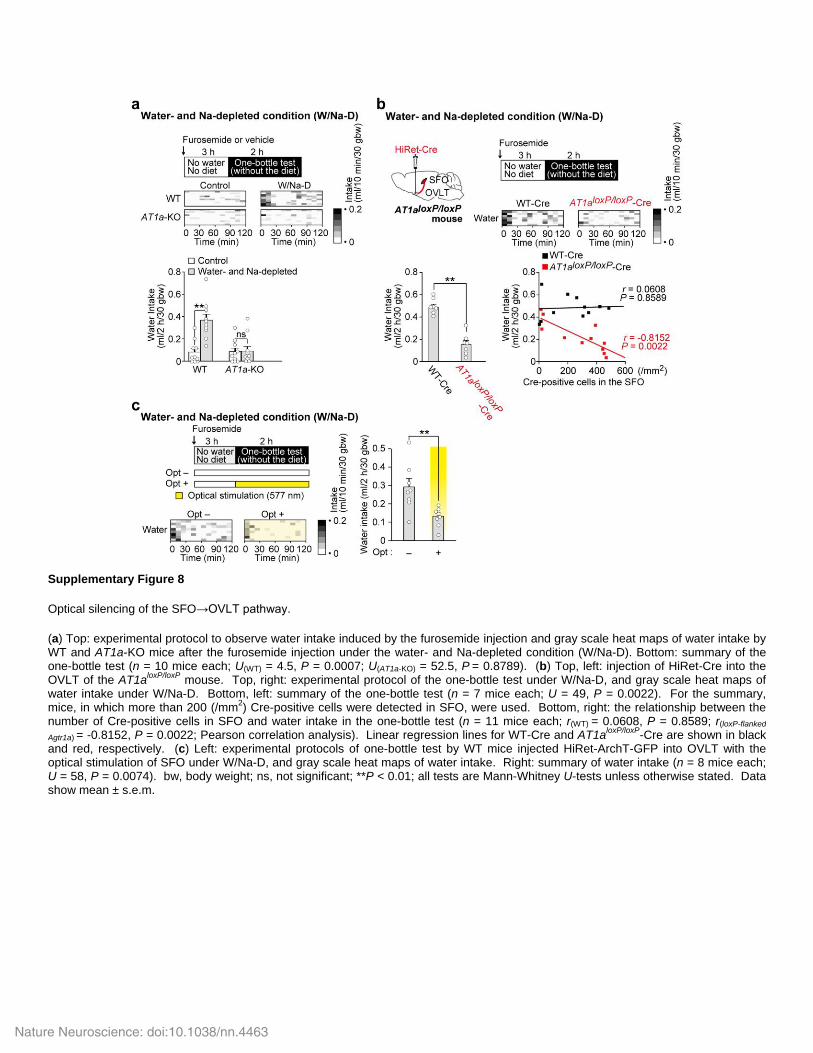
Supplementary Figure 8
Optical silencing of the SFO→OVLT pathway.
(a) Top: experimental protocol to observe water intake induced by the furosemide injection and gray scale heat maps of water intake by WT and AT1a-KO mice after the furosemide injection under the water- and Na-depleted condition (W/Na-D). Bottom: summary of the one-bottle test (n = 10 mice each; U(WT) = 4.5, P = 0.0007; U(AT1a-KO) = 52.5, P = 0.8789). (b) Top, left: injection of HiRet-Cre into the OVLT of the AT1a
loxP/loxP mouse. Top, right: experimental protocol of the one-bottle test under W/Na-D, and gray scale heat maps of
water intake under W/Na-D. Bottom, left: summary of the one-bottle test (n = 7 mice each; U = 49, P = 0.0022). For the summary, mice, in which more than 200 (/mm
2) Cre-positive cells were detected in SFO, were used. Bottom, right: the relationship between the
number of Cre-positive cells in SFO and water intake in the one-bottle test (n = 11 mice each; r(WT) = 0.0608, P = 0.8589; r(loxP-flanked
Agtr1a) = -0.8152, P = 0.0022; Pearson correlation analysis). Linear regression lines for WT-Cre and AT1aloxP/loxP
-Cre are shown in black and red, respectively. (c) Left: experimental protocols of one-bottle test by WT mice injected HiRet-ArchT-GFP into OVLT with the optical stimulation of SFO under W/Na-D, and gray scale heat maps of water intake. Right: summary of water intake (n = 8 mice each; U = 58, P = 0.0074). bw, body weight; ns, not significant; **P < 0.01; all tests are Mann-Whitney U-tests unless otherwise stated. Data show mean ± s.e.m.
Nature Neuroscience: doi:10.1038/nn.4463
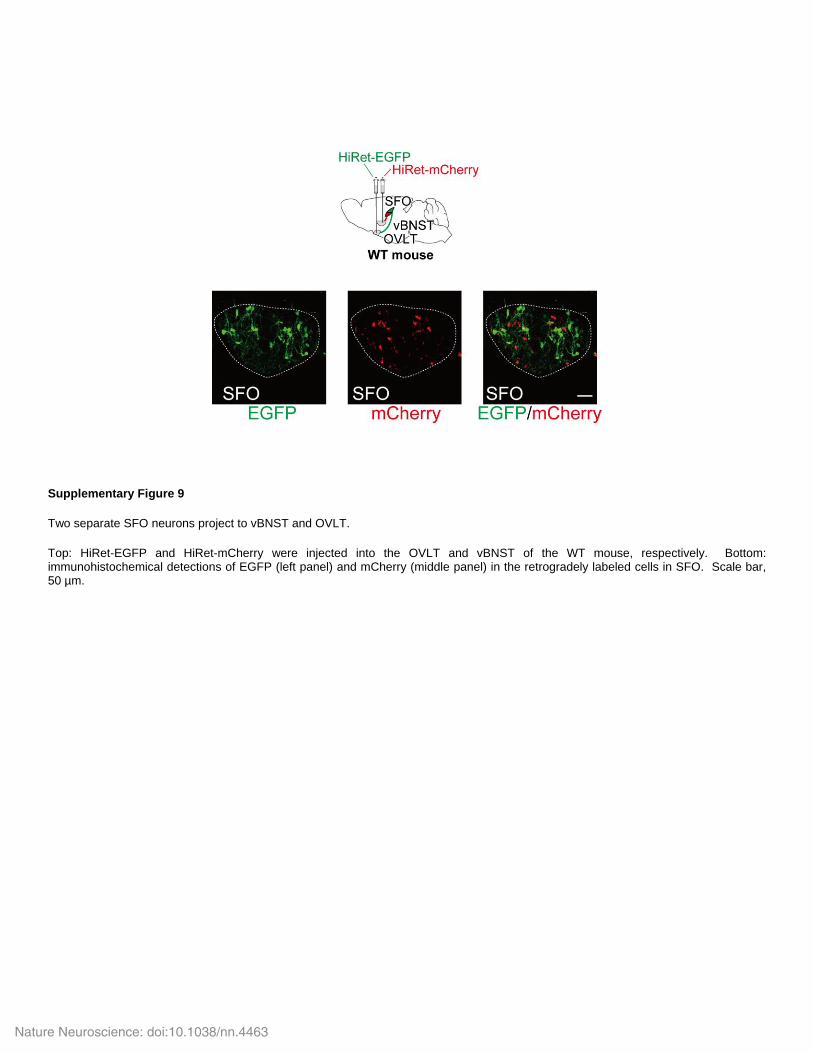
Supplementary Figure 9
Two separate SFO neurons project to vBNST and OVLT.
Top: HiRet-EGFP and HiRet-mCherry were injected into the OVLT and vBNST of the WT mouse, respectively. Bottom: immunohistochemical detections of EGFP (left panel) and mCherry (middle panel) in the retrogradely labeled cells in SFO. Scale bar, 50 µm.
Nature Neuroscience: doi:10.1038/nn.4463
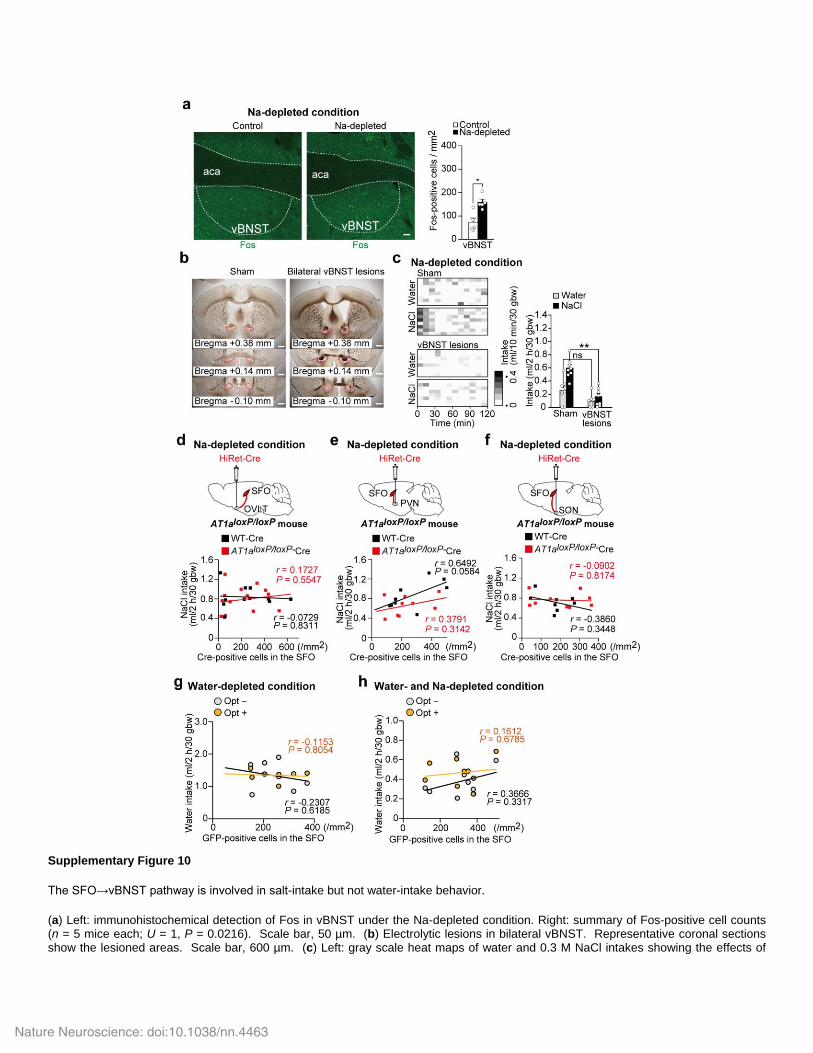
Supplementary Figure 10
The SFO→vBNST pathway is involved in salt-intake but not water-intake behavior.
(a) Left: immunohistochemical detection of Fos in vBNST under the Na-depleted condition. Right: summary of Fos-positive cell counts (n = 5 mice each; U = 1, P = 0.0216). Scale bar, 50 µm. (b) Electrolytic lesions in bilateral vBNST. Representative coronal sections show the lesioned areas. Scale bar, 600 µm. (c) Left: gray scale heat maps of water and 0.3 M NaCl intakes showing the effects of
Nature Neuroscience: doi:10.1038/nn.4463
lesions on their intakes under the Na-depleted condition. Right: summary of intake volumes (n = 8 mice each; U(Water) = 50, P = 0.0658; U(NaCl) = 63, P = 0.0013). (d–f) Top: injection of HiRet-Cre into OVLT (d), PVN (e), and SON (f) of the AT1a
loxP/loxP mouse. Bottom: the
relationship between the number of Cre-positive cells in SFO and 0.3 M NaCl intake in the two-bottle test under the Na-depleted condition (n = 11 mice for WT and n = 14 mice for AT1a
loxP/loxP in d; r(WT) = -0.0729, P = 0.8311; r(loxP-flanked Agtr1a) = 0.1727, P = 0.5547: n
= 9 mice each in e; r(WT) = 0.6492, P = 0.0584; r(loxP-flanked Agtr1a) = 0.3791, P = 0.3142: n = 8 mice for WT and n = 9 mice for AT1aloxP/loxP
in f; r(WT) = -0.3860, P = 0.3448; r(loxP-flanked Agtr1a) = -0.0902, P = 0.8174; Pearson correlation analysis). Linear regression lines are shown in black (WT-Cre) and red (AT1a
loxP/loxP-Cre). (g, h) Optical silencing of the SFO→vBNST pathway on water intake under the water-
depleted (g) or water- and Na-depleted (h) condition. The relationship between the number of ArchT-GFP-positive cells in SFO and water intake with or without the optical stimulation (n = 7 mice for g; r(Opt–) = -0.2307, P = 0.6185; r(Opt+) = -0.1153, P = 0.8054: n = 9 mice for h; r(Opt–) = 0.3666, P = 0.3317; r(Opt+) = 0.1612, P = 0.6785; Pearson correlation analysis). bw, body weight; ns, not significant; *P < 0.05; **P < 0.01; all tests are Mann-Whitney U-tests unless otherwise stated. Data show mean ± s.e.m.
Nature Neuroscience: doi:10.1038/nn.4463
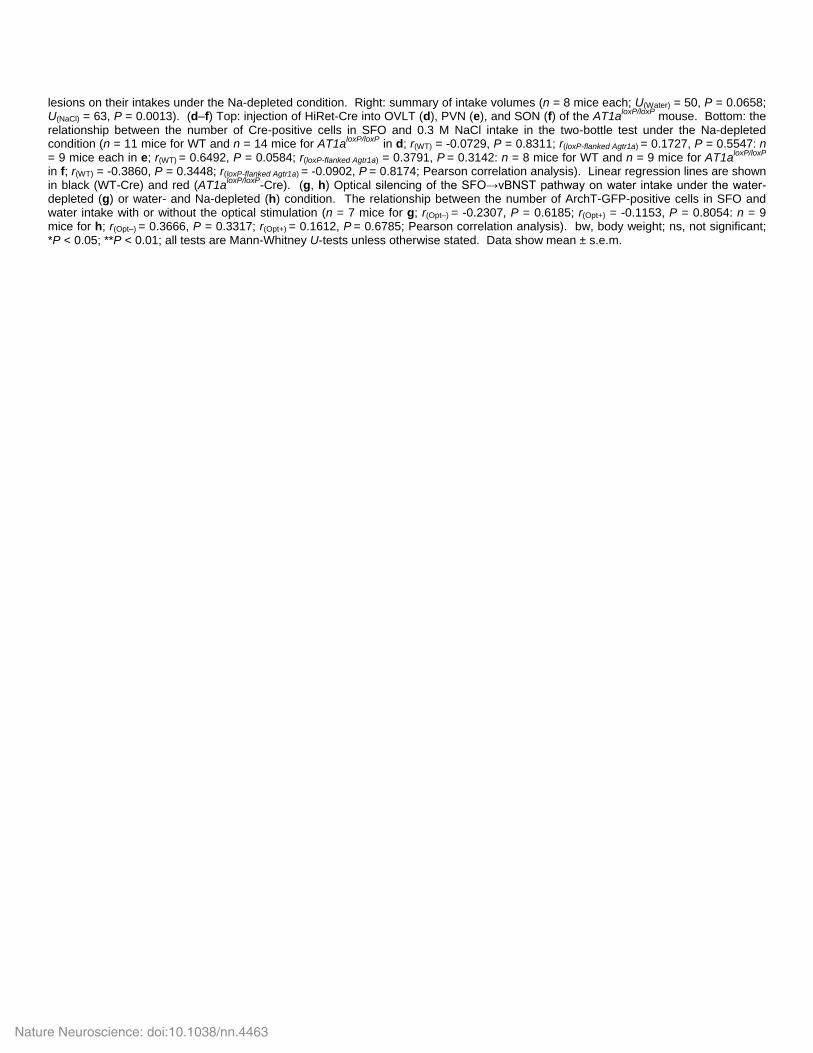
Supplementary Figure 11
Modulation of salt-intake behavior by GABAergic neurons in SFO.
Gray scale heat maps of water and 0.3 M NaCl intakes by individual mice under the Na-depleted condition with (Opt+) or without (Opt–) the optical excitation of GABAergic neurons in SFO. Summary of the data is shown in Fig. 7g. n = 7 mice each. bw, body weight.
Nature Neuroscience: doi:10.1038/nn.4463
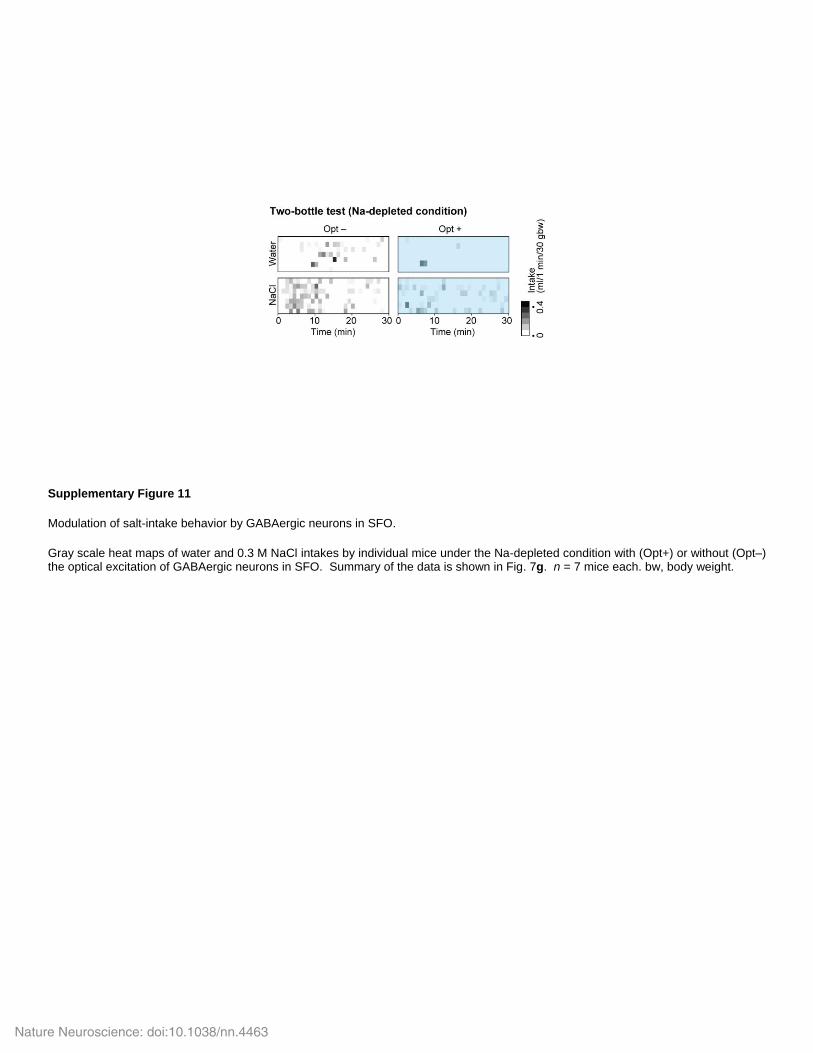
Supplementary Figure 12
Neural activities of SFO(→vBNST) neurons and GABAergic neurons in the presence of CCK.
(a) Schematic drawing of the retrograde labeling of the SFO(→vBNST) neurons in GAD67-EGFP mice by using CTb-555. (b) Schematic drawing of electrical stimulation of a GABAergic neuron (green) and electrophysiological recording from a CTb-labelled neuron synaptically connected in SFO (red). (c) Representative spike frequency histogram and summary showing the effects of CCK (10 nM) and Ang II (0.1 μM) on the firing activities of the GABAergic neuron and the SFO(→vBNST) neuron in the SFO of WT mice (n = 8 slices each; U(GABAergic neuron) = 30, P = 0.8746; U(Projection neuron) = 28.5, P = 0.7525). Blue values are the mean ± s.e.m. of mice, respectively. ns, not significant; Mann-Whitney U-tests.
Nature Neuroscience: doi:10.1038/nn.4463
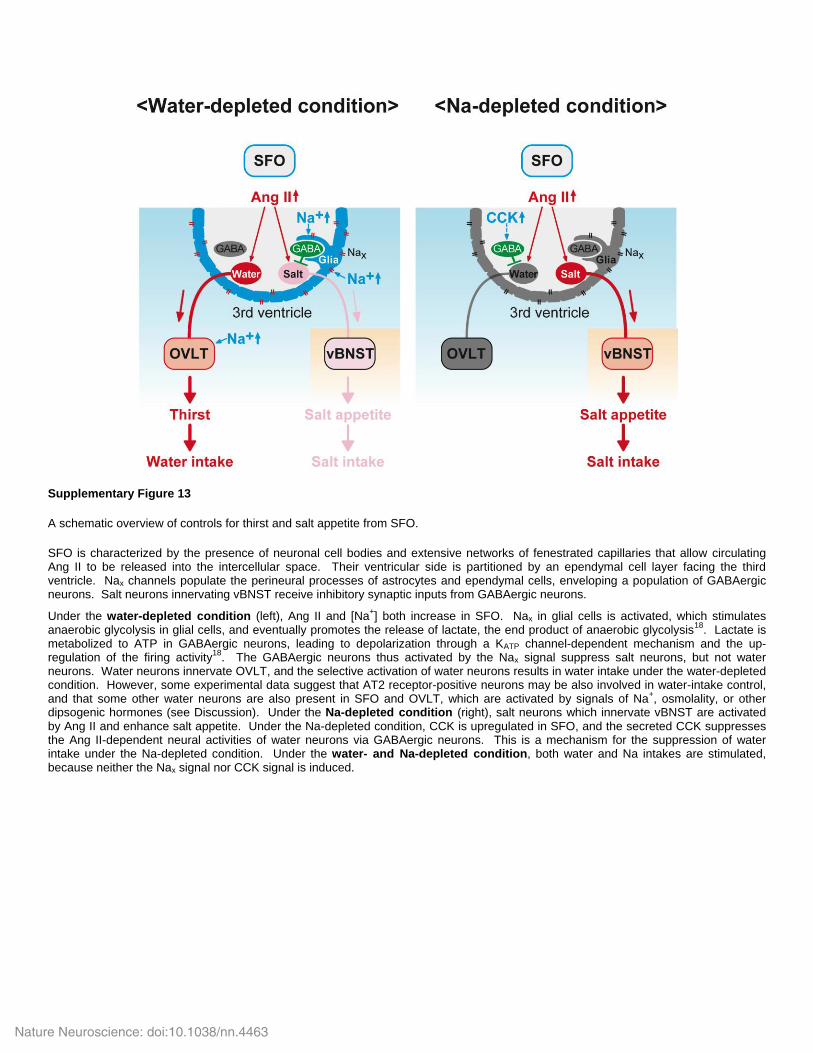
Supplementary Figure 13
A schematic overview of controls for thirst and salt appetite from SFO.
SFO is characterized by the presence of neuronal cell bodies and extensive networks of fenestrated capillaries that allow circulating Ang II to be released into the intercellular space. Their ventricular side is partitioned by an ependymal cell layer facing the third ventricle. Nax channels populate the perineural processes of astrocytes and ependymal cells, enveloping a population of GABAergic neurons. Salt neurons innervating vBNST receive inhibitory synaptic inputs from GABAergic neurons.
Under the water-depleted condition (left), Ang II and [Na+] both increase in SFO. Nax in glial cells is activated, which stimulates
anaerobic glycolysis in glial cells, and eventually promotes the release of lactate, the end product of anaerobic glycolysis18
. Lactate is metabolized to ATP in GABAergic neurons, leading to depolarization through a KATP channel-dependent mechanism and the up-regulation of the firing activity
18. The GABAergic neurons thus activated by the Nax signal suppress salt neurons, but not water
neurons. Water neurons innervate OVLT, and the selective activation of water neurons results in water intake under the water-depleted condition. However, some experimental data suggest that AT2 receptor-positive neurons may be also involved in water-intake control, and that some other water neurons are also present in SFO and OVLT, which are activated by signals of Na
+, osmolality, or other
dipsogenic hormones (see Discussion). Under the Na-depleted condition (right), salt neurons which innervate vBNST are activated by Ang II and enhance salt appetite. Under the Na-depleted condition, CCK is upregulated in SFO, and the secreted CCK suppresses the Ang II-dependent neural activities of water neurons via GABAergic neurons. This is a mechanism for the suppression of water intake under the Na-depleted condition. Under the water- and Na-depleted condition, both water and Na intakes are stimulated, because neither the Nax signal nor CCK signal is induced.
Nature Neuroscience: doi:10.1038/nn.4463
Supplementary Results and Discussion Supplementary results
We established three different experimental conditions in mice. Firstly, in order to produce the water- and Na-
depleted condition, wild-type (WT) mice were subcutaneously injected with furosemide, a loop diuretic, and
then, they were depleted of water and Na in 3 h (Fig. 1a). This treatment decreased blood [Na+] by ~5 mM, and
increased Ang II levels ~3 fold after 3 h (Fig. 1a). Secondly, to produce the Na-depleted condition without
thirst, mice were allowed free access to water and a Na-deficient diet for 24 h after the furosemide injection
(Fig. 1b); during this period, intensive water intake for first 6 h, along with subsequent reduction afterward,
were observed. After 24 h, blood [Na+] decreased below normal levels, whereas Ang II levels remained high
(Fig. 1b). Thirdly, to produce the water-depleted condition, WT mice were dehydrated for 2 days; blood [Na+]
increased by ~15 mM and plasma Ang II levels increased ~4 fold (Fig. 1c).
We then examined thirst and salt appetite responses of the mice under these conditions; mice were subjected
to a two-bottle test providing water and 0.3 M NaCl in absence of food (Fig. 1d–f). Firstly, the water- and Na-
depleted mice consumed abundant volumes of water together with 0.3 M NaCl in 2 h (Fig. 1d). Under the same
condition, water intake by AT1a-KO mice was significantly less than, but still approximately half of, that by
WT mice, indicating that water intake is at least in part AT1a-dependent. In contrast, salt intake by AT1a-KO
mice was almost negligible, indicating the critical role of AT1a signaling by Ang II in the generation of salt-
intake behavior under the water- and Na-depleted condition. Secondly, under the Na-depleted condition, the
induction of salt intake, but not water intake, was selectively observed in WT, whereas neither was induced in
AT1a-KO mice (Fig. 1e). This indicates again that salt intake is AT1a-dependent. Thirdly, under the water-
depleted condition, WT mice consumed abundant volumes of water together with less amount of 0.3 M NaCl
(Fig. 1f): Salt intake was evidently less than water intake, reflecting “salt avoidance”, due to high [Na+] in body
fluids by dehydration. Under the same conditions, AT1a-KO mice consumed abundant volumes of water to the
same level as WT mice, whereas the intake of 0.3 M NaCl was negligible, as was observed under the water- and
Na-depleted, and Na-depleted conditions.
Supplementary discussion
The OVLT reportedly has direct or indirect neural connections to the insular cortex and anterior cingulate
cortex in rats, which were shown to be activated during the systemic infusion of hypertonic saline1.
Nature Neuroscience: doi:10.1038/nn.4463
Consistently, activation of these loci under thirst conditions was demonstrated in human subjects by PET and
functional MRI2. Functional roles of these areas are plausible targets for future studies.
In rats, the vBNST is functionally divided into subnuclei, and the ventrolateral BNST has been reported to
have neural connections with some brain regions related to salt appetite3. It would be a future task to
investigate whether such subregions also exist in the vBNST of mice. The vBNST is a part of the extended
amygdala, which has been implicated in emotional behaviors4. The vBNST harbors two types of projection
neurons to the ventral tegmental area (VTA): Glutamatergic neurons promote aversion and anxiety, whereas
GABAergic neurons promote rewarding and anxiolytic phenotypes5. The depletion of Na is known to induce
anhedonia, a symptom of anxiety disorders, defined as a reduction or loss of pleasure6. Neural inputs from salt
neurons may activate rewarding signals or inhibit aversion signals via the vBNST→VTA circuit to promote the
motivation for salt intake. These interactions between salt appetite and anxiety may be derived from signal
cross-talk in the vBNST.
Supplementary References
1. Hollis, J. H. et al. The trajectory of sensory pathways from the lamina terminalis to the insular and
cingulate cortex: a neuroanatomical framework for the generation of thirst. Am. J. Physiol. Regul. Integr.
Comp. Physiol. 294, R1390–R1401 (2008).
2. Egan, G. et al. Neural correlates of the emergence of consciousness of thirst. Proc. Natl. Acad. Sci. U S A.
100, 15241–15246 (2003).
3. Shin, J. W., Geerling, J. C. & Loewy, A. D. Inputs to the ventrolateral bed nucleus of the stria terminalis. J.
Comp. Neurol. 511, 628–657 (2008).
4. Stamatakis, A. M. Amygdala and bed nucleus of the stria terminalis circuitry: Implications for addiction-
related behaviors. Neuropharmacology 76, Pt. B, 320–328 (2014).
5. Jennings, J. H. et al. Distinct extended amygdala circuits for divergent motivational states. Nature 496,
224–228 (2013).
6. Hurley, S. W. & Johnson, A. K. The biopsychology of salt hunger and sodium deficiency. Pflügers Arch. –
Eur. J. Physiol. 467, 445–456 (2015).
Nature Neuroscience: doi:10.1038/nn.4463
Top Related