


γλώσσες
Σελίδες
Νομικός

Morphology and Dynamics of Galaxies with Cellular Automata Dr. Brian R. Kent (Na#onal Radio Astronomy Observatory)
Abstract Galaxies are among the largest observed physical systems, surpassed only by clusters, groups, and the large-
scale structure of the Universe. The currently accepted Λ-Cold Dark Matter model of galaxy formation gives a hierarchical formation scenario and mass distribution of dark matter halos. Once lower mass objects (~107 M) have coalesced into larger disk galaxies but before the formation of larger cD galaxies at the centers of virialized clusters (Kent, B.R. 2010, Astrophysical Journal, 725, 2333), one theory proposes that star formation shapes and drives the morphological structure of galaxies.
An equal-area cell rotating polar grid using 2D cellular automata can be used as an effective galaxy construction and evolution tool (Gerola & Seiden, 1978, ApJ). This phenomenological model maintains spiral structure matching the morphology of spiral galaxies using input such as star formation site size and rate and galaxy rotation. Grids with cell numbers of order ~7,000 can be run rather rapidly, allowing for fast exploration of the parameter space.
We propose to explore a number of analytical galaxy rotation curves to create a template library of cellular automata galaxies. A quantitative measure of galaxy morphology needs to be ascertained to compare observations (perhaps at multiple wavelengths) to the CA galaxies. Polar basis functions consisting of Chebyshev rational functions TLn(r) and Fourier series (Jimenez-Teja & Benitez 2011) can be applied to the. The basis coefficients for observations and models can be used as a figure of merit or metric for comparison, matching CA simulation galaxies to sets of cataloged images via the parameterized effective radius.
The National Radio Astronomy Observatory is a facility of the National Science Foundation operated under cooperative agreement by Associated Universities, Inc.
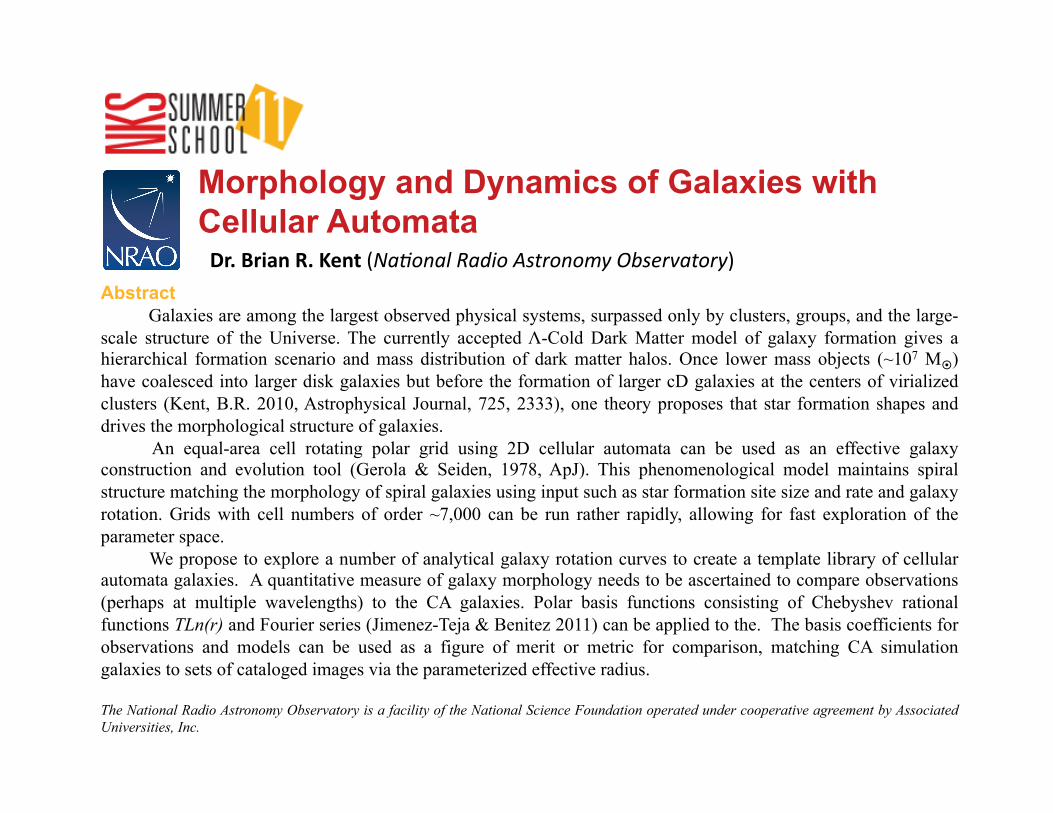
Rules of the Game: Constructing a Galaxy A rota/ng probabilis/c polar grid automata o Cells can have (stellar formation lifetime/dt = 15) states of active star formation. Empty sites are
white - no stars or star formation activity are there. As sites go through their lifecycle, their state is represented by opacity.
o For a given active star formation site (not white), all adjacent sites are examined, and the dice are rolled. An grid cell next to an active site (1 through 15) has a 16 to 22% chance of initiating star formation.
o If star formation is initiated, the (r,θ) index of that cell is added to the stack for the next iteration. o All active star formation site values are decreased by one, reflected in their decreased opacity. o Cells are rotated according to an analytically derived rotation rule.
Kitt Peak National Observatory Spiral galaxy NGC 6946, 12 million light years from the Milky Way, imaged with Kitt Peak telescopes
Inner eight rings of the polar 2D cellular automata grid
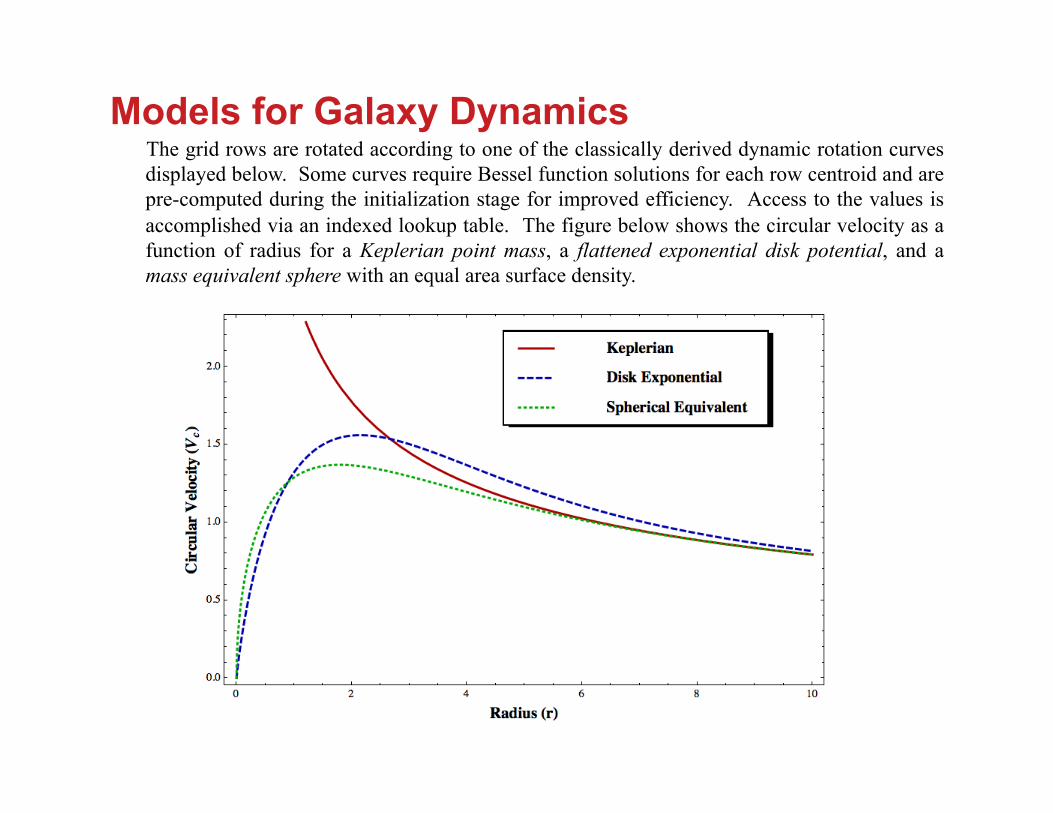
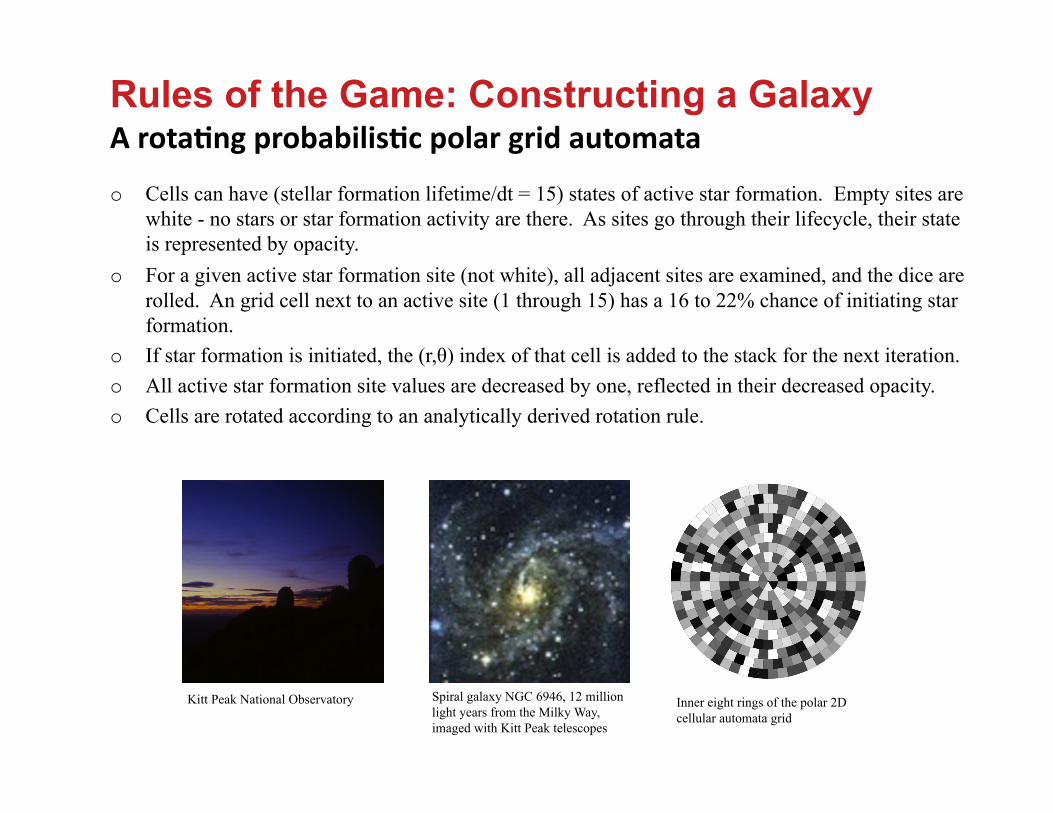
Models for Galaxy Dynamics The grid rows are rotated according to one of the classically derived dynamic rotation curves displayed below. Some curves require Bessel function solutions for each row centroid and are pre-computed during the initialization stage for improved efficiency. Access to the values is accomplished via an indexed lookup table. The figure below shows the circular velocity as a function of radius for a Keplerian point mass, a flattened exponential disk potential, and a mass equivalent sphere with an equal area surface density.
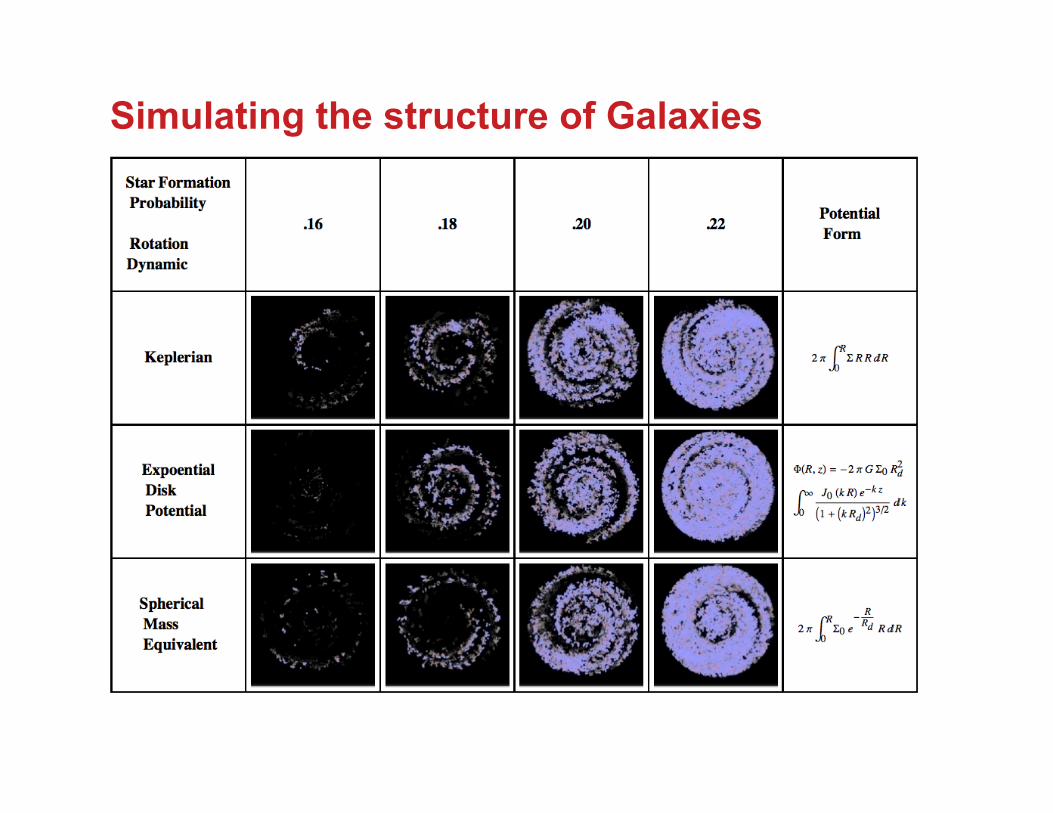
Simulating the structure of Galaxies
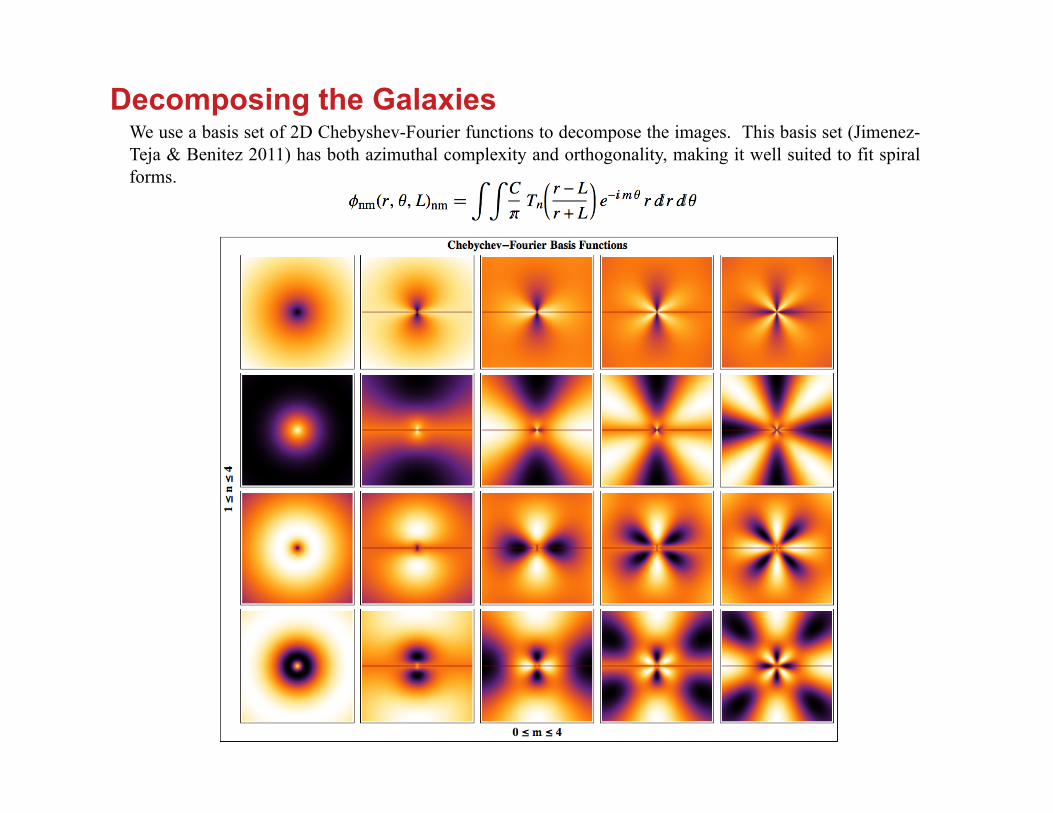
Decomposing the Galaxies We use a basis set of 2D Chebyshev-Fourier functions to decompose the images. This basis set (Jimenez-Teja & Benitez 2011) has both azimuthal complexity and orthogonality, making it well suited to fit spiral forms.
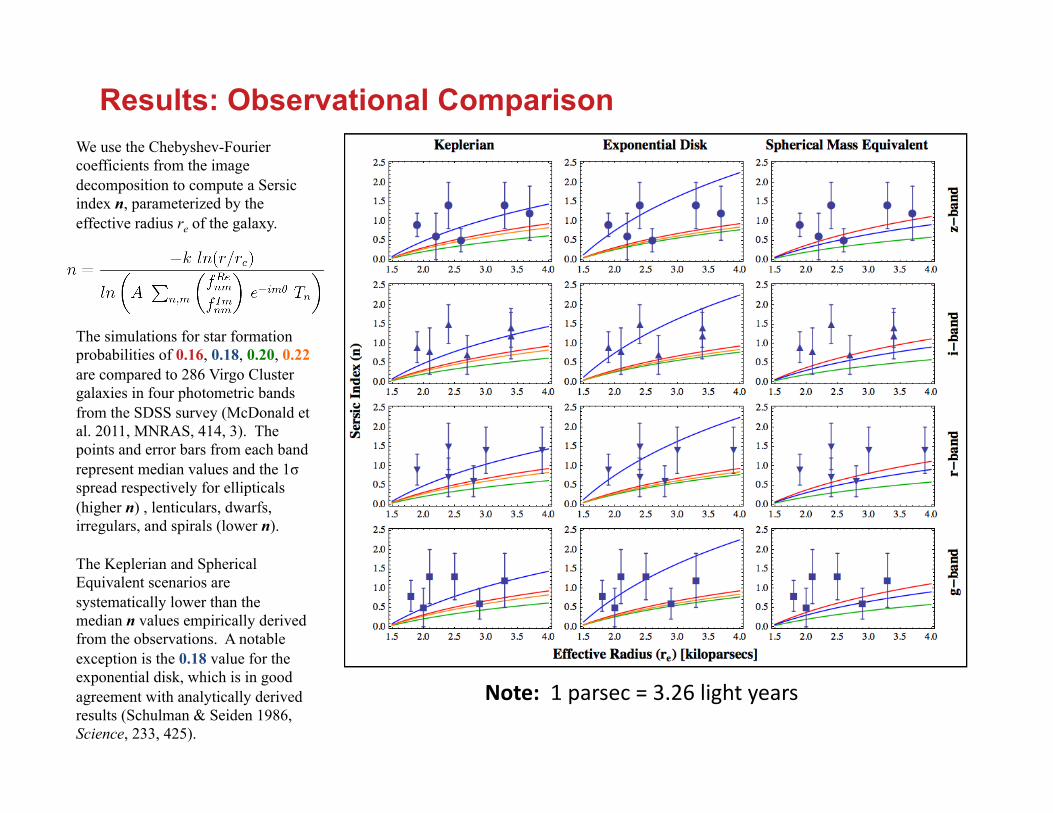
Results: Observational Comparison We use the Chebyshev-Fourier coefficients from the image decomposition to compute a Sersic index n, parameterized by the effective radius re of the galaxy.
The simulations for star formation probabilities of 0.16, 0.18, 0.20, 0.22 are compared to 286 Virgo Cluster galaxies in four photometric bands from the SDSS survey (McDonald et al. 2011, MNRAS, 414, 3). The points and error bars from each band represent median values and the 1σ spread respectively for ellipticals (higher n) , lenticulars, dwarfs, irregulars, and spirals (lower n).
The Keplerian and Spherical Equivalent scenarios are systematically lower than the median n values empirically derived from the observations. A notable exception is the 0.18 value for the exponential disk, which is in good agreement with analytically derived results (Schulman & Seiden 1986, Science, 233, 425).
Note: 1 parsec = 3.26 light years
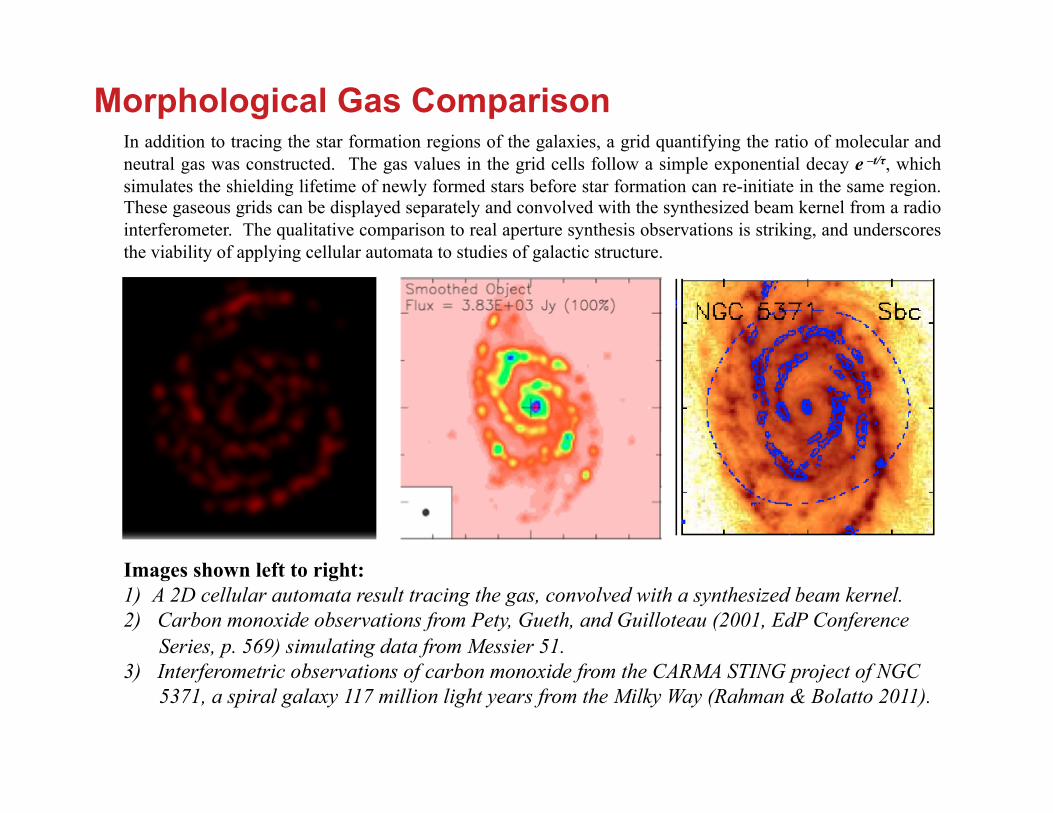
Morphological Gas Comparison In addition to tracing the star formation regions of the galaxies, a grid quantifying the ratio of molecular and neutral gas was constructed. The gas values in the grid cells follow a simple exponential decay e –t/τ, which simulates the shielding lifetime of newly formed stars before star formation can re-initiate in the same region. These gaseous grids can be displayed separately and convolved with the synthesized beam kernel from a radio interferometer. The qualitative comparison to real aperture synthesis observations is striking, and underscores the viability of applying cellular automata to studies of galactic structure.
Images shown left to right: 1) A 2D cellular automata result tracing the gas, convolved with a synthesized beam kernel. 2) Carbon monoxide observations from Pety, Gueth, and Guilloteau (2001, EdP Conference
Series, p. 569) simulating data from Messier 51. 3) Interferometric observations of carbon monoxide from the CARMA STING project of NGC
5371, a spiral galaxy 117 million light years from the Milky Way (Rahman & Bolatto 2011).
Summary • We have presented a rotating polar grid scheme for studying galaxies with 2D cellular automata. • Three analytical models for galaxy rotation as well as varying the star formation probability form
galaxy templates for comparison to observed data. • A Chebyshev Fourier set of 2D basis functions is utilized for image decomposition. The
coefficients from this decomposition are used to compute a Sersic index (n) for comparison to observations.
• The star formation probability of 0.18 agrees well with the analytically derived values of 0.183 from Shulman & Seiden (1986, Science). The Sersic index, when parameterized in terms of the galactic effective radius re, stands out for the exponential disk scenario among the twelve template galaxies.
• A preliminary qualitative analysis of the gas tracers for the 2D cellular automata model show excellent agreement with radio interferometric observations.
• Further study of the gas characteristics need to incorporate physical gas densities. In addition, the models will be extended to three dimensions and incorporate stellar lifetimes as a function of galactic scale height.
• Acknowledgements: B.R. Kent wishes to thank Dr. Vitaliy Kurov and Michael Sollami for helpful comments on improving the presentation of this work.
Top Related