


γλώσσες
Σελίδες
Νομικός

J Electroceram (2017) 38:142–156DOI 10.1007/s10832-017-0071-4
Ion dynamics in solid electrolytes for lithium batteriesProbing jump rates and activation energies through time-domain Li NMR
Marlena Uitz1 ·Viktor Epp1 · Patrick Bottke1 ·Martin Wilkening1,2
Received: 6 September 2016 / Accepted: 6 February 2017 / Published online: 7 March 2017© The Author(s) 2017. This article is published with open access at Springerlink.com
Abstract All-solid-state batteries with ceramic electrolytesand lithium metal anodes represent an attractive alternativeto conventional ion battery systems. Conventional batter-ies still rely on flammable liquids as electronic insulators.Despite the great efforts reported over the last years, theoptimum solid electrolyte has, however, not been foundyet. One of the most important properties which decideswhether a ceramic is useful to work as electrolyte is ionictransport. The various time-domain nuclear magnetic res-onance (NMR) techniques might help characterize andselect the most suitable candidates. Together with conduc-tivity measurements it is possible to analyze ion dynam-ics on different length-scales, i.e., to differentiate betweenlocal, within-site hopping processes from long-range iontransport. The latter needs to be sufficiently fast in theceramic, in the best case competing with that of liquidelectrolytes. In addition to conductivity spectroscopy, NMRcan help understand the relationship between local structureand dynamic parameters. Besides information on activationenergies and jump rates the data also contain suggestionsabout the relevant elementary steps of ion hopping and, thus,
Support by the Deutsche Forschungsgemeinschaft (DFG) is highlyappreciated (FOR 1277).
� Martin [email protected]
1 Christian Doppler Laboratory for Lithium Batteries,and Institute for Chemistry and Technology of Materials,Graz University of Technology (NAWI Graz),Stremayrgasse 9, 8010 Graz, Austria
2 Alistore-ERI European Research Institute,33 rue Saint Leu, 80039 Amiens, France
diffusion pathways through the crystal lattice. Recentprogress in characterizing ion dynamics in ceramic elec-trolytes by NMR relaxometry will be briefly reviewed.Focus is put on presently discussed solid electrolytes suchas garnets, phosphates and sulfides, which have so far beenstudied in our lab.
Keywords Solid electrolytes · Nuclear magnetic resonancespectroscopy · Relaxation · Bulk Li ion diffusivity
1 Introduction
The march of global warming caused by overmuch green-house gas emissions is hoped to be met, at least in themedium run, by powerful electrochemical energy storagesystems [1, 2]. Abandoning combustion engines will greatlycut our dependencies on fossil fuels. Systems based onmobile lithium ions are currently the most advanced bat-teries with which most of the portable devices and electricvehicles are powered [2–15]. Although we have witnessedremarkable advances in the last decades further progress inlithium-ion battery technology based on liquid electrolytes[12, 16–18] might crest in the future. All-solid-state lithiummetal batteries with solid electrolytes [19–22] (cf. Fig. 1)represent one of the next-generation technologies [23–31].
Such systems, taking advantage of ceramic solid elec-trolytes [19, 22, 58, 59], are advantageous because of twoconsiderations: (i) turning away from highly flammableliquid electrolytes is expected to greatly improve safety andlongevity, i.e., to reduce aging processes; (ii) (highly) denseand electrochemically stable inorganic electrolytes wouldallow the use of metallic Li as anode material, instantlyincreasing current charge capacities. The search for suitablematerials that are characterized by ultra-fast ion dynamics
J Electroceram (2017) 38:142–156 143
10-4
10-3
10-2
10-1
/ Scm
–1
4.03.53.02.52.0
1000/T / K –1
100
Li GeP S10
212
LiPON
glass Li S:PS
2
25
LiSiPOcubic-Al-LLZO
LATPO
Li InBr3 6
LLTO
Li P S73
11
Li Ge P S3.25 0.25 0.75 4
glass Li S:SiS :Li2 2 3 4PO
glassLi S:SiS :2 2P S :LiI2 5
glass Li S:SiS :2
2Li SiO4
4
10-8
10-7
10-6
10-5
10-4
10-3
10-2
10-1
100
101
654321
/ Scm
–1
1000/T / K –1
LiPON
cubic-Al-LLZO
tetragonal-LLZO
LiBSO
Li GeP S
10
212
Li : :PF EC PC6
PEO:LiClO
4
Li :BF EMIBF4 4
Li : :PF EC6: :PC PVDF HFP
d-Li N3s-Li N3
LISICON
-Li2 4SO
Li- -alumina
see b)
295 K
(a) (b)
d-Li P S73
11
cubic-Ga-LLZO
Li SnP S10
212
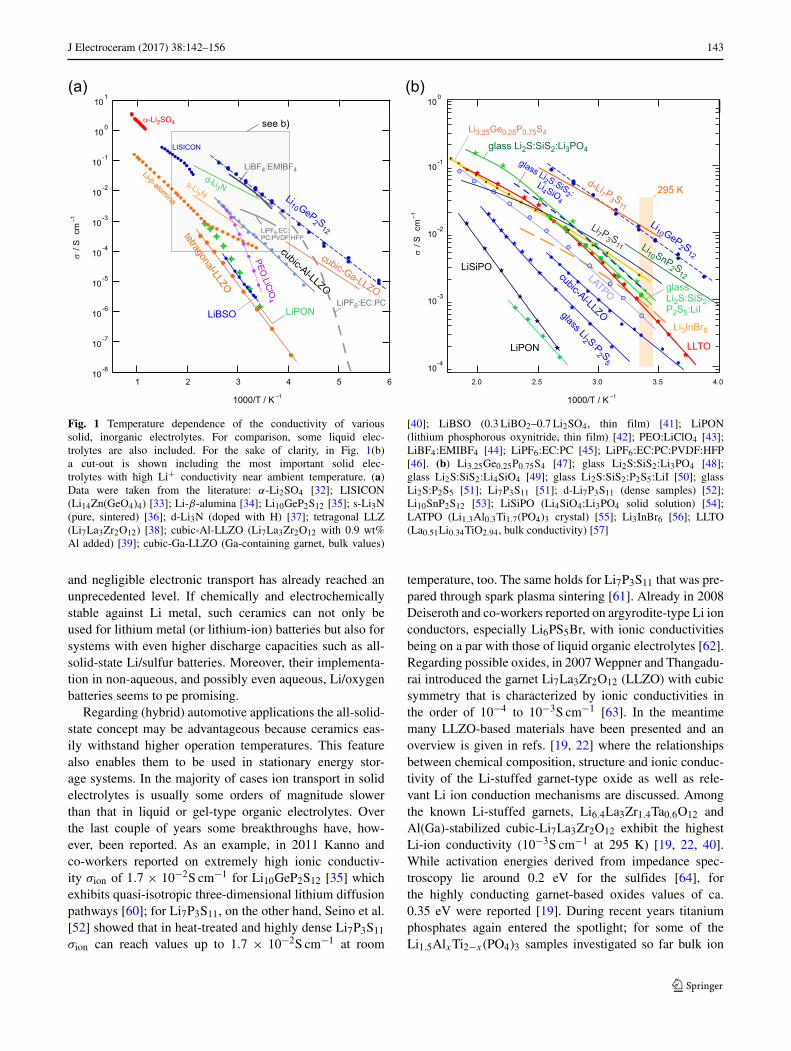
Fig. 1 Temperature dependence of the conductivity of varioussolid, inorganic electrolytes. For comparison, some liquid elec-trolytes are also included. For the sake of clarity, in Fig. 1(b)a cut-out is shown including the most important solid elec-trolytes with high Li+ conductivity near ambient temperature. (a)Data were taken from the literature: α-Li2SO4 [32]; LISICON(Li14Zn(GeO4)4) [33]; Li-β-alumina [34]; Li10GeP2S12 [35]; s-Li3N(pure, sintered) [36]; d-Li3N (doped with H) [37]; tetragonal LLZ(Li7La3Zr2O12) [38]; cubic-Al-LLZO (Li7La3Zr2O12 with 0.9 wt%Al added) [39]; cubic-Ga-LLZO (Ga-containing garnet, bulk values)
[40]; LiBSO (0.3 LiBO2–0.7 Li2SO4, thin film) [41]; LiPON(lithium phosphorous oxynitride, thin film) [42]; PEO:LiClO4 [43];LiBF4:EMIBF4 [44]; LiPF6:EC:PC [45]; LiPF6:EC:PC:PVDF:HFP[46]. (b) Li3.25Ge0.25P0.75S4 [47]; glass Li2S:SiS2:Li3PO4 [48];glass Li2S:SiS2:Li4SiO4 [49]; glass Li2S:SiS2:P2S5:LiI [50]; glassLi2S:P2S5 [51]; Li7P3S11 [51]; d-Li7P3S11 (dense samples) [52];Li10SnP2S12 [53]; LiSiPO (Li4SiO4:Li3PO4 solid solution) [54];LATPO (Li1.3Al0.3Ti1.7(PO4)3 crystal) [55]; Li3InBr6 [56]; LLTO(La0.51Li0.34TiO2.94, bulk conductivity) [57]
and negligible electronic transport has already reached anunprecedented level. If chemically and electrochemicallystable against Li metal, such ceramics can not only beused for lithium metal (or lithium-ion) batteries but also forsystems with even higher discharge capacities such as all-solid-state Li/sulfur batteries. Moreover, their implementa-tion in non-aqueous, and possibly even aqueous, Li/oxygenbatteries seems to pe promising.
Regarding (hybrid) automotive applications the all-solid-state concept may be advantageous because ceramics eas-ily withstand higher operation temperatures. This featurealso enables them to be used in stationary energy stor-age systems. In the majority of cases ion transport in solidelectrolytes is usually some orders of magnitude slowerthan that in liquid or gel-type organic electrolytes. Overthe last couple of years some breakthroughs have, how-ever, been reported. As an example, in 2011 Kanno andco-workers reported on extremely high ionic conductiv-ity σion of 1.7 × 10⁻²S cm−1 for Li10GeP2S12 [35] whichexhibits quasi-isotropic three-dimensional lithium diffusionpathways [60]; for Li7P3S11, on the other hand, Seino et al.[52] showed that in heat-treated and highly dense Li7P3S11
σion can reach values up to 1.7 × 10⁻²S cm−1 at room
temperature, too. The same holds for Li7P3S11 that was pre-pared through spark plasma sintering [61]. Already in 2008Deiseroth and co-workers reported on argyrodite-type Li ionconductors, especially Li6PS5Br, with ionic conductivitiesbeing on a par with those of liquid organic electrolytes [62].Regarding possible oxides, in 2007 Weppner and Thangadu-rai introduced the garnet Li7La3Zr2O12 (LLZO) with cubicsymmetry that is characterized by ionic conductivities inthe order of 10−4 to 10−3S cm−1 [63]. In the meantimemany LLZO-based materials have been presented and anoverview is given in refs. [19, 22] where the relationshipsbetween chemical composition, structure and ionic conduc-tivity of the Li-stuffed garnet-type oxide as well as rele-vant Li ion conduction mechanisms are discussed. Amongthe known Li-stuffed garnets, Li6.4La3Zr1.4Ta0.6O12 andAl(Ga)-stabilized cubic-Li7La3Zr2O12 exhibit the highestLi-ion conductivity (10−3S cm−1 at 295 K) [19, 22, 40].While activation energies derived from impedance spec-troscopy lie around 0.2 eV for the sulfides [64], forthe highly conducting garnet-based oxides values of ca.0.35 eV were reported [19]. During recent years titaniumphosphates again entered the spotlight; for some of theLi1.5AlxTi2−x(PO4)3 samples investigated so far bulk ion
144 J Electroceram (2017) 38:142–156
conductivities have been reported to be in the order of10−3S cm−1 with activation energies ranging from approx-imately 0.2 to 0.35 eV [65]. An overview of conductivitiesof earlier and just recently studied ceramic electrolytes isgiven in Fig. 1.
To study ion dynamics in promising ceramics on theangstrom length scale, that is, from an atomic scale pointof view, nuclear magnetic resonance (NMR) can be applied[18, 66, 67]. NMR plays on the various interactions of the Lispins with external and internal magnetic fields. By sensingthe dipolar-magnetic or quadrupolar-electric fluctuations asa function of temperature, through NMR relaxation tech-niques bulk ion dynamics are probed that shed light onthe elementary steps governing ion hopping. Moreover, inideal cases NMR also allows to draw conclusions aboutthe underlying motional correlation functions [68–72]. Incontrast to impedance or conductivity measurements nopost-preparation of the synthesized powder, i.e., pressingof dense pellets, applying of electrodes, is necessary. NMRis a non-destructive and non-contact method applicable toall kinds of powder samples or single crystals includingalso mixed-conducting materials [73, 74]. Before we presentsome of the recently collected results on selected elec-trolytes, the demands on solid electrolytes and all-solid-statebatteries are briefly discussed. A high ionic conductivity ordiffusivity is just one of several requirements that need to befulfilled to realize an efficiently working system.
2 The demands on solid electrolytesand all-solid-state batteries
A number of hurdles still need to be overcome to developa long-lasting and powerful all-solid-state system; someof these aspects are illustrated in Fig. 2. Even if an elec-trolyte with sufficiently high ionic but negligible electronicconductivity is at hand, its chemical and electrochemi-cal stability has to be studied thoroughly. In many cases,especially if nanostructured materials with large interfacialregions are considered [75–77], we do not know much aboutany possible low electronic contributions. These may leadto slow self-discharge of the whole system during long-term operation. Such long-term observations are also keyto other issues. While for thin-film batteries, prepared bycost-intensive sputtering or other (vacuum) deposition tech-niques, Li metal anodes might be difficult to implement, forbulk-type batteries the use of metal anodes will provide thenecessary jump in energy density to make them a seriousoption for electric vehicles. Although the ceramic acts asa ’dense’ membrane the risk of unsolicited Li plating anddendrite formation along grain boundaries is still given [78].
Besides Li dendrites, which may cause short-circuitsleading to increased fire hazards, a passivating layer at the
electrode-electrolyte interface, see, e.g., ref. [79], as well asat the solid electrolyte-liquid electrolyte interface in hybridbatteries may form [80]. The formation of such layers,which in most cases consist of decomposition products ofthe electrolyte, depend on the electrochemical stability ofthe ion conductor. Many electrolytes known are unstableagainst Li metal [81–84]. If high-voltage cathode materi-als are used to increase the power and energy density ofthe system, the electrolyte has to withstand potentials as ahigh as 5 V. Although electrochemical stability of solid elec-trolytes has been shown to be much better than that of liquidorganic blends [84], the long-term stability of a given solidat high cathode potentials or being in contact with Li metalis still one of the white areas future research has to tackle.Placing a very thin, artificial interlayer such as crystalline(or amorphous) LiAlO2, LiTaO3, LiNbO3 or even Al2O3
[85] at the cathode-electrolyte interface may increase chem-ical and electrochemical stability [21, 79, 86, 87]. Theseelectronically insulating extra phases may, however, suf-fer from low intrinsic conductivity. They should be kept asthin as possible in order to not increase the correspondingcharge transfer resistance. Paying attention to cost-effectiveprocessing techniques, able to implement such layers, isanother key factor that might delay the breakthrough oflarge scale solid-state batteries.
Crossing the macroscopic boundaries and interfaces in asolid-state battery, which may change in chemical compo-sition and morphology during the diverse operating condi-tions, represent the major hurdle the ions themselves haveto master [79, 80, 86]. Impedance spectroscopy might bethe method of choice to study internal resistances as a func-tion of ageing. Considering the ’internal’ barriers of thesolid electrolyte a picture with similar complexity shows up.While, in ideal cases, AC conductivity spectroscopy is ableto differentiate between bulk and grain boundary responses[65, 88], ion dynamics inside the lattice is often controlledby a highly irregular potential landscape. Hence, σbulk andits activation energy Ea, AC represent mean values. For manymaterials there is not a single diffusion mechanism orjump process at work but many processes run in parallel.Depending on the frequency range looked at, the weighedsuperposition of these processes yields Ea, AC. With the useof NMR the ion dynamics on the angstrom length scale canbe (separately) characterized. Differences between resultsfrom NMR and AC conductivity spectroscopy [89–91], evenif carried out in the MHz range where NMR operates [92],can be explained by the different motional correlation func-tions to which the methods are sensitive. The difference inresults from NMR, driven by spin fluctuations, and conduc-tivity spectroscopy, driven by electrical relaxation, has beenthe topic of many studies employing several models to assistin interpretation; see refs. [93–95] that serve as some of theearly examples dealing with this aspect. Worth noting, NMR
J Electroceram (2017) 38:142–156 145
SE, SEI, Li
}bulk, g.b.
active material
conductive additivesolid electrolyte
}
EA,NMR EA,NMR(local )(ized)
EA,ACbulk
EA,ACg.b.
crystallite 1 crystallite 2
EA
rg.b.
ion conductor ion conductor
mechanical stability
compositecathode
local (electronic) structure ofinterfacial regions may largely differ from bulkthat in the
blocking or enhancing ion transportacross or along g.b.
currentcollector
(b)
binder} passivating layers
LiNbO , LiTaO , ...3 3
Li anode
dendrites
}LiNbO3
(a)
EA,NMR( )long range
low-T
( )or insulator
low-T
high-T
( )medium range
}pores
protective coating
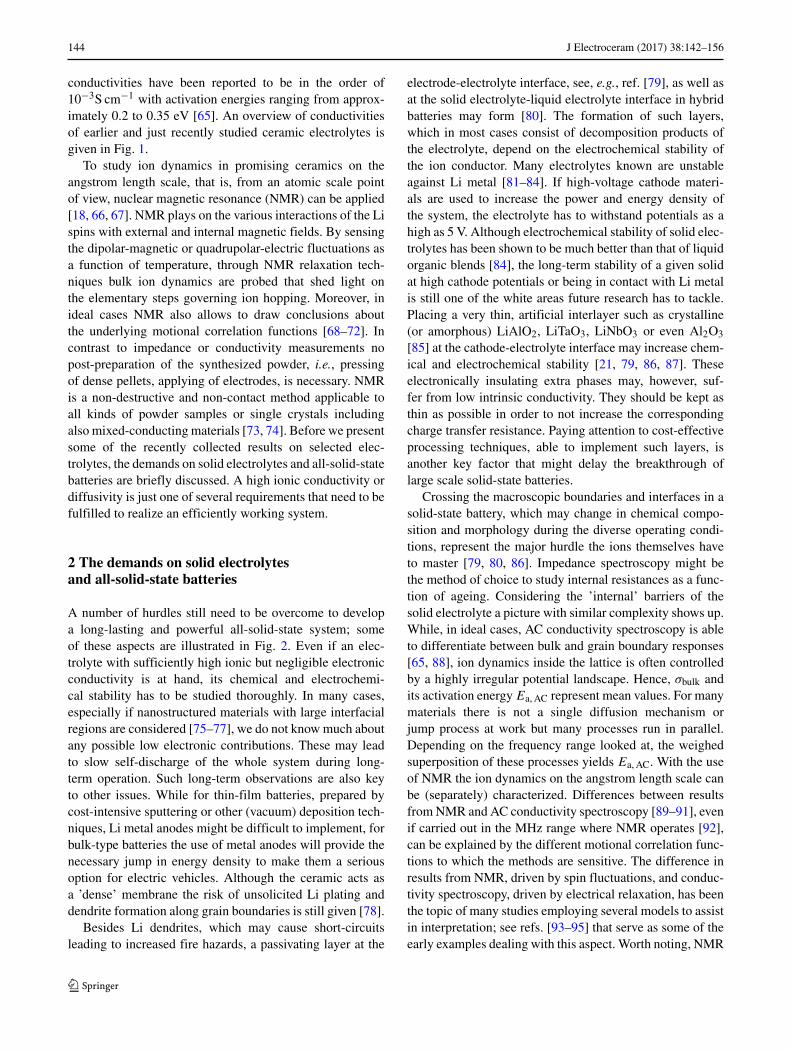
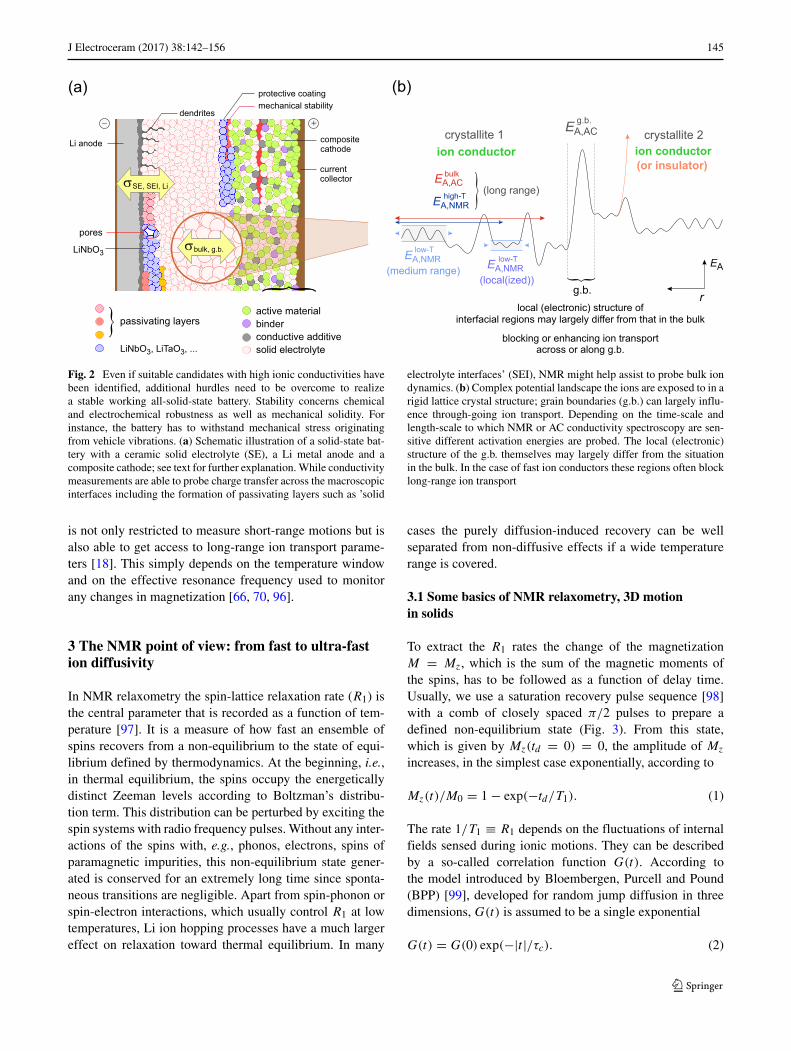
Fig. 2 Even if suitable candidates with high ionic conductivities havebeen identified, additional hurdles need to be overcome to realizea stable working all-solid-state battery. Stability concerns chemicaland electrochemical robustness as well as mechanical solidity. Forinstance, the battery has to withstand mechanical stress originatingfrom vehicle vibrations. (a) Schematic illustration of a solid-state bat-tery with a ceramic solid electrolyte (SE), a Li metal anode and acomposite cathode; see text for further explanation. While conductivitymeasurements are able to probe charge transfer across the macroscopicinterfaces including the formation of passivating layers such as ’solid
electrolyte interfaces’ (SEI), NMR might help assist to probe bulk iondynamics. (b) Complex potential landscape the ions are exposed to in arigid lattice crystal structure; grain boundaries (g.b.) can largely influ-ence through-going ion transport. Depending on the time-scale andlength-scale to which NMR or AC conductivity spectroscopy are sen-sitive different activation energies are probed. The local (electronic)structure of the g.b. themselves may largely differ from the situationin the bulk. In the case of fast ion conductors these regions often blocklong-range ion transport
is not only restricted to measure short-range motions but isalso able to get access to long-range ion transport parame-ters [18]. This simply depends on the temperature windowand on the effective resonance frequency used to monitorany changes in magnetization [66, 70, 96].
3 The NMR point of view: from fast to ultra-fastion diffusivity
In NMR relaxometry the spin-lattice relaxation rate (R1) isthe central parameter that is recorded as a function of tem-perature [97]. It is a measure of how fast an ensemble ofspins recovers from a non-equilibrium to the state of equi-librium defined by thermodynamics. At the beginning, i.e.,in thermal equilibrium, the spins occupy the energeticallydistinct Zeeman levels according to Boltzman’s distribu-tion term. This distribution can be perturbed by exciting thespin systems with radio frequency pulses. Without any inter-actions of the spins with, e.g., phonos, electrons, spins ofparamagnetic impurities, this non-equilibrium state gener-ated is conserved for an extremely long time since sponta-neous transitions are negligible. Apart from spin-phonon orspin-electron interactions, which usually control R1 at lowtemperatures, Li ion hopping processes have a much largereffect on relaxation toward thermal equilibrium. In many
cases the purely diffusion-induced recovery can be wellseparated from non-diffusive effects if a wide temperaturerange is covered.
3.1 Some basics of NMR relaxometry, 3D motionin solids
To extract the R1 rates the change of the magnetizationM = Mz, which is the sum of the magnetic moments ofthe spins, has to be followed as a function of delay time.Usually, we use a saturation recovery pulse sequence [98]with a comb of closely spaced π/2 pulses to prepare adefined non-equilibrium state (Fig. 3). From this state,which is given by Mz(td = 0) = 0, the amplitude of Mz
increases, in the simplest case exponentially, according to
Mz(t)/M0 = 1 − exp(−td/T1). (1)
The rate 1/T1 ≡ R1 depends on the fluctuations of internalfields sensed during ionic motions. They can be describedby a so-called correlation function G(t). According tothe model introduced by Bloembergen, Purcell and Pound(BPP) [99], developed for random jump diffusion in threedimensions, G(t) is assumed to be a single exponential
G(t) = G(0) exp(−|t |/τc). (2)
146 J Electroceram (2017) 38:142–156
( /2)x(b)
t t t= 0 =
B (locking field)1
FID
lock
M y
FID[...]
n ( /2)x
t t t= 0 = d
Mz
ρ ( )
(a)
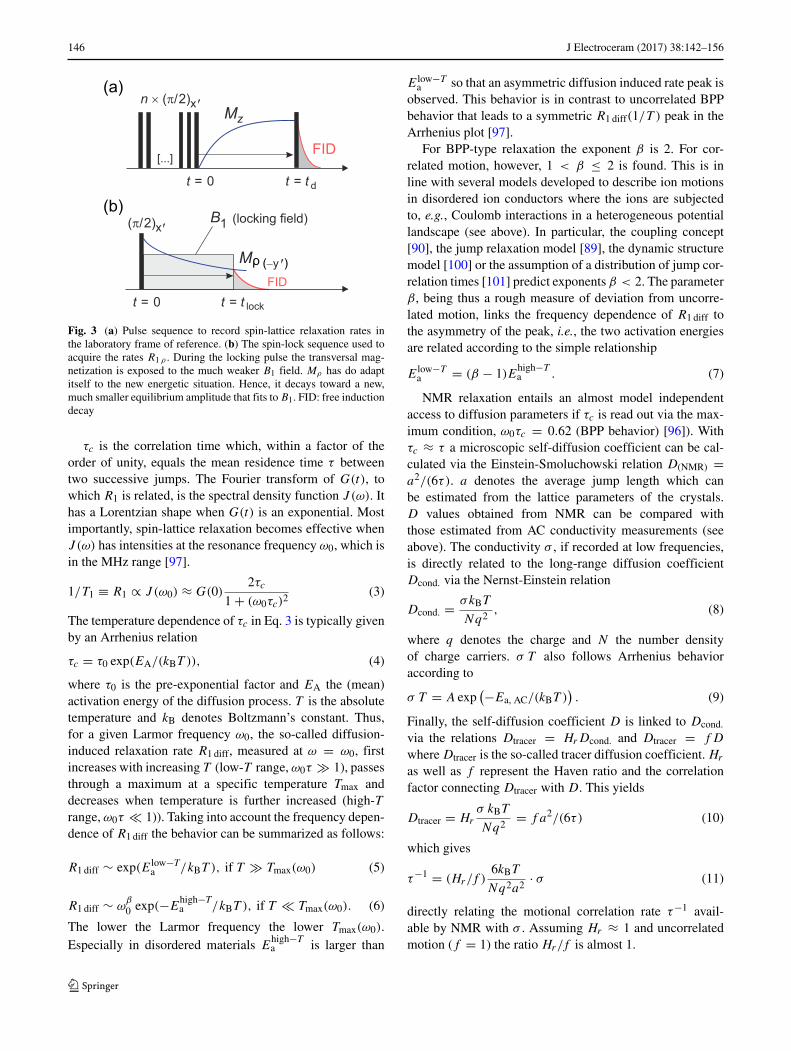
Fig. 3 (a) Pulse sequence to record spin-lattice relaxation rates inthe laboratory frame of reference. (b) The spin-lock sequence used toacquire the rates R1 ρ . During the locking pulse the transversal mag-netization is exposed to the much weaker B1 field. Mρ has do adaptitself to the new energetic situation. Hence, it decays toward a new,much smaller equilibrium amplitude that fits to B1. FID: free inductiondecay
τc is the correlation time which, within a factor of theorder of unity, equals the mean residence time τ betweentwo successive jumps. The Fourier transform of G(t), towhich R1 is related, is the spectral density function J (ω). Ithas a Lorentzian shape when G(t) is an exponential. Mostimportantly, spin-lattice relaxation becomes effective whenJ (ω) has intensities at the resonance frequency ω0, which isin the MHz range [97].
1/T1 ≡ R1 ∝ J (ω0) ≈ G(0)2τc
1 + (ω0τc)2(3)
The temperature dependence of τc in Eq. 3 is typically givenby an Arrhenius relation
τc = τ0 exp(EA/(kBT )), (4)
where τ0 is the pre-exponential factor and EA the (mean)activation energy of the diffusion process. T is the absolutetemperature and kB denotes Boltzmann’s constant. Thus,for a given Larmor frequency ω0, the so-called diffusion-induced relaxation rate R1 diff, measured at ω = ω0, firstincreases with increasing T (low-T range, ω0τ � 1), passesthrough a maximum at a specific temperature Tmax anddecreases when temperature is further increased (high-Trange, ω0τ � 1)). Taking into account the frequency depen-dence of R1 diff the behavior can be summarized as follows:
R1 diff ∼ exp(Elow−Ta /kBT ), if T � Tmax(ω0) (5)
R1 diff ∼ ωβ
0 exp(−Ehigh−Ta /kBT ), if T � Tmax(ω0). (6)
The lower the Larmor frequency the lower Tmax(ω0).Especially in disordered materials E
high−Ta is larger than
Elow−Ta so that an asymmetric diffusion induced rate peak is
observed. This behavior is in contrast to uncorrelated BPPbehavior that leads to a symmetric R1 diff(1/T ) peak in theArrhenius plot [97].
For BPP-type relaxation the exponent β is 2. For cor-related motion, however, 1 < β ≤ 2 is found. This is inline with several models developed to describe ion motionsin disordered ion conductors where the ions are subjectedto, e.g., Coulomb interactions in a heterogeneous potentiallandscape (see above). In particular, the coupling concept[90], the jump relaxation model [89], the dynamic structuremodel [100] or the assumption of a distribution of jump cor-relation times [101] predict exponents β < 2. The parameterβ, being thus a rough measure of deviation from uncorre-lated motion, links the frequency dependence of R1 diff tothe asymmetry of the peak, i.e., the two activation energiesare related according to the simple relationship
Elow−Ta = (β − 1)E
high−Ta . (7)
NMR relaxation entails an almost model independentaccess to diffusion parameters if τc is read out via the max-imum condition, ω0τc = 0.62 (BPP behavior) [96]). Withτc ≈ τ a microscopic self-diffusion coefficient can be cal-culated via the Einstein-Smoluchowski relation D(NMR) =a2/(6τ). a denotes the average jump length which canbe estimated from the lattice parameters of the crystals.D values obtained from NMR can be compared withthose estimated from AC conductivity measurements (seeabove). The conductivity σ , if recorded at low frequencies,is directly related to the long-range diffusion coefficientDcond. via the Nernst-Einstein relation
Dcond. = σkBT
Nq2, (8)
where q denotes the charge and N the number densityof charge carriers. σ T also follows Arrhenius behavioraccording to
σ T = A exp(−Ea, AC/(kBT )
). (9)
Finally, the self-diffusion coefficient D is linked to Dcond.
via the relations Dtracer = HrDcond. and Dtracer = f D
where Dtracer is the so-called tracer diffusion coefficient. Hr
as well as f represent the Haven ratio and the correlationfactor connecting Dtracer with D. This yields
Dtracer = Hr
σ kBT
Nq2= f a2/(6τ) (10)
which gives
τ−1 = (Hr/f )6kBT
Nq2a2· σ (11)
directly relating the motional correlation rate τ−1 avail-able by NMR with σ . Assuming Hr ≈ 1 and uncorrelatedmotion (f = 1) the ratio Hr/f is almost 1.
J Electroceram (2017) 38:142–156 147
Since ω0 is in the order of some MHz if external mag-netic fields of several Tesla are used to measure Mz(td), thecorresponding residence time τ(Tmax) takes values in thens regime. τ ≈ 1 ns roughly transforms into conductivitiesin the order of 10−3S cm−1; the corresponding diffusion-induced rate peak R1 diff should desirably show up at oreven below ambient temperature [18]. Replacing ω0 for-mally with a much smaller frequency in the kHz regimewould shift the corresponding peak toward much lower tem-peratures. The measurement technique that can be usedfor this purpose is called spin-lock NMR where transver-sal spin-lattice relaxation is observed in the rotating frameof reference [102–106]: Immediately after a π/2-pulse themagnetization Mρ , pointing along the (−y′)-axis, is lockedby the magnetic field B1 used to generate the excitationpulse (Fig. 3). The decay of Mρ(−y′) is then probed as afunction of the locking pulse length tlock.[107]. In the easi-est case Mρ(−y′) follows an exponential decay governed byR1 ρ . Because of ω0 � ω1, spin-lock NMR is able to probeslower ionic motions. In many cases this enables access tothe high-T flank of the corresponding rate peak [97]. As forR1, the slope of this flank describes long-range ionic motionthrough the crystal lattice.
In the following we will review some examples whereboth laboratory frame (R1) and rotating frame (R1 ρ) NMRrelaxometry has been used to characterize ion dynamics insome of the most promising solid electrolytes. Emphasisis put on extracting Li jump rates and activation energiesdescribing both short-range and long-range ion dynamics.
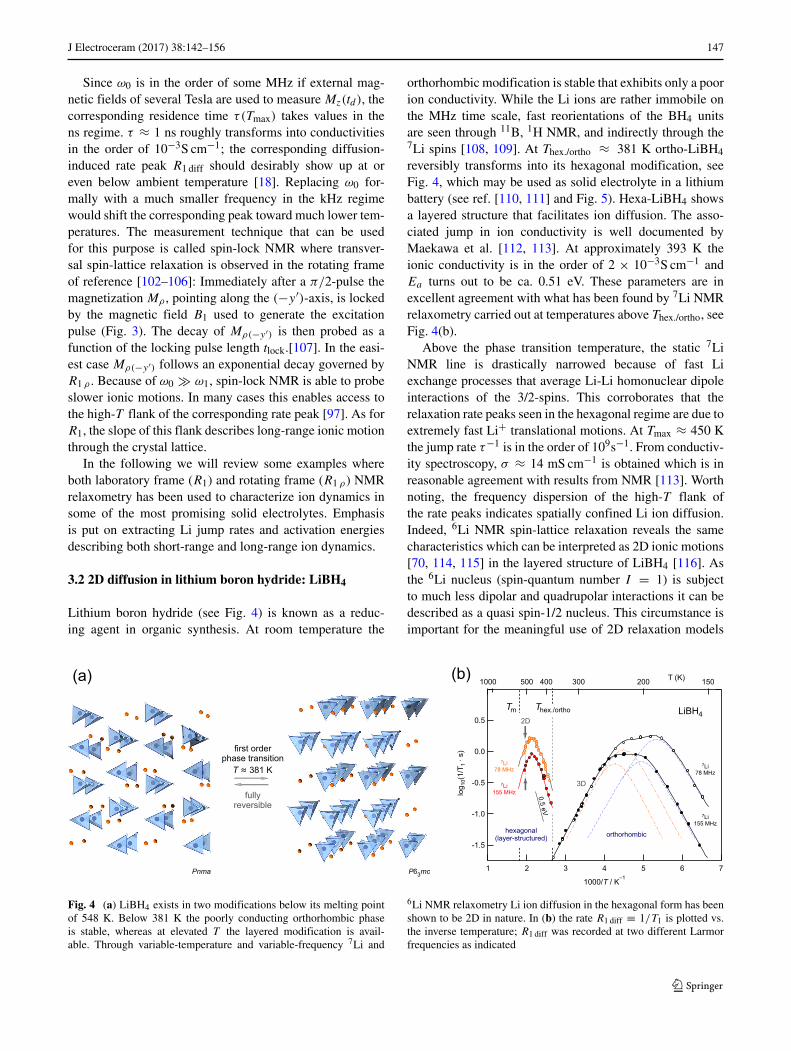
3.2 2D diffusion in lithium boron hydride: LiBH4
Lithium boron hydride (see Fig. 4) is known as a reduc-ing agent in organic synthesis. At room temperature the
orthorhombic modification is stable that exhibits only a poorion conductivity. While the Li ions are rather immobile onthe MHz time scale, fast reorientations of the BH4 unitsare seen through 11B, 1H NMR, and indirectly through the7Li spins [108, 109]. At Thex./ortho ≈ 381 K ortho-LiBH4
reversibly transforms into its hexagonal modification, seeFig. 4, which may be used as solid electrolyte in a lithiumbattery (see ref. [110, 111] and Fig. 5). Hexa-LiBH4 showsa layered structure that facilitates ion diffusion. The asso-ciated jump in ion conductivity is well documented byMaekawa et al. [112, 113]. At approximately 393 K theionic conductivity is in the order of 2 × 10⁻³S cm−1 andEa turns out to be ca. 0.51 eV. These parameters are inexcellent agreement with what has been found by 7Li NMRrelaxometry carried out at temperatures above Thex./ortho, seeFig. 4(b).
Above the phase transition temperature, the static 7LiNMR line is drastically narrowed because of fast Liexchange processes that average Li-Li homonuclear dipoleinteractions of the 3/2-spins. This corroborates that therelaxation rate peaks seen in the hexagonal regime are due toextremely fast Li+ translational motions. At Tmax ≈ 450 Kthe jump rate τ−1 is in the order of 109s−1. From conductiv-ity spectroscopy, σ ≈ 14 mS cm−1 is obtained which is inreasonable agreement with results from NMR [113]. Worthnoting, the frequency dispersion of the high-T flank ofthe rate peaks indicates spatially confined Li ion diffusion.Indeed, 6Li NMR spin-lattice relaxation reveals the samecharacteristics which can be interpreted as 2D ionic motions[70, 114, 115] in the layered structure of LiBH4 [116]. Asthe 6Li nucleus (spin-quantum number I = 1) is subjectto much less dipolar and quadrupolar interactions it can bedescribed as a quasi spin-1/2 nucleus. This circumstance isimportant for the meaningful use of 2D relaxation models
T 381 K
first orderphase transition
fullyreversible
-1.5
-1.0
-0.5
0.0
0.5
log 1
0(1/
T 1· s
)
7654321
1000 500 400 300 200 150T (K)
Tm Thex./ortho
7Li78 zMH
7Li155 zMH
7Li155 zMH
7Li78 zMH
LiBH4
0.5eV
hexagonal(layer-structured) orthorhombic
2D
3D
(a) (b)
Pnma P63mc1000/T / K–1
Fig. 4 (a) LiBH4 exists in two modifications below its melting pointof 548 K. Below 381 K the poorly conducting orthorhombic phaseis stable, whereas at elevated T the layered modification is avail-able. Through variable-temperature and variable-frequency 7Li and
6Li NMR relaxometry Li ion diffusion in the hexagonal form has beenshown to be 2D in nature. In (b) the rate R1 diff ≡ 1/T1 is plotted vs.the inverse temperature; R1 diff was recorded at two different Larmorfrequencies as indicated
148 J Electroceram (2017) 38:142–156
2.0
1.8
1.6
1.4
1.2
1.0
pote
ntia
l / V
350300250200150100500capacity / mAh/g
cycle 1cycle 2cycle 5cycle 9cycle 13cycle 17
C/20
C/20
C/10
C/5
C/2
1C
-0.30
-0.25
-0.20
-0.15
-0.10
-0.05
0.00
0.05
0.10
0.15
curre
nt /
μA
54321potential / V
cycle 1 - 3 V)(cycle (1 - 4 V)cycle (1 - 5 V)
steel | LiBH | Li4
350
300
250
200
150
100
50
0
capa
city
/ m
Ah/g
2015105cycle number
Li insertion (discharge)Li extraction (charge)
C/20 C/10 C/5 C/21C
(a) (b) (c)
125 mAh/g
175 mAh/g
UOCV (LTO) = 1.56 V
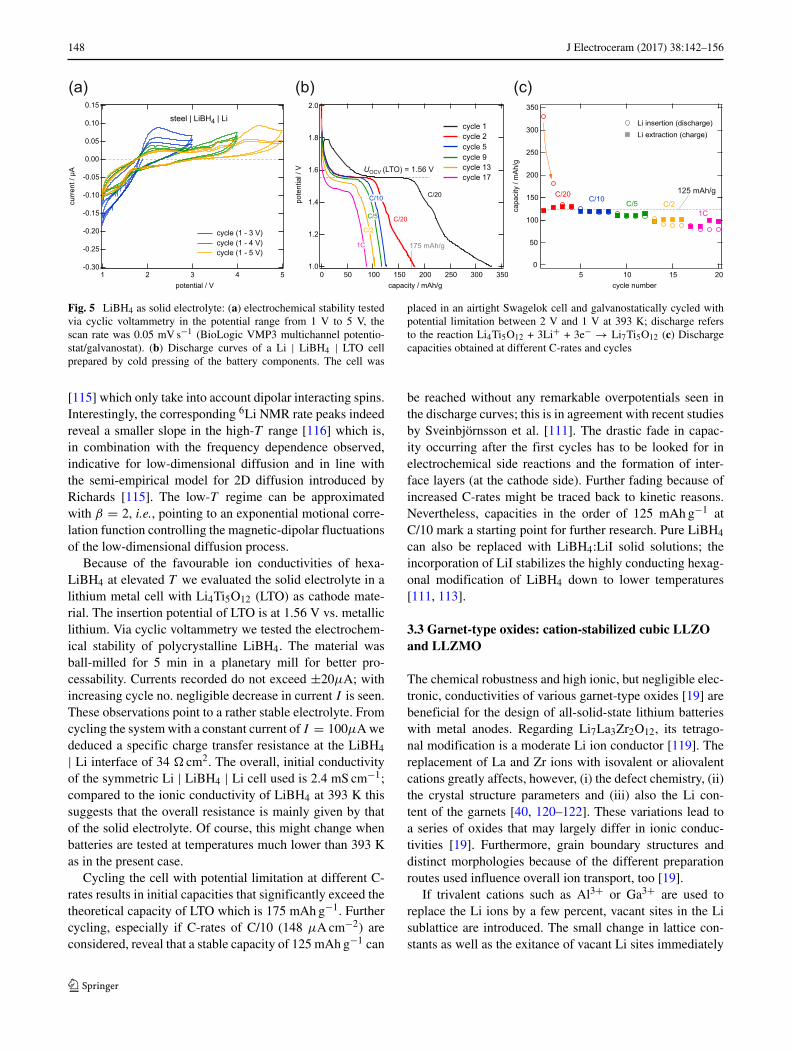
Fig. 5 LiBH4 as solid electrolyte: (a) electrochemical stability testedvia cyclic voltammetry in the potential range from 1 V to 5 V, thescan rate was 0.05 mV s−1 (BioLogic VMP3 multichannel potentio-stat/galvanostat). (b) Discharge curves of a Li | LiBH4 | LTO cellprepared by cold pressing of the battery components. The cell was
placed in an airtight Swagelok cell and galvanostatically cycled withpotential limitation between 2 V and 1 V at 393 K; discharge refersto the reaction Li4Ti5O12 + 3Li+ + 3e− → Li7Ti5O12 (c) Dischargecapacities obtained at different C-rates and cycles
[115] which only take into account dipolar interacting spins.Interestingly, the corresponding 6Li NMR rate peaks indeedreveal a smaller slope in the high-T range [116] which is,in combination with the frequency dependence observed,indicative for low-dimensional diffusion and in line withthe semi-empirical model for 2D diffusion introduced byRichards [115]. The low-T regime can be approximatedwith β = 2, i.e., pointing to an exponential motional corre-lation function controlling the magnetic-dipolar fluctuationsof the low-dimensional diffusion process.
Because of the favourable ion conductivities of hexa-LiBH4 at elevated T we evaluated the solid electrolyte in alithium metal cell with Li4Ti5O12 (LTO) as cathode mate-rial. The insertion potential of LTO is at 1.56 V vs. metalliclithium. Via cyclic voltammetry we tested the electrochem-ical stability of polycrystalline LiBH4. The material wasball-milled for 5 min in a planetary mill for better pro-cessability. Currents recorded do not exceed ±20μA; withincreasing cycle no. negligible decrease in current I is seen.These observations point to a rather stable electrolyte. Fromcycling the system with a constant current of I = 100μA wededuced a specific charge transfer resistance at the LiBH4
| Li interface of 34 cm2. The overall, initial conductivityof the symmetric Li | LiBH4 | Li cell used is 2.4 mS cm−1;compared to the ionic conductivity of LiBH4 at 393 K thissuggests that the overall resistance is mainly given by thatof the solid electrolyte. Of course, this might change whenbatteries are tested at temperatures much lower than 393 Kas in the present case.
Cycling the cell with potential limitation at different C-rates results in initial capacities that significantly exceed thetheoretical capacity of LTO which is 175 mAh g−1. Furthercycling, especially if C-rates of C/10 (148 μA cm−2) areconsidered, reveal that a stable capacity of 125 mAh g−1 can
be reached without any remarkable overpotentials seen inthe discharge curves; this is in agreement with recent studiesby Sveinbjornsson et al. [111]. The drastic fade in capac-ity occurring after the first cycles has to be looked for inelectrochemical side reactions and the formation of inter-face layers (at the cathode side). Further fading because ofincreased C-rates might be traced back to kinetic reasons.Nevertheless, capacities in the order of 125 mAh g−1 atC/10 mark a starting point for further research. Pure LiBH4
can also be replaced with LiBH4:LiI solid solutions; theincorporation of LiI stabilizes the highly conducting hexag-onal modification of LiBH4 down to lower temperatures[111, 113].
3.3 Garnet-type oxides: cation-stabilized cubic LLZOand LLZMO
The chemical robustness and high ionic, but negligible elec-tronic, conductivities of various garnet-type oxides [19] arebeneficial for the design of all-solid-state lithium batterieswith metal anodes. Regarding Li7La3Zr2O12, its tetrago-nal modification is a moderate Li ion conductor [119]. Thereplacement of La and Zr ions with isovalent or aliovalentcations greatly affects, however, (i) the defect chemistry, (ii)the crystal structure parameters and (iii) also the Li con-tent of the garnets [40, 120–122]. These variations lead toa series of oxides that may largely differ in ionic conduc-tivities [19]. Furthermore, grain boundary structures anddistinct morphologies because of the different preparationroutes used influence overall ion transport, too [19].
If trivalent cations such as Al3+ or Ga3+ are used toreplace the Li ions by a few percent, vacant sites in the Lisublattice are introduced. The small change in lattice con-stants as well as the exitance of vacant Li sites immediately
J Electroceram (2017) 38:142–156 149
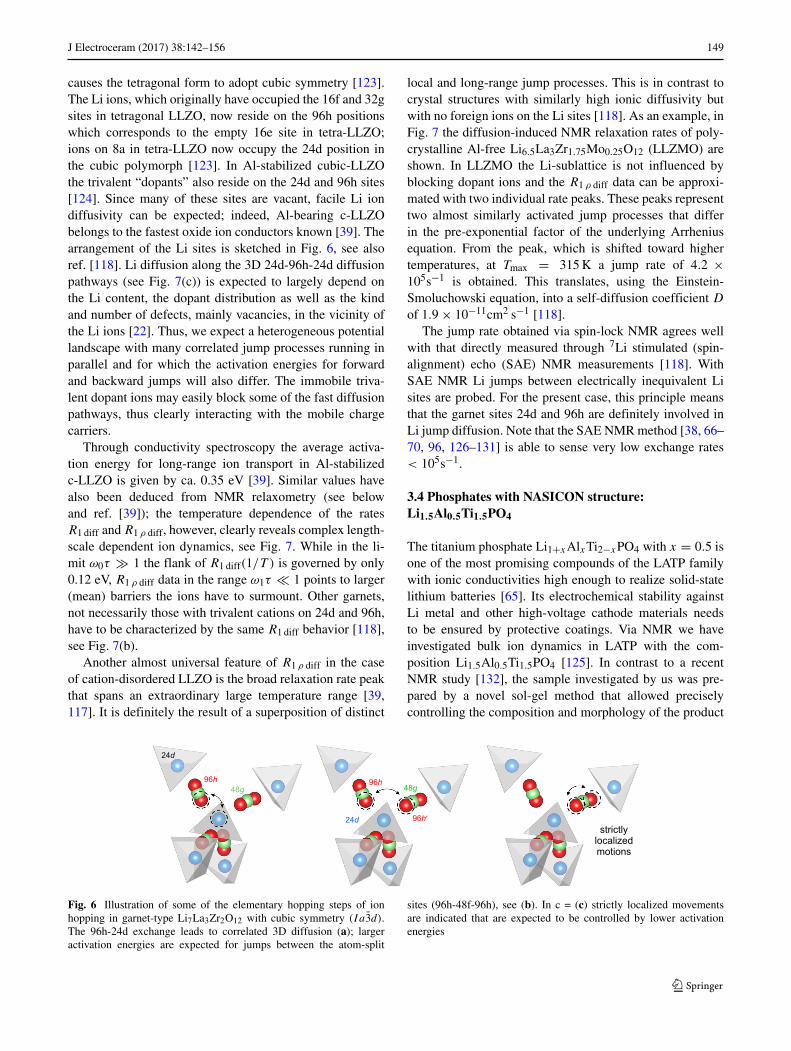
causes the tetragonal form to adopt cubic symmetry [123].The Li ions, which originally have occupied the 16f and 32gsites in tetragonal LLZO, now reside on the 96h positionswhich corresponds to the empty 16e site in tetra-LLZO;ions on 8a in tetra-LLZO now occupy the 24d position inthe cubic polymorph [123]. In Al-stabilized cubic-LLZOthe trivalent “dopants” also reside on the 24d and 96h sites[124]. Since many of these sites are vacant, facile Li iondiffusivity can be expected; indeed, Al-bearing c-LLZObelongs to the fastest oxide ion conductors known [39]. Thearrangement of the Li sites is sketched in Fig. 6, see alsoref. [118]. Li diffusion along the 3D 24d-96h-24d diffusionpathways (see Fig. 7(c)) is expected to largely depend onthe Li content, the dopant distribution as well as the kindand number of defects, mainly vacancies, in the vicinity ofthe Li ions [22]. Thus, we expect a heterogeneous potentiallandscape with many correlated jump processes running inparallel and for which the activation energies for forwardand backward jumps will also differ. The immobile triva-lent dopant ions may easily block some of the fast diffusionpathways, thus clearly interacting with the mobile chargecarriers.
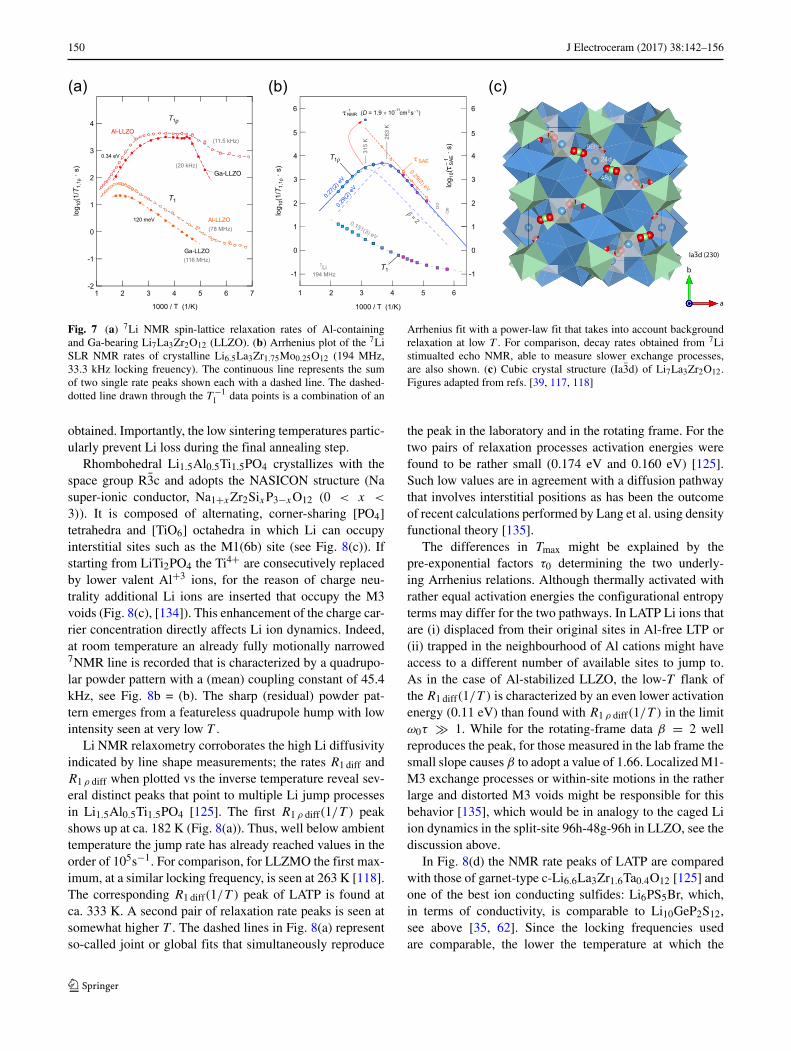
Through conductivity spectroscopy the average activa-tion energy for long-range ion transport in Al-stabilizedc-LLZO is given by ca. 0.35 eV [39]. Similar values havealso been deduced from NMR relaxometry (see belowand ref. [39]); the temperature dependence of the ratesR1 diff and R1 ρ diff, however, clearly reveals complex length-scale dependent ion dynamics, see Fig. 7. While in the li-mit ω0τ � 1 the flank of R1 diff(1/T ) is governed by only0.12 eV, R1 ρ diff data in the range ω1τ � 1 points to larger(mean) barriers the ions have to surmount. Other garnets,not necessarily those with trivalent cations on 24d and 96h,have to be characterized by the same R1 diff behavior [118],see Fig. 7(b).
Another almost universal feature of R1 ρ diff in the caseof cation-disordered LLZO is the broad relaxation rate peakthat spans an extraordinary large temperature range [39,117]. It is definitely the result of a superposition of distinct
local and long-range jump processes. This is in contrast tocrystal structures with similarly high ionic diffusivity butwith no foreign ions on the Li sites [118]. As an example, inFig. 7 the diffusion-induced NMR relaxation rates of poly-crystalline Al-free Li6.5La3Zr1.75Mo0.25O12 (LLZMO) areshown. In LLZMO the Li-sublattice is not influenced byblocking dopant ions and the R1 ρ diff data can be approxi-mated with two individual rate peaks. These peaks representtwo almost similarly activated jump processes that differin the pre-exponential factor of the underlying Arrheniusequation. From the peak, which is shifted toward highertemperatures, at Tmax = 315 K a jump rate of 4.2 ×10⁵s−1 is obtained. This translates, using the Einstein-Smoluchowski equation, into a self-diffusion coefficient D
of 1.9 × 10⁻¹¹cm2 s−1 [118].The jump rate obtained via spin-lock NMR agrees well
with that directly measured through 7Li stimulated (spin-alignment) echo (SAE) NMR measurements [118]. WithSAE NMR Li jumps between electrically inequivalent Lisites are probed. For the present case, this principle meansthat the garnet sites 24d and 96h are definitely involved inLi jump diffusion. Note that the SAE NMR method [38, 66–70, 96, 126–131] is able to sense very low exchange rates< 105s−1.
3.4 Phosphates with NASICON structure:Li1.5Al0.5Ti1.5PO4
The titanium phosphate Li1+xAlxTi2−xPO4 with x = 0.5 isone of the most promising compounds of the LATP familywith ionic conductivities high enough to realize solid-statelithium batteries [65]. Its electrochemical stability againstLi metal and other high-voltage cathode materials needsto be ensured by protective coatings. Via NMR we haveinvestigated bulk ion dynamics in LATP with the com-position Li1.5Al0.5Ti1.5PO4 [125]. In contrast to a recentNMR study [132], the sample investigated by us was pre-pared by a novel sol-gel method that allowed preciselycontrolling the composition and morphology of the product
24d
96h
48g
96h
96h
strictly
localized
motions
48g
24d
Fig. 6 Illustration of some of the elementary hopping steps of ionhopping in garnet-type Li7La3Zr2O12 with cubic symmetry (Ia3d).The 96h-24d exchange leads to correlated 3D diffusion (a); largeractivation energies are expected for jumps between the atom-split
sites (96h-48f-96h), see (b). In c = (c) strictly localized movementsare indicated that are expected to be controlled by lower activationenergies
150 J Electroceram (2017) 38:142–156
4
3
2
1
0
-1
-27654321
4
3
2
1
0
-1gol
10(1
/T1,
1 ρ· s
)
65431
0.27(2
) eV
0.151(3) eV
T1
7Li194 MHz
0.29(2) eV
= 2
T1
1000 / T (1/K)
2
4
3
2
1
0
-1
315
K 263
K
(gol
10EAS
)s·1
–SAE
0.29(2
) eV
5
6
5
6
gol10
(1/T
1,1 ρ
· s)
T1
T1
1000 / T (1/K)
(b)(a)NMR1 ( = 1.9 10 cm s )D 111 2
120 meV
0.34 eV96h
24d
48g
c
(c)
(116 MHz)
(11.5 kHz)
(20 kHz)
(78 MHz)
Fig. 7 (a) 7Li NMR spin-lattice relaxation rates of Al-containingand Ga-bearing Li7La3Zr2O12 (LLZO). (b) Arrhenius plot of the 7LiSLR NMR rates of crystalline Li6.5La3Zr1.75Mo0.25O12 (194 MHz,33.3 kHz locking freuency). The continuous line represents the sumof two single rate peaks shown each with a dashed line. The dashed-dotted line drawn through the T −1
1 data points is a combination of an
Arrhenius fit with a power-law fit that takes into account backgroundrelaxation at low T . For comparison, decay rates obtained from 7Listimualted echo NMR, able to measure slower exchange processes,are also shown. (c) Cubic crystal structure (Ia3d) of Li7La3Zr2O12.Figures adapted from refs. [39, 117, 118]
obtained. Importantly, the low sintering temperatures partic-ularly prevent Li loss during the final annealing step.
Rhombohedral Li1.5Al0.5Ti1.5PO4 crystallizes with thespace group R3c and adopts the NASICON structure (Nasuper-ionic conductor, Na1+xZr2SixP3−xO12 (0 < x <
3)). It is composed of alternating, corner-sharing [PO4]tetrahedra and [TiO6] octahedra in which Li can occupyinterstitial sites such as the M1(6b) site (see Fig. 8(c)). Ifstarting from LiTi2PO4 the Ti4+ are consecutively replacedby lower valent Al+3 ions, for the reason of charge neu-trality additional Li ions are inserted that occupy the M3voids (Fig. 8(c), [134]). This enhancement of the charge car-rier concentration directly affects Li ion dynamics. Indeed,at room temperature an already fully motionally narrowed7NMR line is recorded that is characterized by a quadrupo-lar powder pattern with a (mean) coupling constant of 45.4kHz, see Fig. 8b = (b). The sharp (residual) powder pat-tern emerges from a featureless quadrupole hump with lowintensity seen at very low T .
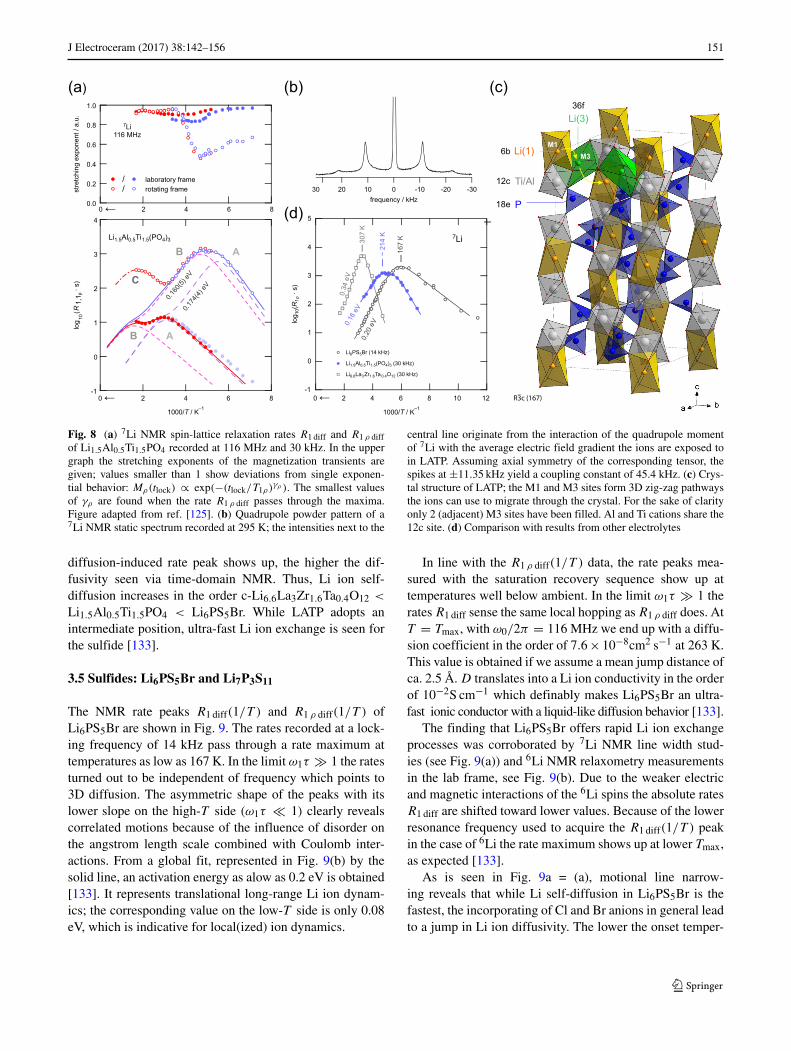
Li NMR relaxometry corroborates the high Li diffusivityindicated by line shape measurements; the rates R1 diff andR1 ρ diff when plotted vs the inverse temperature reveal sev-eral distinct peaks that point to multiple Li jump processesin Li1.5Al0.5Ti1.5PO4 [125]. The first R1 ρ diff(1/T ) peakshows up at ca. 182 K (Fig. 8(a)). Thus, well below ambienttemperature the jump rate has already reached values in theorder of 105s−1. For comparison, for LLZMO the first max-imum, at a similar locking frequency, is seen at 263 K [118].The corresponding R1 diff(1/T ) peak of LATP is found atca. 333 K. A second pair of relaxation rate peaks is seen atsomewhat higher T . The dashed lines in Fig. 8(a) representso-called joint or global fits that simultaneously reproduce
the peak in the laboratory and in the rotating frame. For thetwo pairs of relaxation processes activation energies werefound to be rather small (0.174 eV and 0.160 eV) [125].Such low values are in agreement with a diffusion pathwaythat involves interstitial positions as has been the outcomeof recent calculations performed by Lang et al. using densityfunctional theory [135].
The differences in Tmax might be explained by thepre-exponential factors τ0 determining the two underly-ing Arrhenius relations. Although thermally activated withrather equal activation energies the configurational entropyterms may differ for the two pathways. In LATP Li ions thatare (i) displaced from their original sites in Al-free LTP or(ii) trapped in the neighbourhood of Al cations might haveaccess to a different number of available sites to jump to.As in the case of Al-stabilized LLZO, the low-T flank ofthe R1 diff(1/T ) is characterized by an even lower activationenergy (0.11 eV) than found with R1 ρ diff(1/T ) in the limitω0τ � 1. While for the rotating-frame data β = 2 wellreproduces the peak, for those measured in the lab frame thesmall slope causes β to adopt a value of 1.66. Localized M1-M3 exchange processes or within-site motions in the ratherlarge and distorted M3 voids might be responsible for thisbehavior [135], which would be in analogy to the caged Liion dynamics in the split-site 96h-48g-96h in LLZO, see thediscussion above.
In Fig. 8(d) the NMR rate peaks of LATP are comparedwith those of garnet-type c-Li6.6La3Zr1.6Ta0.4O12 [125] andone of the best ion conducting sulfides: Li6PS5Br, which,in terms of conductivity, is comparable to Li10GeP2S12,see above [35, 62]. Since the locking frequencies usedare comparable, the lower the temperature at which the
J Electroceram (2017) 38:142–156 151
5
4
3
2
1
0
-1
gol10
(R1ρ
· s)
12108642016
7 K
~ 21
4 K
307
K
0.16
eV
0.20
eV
0.34
eV
Li1.5Al0.5Ti1.5(PO4)3 (30 kHz)
Li6.6La3Zr1.6Ta 0.4O12 (30 kHz)
Li6PS5Br (14 kHz)
7Li
4
3
2
1
0
-1
gol10
(R1,
1 ρ· s
)
86420
1000/T / K–1
Li1.5Al0.5Ti1.5(PO4)3
0.174
(4) eV
0.160
(5) eV
AB
C
1.0
0.8
0.6
0.4
0.2
0.0
.u.a/tnenopxegnihcterts
86420
/ laboratory frame/ rotating frame
7Li116 MHz
←
←1000/T / K–1
←
AB
(b)(a)
(d)30 20 10 0 -10 -20 -30
frequency / kHz
Li(1)
Ti/Al
P
6b
12c
18e
3)(iL
M1M3
36f
(c)
Fig. 8 (a) 7Li NMR spin-lattice relaxation rates R1 diff and R1 ρ diffof Li1.5Al0.5Ti1.5PO4 recorded at 116 MHz and 30 kHz. In the uppergraph the stretching exponents of the magnetization transients aregiven; values smaller than 1 show deviations from single exponen-tial behavior: Mρ(tlock) ∝ exp(−(tlock/T1ρ)γρ ). The smallest valuesof γρ are found when the rate R1 ρ diff passes through the maxima.Figure adapted from ref. [125]. (b) Quadrupole powder pattern of a7Li NMR static spectrum recorded at 295 K; the intensities next to the
central line originate from the interaction of the quadrupole momentof 7Li with the average electric field gradient the ions are exposed toin LATP. Assuming axial symmetry of the corresponding tensor, thespikes at ±11.35 kHz yield a coupling constant of 45.4 kHz. (c) Crys-tal structure of LATP; the M1 and M3 sites form 3D zig-zag pathwaysthe ions can use to migrate through the crystal. For the sake of clarityonly 2 (adjacent) M3 sites have been filled. Al and Ti cations share the12c site. (d) Comparison with results from other electrolytes
diffusion-induced rate peak shows up, the higher the dif-fusivity seen via time-domain NMR. Thus, Li ion self-diffusion increases in the order c-Li6.6La3Zr1.6Ta0.4O12 <
Li1.5Al0.5Ti1.5PO4 < Li6PS5Br. While LATP adopts anintermediate position, ultra-fast Li ion exchange is seen forthe sulfide [133].
3.5 Sulfides: Li6PS5Br and Li7P3S11
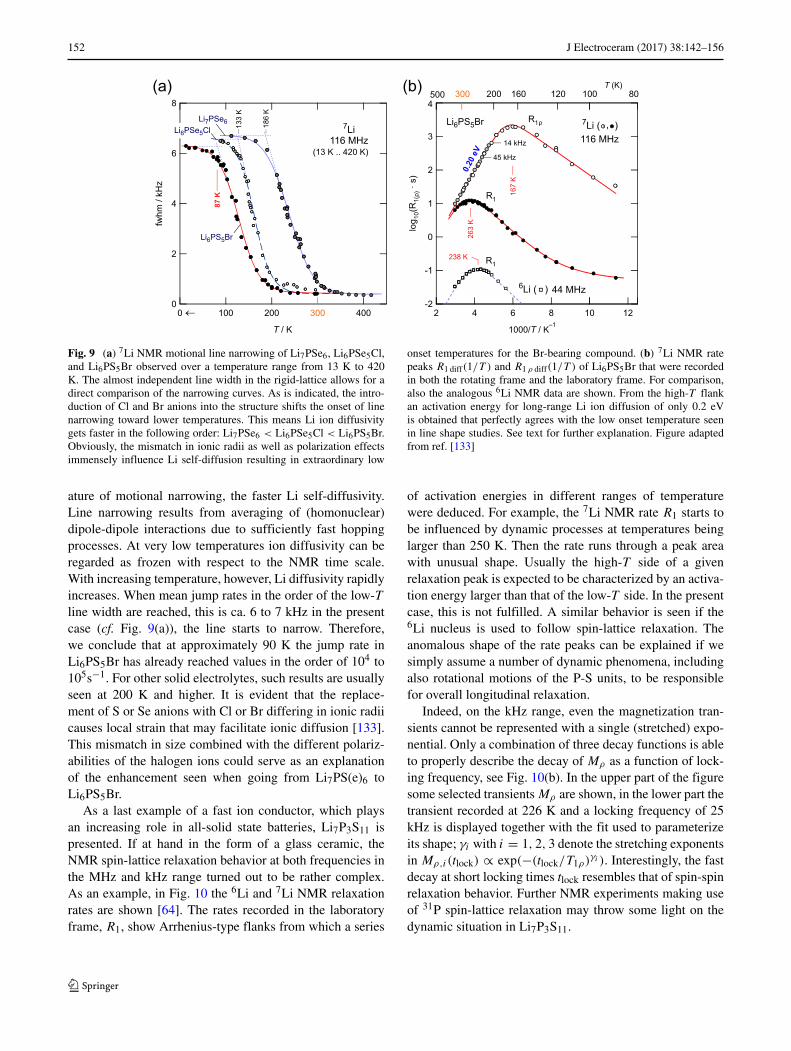
The NMR rate peaks R1 diff(1/T ) and R1 ρ diff(1/T ) ofLi6PS5Br are shown in Fig. 9. The rates recorded at a lock-ing frequency of 14 kHz pass through a rate maximum attemperatures as low as 167 K. In the limit ω1τ � 1 the ratesturned out to be independent of frequency which points to3D diffusion. The asymmetric shape of the peaks with itslower slope on the high-T side (ω1τ � 1) clearly revealscorrelated motions because of the influence of disorder onthe angstrom length scale combined with Coulomb inter-actions. From a global fit, represented in Fig. 9(b) by thesolid line, an activation energy as alow as 0.2 eV is obtained[133]. It represents translational long-range Li ion dynam-ics; the corresponding value on the low-T side is only 0.08eV, which is indicative for local(ized) ion dynamics.
In line with the R1 ρ diff(1/T ) data, the rate peaks mea-sured with the saturation recovery sequence show up attemperatures well below ambient. In the limit ω1τ � 1 therates R1 diff sense the same local hopping as R1 ρ diff does. AtT = Tmax, with ω0/2π = 116 MHz we end up with a diffu-sion coefficient in the order of 7.6 × 10⁻⁸cm2 s−1 at 263 K.This value is obtained if we assume a mean jump distance ofca. 2.5 A. D translates into a Li ion conductivity in the orderof 10−2S cm−1 which definably makes Li6PS5Br an ultra-fast ionic conductor with a liquid-like diffusion behavior [133].
The finding that Li6PS5Br offers rapid Li ion exchangeprocesses was corroborated by 7Li NMR line width stud-ies (see Fig. 9(a)) and 6Li NMR relaxometry measurementsin the lab frame, see Fig. 9(b). Due to the weaker electricand magnetic interactions of the 6Li spins the absolute ratesR1 diff are shifted toward lower values. Because of the lowerresonance frequency used to acquire the R1 diff(1/T ) peakin the case of 6Li the rate maximum shows up at lower Tmax,as expected [133].
As is seen in Fig. 9a = (a), motional line narrow-ing reveals that while Li self-diffusion in Li6PS5Br is thefastest, the incorporating of Cl and Br anions in general leadto a jump in Li ion diffusivity. The lower the onset temper-
152 J Electroceram (2017) 38:142–156
8
6
4
2
0
/z
Hkmh
wf
4003002001000
T / K
7LiHM z611
Li e7 6PSLi e Cl6 5PS
Li6PS5Br
87 K
133
K
186
K
(13 K .. 420 K)
4
3
2
1
0
-1
-2
gol10
(R1(
ρ )· s
)
12108642
300 200 160 120 100 80500T (K)
7Li ( .R1ρ
R1
R1
)
6Li ( .) HM z44
HM z611,Li6PS5Br
263
K
238 K
0.20
eV
14 kHz
45 kHz
1000/T / K–1
167
K
(b)(a)
Fig. 9 (a) 7Li NMR motional line narrowing of Li7PSe6, Li6PSe5Cl,and Li6PS5Br observed over a temperature range from 13 K to 420K. The almost independent line width in the rigid-lattice allows for adirect comparison of the narrowing curves. As is indicated, the intro-duction of Cl and Br anions into the structure shifts the onset of linenarrowing toward lower temperatures. This means Li ion diffusivitygets faster in the following order: Li7PSe6 < Li6PSe5Cl < Li6PS5Br.Obviously, the mismatch in ionic radii as well as polarization effectsimmensely influence Li self-diffusion resulting in extraordinary low
onset temperatures for the Br-bearing compound. (b) 7Li NMR ratepeaks R1 diff(1/T ) and R1 ρ diff(1/T ) of Li6PS5Br that were recordedin both the rotating frame and the laboratory frame. For comparison,also the analogous 6Li NMR data are shown. From the high-T flankan activation energy for long-range Li ion diffusion of only 0.2 eVis obtained that perfectly agrees with the low onset temperature seenin line shape studies. See text for further explanation. Figure adaptedfrom ref. [133]
ature of motional narrowing, the faster Li self-diffusivity.Line narrowing results from averaging of (homonuclear)dipole-dipole interactions due to sufficiently fast hoppingprocesses. At very low temperatures ion diffusivity can beregarded as frozen with respect to the NMR time scale.With increasing temperature, however, Li diffusivity rapidlyincreases. When mean jump rates in the order of the low-Tline width are reached, this is ca. 6 to 7 kHz in the presentcase (cf. Fig. 9(a)), the line starts to narrow. Therefore,we conclude that at approximately 90 K the jump rate inLi6PS5Br has already reached values in the order of 104 to105s−1. For other solid electrolytes, such results are usuallyseen at 200 K and higher. It is evident that the replace-ment of S or Se anions with Cl or Br differing in ionic radiicauses local strain that may facilitate ionic diffusion [133].This mismatch in size combined with the different polariz-abilities of the halogen ions could serve as an explanationof the enhancement seen when going from Li7PS(e)6 toLi6PS5Br.
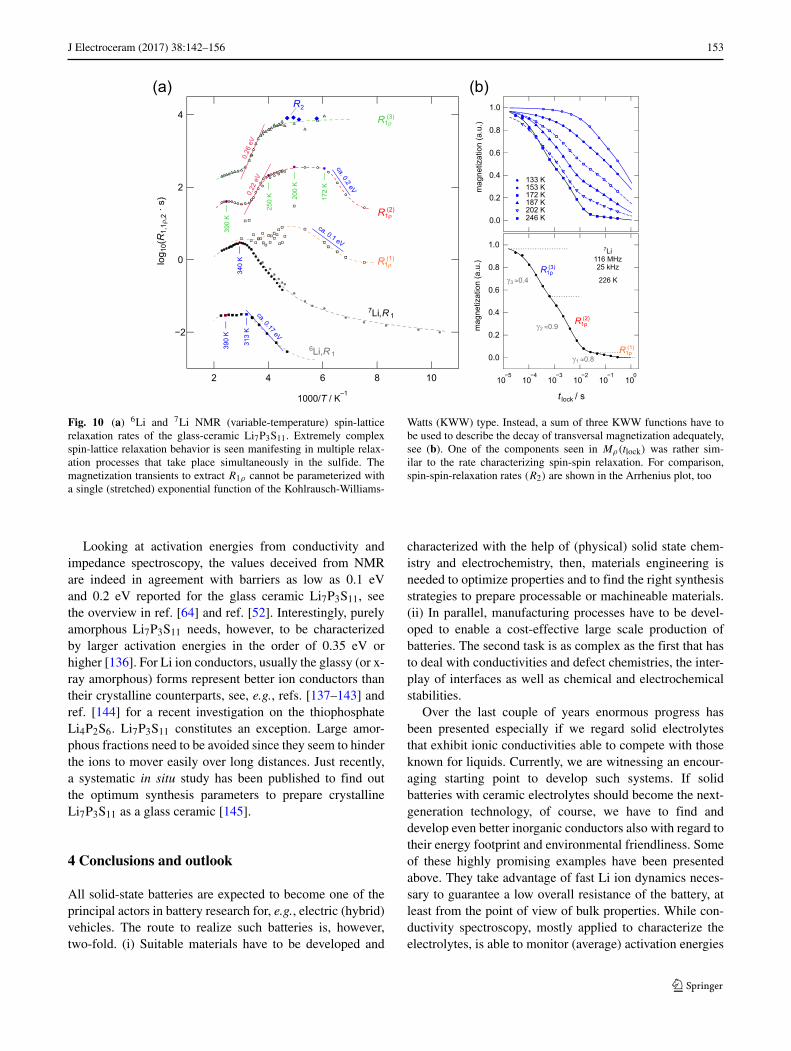
As a last example of a fast ion conductor, which playsan increasing role in all-solid state batteries, Li7P3S11 ispresented. If at hand in the form of a glass ceramic, theNMR spin-lattice relaxation behavior at both frequencies inthe MHz and kHz range turned out to be rather complex.As an example, in Fig. 10 the 6Li and 7Li NMR relaxationrates are shown [64]. The rates recorded in the laboratoryframe, R1, show Arrhenius-type flanks from which a series
of activation energies in different ranges of temperaturewere deduced. For example, the 7Li NMR rate R1 starts tobe influenced by dynamic processes at temperatures beinglarger than 250 K. Then the rate runs through a peak areawith unusual shape. Usually the high-T side of a givenrelaxation peak is expected to be characterized by an activa-tion energy larger than that of the low-T side. In the presentcase, this is not fulfilled. A similar behavior is seen if the6Li nucleus is used to follow spin-lattice relaxation. Theanomalous shape of the rate peaks can be explained if wesimply assume a number of dynamic phenomena, includingalso rotational motions of the P-S units, to be responsiblefor overall longitudinal relaxation.
Indeed, on the kHz range, even the magnetization tran-sients cannot be represented with a single (stretched) expo-nential. Only a combination of three decay functions is ableto properly describe the decay of Mρ as a function of lock-ing frequency, see Fig. 10(b). In the upper part of the figuresome selected transients Mρ are shown, in the lower part thetransient recorded at 226 K and a locking frequency of 25kHz is displayed together with the fit used to parameterizeits shape; γi with i = 1, 2, 3 denote the stretching exponentsin Mρ,i(tlock) ∝ exp(−(tlock/T1ρ)γi ). Interestingly, the fastdecay at short locking times tlock resembles that of spin-spinrelaxation behavior. Further NMR experiments making useof 31P spin-lattice relaxation may throw some light on thedynamic situation in Li7P3S11.
J Electroceram (2017) 38:142–156 153
)s·(
gol2,
1,101R
0.26
eV
0.22
eV
ca. 0.1 eV
4
2
0
−2
108642
1.0
Ve7
.ac
R1(1)
R1(2)
R1(3)
R2
Ve.0 2
.ac
340
K
172
K
313
K
71Li,R
61Li,R
250
K 200
K
09K
339
0 K
1.0
0.8
0.6
0.4
0.2
0.0
u.).
a(noitazitenga
m
10−5
10−4
10−3
10−2
10−1
100
t lock / s
R1ρ(1)
R1ρ2)(
R1ρ3)(
7LiHM z611
25 kHz
1 0.8
2 0.9
3 0.4 226 K
133 K153 K172 K187 K202 K246 K
u.).
a(noitazitenga
m
1.0
0.8
0.6
0.4
0.2
0.0
1000/T / K–1
(a) (b)
Fig. 10 (a) 6Li and 7Li NMR (variable-temperature) spin-latticerelaxation rates of the glass-ceramic Li7P3S11. Extremely complexspin-lattice relaxation behavior is seen manifesting in multiple relax-ation processes that take place simultaneously in the sulfide. Themagnetization transients to extract R1ρ cannot be parameterized witha single (stretched) exponential function of the Kohlrausch-Williams-
Watts (KWW) type. Instead, a sum of three KWW functions have tobe used to describe the decay of transversal magnetization adequately,see (b). One of the components seen in Mρ(tlock) was rather sim-ilar to the rate characterizing spin-spin relaxation. For comparison,spin-spin-relaxation rates (R2) are shown in the Arrhenius plot, too
Looking at activation energies from conductivity andimpedance spectroscopy, the values deceived from NMRare indeed in agreement with barriers as low as 0.1 eVand 0.2 eV reported for the glass ceramic Li7P3S11, seethe overview in ref. [64] and ref. [52]. Interestingly, purelyamorphous Li7P3S11 needs, however, to be characterizedby larger activation energies in the order of 0.35 eV orhigher [136]. For Li ion conductors, usually the glassy (or x-ray amorphous) forms represent better ion conductors thantheir crystalline counterparts, see, e.g., refs. [137–143] andref. [144] for a recent investigation on the thiophosphateLi4P2S6. Li7P3S11 constitutes an exception. Large amor-phous fractions need to be avoided since they seem to hinderthe ions to mover easily over long distances. Just recently,a systematic in situ study has been published to find outthe optimum synthesis parameters to prepare crystallineLi7P3S11 as a glass ceramic [145].
4 Conclusions and outlook
All solid-state batteries are expected to become one of theprincipal actors in battery research for, e.g., electric (hybrid)vehicles. The route to realize such batteries is, however,two-fold. (i) Suitable materials have to be developed and
characterized with the help of (physical) solid state chem-istry and electrochemistry, then, materials engineering isneeded to optimize properties and to find the right synthesisstrategies to prepare processable or machineable materials.(ii) In parallel, manufacturing processes have to be devel-oped to enable a cost-effective large scale production ofbatteries. The second task is as complex as the first that hasto deal with conductivities and defect chemistries, the inter-play of interfaces as well as chemical and electrochemicalstabilities.
Over the last couple of years enormous progress hasbeen presented especially if we regard solid electrolytesthat exhibit ionic conductivities able to compete with thoseknown for liquids. Currently, we are witnessing an encour-aging starting point to develop such systems. If solidbatteries with ceramic electrolytes should become the next-generation technology, of course, we have to find anddevelop even better inorganic conductors also with regard totheir energy footprint and environmental friendliness. Someof these highly promising examples have been presentedabove. They take advantage of fast Li ion dynamics neces-sary to guarantee a low overall resistance of the battery, atleast from the point of view of bulk properties. While con-ductivity spectroscopy, mostly applied to characterize theelectrolytes, is able to monitor (average) activation energies
154 J Electroceram (2017) 38:142–156
from a rather macroscopic view, NMR may assist in speci-fying the underling rules that determine fast ion movements.Thanks to its atomic-scale point of view local barriers canbe characterized and assigned to the elementary steps ofLi+ hopping. The results obtained need to be comparedwith those from computational chemistry to allow for ameaningful interpretation. Of course, in many cases NMRis also able to provide valuable structural information, e.g.,as a function of state of charge or ageing processes, tocomplement our understanding of solid electrolytes.
Acknowledgments Open access funding provided by Graz Univer-sity of Technology. We thank the Deutsche Forschungsgemeinschaftfor any support (FOR 1277, Mobility of Lithium Ions in Solids). More-over, financial support by the Austrian Federal Ministry of Science,Research and Economy, and the Austrian National Foundation forResearch, Technology and Development (CD-Laboratory of LithiumBatteries: Ageing Effects, Technology and New Materials) is greatlyappreciated.
Open Access This article is distributed under the terms of theCreative Commons Attribution 4.0 International License (http://creativecommons.org/licenses/by/4.0/), which permits unrestricteduse, distribution, and reproduction in any medium, provided you giveappropriate credit to the original author(s) and the source, provide alink to the Creative Commons license, and indicate if changes were made.
References
1. J.M. Tarascon, Chem. Sus. Chem. 1, 777 (2008)2. R. van Noorden, Nature 507, 26 (2014)3. M.S. Whittingham, Chem. Rev. 104, 4271 (2004)4. M. Armand, J.M. Tarascon, Nature 451, 652 (2008)5. P.G. Bruce, B. Scrosati, J.M. Tarascon, Angew. Chem. Int. Ed.
47, 2930 (2008)6. B.L. Ellis, K.T. Lee, L.F. Nazar, Chem. Mater. 22(3), 691 (2010)7. J.B. Goodenough, Y. Kim, Chem. Mater. 22(3), 587 (2010)8. B. Dunn, H. Kamath, J.M. Tarascon, Science 334, 928 (2011)9. Z. Yang, J. Zhang, M.C.W. Kintner-Meyer, X. Lu, D. Choi, J.P.
Lemmon, J. Liu, Chem. Rev. 111(5), 3577 (2011)10. F. Cheng, J. Liang, Z. Tao, J. Chen, Adv. Mater 23(15), 1695
(2011)11. H. Li, Z. Wang, L. Chen, X. Huang, Adv. Mater. 21(45), 4593
(2009)12. M.R. Palacin, Chem. Soc. Rev. 38, 2565 (2009)13. M. Wakihara, Mater. Sci. Engin. Rep. 33, 109 (2001)14. C.M. Park, J.H. Kim, H. Kim, H.J. Sohn, Chem. Soc. Rev. 39,
3115 (2010)15. M. Winter, J.O. Besenhard, Electrochem. Acta. 45, 31 (1999)16. N. Nitta, F. Wu, J.T. Lee, G. Yushin, Mater. Today 18(5), 252
(2015)17. M. Winter, J. Besenhard, M. Spahr, P. Novak, Adv. Mater.
10(10), 725 (1998)18. V. Epp, M. Wilkening, Handbook of Solid State Batteries (World
Scientific, Singapore, 2015), chap. Li ion dynamics in solids asseen via relaxation NMR
19. V. Tangadurai, S. Narayanan, D. Pinzaru, Chem. Soc. Rev. 43,4714 (2014)
20. J.C. Bachman, S. Muy, A. Grimaud, H.H. Chang, N. Pour, S.F.Lux, O. Paschos, F. Maglia, S. Lupart, P. Lamp, L. Giordano, Y.Shao-Horn, Chem. Rev. 116(1), 140 (2016)
21. F. Mizuno, C. Yada, H. Iba. in Lithium-Ion Batteries, ed. by G.Pistoia (Elsevier, Amsterdam, 2014), pp. 273–291
22. V. Thangadurai, D. Pinzaru, S. Narayanan, A.K. Baral, J. Phys,Chem. Lett. 6(2), 292 (2015)
23. M. Tatsumisago, M. Nagao, A. Hayashi, J. Asian Ceram. Soc.1(1), 17 (2013)
24. K. Takada, Acta Mater. 61(3), 759 (2013)25. J. Bates, N. Dudney, B. Neudecker, A. Ueda, C. Evans, Solid
State Ion 135, 33 (2000)26. L. Jin, X. Junyi, L. Yue, L. Jie, L. Yanqing, Y. Changfu, Z. Jin,
Z. Kai, Acta Chim. Sinica. 71(6), 869 (2013)27. S. Jie, W. Qihui, D. Quanfeng, Z. Mingsen, W. Suntao, S.
Shigang, Progr. Chem. 19(1), 66 (2007)28. J.G. Kim, B. Son, S. Mukherjee, N. Schuppert, A. Bates, O.
Kwon, M.J. Choi, H.Y. Chung, S. Park, J. Power Sources 282,299 (2015)
29. P.H.L. Notten, F. Roozeboom, R.A.H. Niessen, L. Baggetto, Adv.Mater. 19(24), 4564 (2007)
30. L. Baggetto, R.A.H. Niessen, F. Roozeboom, P.H.L. Notten, Adv.Funct. Mater. 18(7), 1057 (2008)
31. E. Quartarone, P. Mustarelli, Chem. Soc. Rev. 40(5), 2525 (2011)32. M.A.K.L. Dissanayake, M.A. Careem, P.W.S.K. Bandaranayake,
C.N. Wijayasekera, Solid State Ion. 48, 277 (1991)33. H.Y.P. Hong, Mater. Res. Bull. 13, 117 (1978)34. J.L. Briant, J. Electrochem. Soc. 128, 1830 (1981)35. N. Kamaya, K. Homma, Y. Yamakawa, M. Hirayama, R. Kanno,
M. Yonemura, T. Kamiyama, Y. Kato, S. Hama, K. Kawamoto,A. Mitsui, Nature Mater. 10, 682 (2011)
36. U. von Alpen, M.F. Bell, T. Gladden, Electrochim. Acta 24, 741(1979)
37. T. Lapp, S. Skaarup, A. Hooper, Solid State Ion 11, 97 (1983)38. A. Kuhn, S. Narayanan, L. Spencer, G. Goward, V. Thangadurai,
M. Wilkening, Phys. Rev. B 83, 094302 (2011)39. H. Buschmann, J. Dolle, S. Berendts, A. Kuhn, P. Bottke, M.
Wilkening, P. Heitjans, A. Senyshyn, H. Ehrenberg, A. Lotnyk,V. Duppel, L. Kienle, J. Janek, Phys. Chem. Chem. Phys. 13,19378 (2011)
40. D. Rettenwander, G. Redhammer, F. Preishuber-Pflugl, L.Cheng, L. Miara, R. Wagner, A. Welzl, E. Suard, M.M. Doeff,M. Wilkening, J. Fleig, G. Amthauer, Chem. Mater. 28(7), 2384(2016)
41. K.H. Joo, P. Vinatier, B. Pecquenard, A. Levasseur, H.J. Sohn,Solid State Ion. 160, 51 (2003)
42. X. Yu, J.B. Bates, G.E. Jellison, F.X. Hart, J. Electrochem. Soc.144, 524 (1997)
43. F. Croce, G.B. Appetecchi, L. Persi, B. Scrosati, Nature 394, 456(1998)
44. H. Saruwatari, T. Kuboki, T. Kishi, S. Mikoshiba, N. Takami, J.Power Sources 195, 1495 (2010)
45. P.E. Stallworth, J.J. Fontanella, M.C. Wintersgill, C.D. Scheidler,J.J. Immel, S.G. Greenbaum, A.S. Gozdz, J. Power Sources 81-82, 739 (1999)
46. J.Y. Song, Y.Y. Wang, C.C. Wan, J. Electrochem. Soc. 147, 3219(2000)
47. R. Kanno, M. Murayama, J. Electrochem. Soc. 148(7), A742(2001)
48. S. Kondo, K. Takada, Y. Yamamura, Solid State Ion 53-56, 1183(1992)
49. Y. Kawakami, H. Ikuta, T. Uchida, M. Wakihara, Thermochim.Acta 299, 7 (1997)
50. J.H. Kennedy, Z. Zhang, Solid State Ion 2830, 726 (1988)51. F. Mizuno, A. Hayashi, K. Tadanaga, M. Tatsumisago, Adv.
Mater. 17, 918 (2005)52. Y. Seino, T. Ota, K. Takada, A. Hayashi, M. Tatsumisago, Energy
Environ. Sci. 7, 627 (2014)53. P. Bron, S. Johansson, K. Zick, J.S. auf der Gunne, S. Dehnen,
B. Roling, J. Am. Ceram. Soc. 135(42), 15694 (2013)
J Electroceram (2017) 38:142–156 155
54. Y.W. Hu, I.D. Raistrick, R.A. Huggins, J. Electrochem. Soc. 124,1240 (1977)
55. N. Imanaka, T. Shimizu, G. Adachi, Solid State Ion 62, 167(1993)
56. Y. Tomita, H. Ohki, K. Yamada, T. Okuda, Solid State Ion136137, 351 (2000)
57. Y. Inaguma, C. Liquan, M. Itoh, T. Nakamura, T. Uchida, H.Ikuta, M. Wakihara, Solid State Commun. 86, 689 (1993)
58. P. Knauth, Solid State Ion 180, 911 (2009)59. J.W. Fergus, J. Power Sources 195(15), 4554 (2010)60. D.A. Weber, A. Senyshyn, K.S. Weldert, S. Wenzel, W. Zhang,
R. Kaiser, S. Berendts, J. Janek, W.G. Zeier, Chem. Mater.28(16), 5905 (2016)
61. I.H. Chu, H. Nguyen, S. Hy, Y.C. Lin, Z. Wang, Z. Xu, Z. Deng,Y.S. Meng, S.P. Ong, A.C.S. Appl, Mater. Interfac. 8(12), 7843(2016)
62. H.J. Deiseroth, S.T. Kong, H. Eckert, J. Vannahme, C. Reiner, T.Zaiss, M. Schlosser, Angew. Chem. Int. Ed. 47, 755 (2008)
63. R. Murugan, V. Thangadurai, W. Weppner, Angew. Chem. Int.Ed. 46, 7778 (2007)
64. D. Wohlmuth, V. Epp, M. Wilkening, ChemPhysChem. 16(12),2582 (2015)
65. S. Breuer, D. Prutsch, Q. Ma, V. Epp, F. Preishuber-Pflugl, F.Tietz, M. Wilkening, J. Mater. Chem. A 3, 21343 (2015)
66. M. Wilkening, P. Heitjans, ChemPhysChem. 13, 53 (2012)67. R. Bohmer, K. Jeffrey, M. Vogel, Prog. Nucl. Magn. Reson.
Spectrosc. 50, 87 (2007)68. B. Ruprecht, M. Wilkening, R. Uecker, P. Heitjans, Phys. Chem.
Chem. Phys 14, 11974 (2012)69. M. Wilkening, P. Heitjans, J. Phys, Condens. Matter. 18, 9849
(2006)70. M. Wilkening, P. Heitjans, Phys. Rev. B 77, 024311 (2008)71. M. Wilkening, J. Heine, C. Lyness, A.R. Armstrong, P.G. Bruce,
Phys. Rev. B 80, 064302 (2009)72. M. Wilkening, A. Kuhn, P. Heitjans, Phys. Rev. B 78, 054303
(2008)73. M. Wilkening, C. Lyness, A.R. Armstrong, P.G. Bruce, J. Phys.
Chem. C 113, 4741 (2009)74. A. Kuhn, P. Sreeraj, R. Pottgen, H.D. Wiemhofer, M. Wilkening,
P. Heitjans, J. Am. Chem. Soc. 133, 11018 (2011)75. P. Heitjans, S. Indris, J. Phys. Condens. Matter. 15(30), R1257
(2003)76. J. Jamnik, J. Maier, Phys. Chem. Chem. Phys. 5, 5215 (2003)77. J. Maier, Phys. Chem. Chem. Phys 11, 3011 (2009)78. C.-L. Tsai, V. Roddatis, C.V. Chandran, Q. Ma, S. Uhlenbruck,
Bram M., Heitjans P., O. Guillon, ACS Appl. Mater. Interfaces8(16), 10617 (2016)
79. Y. Iriyama, Z. Ogumi, Handbook of Solid State Batteries(World Scientific, Singapore, 2015), chap. Solid Electrode-Inorganic Solid Electrolyte Interface for Advanced All-Solid-State Rechargeable Lithium Batteries
80. M.R. Busche, T. Drossel, T. Leichtweiss, D.A. Weber, M. Falk,M. Schneider, M.-L. Reich, H. Sommer, P. Adelhelm, J. Janek,Nature Chem. 8(5), 426 (2016)
81. S. Wenzel, S. Randau, T. Leichtweiß, D.A. Weber, J. Sann, W.G.Zeier, J. Janek, Chem. Mater. 28(7), 2400 (2016)
82. Y. Zhu, X. He, Y. Mo, J. Mater. Chem. A 4, 3253 (2016)83. W.D. Richards, L.J. Miara, Y. Wang, J.C. Kim, G. Ceder, Chem.
Mater. 28(1), 266 (2016)84. Y. Zhu, X. He, Y. Mo, ACS Appl. Mater. Interfaces 7(42), 23685
(2015)85. X. Han, Y. Gong, K. Fu, X. He, G.T. Hitz, J. Dai, A. Pearse,
B. Liu, H. Wang, G. Rubloff, Y. Mo, V. Thangadurai, E.D.Wachsman, L. Hu, Nature Mater. pp. in press, doi:10.1038/nmat4821 (2016)
86. K. Takada, Handbook of Solid State Batteries (World Scientific,Singapore, 2015), chap. Interface of 4 V Cathodes with SulfideElectrolytes
87. M. Gellert, K.I. Gries, J. Sann, E. Pfeifer, K. Volz, B. Roling,Solid State Ion 287, 8 (2016)
88. W.E. Tenhaeff, E. Rangasamy, Y. Wang, A.P. Sokolov, J.Wolfenstine, J. Sakamoto, N.J. Dudney, ChemElectroChem. 1,375 (2014)
89. K. Funke, Prog. Solid State Chem. 22, 111 (1993)90. K.L. Ngai, Comments Solid State Phys. 9, 141 (1980)91. K.L. Ngai, J. de Physique IV 2, C2 61 (1992)92. M. Wilkening, V. Epp, A. Feldhoff, P. Heitjans, J. Phys. Chem.
C 112(25), 9291 (2008)93. K.L. Ngai, Phys. Rev. B 48, 13481 (1993)94. C. Leon, M.L. Lucıa, J. Santamarıa, M.A. Parıs, J. Sanz, A.
Varez, Phys. Rev. B 54, 184 (1996)95. I. Svare, F. Borsa, D.R. Torgeson, S.W. Martin, Phys. Rev. B 48,
9336 (1993)96. M. Wilkening, W. Kuchler, P. Heitjans, Phys. Rev. Lett. 97,
065901 (2006)97. P. Heitjans, A. Schirmer, S. Indris, in Diffusion in Conden-
sed Matter – Methods, Materials, Models. 2nd edn, ed. by P.Heitjans, J. Krger (Springer, Berlin, 2005), pp. 369–415
98. E. Fukushima, S. Roeder, Experimental Pulse NMR (Addison-Wesley, Reading, 1981)
99. N. Bloembergen, E.M. Purcell, R.V. Pound, Phys. Rev. 73, 679(1948)
100. A. Bunde, W. Dieterich, P. Maass, M. Meyer, in Diffusion in Con-densed Matter – Methods, Materials, Models. 2nd edn, ed. by P.Heitjans, J. Krger (Springer, Berlin, 2005), pp. 813–856
101. E. Goebel, W. Muller-Warmuth, H. Olyschlager, H. Dutz, J.Magn. Res. 36, 371 (1979)
102. D.C. Ailion, C.P. Slichter, Phys. Rev. 137, A235 (1965)103. D.C. Look, I.J. Lowe, J. Chem. Phys. 44, 2995 (1966)104. C.P. Slichter, D. Ailion, Phys. Rev. 135, A1099 (1964)105. D. Wolf, Phys. Rev. B 10, 2724 (1974)106. T.J. Rowland, F.Y. Fradin, Phys. Rev. 182, 760 (1969)107. A. Kuhn, M. Kunze, P. Sreeraj, H.D. Wiemhofer, V. Thangadurai,
M. Wilkening, P. Heitjans, Solid State Nucl. Magn. Res. 42, 2(2012)
108. A. Soloninin, A. Skripov, A. Buzlukov, A. Stepanov, J. SolidState Chem. 182(9), 2357 (2009)
109. R.L. Corey, D.T. Shane, R.C. Bowman, M.S. Conradi, J. Phys.Chem. C 112, 19784 (2008)
110. K. Takahashi, K. Hattori, T. Yamazaki, M.M.K. Takada, S.Orimo, H. Maekawa, H. Takamura, J. Power Sources 226, 61(2013)
111. D. Sveinbjornsson, A.S. Christiansen, R. Viskinde, P. Norby, T.Vegge, J. Electrochem. Soc. 161(9), A1432 (2014)
112. M. Matsuo, H. Takamura, H. Maekawa, H. Li, S. Orimo, Appl.Phys. Lett. 94, 084103 (2009)
113. H. Maekawa, M. Matsuo, H. Takamura, M. Ando, Y. Noda, T.Karahashi, S. Orimo, J. Am. Chem. Soc. 131, 894 (2009)
114. A.F. McDowell, C.F. Mendelsohn, M.S. Conradi, R.C. Bowman,A.J. Maeland, Phys. Rev. B 51, 6336 (1995)
115. P.M. Richards, in Topics in Current Physics, ed. by M.B.Salamon, Vol. 15 (Springer, Berlin, p. 1979)
116. V. Epp, M. Wilkening, Phys. Rev. B 82, 020301 (2010)117. R. Wagner, G.J. Redhammer, D. Rettenwander, A. Senyshyn, W.
Schmidt, M. Wilkening, G. Amthauer, Chem. Mater. 28, 1861(2016)
118. P. Bottke, D. Rettenwander, W. Schmidt, G. Amthauer, M.Wilkening, Chem. Mater. 27, 6571 (2015)
119. J. Awaka, N. Kijima, H. Hayakawa, J. Akimoto, J. Solid StateChem. 182, 2046 (2009)
156 J Electroceram (2017) 38:142–156
120. J. Sakamoto, Handbook of Solid State Batteries (World Sci-entific, Singapore, 2015), chap. Super-ionic conducting oxideelectrolytes
121. D. Rettenwander, A. Welzl, L. Cheng, J. Fleig, M. Musso,E. Suard, M.M. Doeff, G.J. Redhammer, G. Amthauer, Inorg.Chem. 54(21), 10440 (2015)
122. D. Rettenwander, C.A. Geiger, M. Tribus, P. Tropper, R. Wagner,G. Tippelt, W. Lottermoser, G. Amthauer, J. Solid State Chem.230, 266 (2015)
123. M.D. Johannes, N.A.W. Holzwarth, Handbook of Solid StateBatteries (World Scientific, Singapore, 2015), chap. CrystallineInorganic Solid Electrolytes: Computer Simulations and Com-parisons with Experiment
124. D. Rettenwander, J. Langer, W. Schmidt, C. Arrer, K.J. Harris,V. Terskikh, G.R. Goward, M. Wilkening, G. Amthauer, Chem.Mater. 27(8), 3135 (2015)
125. V. Epp, Q. Ma, E.M. Hammer, F. Tietz, M. Wilkening, Phys.Chem. Chem. Phys. 17, 32115 (2015)
126. R. Bohmer, T. Jorg, F. Qi, A. Titze, Chem. Phys. Lett. 316, 419(2000)
127. R. Bohmer, J. Magn. Res. 147, 78 (2000)128. B. Koch, M. Vogel, Solid State Nucl. Magn. Res. 34, 37 (2008)129. C. Brinkmann, S. Faske, B. Koch, M. Vogel, Z. Phys. Chem. 224,
1535 (2010)130. B. Ruprecht, H. Billetter, U. Ruschewitz, M. Wilkening, J. Phys.
Cond. Matter. 22, 245901 (2010)131. M. Storek, R. Bohmer, J. Phys. Chem. C 120(14), 7767 (2016)132. C. Vinod Chandran, S. Pristat, E. Witt, F. Tietz, P. Heitjans, J.
Phys. Chem. C 120(16), 8436 (2016)
133. V. Epp, O. Gun, H.J. Deiseroth, M. Wilkening, J. Phys. Chem.Lett. 4, 2118 (2013)
134. G. Redhammer, D. Rettenwander, S. Pristat, E. Dashjav, C.Kumar, D. Topa, F. Tietz, Solid State Sci. 60, 99 (2016)
135. B. Lang, B. Ziebarth, C. Elsasser, Chem. Mater. 27(14), 5040(2015)
136. Y. Seino, M. Nakagawa, M. Senga, H. Higuchi, K. Takada, T.Sasaki, J. Mater. Chem. A 3, 2756 (2015)
137. D. Wohlmuth, V. Epp, B. Stanje, A.M. Welsch, H. Behrens, M.Wilkening, J. Am. Ceram. Soc. 99(5), 1687 (2016)
138. T. Matsuo, M. Shibasaki, T. Katsumata, Y. Onoda, Jap. J. Appl.Phys. 33(7R), 3913 (1994)
139. T. Matsuo, M. Shibasaki, N. Saito, T. Katsumata, J. Appl. Phys.79(4), 1903 (1996)
140. P. Heitjans, M. Masoud, A. Feldhoff, M. Wilkening, FaradayDiscuss. 134, 67 (2007)
141. D. Wohlmuth, V. Epp, P. Bottke, I. Hanzu, B. Bitschnau, I.Letofsky-Papst, M. Kriechbaum, H. Amenitsch, F. Hofer, M.Wilkening, J. Mater. Chem. A 2, 20295 (2014)
142. S.G. Bishop, P.J. Bray, J. Chem. Phys. 48(4), 1709 (1968)143. W. Franke, P. Heitjans, Ber. Bunsenges. Phys. Chem. 96(11),
1674 (1992)144. C. Dietrich, M. Sadowski, S. Sicolo, D.A. Weber, S.J. Sedlmaier,
K.S. Weldert, S. Indris, K. Albe, J. Janek, W.G. Zeier, Chem.Mater. 28(23), 8764 (2016)
145. M.R. Busche, D.A. Weber, Y. Schneider, C. Dietrich, S. Wenzel,T. Leichtweiß, D. Schroder, W. Zhang, H. Weigand, D. Walter,S.J. Sedlmaier, D. Houtarde, L.F. Nazar, J. Janek, Chem. Mater.28, 6152 (2016)
Top Related