


γλώσσες
Σελίδες
Νομικός


© Scott Evans, Ph.D. 1
Introduction to Biostatistics, Harvard Extension School
Confidence Intervals

© Scott Evans, Ph.D. 2
Introduction to Biostatistics, Harvard Extension School
Statistical Inference
Statistical Inference Inferences regarding a population are
made based on a sample Inferences about population parameters (e.g., μ) are made by examining sample statistics (e.g., sample mean)
© Scott Evans, Ph.D. 3
Introduction to Biostatistics, Harvard Extension School
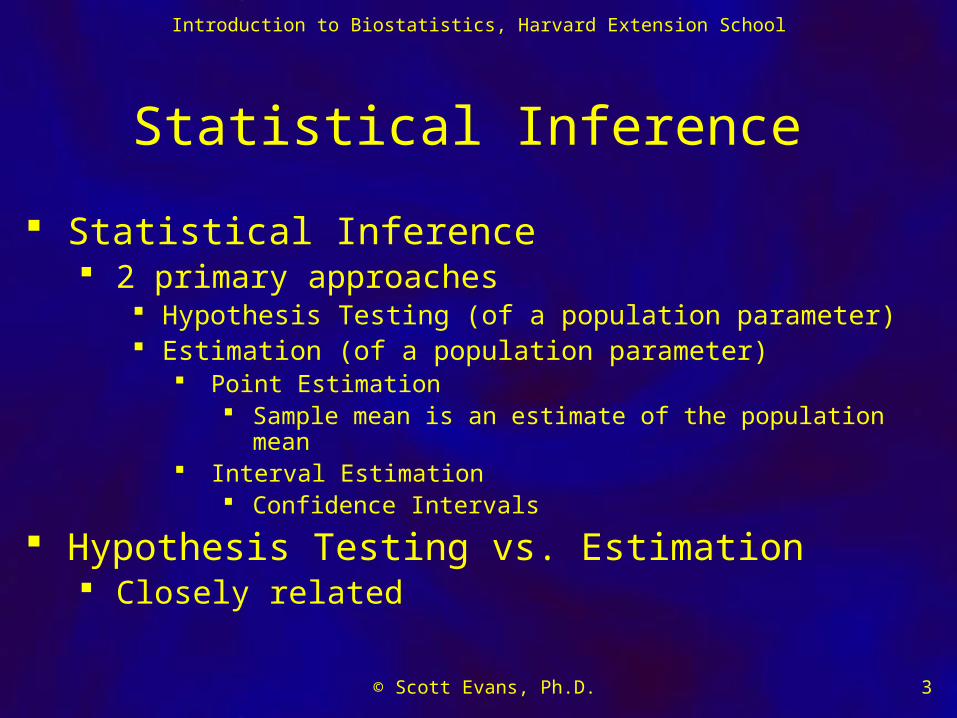
Statistical Inference
Statistical Inference 2 primary approaches
Hypothesis Testing (of a population parameter) Estimation (of a population parameter)
Point Estimation Sample mean is an estimate of the population mean
Interval Estimation Confidence Intervals
Hypothesis Testing vs. Estimation Closely related

© Scott Evans, Ph.D. 4
Introduction to Biostatistics, Harvard Extension School
Confidence Interval
A range of values associated with a parameter of interest (such as a population mean or a treatment effect) that is calculated using the data, and will cover the TRUE parameter with a specified probability (if the study was repeated a large number of times)
© Scott Evans, Ph.D. 5
Introduction to Biostatistics, Harvard Extension School
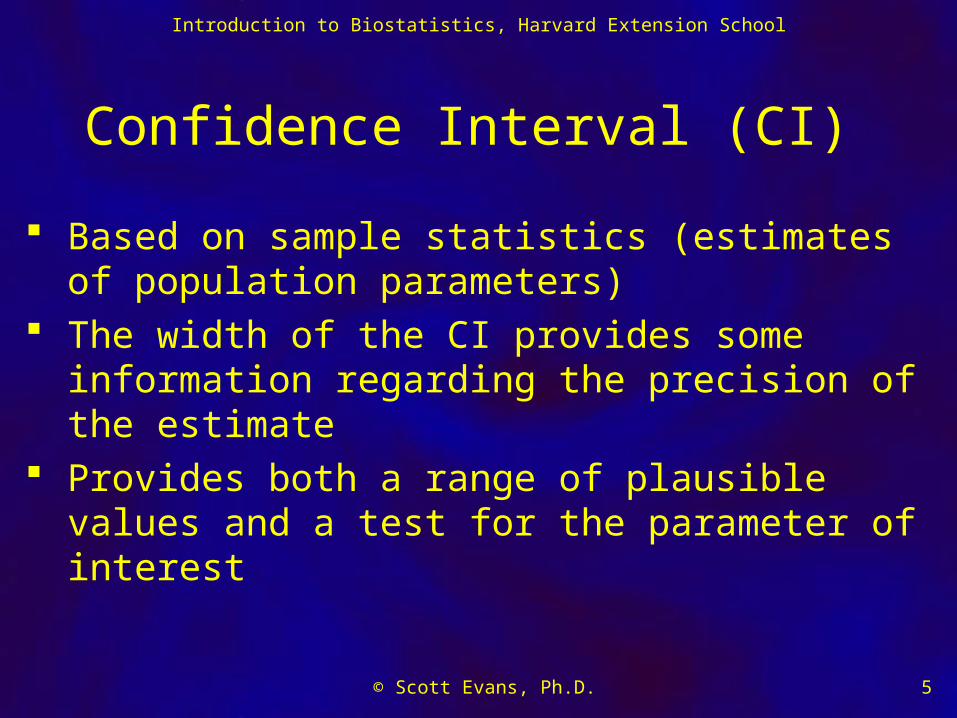
Confidence Interval (CI)
Based on sample statistics (estimates of population parameters)
The width of the CI provides some information regarding the precision of the estimate
Provides both a range of plausible values and a test for the parameter of interest

© Scott Evans, Ph.D. 6
Introduction to Biostatistics, Harvard Extension School
Confidence Interval
Roughly speaking: an interval within which we expect the true parameter to be contained.
Based on the notion of repeated sampling (similar to hypothesis testing)

© Scott Evans, Ph.D. 7
Introduction to Biostatistics, Harvard Extension School
Confidence Interval
The “percent” indicates the probability (based on repeated sampling) that the CI covers the TRUE parameter Not the probability that the parameter falls in the
interval The CI is the random entity (that depends on the random
sample) The parameter is fixed A different sample would produce a different interval,
however the parameter of interest remains unchanged.
© Scott Evans, Ph.D. 8
Introduction to Biostatistics, Harvard Extension School
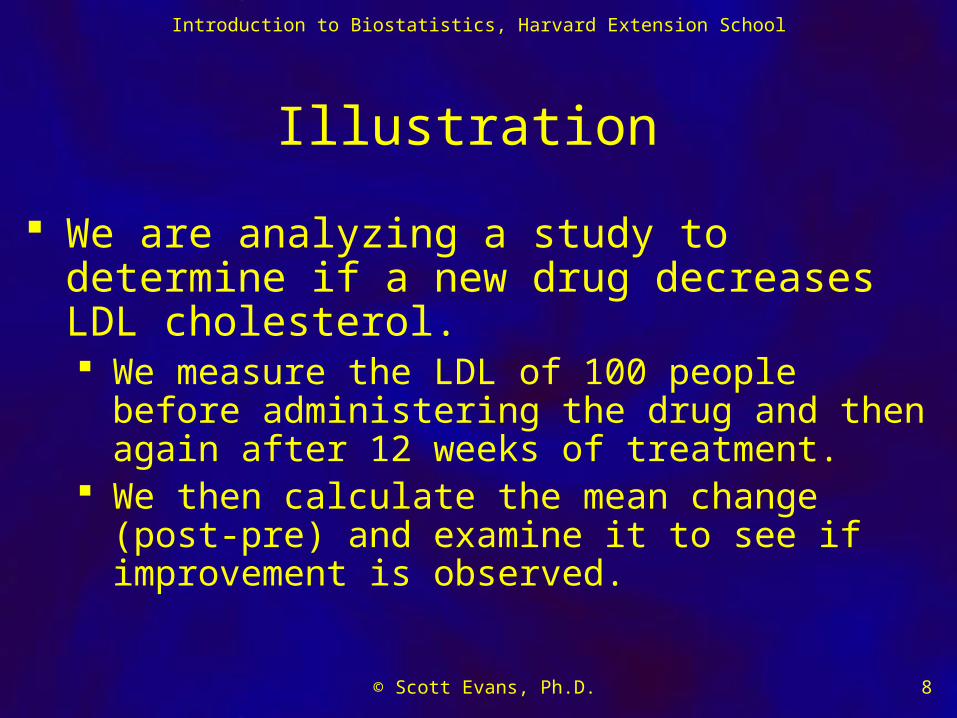
Illustration
We are analyzing a study to determine if a new drug decreases LDL cholesterol. We measure the LDL of 100 people before
administering the drug and then again after 12 weeks of treatment.
We then calculate the mean change (post-pre) and examine it to see if improvement is observed.

© Scott Evans, Ph.D. 9
Introduction to Biostatistics, Harvard Extension School
Illustration
Assume now that the drug has no effect (i.e., the true mean change is 0). Note that in reality, we never know what the true mean is.
We perform the study and note the mean change and calculate a 95% CI
Hypothetically, we repeat the study an infinite number of times (each time re-sampling 100 new people)

© Scott Evans, Ph.D. 10
Introduction to Biostatistics, Harvard Extension School
Illustration
Study 1, Mean=–7, 95% CI (-12, 2) Study 2, Mean=–2, 95% CI (-9, 5) Study 3, Mean=4, 95% CI (-3, 11) Study 4, Mean=0, 95% CI (-7, 7) Study 5, Mean=-5, 95% CI (-12, 2) . . .

© Scott Evans, Ph.D. 11
Introduction to Biostatistics, Harvard Extension School
Illustration
Remember the true change is zero (i.e., the drug is worthless)
95% of these intervals will cover the true change (0). 5% of the intervals will not cover 0
In practice, we only perform the study once. We have no way of knowing if the interval
that we calculated is one of the 95% (that covers the true parameter) or one of the 5% that does not.

© Scott Evans, Ph.D. 12
Introduction to Biostatistics, Harvard Extension School
Example
Two treatments are being compared with respect to “clinical response” for the treatment of nosocomial (hospital-acquired) pneumonia
The 95% CI for the difference in response rates for the two treatment groups is (-0.116, 0.151)
What does this mean?
© Scott Evans, Ph.D. 13
Introduction to Biostatistics, Harvard Extension School
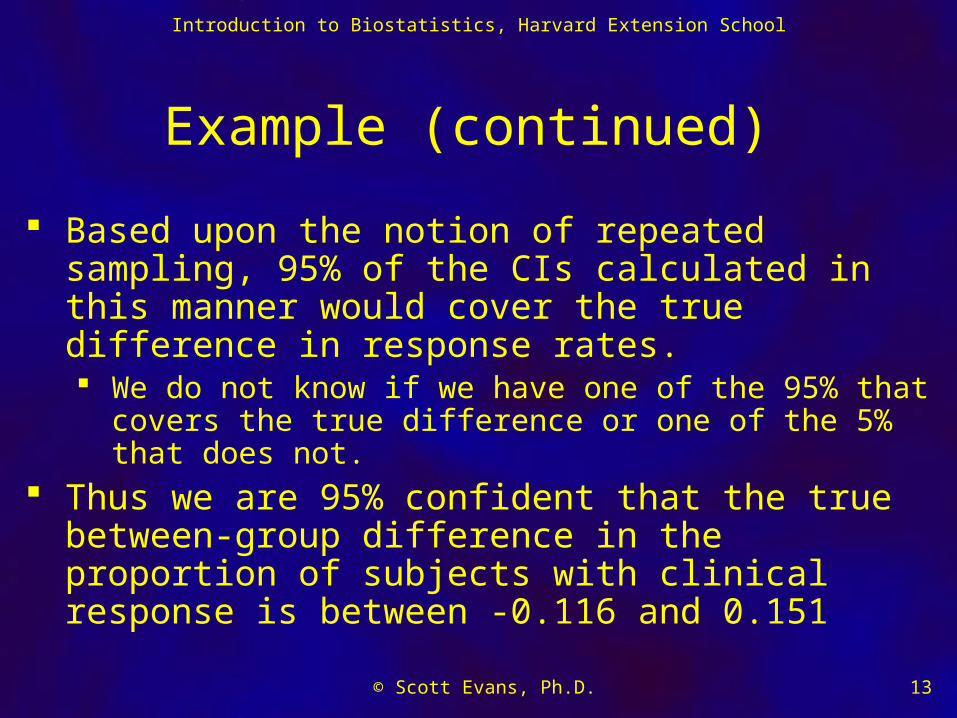
Example (continued)
Based upon the notion of repeated sampling, 95% of the CIs calculated in this manner would cover the true difference in response rates. We do not know if we have one of the 95% that
covers the true difference or one of the 5% that does not.
Thus we are 95% confident that the true between-group difference in the proportion of subjects with clinical response is between -0.116 and 0.151

© Scott Evans, Ph.D. 14
Introduction to Biostatistics, Harvard Extension School
Caution
Thus, every time that we calculate a 95% CI, then there is a 5% chance that the CI does not cover the quantity that you are estimating. If you perform a large analyses, calculating
many CIs for many parameters, then you can expect that 5% of the will not cover the the parameters of interest.

© Scott Evans, Ph.D. 15
Introduction to Biostatistics, Harvard Extension School
CIs and Hypothesis Testing
To use CIs for hypothesis testing: values between the limits are values for which the null hypothesis would not be rejected At the α=0.05 level:
We would fail to reject H0: treatment change=0 since 0 is contained in (-0.116, 0.151)
We would reject H0: treatment change=-20 since -20 is not contained in (-0.116, 0.151)

© Scott Evans, Ph.D. 16
Introduction to Biostatistics, Harvard Extension School
CIs and Hypothesis Testing
What would be the conclusion of these hypothesis tests if we wanted to test at α=0.01 or α=0.10?

© Scott Evans, Ph.D. 17
Introduction to Biostatistics, Harvard Extension School
Confidence Interval Width
It is desirable to have narrow CIs Implies more precision in your estimate Wide CIs have little meaning
In general, with all other things being equal: Smaller sample size wider CIs Higher confidence wider CIs Larger variability wider CIs

© Scott Evans, Ph.D. 18
Introduction to Biostatistics, Harvard Extension School
In Practice
It is a good idea to provide confidence intervals in an analyses They provide both a test and an estimate
of the magnitude of the effect (which p-values do not provide)

© Scott Evans, Ph.D. 19
Introduction to Biostatistics, Harvard Extension School
For Illustration
Consider the neuropathy example (insert neuropathy_example.pdf)
Sensitivity 48.5 w/ 95% CI (36.9, 60.3)

© Scott Evans, Ph.D. 20
Introduction to Biostatistics, Harvard Extension School
CIs
Similar to hypothesis testing: We may choose the confidence level (e.g.,
95% α=0.05) CIs may be:
1-sided: (-∞, value) or (value, ∞), or 2-sided (value, value)

© Scott Evans, Ph.D. 21
Introduction to Biostatistics, Harvard Extension School
CIs
Some things to think about Scale of the variable(s): continuous vs.
binary (next class) 1-sample vs. 2-sample
CI for a population mean CI for the difference between 2 population
means
σ known or unknown

© Scott Evans, Ph.D. 22
Introduction to Biostatistics, Harvard Extension School
CIs
Insert CI1.pdf
Top Related