


γλώσσες
Σελίδες
Νομικός

Highly Active Analogs of α-Factor Bull. Korean Chem. Soc. 2014, Vol. 35, No. 5 1365
http://dx.doi.org/10.5012/bkcs.2014.35.5.1365
Highly Active Analogs of α-Factor and Their Activities
Against Saccharomyces cerevisiae
Hee Jun Ahn, Eun Young Hong,† Dong Hoon Jin,‡ and Nam Joo Hong*
School of Biotechnology, Yeungnam University, Gyungsan City, Gyungbuk 712-749, Korea. *E-mail: [email protected]†School of Chemical and Biological Engineering, Seoul National University, Seoul 151-742, Korea
‡Asan Institute for Life Science, Department of Convergence Medicine, College of Medicine, University of Ulsan,
Seoul 138-736, Korea
Received November 21, 2013, Accepted January 13, 2014
Thirteen analogs of tridecapeptide α-factor (WHWLQLKPGQPMY) of Saccharomyces cerevisiae with C- or
N-terminal Trp extension and isosteric replacement by Aib at position 8 and 11, Trp at position 13, D-Ala at
position 9, and Orn and Glu at position 6 were synthesized and assayed for their biological activity. Receptor
binding assay was carried out using our newly developed spectrophotometric method with detector peptide 14.
C- or N-terminal extended analogs, α-factor-[Trp]n (n =1-5) 1-5 and [N-Trp]1-α-factor 6, were all less active
than native α-factor and gradual decreases in both activity and receptor affinity were observed with greater Trp
extension. Trp-substituted analog at position 13, [Trp13]α-factor 7, exhibited about 2-fold reductions in both
activity and receptor affinity. Aib-substituted analogs, [Aib8]α-factor 8 and [Aib11]α-factor 9, showed 5- to 10-
fold reduction in activity as well as 3-fold reduction in receptor affinity compared to native α-factor. [Orn6]α-
factor 10 demonstrated strong potency with a 7.0-fold increase in halo activity as well as 1.8-fold increase in
receptor affinity compared to native α-factor. For two double substituted analogs, [Glu6,D-Ala9]α-factor 12
showed the slightly decreased potency in halo activity compared to analog 10, whereas [Orn6,D-Ala9]α-factor 11
exhibited 15-fold higher halo activity as well as nearly 3-fold higher receptor affinity compared to native α-factor.
Key Words : α-Factor, Analogs, S. cerevisiae, Activity
Introduction
Native α-factor, tridecapeptide (WHWLQLKPGQPMY),
is secreted by Saccharomyces cerevisiae MATa haploid cells
and recognized by a receptor that is coded by gene (STE2),
which is expressed in S. cerevisiae MATa haploid cells.1 The
α-factor pheromone receptor, Ste2p, belongs to the large
family of G protein-coupled receptors (GPCRs).2-4 Even
since α-factor was isolated and characterized in 1977,5 many
groups have reported studies on the structure-activity relation-
ship (SAR) of α-factor.4 Most studies have focused on tri-
decapeptide (α-factor) or dodecapeptide pheromone lacking
an N-terminal Trp (des-Trp1-α-factor), which is another
pheromone produced by post-proteolytic processing during
α-factor maturation. The both 13- and 12-peptides have been
reported as showing similar activities in the nanogram per
milliliter range. However, removal of Trp1 residues from the
13-peptide generally reduces the activity of resulting 12-
peptide.6-9
[Nle12]α-factor, an isosteric replacement of Met,12 is wide-
ly accepted as an alternative probe to native α-factor, and
has several advantages over α-factor. Importantly, it is stable
against autoradiolysis,4,8,10 and it does not undergo oxidation
leading to methionine sulfoxide. In addition, Nle12 sub-
stitution was reported to increase the stability of this phero-
mone against the endopeptidase-induced degradation in
MATa cells, resulting in maintenance of activity for a longer
period.11,12 Surface-associated endopeptidase, which is involv-
ed in cleavage of the peptide bond between residues Leu6
and Lys7 of α-factor, has strong effects on the potency of α-
factor, and thus increased stability against endopeptidase-
mediated degradation is significant to maintain potency.
However, despite such structural characteristics of [Nle12]α-
factor, its activity is not as strong as that of native α-
factor.6,8,27
The presence of central residues Lys7-Pro8-Gly9-Gln10
forming a type II β-turn has been verified in conformation
studies as a major structural feature of biologically active
pheromone.4,13,14,43 To rigidify the central region of α-factor
based on this β-turn structure, various cyclic analogs of α-
factor possessing a covalent bridge between Lys7and Gln10
(cyclo7-10 α-factor) were synthesized as β-turn probe.15,16
Subsequently, cyclic lactam with different ring size,16,17
cyclic disulfide,18,19 and cyclic γ-lactam20 were designed to
induce a more favorable turn structure for the pheromone.
However, such cyclization approaches to conformational
rigidification generally reduce potency by 5% to 25% regard-
less of the adopted cyclic structures.16,17 Among the many
synthetic β-turn peptidomimetics restricted by cyclization,
(R)-γ-lactam conformational constraint incorporating [3-
(R)-amino-2-oxo-1-pyrrolidineacetamido] in place of Pro-
Gly at residues 8 and 9 was reported to have the best activity
only equal to that of parent peptide, [Nle12]α-factor, whereas
others were not as active as [Nle12]α-factor.20
Recently, to establish the identities of Ste2p receptor
residues mediating interactions with ligands, an affinity label-
1366 Bull. Korean Chem. Soc. 2014, Vol. 35, No. 5 Hee Jun Ahn et al.
ing approach involving the photoactivatable groups attached
to the α-factor backbone was developed.28,30,44,51-53,55,56 p-
Benzoyl-L-phenylalanine (Bpa) and 3,4-Dihydroxyphenyl-
alanine (DOPA) was reported to have a desirable property
for this purpose, although incorporation of these groups
at various positions in α-factor have been shown to result
in a less than 30-fold decrease in receptor affinity.44,51,55
Biotin (Bio) tagging modification of DOPA analog (Bio7-
[DOPA13]α-factor) and 7-Nitrobenz-2-oxa-1,3-diazol-4-yl
(NBD)30,53,54 developed for the detection of ligand-receptor
conjugates were shown to reduce activity to about 33% that
of parent α-factor.44,56 Although the conjugation strategy of
photoactivatable groups is not focused on enhancing potency,
all of these analogs display receptor affinities varying from
slightly better than that of α-factor to about 6-fold lower.53,54
Most SAR studies on the α-factor have compared the
activities of synthetic analogs with that of the parent Nle12-
tridecapeptide, [Nle12]α-factor.4,8,10-12,25,44,46 Early studies
also made comparisons with the parent dodecapeptide, des-
Trp1-α-factor.4,42,47-50 However, not many reports have di-
rectly compared activity values with that of native tri-
decapeptide α-factor.4,13,27,39,45 In our investigation, [D-
Ala9,Nle12]α-factor was shown to have one of the highest
activities in halo assay (about 5-fold increase compared to
that of [Nle12]α-factor), but no comparison data with native
tridecapeptide α-factor have been obtained.10
Although hundreds of α-factor analogs have been reported
over the last thirty years,4,42,43,51,53 most of these synthetic
analogs are known to markedly reduce activity, and only a
few have activities comparable with that of the native α-
factor. Surprisingly, none of these analogs exceed higher
than 3- to 4-fold activity compared to that of native α-
factor.4,42 In this paper, to enhance the biological activity of
native α-factor, we designed a series of α-factor analogs in
which Trp was attached to the C-terminus in stepwise
fashion without alteration of the main chain and unnatural
amino acids such as 2-aminoisobutyric acid (Aib) and
Ornithine (Orn) were substituted within the main chain. C-
terminal elongated analogs have general structures such as
α-factor-[Trp]n, where subscript n refers to the number of
Trp residues from 1 to 5. Such designs are expected to afford
peptide analogs favorable structural characteristic for en-
hanced interactions with the receptor buried in the hydro-
phobic membrane due to the increased hydrophobic nature
of the analogs.21 In addition, we have designed and synthe-
sized a new detector peptide, [Orn6]α-factor-[Cys]3 14, that
makes spectrophotometric measurement of receptor affinity
possible. The relative affinities of achromic competing
peptides can be rapidly determined by measuring their effect
on binding of the detector peptide. We have used this
method to determine the affinities of analogs for the cognate
GPCR of S. cerevisiae MATa.
Experimental Procedure
Synthesis of α-Factor Analogs.22-24 All α-factor analogs
were prepared using a solid phase strategy. All reagents and
solvents in solid phase peptide synthesis were of analytical
grade and purchased from Calbiochem-Novabiochem Cor-
poration (San Diego, CA), VWR Scientific (Piscataway, NJ),
and Sigma Aldrich. High performance liquid chromato-
graphy grade dichloromethane, acetonitrile, methanol, and
water were purchased from VWR Scientific and Fisher
Scientific (Springfield, NJ). Automated synthesis of target
peptides was carried out on an ASP 48S peptide synthesizer
(Peptron Inc.) using preloaded NH2-Trp-2-chloro-Trityl
Resin (0.53 mmol/g resin, Novabiochem, La Jolla, CA) on a
0.1-mmol scale. Elongation of the peptide chain was carried
out using 2-(1H-benzotriazole-1-yl)-1,1,3,3-tetramethyluro-
nium hexafluorophosphate (HBTU: 8 eq.)/N-hydroxybenzo-
triazole (HOBT: 8 eq.)/4-methylmorpholine (16 eq.) along
with eight equivalents of a 9-fluorenylmethoxycarbonyl
(Fmoc) amino acids. Fmoc was used for all N-α-protections,
whereas the side chain protecting groups were His(Trt)-OH,
Lys(t-Boc)-OH, Orn(t-Boc)-OH, Gln(Trt)-OH, and Trp(t-
Boc)-OH. For the first 10-amino acid fragment, single
coupling, followed by double coupling were used to avoid
formation of deletion peptides. Acetic anhydride capping
was used after each coupling to improve the purity of the
peptide.
After complete chain assembly, the N-α-deprotected
peptidyl resin was washed thoroughly with 1-methyl-2-
pyrrolidinone and CH2Cl2 and then dried in vacuo for 4–5 h.
The peptide was then cleaved from the resin support with
simultaneous side chain deprotection using trifluoroacetic
acid (90 mL), 1,2-ethanedithiol (2.5 mL), thioanisol (2.5
mL), triisopropylsilane (2.5 mL) and water (2.5 mL). Filt-
rates from the cleavage mixture were collected, combined
with trifluoroacetic acid washes of the resin, concentrated
under reduced pressure, and treated with cold ether to
precipitate the crude product.
The obtained crude peptide was purified by reversed-
phase high performance liquid chromatography (Shimazu
Prominence HPLC) on a preparative Vydac Everest C18
reverse phase polymer column (250 mm × 22 mm) with
detection at 220 nm. Due to the strong tendency of the
peptide to aggregate in water, the crude product (5 mg) was
dissolved in 1 mL of 50% trifluoroacetic acid/water, applied
to the column, and eluted with a linear gradient of CH3CN/
water containing 0.1% trifluoroacetic acid and 10 to 75%
CH3CN over 90 min with a flow rate of 1.5 mL/min. Frac-
tions were analyzed by reversed-phase high performance
liquid chromatography (Shimazu Prominence HPLC) on an
analytical Vydac Everest C18 reversed phase polymer column
with detection at 220 nm. Fractions with over 98% homo-
geneity were pooled and subjected to lyophilization. Mole-
cular weights of the final peptides were assessed by LC/MS
(Agilent HP1100 series).
Organisms. Strain S. cerevisiae 7925 [MATa his3-532
trp1 gal2] was used for growth arrest and halo assay of
various α-factor analogs. The strain was purchased from the
Korean Collection for Type Cultures and was maintained
and grown on YEPD medium (yeast extract: 1%, peptone:
2%, dextrose: 2%) at 30 oC.
Highly Active Analogs of α-Factor Bull. Korean Chem. Soc. 2014, Vol. 35, No. 5 1367
Morphogenesis (5% Shmoo) Assay.10,25 Strain S. cerevisiae
7925 (MATa) was grown at 30 oC with shaking (200 rpm/
sec) to early log phase in YEPD broth (yeast extract: 1%,
peptone: 2%, dextrose: 2%) supplemented with 2% glucose.
Cells were then harvested by centrifugation at 6,000 rpm/sec
(IBRD IB4, Hanil Science Centrifuge), washed twice with
sterile distilled water, resuspended in YEPD broth to 4.0 ×
106 cells/mL, and placed on ice. Dilution series (0.5-10 μL/
100 μL; 5-100 μg/100 μL) of peptide analogs was prepared
in plastic test tubes using peptide stock solution (6 × 10⁻³ M,
1000 μg/100 μL) with YEPD as the diluents. Ten microliter
of the 1.0 × 10⁶ cells/mL was then added to 90 μL of each of
the peptide solutions, after which suspensions were incubated
at 30 oC for 4 h with 200 rpm/sec of shaking. The cells were
placed on ice, after which 10 μL portions were placed in a
hemocytometer and observed by visual inspection using a
microscope (Olympus CHD) under 400× magnification in
order to quantify the total cells as well as the number of cells
with shmoo morphology (elongated, pear-shaped cells with-
out a constricted neck at the bud site). Shmoo cells were
counted repeatedly in three separate areas containing 400
total cells. The percentage of shmoo cells was calculated by
dividing the number of shmoo cells by the total cell numbers.
To compare relative activities of different analogs, the amount
of analog causing 5% shmoo morphology (20 shmoo cells/
400 total cells) was determined from the regression line.
Growth Arrest (halo) Assay (Fig. 2(a) and (b)).10,25 Two
microliter (2.4 × 10³ cells/mL) of S. cerevisiae 7925 cells
suspension (1.2 × 10⁶ cells/mL) was diluted in 6 mL of
YEPD [yeast extract (1%, w/v), peptone (2%, w/v) and
dextrose (2%, w/v)] containing 2% agar and layered on a
plate. Ten microliters of each peptide solutions at various
concentrations (6 × 10⁻³ M, 0.01 μL-10 μL/10 μL) was
pipette onto filter disks (8 mm in diameter) from Advantec,
Toyo Roshi. Plates were incubated at 30 oC for 24 and 48 h
and then observed for clear zones (halos) around the disks.
Data were expressed as the diameter of the halo including
the diameter of the disk. The minimum value for growth
arrest was 9 mm, which represents the disk diameter (8 mm)
with a small zone of inhibition. All assays were carried out
at least three times, and variations in halo size were no larger
than 2 mm at any amount of applied peptide. Reported
averages are averages of tests. Differences in diffusion of the
various analogs in agar medium had no effect on biological
activities in the halo assay. Similar trends were obtained for
these analogs when activities were ranked within a single
assay, as measured by halo assay and morphogenesis. Each
halo assay was carried out at least three times with virtually
identical regression line obtained.
Synergism Assays (Fig. 2(c)). Synergism assay was used
to determine whether or not analogs with no growth arrest
activity are capable of antagonizing native pheromone activity.
Lawns of S. cerevisiae strain 7925 suspended in YEPD were
layered onto plates as described in the growth arrest assay.
Specifically, sterile disks were placed adjacent to each other
so that the disk containing the test peptide would lie at the
periphery of the halo formed by the standard analog,
[Orn6]α-factor 10. One disk was impregnated with 100 μg
(6.0 × 10⁻² μmol) of [Orn6]α-factor 10 in 10 μL of H2O, and
the other disk was impregnated with 150 μg (9.0 × 10⁻²
μmol) of the test peptide 1-5 in 15 μL of H2O. Plates were
incubated as described in the halo assay, and the effects on
halo formation were noted.
Steady-state Saturation Binding with Detector, [Orn6]α-
Factor-[Cys]3 (Fig. 4). To obtain steady-state saturation
binding for Scatchard analysis, cells were grown and harvest-
ed as described above with the following changes. Cell stock
suspension at a concentration of 3.0 × 10¹¹ cells/mL was
diluted to final assay concentration of 2.5 × 10¹¹ cells/mL.
The cell suspension (1 mL) were then dispensed into seven
round bottom plastic test tubes with a volume of 5 mL, after
which various amounts of [Orn6]α-factor-[Cys]3 14, [0.12
μL (8.8 × 10⁻¹⁰ mol, 7.1 × 10⁻⁷ M), 0.6 μL (4.4 × 10⁻⁹ mol,
3.5 × 10⁻⁶ M), 1.2 μL (8.8 × 10⁻⁹ mol, 7.0 × 10⁻⁶ M), 1.8 μL
(1.3 × 10⁻⁸ mol, 1.0 × 10⁻⁵ M), 2.4 μL (1.8 × 10⁻⁸ mol,
1.4 × 10⁻⁵ M), 3.6 μL (2.7 × 10⁻⁸ mol, 2.1 × 10⁻⁵ M), 6 μL
(4.4 × 10⁻⁸ mol, 3.5 × 10⁻⁵ M), 12 μL (8.9 × 10⁻⁸ mol, 7.1 ×
10−5 M), 18 μL (1.3 × 10⁻⁷ mol, 1.1 × 10⁻⁴ M)] at 4.73 × 10⁻³
M (1 mg detector/100 μL saline water) were added to each
test tube. Saline water was added to obtain a final volume of
2 mL. Initiation of binding was processed with continuous
vortexing (2,000 rpm) on a Finemixer Mx 2 (Finepcr, Korea)
at 22 oC. After 35 min, all test tubes were centrifuged for 15
min at 9,000 rpm, after which supernatant (about 1.25 mL)
was removed and filtered through 0.2 μm Acrodisc LC
syringe filters. Portions (950 μL) of the filtrates were
dispensed into a cuvette (1 cm path length) containing 50 μL
of Ellman reagent (10 mM), after which the absorbance was
measured at 412 nm to determine the concentration of bound
detector for each experimental portion. The total bound
concentration of bound detector was calculated based on the
decrease in absorbance after binding process for 35 min. To
determine the level of nonspecific binding, α-cells were
tested at the same concentrations using the same method.
Total counts per minute bound to α-cells were average 10%
of total count per minute bound to α-cells.
Competition for Detector Binding by Competitor α-
Factor Analogs (Fig. 5 and 6). Competition for bound
detector, [Orn6]α-factor-[Cys]3 14, by competitive peptides
was measured by the following protocol. In general, S.
cerevisiae strain 7925 was grown to a concentration of 1 ×
107 cells/mL and harvested by centrifugation at 3,000 g for
15 min at 4 oC. Pelleted cells were washed three times in ice-
cold saline water and resuspended in saline water to a
concentration of 2.5 × 10¹¹ cell/mL. The cell suspension (1
mL) was dispensed into eight test tubes with a volume of 5
mL. Various amounts of competitors [6.0 × 10⁻³ M, 0.5 μL
(2.95 × 10⁻⁹ mol/1.31 mL, 2.25 × 10⁻⁶ M)-40 μL (2.36 ×
10−7 mol/1.31 mL, 1.8 × 10⁻⁴ M)] and 2.2 μL (6.0 × 10⁻³ M)
of detectors (1.17 × 10⁻⁸ mol/1.31 mL, 8.96 × 10⁻⁶ M) were
added to each tube, after which total volumes were adjusted
to a final volume of 2 mL using saline water. The binding
reaction was processed by continuous vortexing (2,000 rpm)
on a Finemixer Mx 2 (Finepcr, Korea) at 22 oC. After 35
1368 Bull. Korean Chem. Soc. 2014, Vol. 35, No. 5 Hee Jun Ahn et al.
min, all test tubes were centrifuged for 15 min at 9,000 rpm,
after which supernatant (about 1.25 mL) was removed and
filtered through 0.2 μm Acrodisc LC syringe filters. Portions
(950 μL) of the filtrates were dispensed into a cuvette (1 cm
path length) containing 50 μL of Ellman reagent (10 mM),
after which absorbance was measured at 412 nm to deter-
mine the concentration of bound detector for each experi-
mental portion. Results for each analog were expressed as a
percentage of total binding in the absence of competitor.
Each binding assay was carried out at least three times, and
virtually identical curves were obtained. IC50 values were
determined based on the concentration of competitor that
inhibits detector binding by 50%. Values were calculated as
the 50% point on the regression line incorporating the
appropriate competition curve from Figures 5 and 6. The Ki
values were calculated by dividing the experimentally deter-
mined concentration providing 50% binding displacement
by [1+ HT/KD], where HT = concentration of detector and KD
= dissociation constant of detector.58
Results
Synthesis and Characterization of Peptide Analogs.
Native α-factor is a tridecapeptide with the following
primary structure: NH2-Trp-His-Trp-Leu-Gln-Leu-Lys-Pro-
Gly-Gln-Pro-Met-Tyr-COOH. Analogs of this peptide are
designated according to IUPAPC convention.26 Thus, if Orn
is substituted for Leu at position 6, the analogs become
designated [Orn6]α-factor. α-Factor-[Trp]n represents C-
terminal extended analogs. The subscript n denotes the
number of Trp residues. For example, α-factor-[Trp]1 refers
to a C-terminal extended analog with one Trp while α-
factor-[Trp]2 represents two Trp residues at the C-terminus.
In the same manner, [N-Trp]1-α-factor refers to an N-
terminal extended analog with one Trp.
All of target analogs investigated in this paper were
efficiently synthesized on trityl resin using a solid phase
approach. In general, the crude products of TFA cleavage
obtained from the resin contained approximately 85 to 95%
of the major components, as indicated by analytical reversed-
phase HPLC. Preparative HPLC purification yielded peptides
with a homogeneity greater than 98%, as determined by
analytical HPLC using an acetonitrile/water/TFA gradient
system. Molecular masses of detector peptide, [Orn6]α-
factor-[Cys]3 14, assessed by LC/MS were consistent with
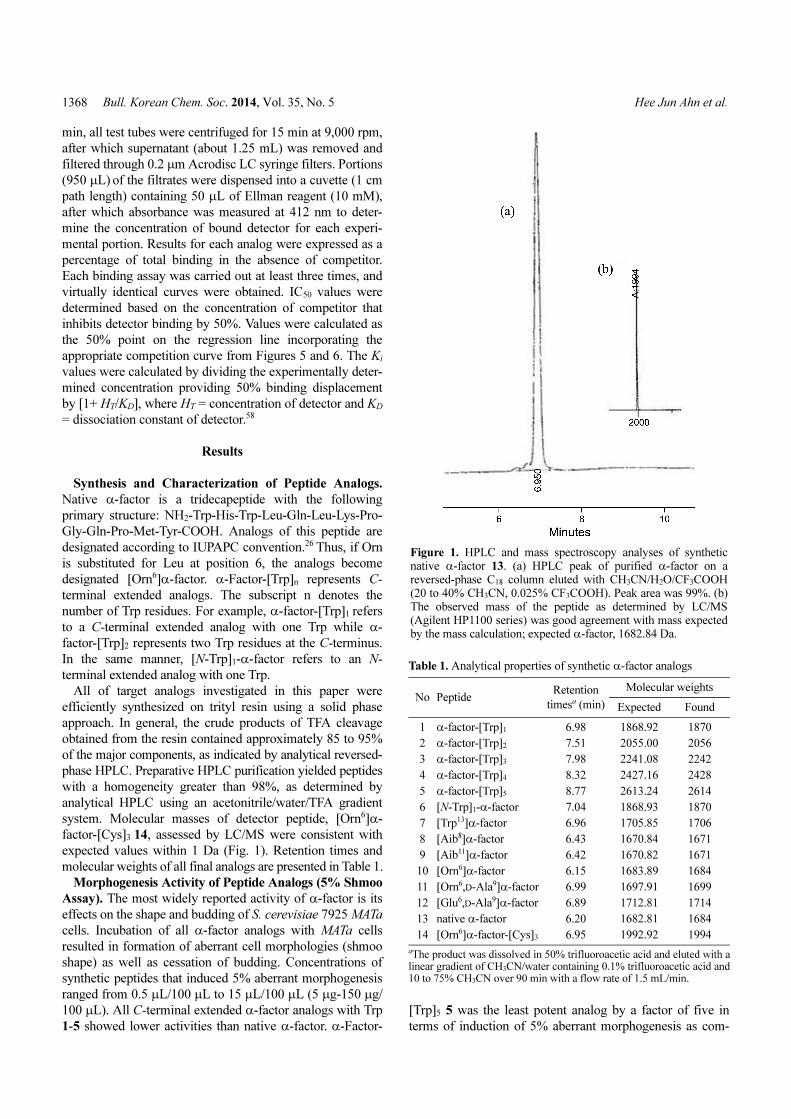
expected values within 1 Da (Fig. 1). Retention times and
molecular weights of all final analogs are presented in Table 1.
Morphogenesis Activity of Peptide Analogs (5% Shmoo
Assay). The most widely reported activity of α-factor is its
effects on the shape and budding of S. cerevisiae 7925 MATa
cells. Incubation of all α-factor analogs with MATa cells
resulted in formation of aberrant cell morphologies (shmoo
shape) as well as cessation of budding. Concentrations of
synthetic peptides that induced 5% aberrant morphogenesis
ranged from 0.5 μL/100 μL to 15 μL/100 μL (5 μg-150 μg/
100 μL). All C-terminal extended α-factor analogs with Trp
1-5 showed lower activities than native α-factor. α-Factor-
[Trp]5 5 was the least potent analog by a factor of five in
terms of induction of 5% aberrant morphogenesis as com-
Figure 1. HPLC and mass spectroscopy analyses of syntheticnative α-factor 13. (a) HPLC peak of purified α-factor on areversed-phase C18 column eluted with CH3CN/H2O/CF3COOH(20 to 40% CH3CN, 0.025% CF3COOH). Peak area was 99%. (b)The observed mass of the peptide as determined by LC/MS(Agilent HP1100 series) was good agreement with mass expectedby the mass calculation; expected α-factor, 1682.84 Da.
Table 1. Analytical properties of synthetic α-factor analogs
No Peptide Retention
timesa (min)
Molecular weights
Expected Found
1 α-factor-[Trp]1 6.98 1868.92 1870
2 α-factor-[Trp]2 7.51 2055.00 2056
3 α-factor-[Trp]3 7.98 2241.08 2242
4 α-factor-[Trp]4 8.32 2427.16 2428
5 α-factor-[Trp]5 8.77 2613.24 2614
6 [N-Trp]1-α-factor 7.04 1868.93 1870
7 [Trp13]α-factor 6.96 1705.85 1706
8 [Aib8]α-factor 6.43 1670.84 1671
9 [Aib11]α-factor 6.42 1670.82 1671
10 [Orn6]α-factor 6.15 1683.89 1684
11 [Orn6,D-Ala9]α-factor 6.99 1697.91 1699
12 [Glu6,D-Ala9]α-factor 6.89 1712.81 1714
13 native α-factor 6.20 1682.81 1684
14 [Orn6]α-factor-[Cys]3 6.95 1992.92 1994
aThe product was dissolved in 50% trifluoroacetic acid and eluted with alinear gradient of CH3CN/water containing 0.1% trifluoroacetic acid and10 to 75% CH3CN over 90 min with a flow rate of 1.5 mL/min.
Highly Active Analogs of α-Factor Bull. Korean Chem. Soc. 2014, Vol. 35, No. 5 1369
pared to native α-factor. Gradual reduction of activity
occurred as Trp residues were extended at the C-terminus;
2.0-fold decrease for α-factor-[Trp]1 1, 3.0-fold decrease for
α-factor-[Trp]2 2, 4.0-fold decrease for α-factor-[Trp]3 3, 5.0-
fold decrease for α-factor-[Trp]4 4, and 5.2-fold decrease for
α-factor-[Trp]5 5 in the amount of analog required to cause
5% aberrant morphogenesis as compared to native α-factor.
N-Terminal extended analog with Trp, [N-Trp]1-α-factor 6,
showed a 2-fold decrease in activity as compared to native
α-factor. Similar trends were found for C- and N- terminal
extended analogs using two strains, S. cerevisiae 7925 and
7951. Strain 7951 showed slightly higher sensitivity than
strain 7925 in the assay.60 [Trp13]α-factor 7 showed 57%
activity compared to native α-factor. On the other hand,
analogs substituted with unnatural amino acids in internal
regions, [Aib8]α-factor 8 and [Aib11]α-factor 9, showed 60
to 66% activity compared to native α-factor. Analog with
Leu replaced by Orn at position 6, [Orn6]α-factor 10,
resulted in a 2-fold increase in activity. For two double-
substituted analogs, [Glu6,D-Ala9]α-factor 12 exhibited a
2.2-fold increase in activity while [Orn6,D-Ala9]α-factor 11
showed a 3.3-fold increase in activity compared to native
α-factor based on the amount of pheromone causing 5%
aberrant morphogenesis (20 shmoos/400 cells).
Growth Arrest (Halo) Assay. α-Factor is known to arrest
growth of MATa cells. Therefore, halo assay provides an
easy and direct measure of pheromone activity. α-Factor and
its analogs arrested growth of cells, and bioactive analogs
presented clear zones around the disk (Fig. 2(a) and (b)).
Increasing amounts of pheromone promoted growth arrest,
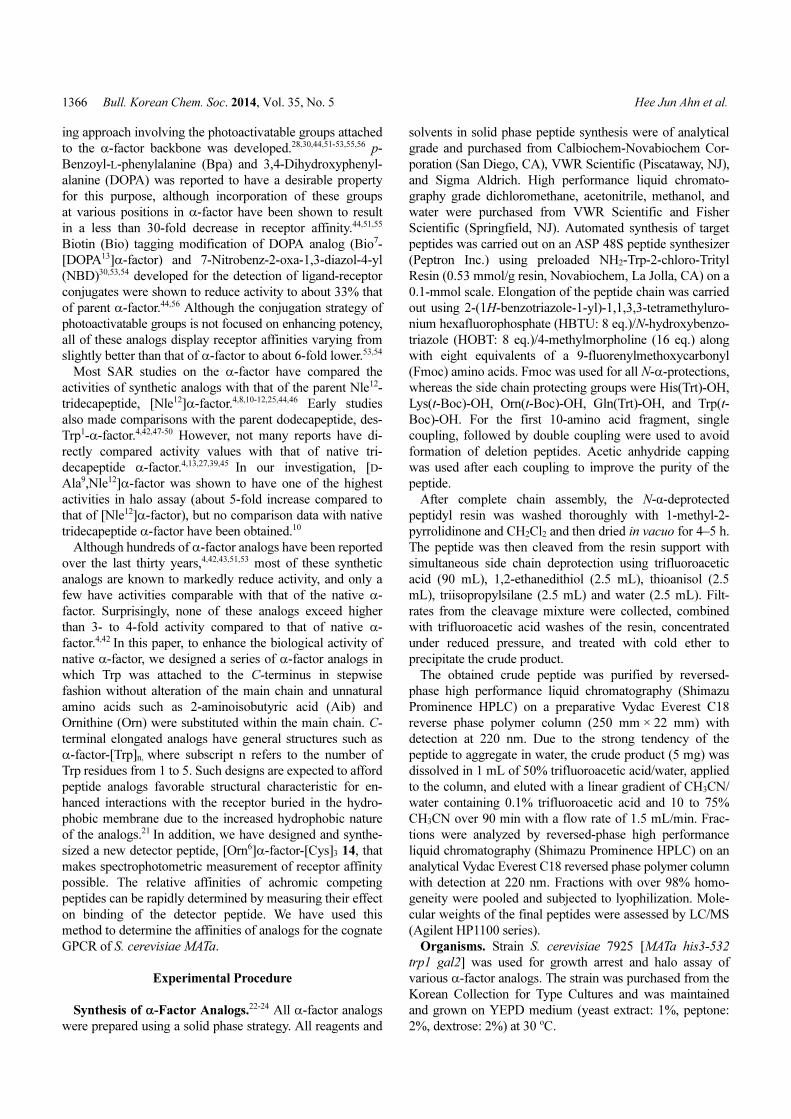
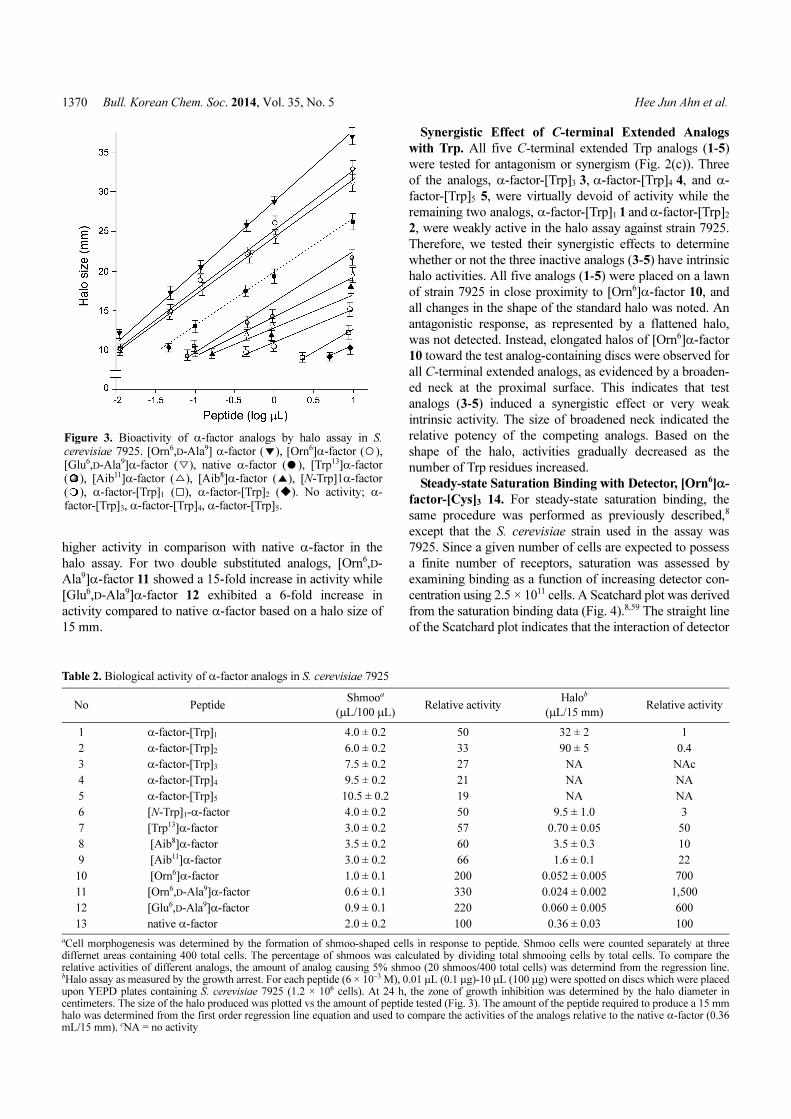
as measured by halo size. These data were plotted in a graph
as halo size versus amount of pheromone added to cell lawn,
and then linearized by regression analysis (Fig. 3). To com-
pare relative activities of the different analogs, the amount of
peptide causing a halo size of 15 mm was determined from
the regression line. Relative halo activities of the analogs
against strain 7925 are presented in Table 2.
All C- and N-terminal extended α-factor analogs with Trp
showed lower activities compared to native α-factor. Further,
C-terminal extended analogs showed similar activities as
observed in the halo assay. None of the analogs except for α-
factor-[Trp]1 1 showed clear zones up to a volume of 10 μL,
whereas α-factor-[Trp]1 1 showed weak activity (12 mm
zone/10 μL). Interestingly, α-factor-[Trp]2 2 presented a
blurry zone after 24 h (11 mm/10 μL) that soon disappeared
after 48 h. N-Terminal extended analog with one Trp, [N-
Trp]1-α-factor 6, presented 3-fold higher halo activity than
its C-terminal elongated counterpart, α-factor-[Trp]1 1.
[Trp13]α-factor 7 showed a 0.5-fold decrease in activity as
compared to native α-factor. For the series of analogs sub-
stituted with unnatural amino acids in the internal region
([Aib8]α-factor 8, [Aib11]α-factor 9, and [Orn6]α-factor 10),
Aib alterations resulted in 5 to 10-fold decrease in activity
compared to native α-factor, and alteration at position 8
caused an additional drop in activity. Substitution of Leu, a
hydrophobic amino acid, by positively charged Orn at
position 6 resulted in analog 10, which showed 7.0-fold
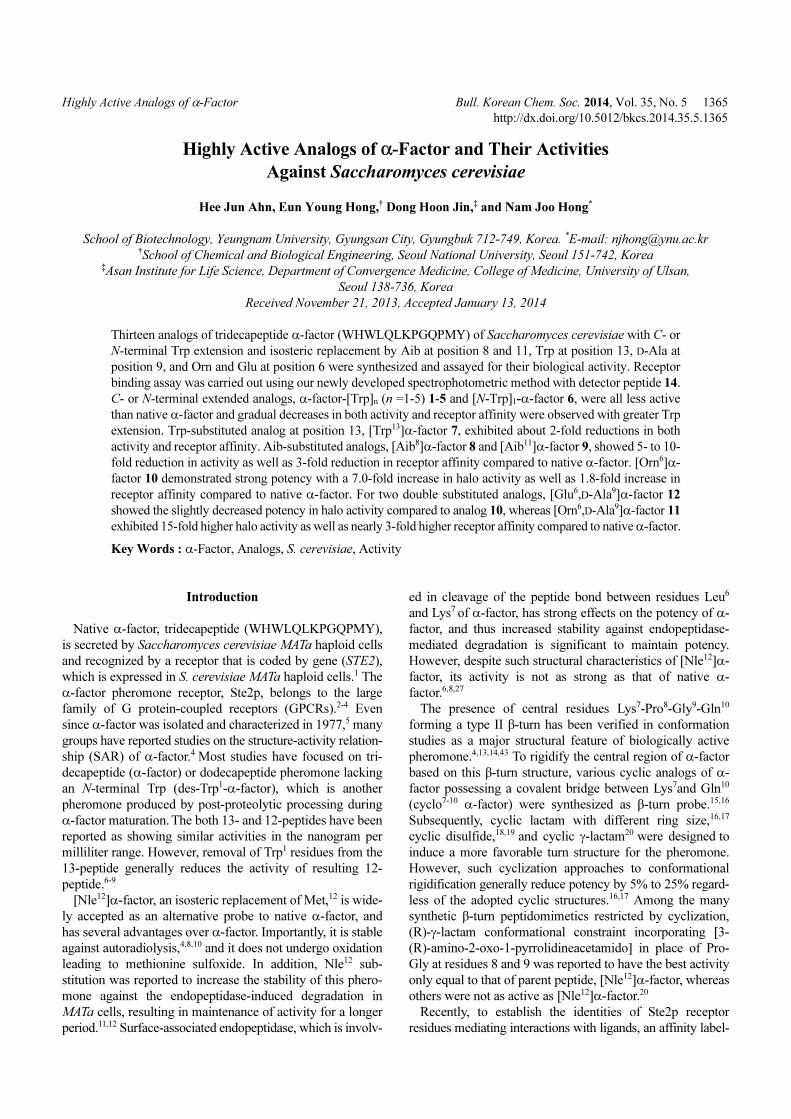
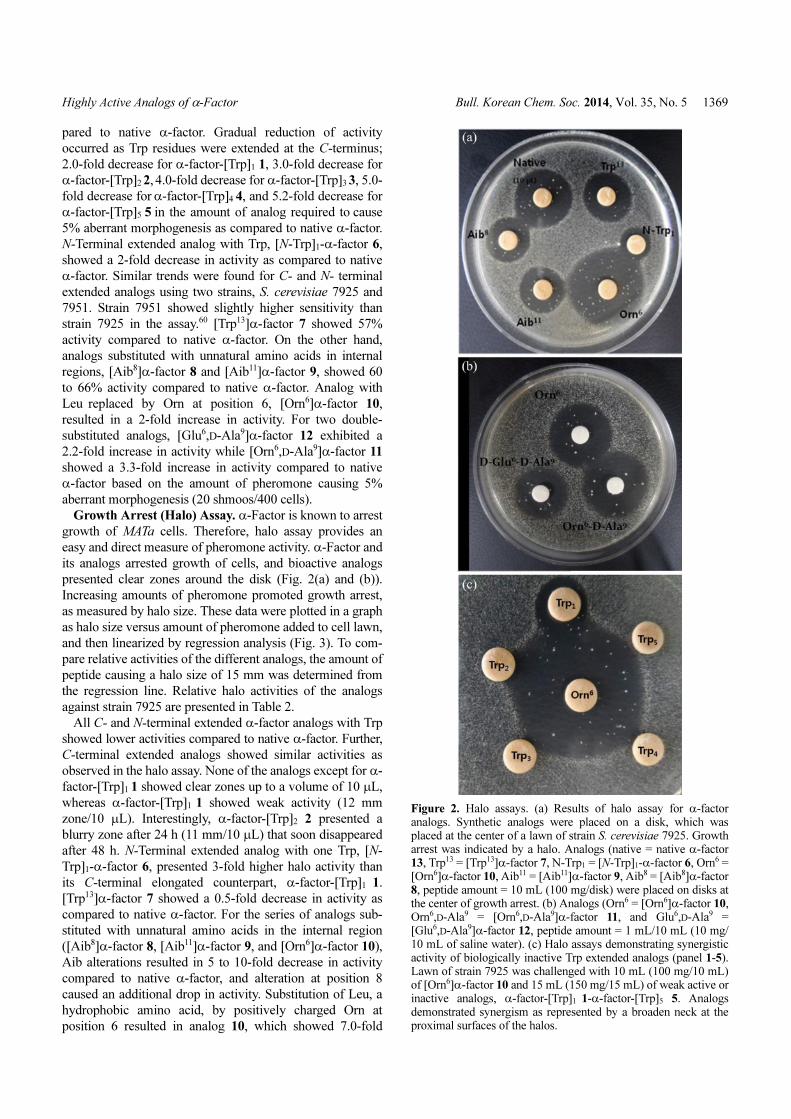
Figure 2. Halo assays. (a) Results of halo assay for α-factoranalogs. Synthetic analogs were placed on a disk, which wasplaced at the center of a lawn of strain S. cerevisiae 7925. Growtharrest was indicated by a halo. Analogs (native = native α-factor13, Trp13 = [Trp13]α-factor 7, N-Trp1 = [N-Trp]1-α-factor 6, Orn6 =[Orn6]α-factor 10, Aib11 = [Aib11]α-factor 9, Aib8 = [Aib8]α-factor8, peptide amount = 10 mL (100 mg/disk) were placed on disks atthe center of growth arrest. (b) Analogs (Orn6 = [Orn6]α-factor 10,Orn6,D-Ala9 = [Orn6,D-Ala9]α-factor 11, and Glu6,D-Ala9 =[Glu6,D-Ala9]α-factor 12, peptide amount = 1 mL/10 mL (10 mg/10 mL of saline water). (c) Halo assays demonstrating synergisticactivity of biologically inactive Trp extended analogs (panel 1-5).Lawn of strain 7925 was challenged with 10 mL (100 mg/10 mL)of [Orn6]α-factor 10 and 15 mL (150 mg/15 mL) of weak active orinactive analogs, α-factor-[Trp]1 1-α-factor-[Trp]5 5. Analogsdemonstrated synergism as represented by a broaden neck at theproximal surfaces of the halos.
1370 Bull. Korean Chem. Soc. 2014, Vol. 35, No. 5 Hee Jun Ahn et al.
higher activity in comparison with native α-factor in the
halo assay. For two double substituted analogs, [Orn6,D-
Ala9]α-factor 11 showed a 15-fold increase in activity while
[Glu6,D-Ala9]α-factor 12 exhibited a 6-fold increase in
activity compared to native α-factor based on a halo size of
15 mm.
Synergistic Effect of C-terminal Extended Analogs
with Trp. All five C-terminal extended Trp analogs (1-5)
were tested for antagonism or synergism (Fig. 2(c)). Three
of the analogs, α-factor-[Trp]3 3, α-factor-[Trp]4 4, and α-
factor-[Trp]5 5, were virtually devoid of activity while the
remaining two analogs, α-factor-[Trp]1 1 and α-factor-[Trp]2
2, were weakly active in the halo assay against strain 7925.
Therefore, we tested their synergistic effects to determine
whether or not the three inactive analogs (3-5) have intrinsic
halo activities. All five analogs (1-5) were placed on a lawn
of strain 7925 in close proximity to [Orn6]α-factor 10, and
all changes in the shape of the standard halo was noted. An
antagonistic response, as represented by a flattened halo,
was not detected. Instead, elongated halos of [Orn6]α-factor
10 toward the test analog-containing discs were observed for
all C-terminal extended analogs, as evidenced by a broaden-
ed neck at the proximal surface. This indicates that test
analogs (3-5) induced a synergistic effect or very weak
intrinsic activity. The size of broadened neck indicated the
relative potency of the competing analogs. Based on the
shape of the halo, activities gradually decreased as the
number of Trp residues increased.
Steady-state Saturation Binding with Detector, [Orn6]α-
factor-[Cys]3 14. For steady-state saturation binding, the
same procedure was performed as previously described,8
except that the S. cerevisiae strain used in the assay was
7925. Since a given number of cells are expected to possess
a finite number of receptors, saturation was assessed by
examining binding as a function of increasing detector con-
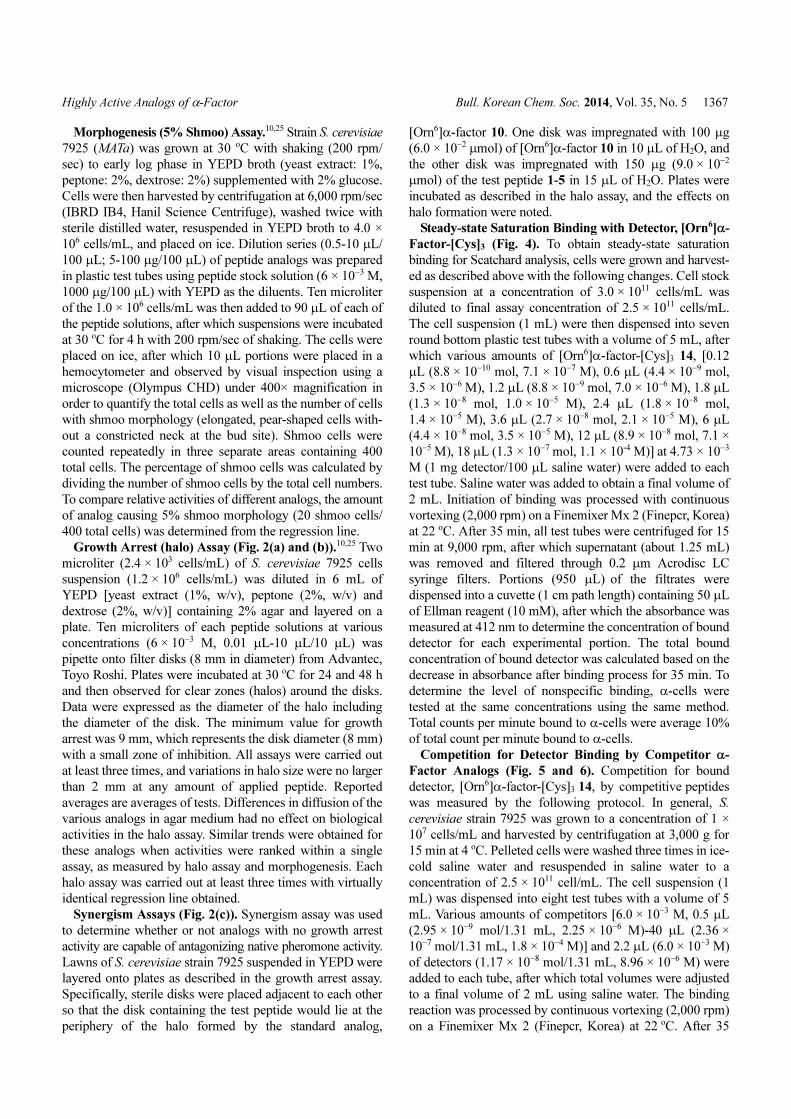
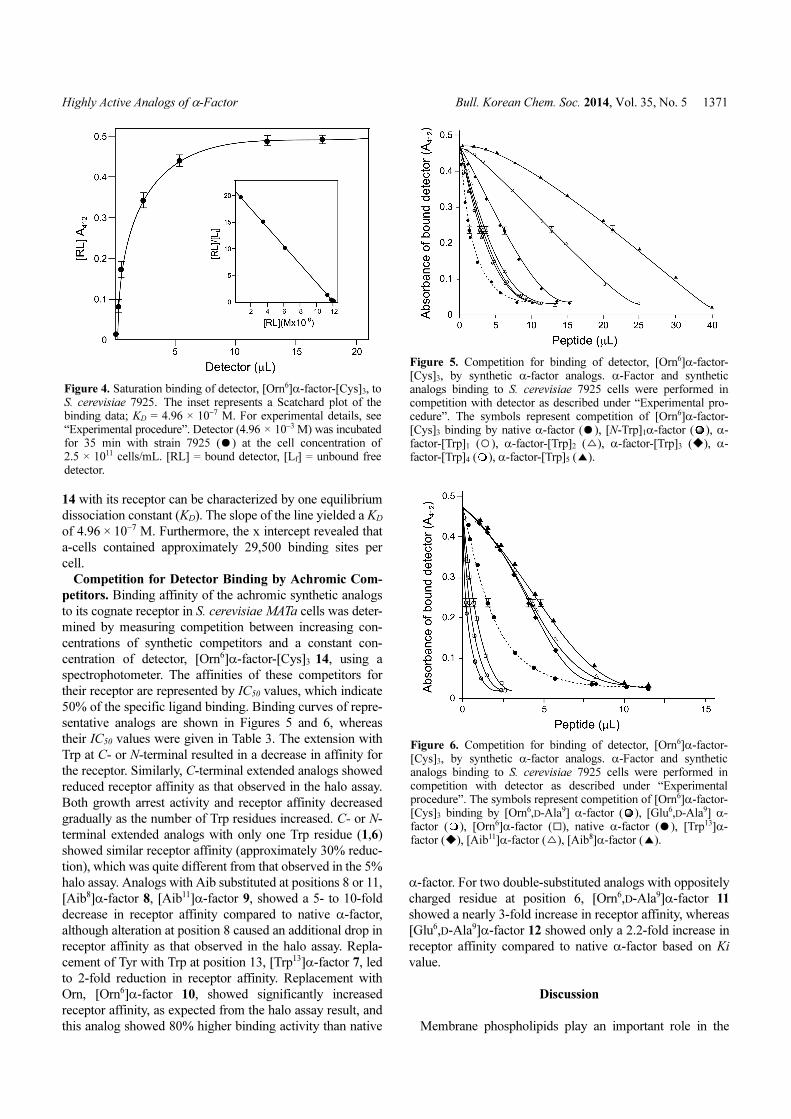
centration using 2.5 × 10¹¹ cells. A Scatchard plot was derived
from the saturation binding data (Fig. 4).8,59 The straight line
of the Scatchard plot indicates that the interaction of detector
Figure 3. Bioactivity of α-factor analogs by halo assay in S.
cerevisiae 7925. [Orn6,D-Ala9] α-factor ( ), [Orn6]α-factor ( ),[Glu6,D-Ala9]α-factor ( ), native α-factor ( ), [Trp13]α-factor( ), [Aib11]α-factor ( ), [Aib8]α-factor ( ), [N-Trp]1α-factor( ), α-factor-[Trp]1 ( ), α-factor-[Trp]2 ( ). No activity; α-factor-[Trp]3, α-factor-[Trp]4, α-factor-[Trp]5.
▼ ○
▽ ●
△ ▲
□ ◆
Table 2. Biological activity of α-factor analogs in S. cerevisiae 7925
No Peptide Shmooa
(μL/100 μL) Relative activity
Halob
(μL/15 mm) Relative activity
1 α-factor-[Trp]1 4.0 ± 0.2 50 32 ± 2 1
2 α-factor-[Trp]2 6.0 ± 0.2 33 90 ± 5 0.4
3 α-factor-[Trp]3 7.5 ± 0.2 27 NA NAc
4 α-factor-[Trp]4 9.5 ± 0.2 21 NA NA
5 α-factor-[Trp]5 10.5 ± 0.2 19 NA NA
6 [N-Trp]1-α-factor 4.0 ± 0.2 50 9.5 ± 1.0 3
7 [Trp13]α-factor 3.0 ± 0.2 57 0.70 ± 0.05 50
8 [Aib8]α-factor 3.5 ± 0.2 60 3.5 ± 0.3 10
9 [Aib11]α-factor 3.0 ± 0.2 66 1.6 ± 0.1 22
10 [Orn6]α-factor 1.0 ± 0.1 200 0.052 ± 0.005 700
11 [Orn6,D-Ala9]α-factor 0.6 ± 0.1 330 0.024 ± 0.002 1,500
12 [Glu6,D-Ala9]α-factor 0.9 ± 0.1 220 0.060 ± 0.005 600
13 native α-factor 2.0 ± 0.2 100 0.36 ± 0.03 100
aCell morphogenesis was determined by the formation of shmoo-shaped cells in response to peptide. Shmoo cells were counted separately at threediffernet areas containing 400 total cells. The percentage of shmoos was calculated by dividing total shmooing cells by total cells. To compare therelative activities of different analogs, the amount of analog causing 5% shmoo (20 shmoos/400 total cells) was determind from the regression line.bHalo assay as measured by the growth arrest. For each peptide (6 × 10⁻³ M), 0.01 μL (0.1 μg)-10 μL (100 μg) were spotted on discs which were placedupon YEPD plates containing S. cerevisiae 7925 (1.2 × 10⁶ cells). At 24 h, the zone of growth inhibition was determined by the halo diameter incentimeters. The size of the halo produced was plotted vs the amount of peptide tested (Fig. 3). The amount of the peptide required to produce a 15 mmhalo was determined from the first order regression line equation and used to compare the activities of the analogs relative to the native α-factor (0.36mL/15 mm). cNA = no activity
Highly Active Analogs of α-Factor Bull. Korean Chem. Soc. 2014, Vol. 35, No. 5 1371
14 with its receptor can be characterized by one equilibrium
dissociation constant (KD). The slope of the line yielded a KD
of 4.96 × 10⁻⁷ M. Furthermore, the x intercept revealed that
a-cells contained approximately 29,500 binding sites per
cell.
Competition for Detector Binding by Achromic Com-
petitors. Binding affinity of the achromic synthetic analogs
to its cognate receptor in S. cerevisiae MATa cells was deter-
mined by measuring competition between increasing con-
centrations of synthetic competitors and a constant con-
centration of detector, [Orn6]α-factor-[Cys]3 14, using a
spectrophotometer. The affinities of these competitors for
their receptor are represented by IC50 values, which indicate
50% of the specific ligand binding. Binding curves of repre-
sentative analogs are shown in Figures 5 and 6, whereas
their IC50 values were given in Table 3. The extension with
Trp at C- or N-terminal resulted in a decrease in affinity for
the receptor. Similarly, C-terminal extended analogs showed
reduced receptor affinity as that observed in the halo assay.
Both growth arrest activity and receptor affinity decreased
gradually as the number of Trp residues increased. C- or N-
terminal extended analogs with only one Trp residue (1,6)
showed similar receptor affinity (approximately 30% reduc-
tion), which was quite different from that observed in the 5%
halo assay. Analogs with Aib substituted at positions 8 or 11,
[Aib8]α-factor 8, [Aib11]α-factor 9, showed a 5- to 10-fold
decrease in receptor affinity compared to native α-factor,
although alteration at position 8 caused an additional drop in
receptor affinity as that observed in the halo assay. Repla-
cement of Tyr with Trp at position 13, [Trp13]α-factor 7, led
to 2-fold reduction in receptor affinity. Replacement with
Orn, [Orn6]α-factor 10, showed significantly increased
receptor affinity, as expected from the halo assay result, and
this analog showed 80% higher binding activity than native
α-factor. For two double-substituted analogs with oppositely
charged residue at position 6, [Orn6,D-Ala9]α-factor 11
showed a nearly 3-fold increase in receptor affinity, whereas
[Glu6,D-Ala9]α-factor 12 showed only a 2.2-fold increase in
receptor affinity compared to native α-factor based on Ki
value.
Discussion
Membrane phospholipids play an important role in the
Figure 4. Saturation binding of detector, [Orn6]α-factor-[Cys]3, toS. cerevisiae 7925. The inset represents a Scatchard plot of thebinding data; KD = 4.96 × 10⁻⁷ M. For experimental details, see“Experimental procedure”. Detector (4.96 × 10⁻³ M) was incubatedfor 35 min with strain 7925 ( ) at the cell concentration of2.5 × 1011 cells/mL. [RL] = bound detector, [Lf] = unbound freedetector.
●
Figure 5. Competition for binding of detector, [Orn6]α-factor-[Cys]3, by synthetic α-factor analogs. α-Factor and syntheticanalogs binding to S. cerevisiae 7925 cells were performed incompetition with detector as described under “Experimental pro-cedure”. The symbols represent competition of [Orn6]α-factor-[Cys]3 binding by native α-factor ( ), [N-Trp]1α-factor ( ), α-factor-[Trp]1 ( ), α-factor-[Trp]2 ( ), α-factor-[Trp]3 ( ), α-factor-[Trp]4 ( ), α-factor-[Trp]5 ( ).
●
○ △ ◆
▲
Figure 6. Competition for binding of detector, [Orn6]α-factor-[Cys]3, by synthetic α-factor analogs. α-Factor and syntheticanalogs binding to S. cerevisiae 7925 cells were performed incompetition with detector as described under “Experimentalprocedure”. The symbols represent competition of [Orn6]α-factor-[Cys]3 binding by [Orn6,D-Ala9] α-factor ( ), [Glu6,D-Ala9] α-factor ( ), [Orn6]α-factor ( ), native α-factor ( ), [Trp13]α-factor ( ), [Aib11]α-factor ( ), [Aib8]α-factor ( ).
□ ●
◆ △ ▲
1372 Bull. Korean Chem. Soc. 2014, Vol. 35, No. 5 Hee Jun Ahn et al.
receptor recognition process by peptide pheromones. It has
been reported that the physiological activity of α-factor
pheromone is closely correlated with affinity for the phos-
pholipid membrane.36-38 Since the target of α-factor is a
membrane-associated protein, Ste2p receptor, a certain type
of hydrophobic moiety attached to α-factor could aid phero-
mone localization to the target cell membrane, as do many
other hormone such as Ras protein,29,36-38 thereby leading to
increased probability of binding. However, integration of a
pheromone into the cellular lipid bilayer depends on the type
of modification applied.21,36-38 Alanine scanning study previ-
ously examined the roles of C- and N-terminal residues of α-
factor in pheromone activity and receptor binding affinity.10,39
According to the study, C-terminal residues contribute
strongly to binding to Ste2p receptor as well as G protein-
coupled receptor (GPCR) activation.40,41 On the other hand,
those near the N-terminus of α-factor are responsible for
triggering cell signaling through Ste2p or stabilizing the
activated state of this receptor.4,10,30,40,57 The two N-terminal
Trp residues at position 1 and 3 are the key residues in the
interaction between α-factor and the region of the receptor
that promotes stimulation of the pheromone-responsive G
protein pathway.30,40,41 In addition, two N-terminal Trp
residues preferentially insert into the cell membranes follow-
ing interaction of α-factor with the phospholipid mem-
brane.13,31 Based on the biological activity of lipopeptide
conjugates and the combined role of the two Trp residues,57
C-terminal extended analogs of α-factor with various
number of Trp residues can be used to study highly potent α-
factor analogs.
C-terminal extended synthetic α-factor analogs 1-5 were
all biologically active when tested against S. cerevisiae
7925. The relative potencies of C-terminal extended analogs
1-5 were all less active than that of native α-factor in both
the shmoo and halo assays employing S. cerevisiae 7925.
Their relative receptor affinities were also lower than that of
native α-factor. Further, their relative potencies and affinities
were clearly dependent on the number of Trp residues. The
relative affinity and potency of the C-terminal extended ana-
logs gradually decreased as number of Trp residues increased.
Analog with one or two Trp residues (1,2,6) showed a
similarly modest reduction in affinity (33% reduction) with
weak bioactivity. In contrast, analogs with three to five Trp
residues (3-5) showed negligible affinity values with no
bioactivity. A similar result was reported with single N-
terminal extension of Tyr.27 The activity profiles of the elon-
gated analogs suggest that α-factor receptor probably has a
restricted binding site that can accommodate up to two
additional residues at the C-terminus of tridecapeptide α-
factor. In addition, the observation that N-terminal extended
analog 6 showed almost three times higher activity com-
pared to C-terminal extended analog 1 indicates that the N-
terminal region plays a more important role in signal trans-
duction, thus supporting the previous finding that the N-
terminal region of α-factor is the major determinant of
signal transduction.4,10,42
Based on our results, we cannot conclude whether the
effects of Trp residue extension are due to increased lipid
membrane affinity and/or enhanced receptor stimulation. A
previous report found that dodecapeptide α-factor extended
at the C-terminus with non-amino acids such as polyethyl-
ene glycol (PEG) is neither active in morphogenesis assay
nor binding assay.4,49 Therefore, the fairly high affinity of C-
terminal extended analogs 1-6 ranging from 10% to 70%
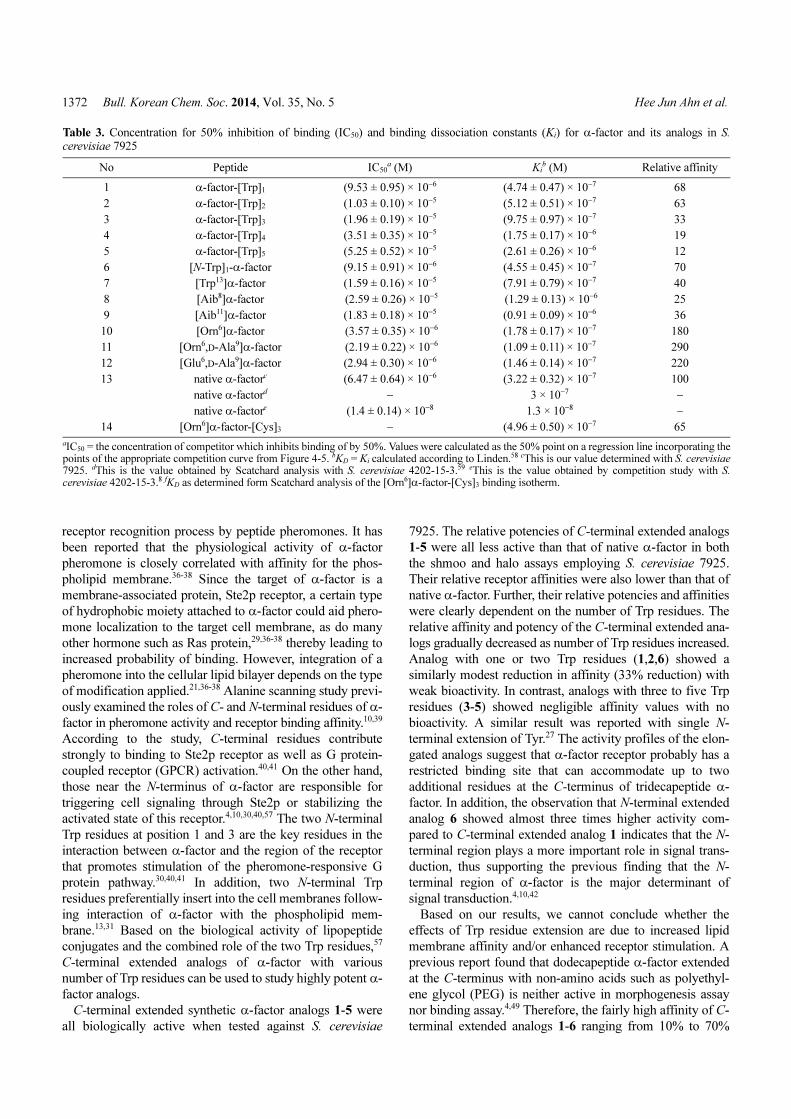
Table 3. Concentration for 50% inhibition of binding (IC50) and binding dissociation constants (Ki) for α-factor and its analogs in S.
cerevisiae 7925
No Peptide IC50a (M) Ki
b (M) Relative affinity
1 α-factor-[Trp]1 (9.53 ± 0.95) × 10−6 (4.74 ± 0.47) × 10−7 68
2 α-factor-[Trp]2 (1.03 ± 0.10) × 10−5 (5.12 ± 0.51) × 10−7 63
3 α-factor-[Trp]3 (1.96 ± 0.19) × 10−5 (9.75 ± 0.97) × 10−7 33
4 α-factor-[Trp]4 (3.51 ± 0.35) × 10−5 (1.75 ± 0.17) × 10−6 19
5 α-factor-[Trp]5 (5.25 ± 0.52) × 10−5 (2.61 ± 0.26) × 10−6 12
6 [N-Trp]1-α-factor (9.15 ± 0.91) × 10−6 (4.55 ± 0.45) × 10−7 70
7 [Trp13]α-factor (1.59 ± 0.16) × 10−5 (7.91 ± 0.79) × 10−7 40
8 [Aib8]α-factor (2.59 ± 0.26) × 10−5 (1.29 ± 0.13) × 10−6 25
9 [Aib11]α-factor (1.83 ± 0.18) × 10−5 (0.91 ± 0.09) × 10−6 36
10 [Orn6]α-factor (3.57 ± 0.35) × 10−6 (1.78 ± 0.17) × 10−7 180
11 [Orn6,D-Ala9]α-factor (2.19 ± 0.22) × 10−6 (1.09 ± 0.11) × 10−7 290
12 [Glu6,D-Ala9]α-factor (2.94 ± 0.30) × 10−6 (1.46 ± 0.14) × 10−7 220
13 native α-factorc (6.47 ± 0.64) × 10−6 (3.22 ± 0.32) × 10−7 100
native α-factord − 3 × 10⁻⁷ −
native α-factore (1.4 ± 0.14) × 10−8 1.3 × 10⁻⁸ −
14 [Orn6]α-factor-[Cys]3 − (4.96 ± 0.50) × 10−7 65
aIC50 = the concentration of competitor which inhibits binding of by 50%. Values were calculated as the 50% point on a regression line incorporating thepoints of the appropriate competition curve from Figure 4-5. bKD = Ki calculated according to Linden.58 cThis is our value determined with S. cerevisiae
7925. dThis is the value obtained by Scatchard analysis with S. cerevisiae 4202-15-3.59 eThis is the value obtained by competition study with S.
cerevisiae 4202-15-3.8 fKD as determined form Scatchard analysis of the [Orn6]α-factor-[Cys]3 binding isotherm.
Highly Active Analogs of α-Factor Bull. Korean Chem. Soc. 2014, Vol. 35, No. 5 1373
compared to that of native pheromone indicated that Trp
extension has certain additional effects upon receptor bind-
ing. These effects include penetration of the ligand toward
receptor site 1, which is the hydrophobic C-terminal binding
pocket surrounded by transmembrane domain helix bundles.
However, the observed negligible halo activity of less than
1% clearly indicates that the potentially favorable membrane
interaction could be dominated by potentially poorer
receptor binding caused by additional Trp residues.
Our observation that activity gradually decreased in pro-
portion to the increase in Trp residues does not correlate
with our expectation of either more facile intercalation of
Trp into the lipid bilayer or an active role for Trp in phero-
mone Ste2p receptor binding. The C-terminal residues of α-
factor are responsible for the transition from an inactive to
active state of the receptor form.30 Therefore, the ratio of
biological activity to receptor affinity (the dramatic decrease
in halo activity versus modest reduction in receptor affinity,
Tables 1 and 2 suggests that Trp extension may play negative
regulatory role in receptor isomerization. This results in the
relatively high population of the inactive state leading to a
remarkable change in halo activity.
A previous conformational study on ligand in the receptor-
bound state strongly suggested that a type II β-turn involving
residues Lys7-Gln10 in the center of α-factor is essential for
receptor binding and agonist efficacy.13,18,19,30,32 A study con-
cerning cyclic α-factor analog mimicking β-turn structure in
the center of α-factor provided additional proof that the
constrained structure of the center of α-factor is deeply
correlated with the potency of active analog.18-20,30,32,43 These
results show that the central β-turn near the receptor in the
lipid membrane promotes interaction of the ligand with two
sites in the receptor implicated in ligand binding (C-terminal
region) and triggering of G protein signal transduction (N-
terminal region).4,30 Aib is sterically hindered by dialkylated
side chains and thus its substitution generates a collapsed
turn structure effectively.34 Substituting Pro with Aib at
position 8 and 11 causes 90% and 80% decreases in halo
activity, respectively, as well as a 40% decrease in 5%
shmoo assay compared to the native α-factor. Therefore, the
dramatic reduction in activity strongly emphasizes critical
role of the β-turn structures for pheromone activity.
Des-Tyr13-α-factor, the deleted analog of Tyr at position
13, is 6-fold less active than native α-factor in shmoo assay
(data not shown).60 This supports an important role for Tyr13
in interaction with its receptor4,30 and the lipid membrane.13,31
According to previous studies,13,31 during ligand-receptor
recognition, Tyr directly binds to lipids and facilitates the
active conformation of the ligand (bent structure). This plays
a critical role in the high potency of α-factor. Only a 50%
reduction in halo activity was observed upon Trp replace-
ment at position 13, [Trp13]α-factor 7, whereas 60% reduc-
tion in affinity occurred. This was surprisingly modest, as
more than 90% reduction in halo activity was observed for
other analogs (1,2,6), along with 30% reductions in affinity.
This outcome clearly emphasizes more dominant role for the
aromatic ring of Tyr versus the hydroxyl group in triggering
isomerization of the receptor to an active state, resulting in
high bioactivity. However, these results indicate that the
hydroxyl group of Tyr at position 13 is necessary for effici-
ent receptor binding up to 60% affinity, supporting the
notion that the phenolic hydroxyl group of Tyr13 of α-factor
forms a hydrogen bond with the thiol group of Cys59 of TM1
near the extracellular face of the receptor pocket. This is
necessary for the subsequent stabilization of cation-π inter-
action between the Arg58 guanidinium moiety in TM1 and
the phenyl ring of Tyr13 of ligand.45
There are two cationic residues at positions 2 and 7, as
well as six hydrophobic residues at position 1, 3, 4, 6, 12,
and 13. Therefore, we examined the effects of ionic charge
on biological activity. As seen in Tables 1 and 2, alteration of
hydrophobic residue Leu6 to the charged residues Orn and
Glu (analogs 10-12) increased in halo activity with high
affinity compared to native α-factor 13. To investigate
whether the improved activities of the analogs (10-12) are
attributed to an increased proteolytic stability, we carried out
the time course for saturation binding study with detector,
[Orn6]α-factor-[Cys]3 14. The saturation of receptor was
completed by 30 min, after which the straight line of absor-
bance was remained for 2 h. This indicates no hydrolysis of
pheromone analogs by membrane associated peptidase. We
investigated whether the dramatic changes in activity and
affinity in response to charged residue substitution are due to
the resulting pheromone-receptor complex or membrane-
interaction. [Glu6,D-Ala9]α-factor 12 showed the significant
reductions in halo assay compared to [Orn6,D-Ala9]α-factor
11. This supports the specific pheromone interaction with
certain receptor site rather than a facilitated access to the
receptor assisted by more favorable membrane interaction
due to the additional charge.
We thoroughly examined synthetic analogs reported over
the last 30 years since native α-factor was first isolated.5 We
found that most synthetic analogs reported to date are far
less active than native α-factor, and only a few are about as
active as α-factor.4,42,43 As an explanation for this, previous
review on α-factor pheromone described that α-factor and
its receptor have evolved to have optimal complementarity.4
To our knowledge, [D-Ala9,Nle12]α-factor is the most active
analog with about 5-fold higher activity in halo assay,10,13
compared with its parent analog, [Nle12]α-factor. However,
D-Ala incorporated analog of native α-factor at the same
position, [D-Ala9]α-factor, was found to have activity com-
parable to that of native α-factor.13 This suggests that the
SAR and activity of [Nle12]α-factor are not similar to those
of native α-factor.6,27 Therefore, we reported activity values
of all analogs as determined by comparison of their activities
with that of native α-factor.
[Orn6]α-factor 10 exhibited a 7.0-fold increase in halo
activity and a 1.8-fold increase in receptor affinity as com-
pared with those of native tridecapeptide α-factor. Accord-
ingly, we synthesized two additional double substituted
analogs, [Orn6,D-Ala9]α-factor 11 and [Glu6,D-Ala9]α-factor
12, and measured their bioactivity as well as receptor
affinity. Negatively charged analog 12 exhibited slightly
1374 Bull. Korean Chem. Soc. 2014, Vol. 35, No. 5 Hee Jun Ahn et al.
decreased potencies in activity assay compared to analog 10,
whereas positively charged analog 11 showed a nearly 3-
fold higher affinity as well as 15-fold increased activity in
halo assay compared to those of native α-factor 13. Based on
these results, further studies on analogs 11, 12 are currently
underway. We expect that these analogs may serve as
important model compounds for future investigations into
the molecular basis of pheromone-GPCR interactions.
References
1. Dohlamn, H. G. Annu. Rev. Physiol. 2002, 64, 129. 2. Schoneberg, T.; Schulz, A.; Biebermann, H.; Hermsdorf, T.;
Rompler, H.; Sangkuhl, K. Pharmaco. Ther. 2004, 104, 173.
3. Klabunde, T.; Hessler, G. Chembiochem. 2002, 3, 928. 4. Naider, F.; Becker, J. M. Peptides 2004, 25, 1441.
5. Stotzler, D.; Duntze, W. Eur. J. Biochem. 1976, 65, 257.
6. Masui,Y.; Chino, N.; Sakakibara, S.; Tanaka, T.; Murakami, T.;Kita, H. Biochem. Biophys. Res. Commun. 1977, 78, 534.
7. Hong, N. J.; Park, Y. A. Peptide Science Present and Future,
Proceedings of the First International Peptide Symposium;Shimonishi, Y., Ed.; Kluwer Academic Publishers: Tokyo, Japan,
1999; p 467.
8. Raths, S. K.; Naider, F.; Becker, J. M. J. Biol. Chem. 1988, 263,17333.
9. Ciejek, E.; Thorner, J.; Geler, M. Biochem. Biophys. Res. Commun.
1977, 78, 952.10. Abel, M. G.; Zhang, Y, L.; Lu, H. F.; Naider, F.; Becker, J. M. J.
Pept. Res. 1998, 52, 95.
11. Ciejek, E.; Thorner, J. Cell 1979, 18, 623.12. Chan, R. K.; Otte, C. A. Mol. Cell. Biol. 1982, 2, 11.
13. Gounarides, J. S.; Broido, M. S.; Becker, J. M.; Naider, F.
Biochemistry 1993, 32, 908.
14. Jelicks, L. A.; Naider, F.; Shenbagamurthi, P.; Becker, J. M.;Broido, M. S. Biopolymer 1988, 27, 431.
15. Xue, C. B.; Eriotou-Bargiota, E.; Miller, D.; Becker, J. M.; Naider,
F. J. Biol. Chem. 1989, 264, 19161.16. Yang, W.; Mckinney, A.; Becker, J. M.; Naider, F. Biochemistry
1995, 34, 1308.
17. Antohi, O.; Marepalli, H. R.; Yang, W.; Becker, J. M.; Naider, F.Biopolymers 1998, 45, 21.
18. Albercio, F.; Hammer, R. P.; Garcia-Echeverria, C.; Molins, M.
A.; Chang, J. L.; Munson, M. C. Int. J. Pept. Prot. Res. 1991, 37,402.
19. Xue, C. B.; Mckinney, A.; Lu, H. F.; Jiang, Y.; Becker, J. M.;
Naider, F. Int. J. Pept. Prot. Res. 1996, 47, 131. 20. Zhang, Y. L.; Marepalli, H. R.; Lu, H. F.; Becker, J. M.; Naider, F.
Biochemistry 1998, 37, 12465.
21. Hong, N. J.; Jin, D. H.; Hong, E. Y. Bull. Korean Chem. Soc.2009, 30, 599.
22. Bernhart, A.; Drewello, M.; Schutkowski, M. J. Peptide Res.
1997, 50(2), 143.23. Hong, N. J. Bull. Korean Chem. Soc. 2010, 31, 874.
24. Kim, D. H.; Hong, N. J. Bull. Korean Chem. Soc. 2012, 33, 261.
25. Liu, S.; Henry, K.; Lee, B. K.;Wang, S. H.; Arshava, B.; Becker, J.M.; Naider, F. J. Pept. Res. 2000, 56, 24.
26. IUPAC-IUB Joint Commission on Biochemical Nomenclature J.
Biol. Chem. 1985, 260, 14. 27. Siegel, E. G.; Gunther, R.; Schafer, H.; Folsch, U. R.; Schmidt, W.
E. Anal. Biochem. 1999, 275, 109.
28. Kim, K. M.; Lee, Y. H.; Naider, F.; Uddin, M. S.; Akal-Strader,
A.; Hauser, M.; Becker, J. M. Pharm. Res. 2012, 65, 31. 29. Goodsell, D. S. Stem Cells 2004, 22, 119.
30. Mathew, E.; Bajaj, A.; Connelly, S. M.; Sargsyan, H.; Ding, F. X.;
Hajduczok, A. J.; Naider, F.; Dumont, M. E. J. Mol. Biol. 2011,409, 513.
31. Wakamatsu, K.; Okada, A.; Miyazawa, T.; Masui, Y.; Sakakibara,
S.; Higashijima, T. Eur. J. Biochem. 1987, 163, 331.32. Higashijima, T.; Masui, Y.; Chino, N.; Sakakibara, S.; Kita, H.;
Miyazawa, T. Eur. J. Biochem. 1984, 140, 163.
33. Dube, P.; DeCostanzo, A.; Konopka, J. B. J. Biol. Chem. 2000,275, 26492.
34. Banerjee, R.; Chattopadhyay, S.; Basu, G. Proteins 2009, 76, 184.
35. Masui, Y.; Tanaka, T.; Chino, N.; Kita, H.; Sakakibara, S. Biochem.Biophy. Res. Com. 1979, 86, 982.
36. Hruby, V. J. J. Pept. Res. 2005, 66, 309.
37. Veronese, F. M.; Schiavon, O.; Pasut, G.; Mendichi, R.; Andersson,L.; Tsirk, A.; Ford, J.; Wu, G.; Kneller, S.; Davies, J.; Duncan, R.
Bioconjugate Chem. 2005, 16, 775.
38. Banerjee, S.; Aher, N.; Patil, R.; Khandare, J. J. Drug Deliv. 2012,2012, 1.
39. Manfredi, J. P.; Klein, C.; Herrero, J. J.; Byrd, D. R.; Trueheart, J.;
Wiesler, W. T.; Fowlkes, D. M.; Broach, J. R. Mol. Cell. Biol.1996, 16, 4700.
40. Umanah, G. K.; Huang, L.Y.; Maccarone, J. M.; Nider, F.; Becker,
J. M. Biochemistry 2011, 50, 6841.41. Kim, K. M.; Lee, Y. H.; Naider, F.; Uddin, M. S.; Akal-Strader,
A.; Hauser, M.; Becker, J. M. Pharm. Res. 2012, 65, 31.
42. Naider, F.; Becker, J. M. CRC Crit. Rev. Biochem. 1986, 21(3),225.
43. Garbow, J. R.; Breslav, M.; Antohi, O.; Naider, F. Biochem. 1994,
33, 10094.44. Umanah, G. K.; Son, C.; Ding, F. X.; Naider, F.; Becker, J. M.
Biochem. 2009, 48, 2033.
45. Tantry, S.; Ding, F. X.; Dumont, M.; Becker, J. M.; Naider, F.Biochem. 2010, 49, 5007.
46. Zhang, Y. L.; Lu, H. F.; Becker, J. M.; Naider, F. J. Pept. Res.
1997, 50, 319.
47. Baffi, R. A.; Becker, J. M.; Lipke, P. N.; Naider, F. Biochem. 1985,24, 3332.
48. Khan, S. A.; Merkel, G. J.; Becker, J. M.; Naider, F. Int. J. Pept.
Res. 1981, 17, 219.49. Shenbagamurthi, P.; Baffi, R. A.; Khan, S. A.; Lipke, P.; Pousman,
C.; Becker, J. M.; Naider, F. Biochem. 1983, 22, 1298.
50. Baffi, R. A.; Shenbagamurthi, P.; terrance, K.; Becker, J. M.;Naider, F.; Lipke, P. N. J. Bact. 1984, 158, 1152.
51. Henry, L. K.; Khare, S.; Son, C.; Babu, V. V.; Naider, F.; Becker, J.
M. Biochem. 2002, 41, 6128.52. Dube, P.; DeCostanzo, A.; Konopka, J. B. J. Biol. Chem. 2000,
275, 26492.
53. Ding, F. X.; Lee, B. K.; Hauser, M.; Davenport, L.; Becker, J. M.;Naider, F. Biochem. 2001, 40, 1102.
54. Ding, F. X.; Lee, B. K.; Hauser, M.; Patri, R.; Arshava, B.; Becker,
J. M. J. Pept. Res. 2002, 60, 65.55. Son, C. D.; Sargsyan, H.; Naider, F.; Becker, J. M. Boichem. 2004,
43, 13193.
56. Son, C. D.; Sargsyan, H.; Hurst, G. B.; Naider, F.; Becker, J. M. J.Pept. 2005, 65, 418.
57. Hong, E. Y.; Hong, N. J. Bull. Korean Chem. Soc. 2013, 34, 600.
58. Linden, J. J. Cyclic Nucleotide Res. 1982, 8, 163.59. Jenness, D. D.; Burkholder, A. C.; Hartwell, L. H. Cell 1983, 35,
521.
60. Kim, D. H.; Hong, N. J. Ann. Meet. Kor. Soc. Biochem. Mol. Biol.2012; p 149.
Top Related