


γλώσσες
Σελίδες
Νομικός

Department of Chemical EngineeringMaster Thesis 2016
Nicklas Jönsson & Johan Karstensson
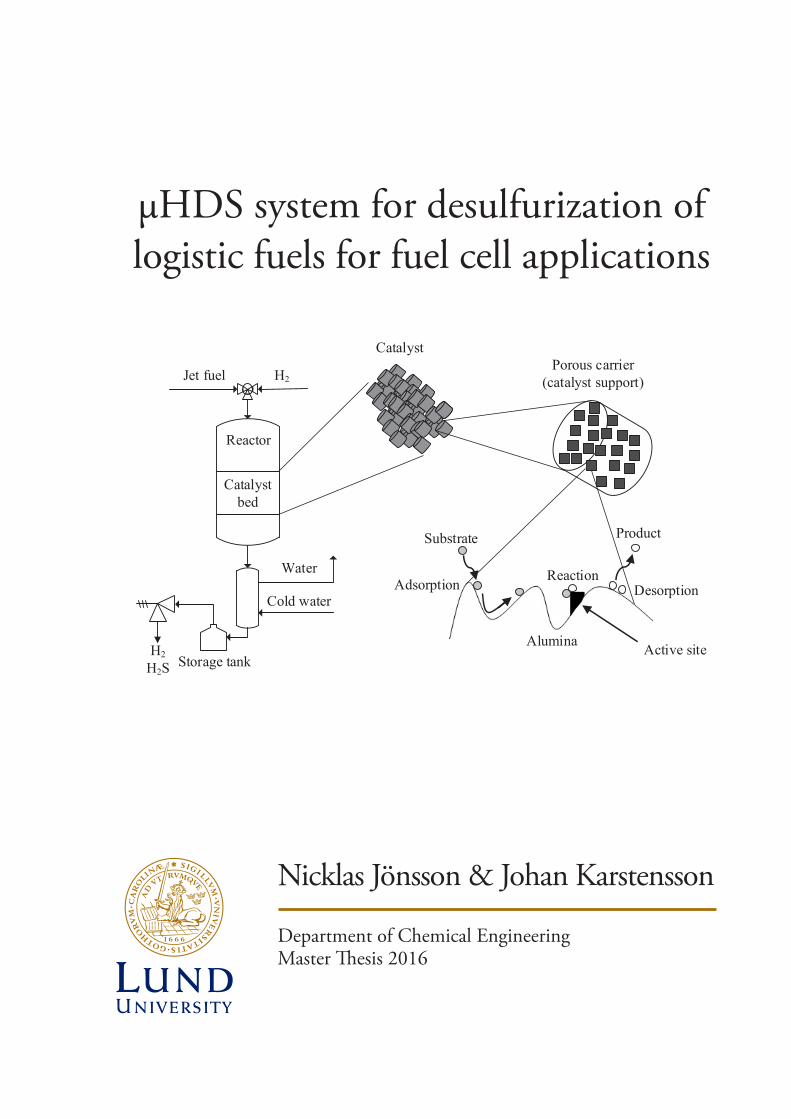
μHDS system for desulfurization of logistic fuels for fuel cell applications
CatalystPorous carrier
(catalyst support)
Reaction
Substrate
Adsorption Desorption
Alumina
Product
Active site
H2
Reactor
Catalyst bed
Cold water
Storage tankH2
H2S
Water
Jet fuel

Postal address Visiting address Telephone P.O. Box 124 Getingevägen 60 +46 46-222 82 85
SE-221 00 Lund, Sweden +46 46-222 00 00
Web address Telefax
www.chemeng.lth.se +46 46-222 45 26
µHDS system for desulfurization of lo-
gistic fuels for fuel cell applications
by
Nicklas Jönsson and Johan Karstensson
Department of Chemical Engineering
Lund University
October 2016
Supervisor: Associate Professor Christian Hulteberg
Co-supervisor: PhD Fredrik Silversand
Examiner: Professor Hans T. Karlsson


i
Preface
This master thesis was carried out at the Department of Chemical Engineering at Lund Univer-
sity and at Catator AB, in collaboration with FMV. We are grateful for having the opportunity
to be part of this exciting project.
Special thanks to Fredrik Silversand and Mikael Persson at Catator AB for all your help and
support during this project.
We also want to thank Christian Hulteberg, for your availability and valuable guidance, and
Hans T. Karlsson for your time in this project.
Furthermore, we would like to thank Tian, Putte, Fredrik Svensson, Mariano and Yasir for
brightening up the workday with fun conversations.
We remember Fredrik Silversand saying, on the subject of catalysis: “The farther into the woods
you go, the darker it gets”, which at that point felt striking. Though, we feel we might have
found the way out and managed to “see the light at the end of the tunnel”.

ii
iii
Abstract
Logistic fuels such as diesel and petrol, in which Jet A1 is included, are sulfur-containing fuels
used for transports. The main problem with logistic fuels, when used in fuel cell (FC) applica-
tions, is their relatively high concentration of sulfur compounds. The sulfur compounds might
poison the catalysts in all of the downstream processes, including the FC itself.
Hydrodesulfurization (HDS) is an industrial approach for effective desulfurization of fuels by
converting complicated organic sulfur compounds into hydrocarbons and hydrogen sulfide
(H2S), which in turn can be trapped in an adsorption cartridge. This thesis focused on a
miniaturization of said technology, i.e. a µHDS-system for logistic fuels, in small-scale fuel cell
systems.
The goal was to desulfurize Jet A1 for utilization in FC-applications. Through investigation and
evaluation of different catalysts and process parameters, a catalytic reactor system was devel-
oped. Desirable was to achieve a sulfur level below 10 ppm which is low enough for injection
into a FC.
The approach was to set up a micro-scale plug flow reactor (PFR) in which the effects of tem-
perature (260 °C – 450 °C), pressure (2 bar – 8 bar) and LHSV (1 h-1 – 4 h-1), on catalytic
activity, was investigated. Incipient wetness impregnation was used for the preparation of six
different catalysts, which were tested in said reactor. Detailed investigations were done on a
Pt/alumina (PPt-47, manufactured by Stonemill AB) catalyst as well as on a CoMo/alumina
catalyst impregnated with citric acid (CA). Their activity was determined based on the
conversion of thiophene and dibenzothiophene (DBT). As a final test, Jet A1 was desulfurized
using the same two catalysts.
CoMo-CA was consistently the better performing catalyst compared with PPt-47, reaching a
sulfur conversion of 98.2 %, compared to 93.2 % when tested with Jet A1 at the most severe
reactor settings. A sulfur level of 13.3 ppm was achieved with the CoMo-CA, applicable in a
high-temperature FC.

iv
v
Populärvetenskaplig sammanfattning µ-Avsvavlingssytem för jetbränsle till bränslecellsapplikationer. Bränsleceller är ett in-
tressant alternativ till förbränningsmotorer då bränsleceller har en högre effektivitet, är miljö-
vänligare samt tystare.
Bränslen som diesel, bensin samt det undersökta bränslet Jet A1, innehåller olika svårreage-
rade svavelföreningar. Problemet med bränslena är att de har ett relativt högt svavelinnehåll.
Svavelföreningarna riskerar att förgifta katalysatorerna i de nedströms kommande proces-
serna, inklusive bränslecellen själv, och måste därför avsvavlas.
Genom att omvandla komplicerade svavelföreningar till vätesulfid, som i sin tur tillfångatas i
en adsorptionspatron, är väteavsvavling ett effektivt industriellt tillvägagångssätt att avsvavla
på.
Syftet med detta examensarbete har varit att undersöka möjligheten att, på mikroskala, kataly-
tiskt avsvavla jetbränslet Jet A1, till en svavelhalt acceptabel för bränslecellsinmatning. Detta
har inneburit framtagning av en lämplig reaktor och optimering av reaktionsparametrar, till-
verkning och utvärdering av katalysatorer samt analys av produkt.
Reaktorsystemet var uppställt i en ugnsliknande omgivning. Reaktorn var omsluten av en vär-
mare i ett isolerat kärl och höll konstant temperatur. Samtliga katalysatorer prövades först vid
identiska processbetingelser för att jämföra deras inbördes aktivitet. De två bäst presterande
katalysatorerna i denna undersökning var CoMo-CA och PPt-47. CoMo-CA består av kobolt,
molybden och nickel, på en support av aluminiumoxid, och citronsyra användes för att opti-
mera spridningen av den aktiva fasen vid tillverkningen av katalysatorn. PPt-47 är en ädelme-
tallkatalysator bestående av endast platina på en support av aluminiumoxid. Denna tillverkas
av Stonemill AB.
Vidare användes dessa katalysatorer i detaljerade tester, som kördes på både tiofen och di-
bensotiofen (DBT), för att avgöra vilka processbetingelser som fungerade bäst. Sist ut testa-
des katalysatorernas förmåga att avsvavla Jet A1 vid ett skarpt försök.
Det högst uppmätta resultatet på Jet A1 var en omsättning av svavel på 98,2 %, vilket utfördes
vid de tuffaste processbetingelserna, med CoMo-CA katalysatorn. Sammanfattningsvis kan
det konstateras att CoMo-CA genomgående hade en högre svavelomsättning än PPt-47 samt
att en svavelhalt på 13,3 ppm uppnåddes. Denna halt är gångbar i en högtemperaturbränsle-
cell.

vi
vii
Table of Contents 1 Introduction 1
1.1 Overall process set-up – from logistic fuel to fuel cell applications 2
1.1.1 Logistic Fuels 2
1.1.2 Hydrotreating 3
1.1.3 Autothermal Reforming 3
1.1.4 Water-Gas Shift Reactor 4
1.1.5 Fuel cells 5
2 Hydrodesulfurization 9
2.1 Commercial HDS systems 9
2.2 Test reactors 11
2.3 Reactor gradients 13
2.4 HDS process parameters 13
2.5 H2S adsorption 15
3 Catalytic hydrotreating 19
3.1 The concept of heterogeneous catalysis 19
3.1.1 Catalyst manufacture 20
3.2 Chemistry and catalysis in HDS 21
3.2.1 Chemistry 21
3.2.2 Catalysis 24
3.2.3 Aspects on the choice of catalysts 26
4 Material and method 29
4.1 Catalysts 29
4.2 Reactors 30
4.2.1 Semi-batch Hydrodesulfurization system 30
4.2.2 PFR Hydrodesulfurization system 32
4.3 Fuels 34
4.4 Testing 35
4.5 Analysis 36
5 Results 37
6 Discussion 43
7 Conclusion 47
8 Future work 49
9 Reference list 51
10 Appendices 53

1
1 Introduction
The military shows interest in the use of fuel cells (FC) for various applications. FC’s are quiet,
have high energy efficiency and low weight, why they are highly interesting for a wider use.
Most fuels used by the military are a group of hydrocarbons called logistic fuels and can be
diesel, petrol and Jet A1. All of which have too high sulfur content and decomposes the sulfur
component into H2S, up to 3,000 ppm, to be used in FC applications. The fuel has to be
desulfurized for several reasons. Initially, stringent environmental regulations within EU [1, p.
80], prevention of catalyst poisoning, protection from corrosion and protection of downstream
processes [1, p. 77], [2, p. 1]. A common technique for sulfur removal is called hydrodesulfu-
rization (HDS), which saturates hydrocarbons with hydrogen. Next step in the chain, after hy-
drotreating, towards an injection of hydrogen to a FC is the removal of formed sulfur before
gas upgrading. FC’s among other applications are highly sensitive to sulfur and requires low
concentration, which normally must be below 1 ppm [2, p. 2]. Because of the good character-
istics that follow with a FC in combination with the easily accessible fuel, Jet A1, this led to a
cause for investigation.
Sulfur compounds in diesel contribute to environmental problems and EU have set standard
directives on maximum allowed sulfur content in exhaust gases. Since this directive from EU,
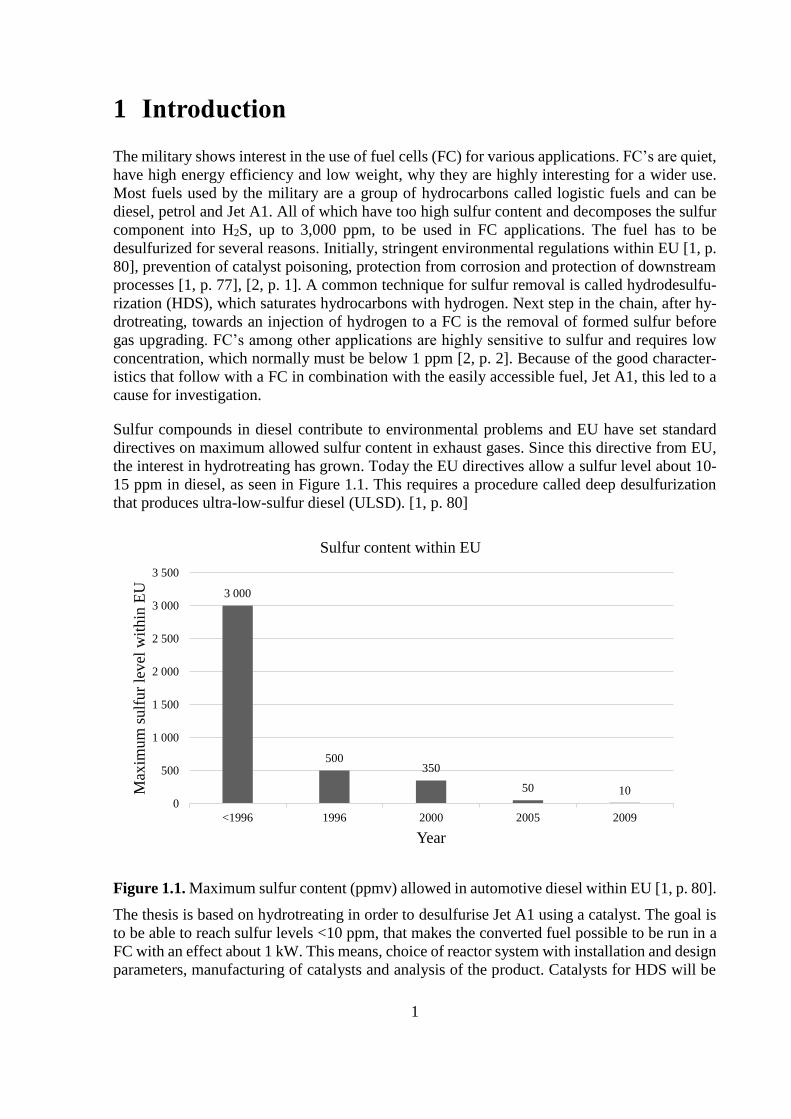
the interest in hydrotreating has grown. Today the EU directives allow a sulfur level about 10-
15 ppm in diesel, as seen in Figure 1.1. This requires a procedure called deep desulfurization
that produces ultra-low-sulfur diesel (ULSD). [1, p. 80]
Figure 1.1. Maximum sulfur content (ppmv) allowed in automotive diesel within EU [1, p. 80].
The thesis is based on hydrotreating in order to desulfurise Jet A1 using a catalyst. The goal is
to be able to reach sulfur levels <10 ppm, that makes the converted fuel possible to be run in a
FC with an effect about 1 kW. This means, choice of reactor system with installation and design
parameters, manufacturing of catalysts and analysis of the product. Catalysts for HDS will be
3 000
500350
50 100
500
1 000
1 500
2 000
2 500
3 000
3 500
<1996 1996 2000 2005 2009
Max
imum
sulf
ur
level
wit
hin
EU
Year
Sulfur content within EU
2
developed and tested on dodecane and paraffin. The most effective catalysts will be tried on Jet
A1.
Not only the catalysts itself affects the sulfur conversion. A test matrix with pressure, tempera-
ture, liquid hourly space velocity (LHSV) and hydrogen partial pressure will be studied to view
at which parameters the different catalysts had an optimum sulfur conversion. This involves
two steps, hydrodesulfurization, and H2S adsorption. The complete process can be seen below,
though, only the first was evaluated.
Catator AB was founded in 1990 by a group of researchers at Lund University in Sweden. It
quickly became a high-tech company in the field of catalysis and catalytic process design. Their
vision is to supply high-quality catalytic systems for efficient energy supply in various applica-
tions. This thesis was an assignment coming from the Swedish Defence Material Administration
(FMV) to Catator. FMV provides technology for Sweden's security. Their delivery is defence
logistics, which means that they, in collaboration with their key partner, the Swedish Armed
Forces, design and provide the military with defence materiel and services. Technology and
business expertise are their core competences.
1.1 Overall process set-up – from logistic fuel to fuel cell applications
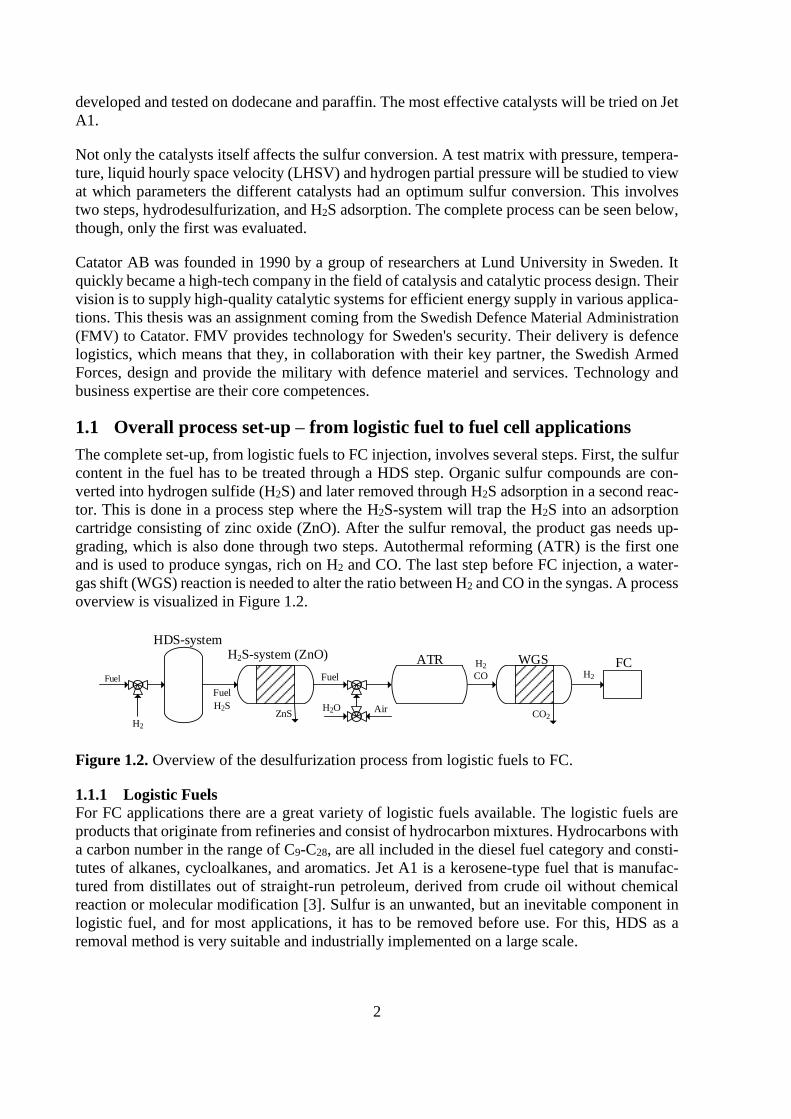
The complete set-up, from logistic fuels to FC injection, involves several steps. First, the sulfur
content in the fuel has to be treated through a HDS step. Organic sulfur compounds are con-
verted into hydrogen sulfide (H2S) and later removed through H2S adsorption in a second reac-
tor. This is done in a process step where the H2S-system will trap the H2S into an adsorption
cartridge consisting of zinc oxide (ZnO). After the sulfur removal, the product gas needs up-
grading, which is also done through two steps. Autothermal reforming (ATR) is the first one
and is used to produce syngas, rich on H2 and CO. The last step before FC injection, a water-
gas shift (WGS) reaction is needed to alter the ratio between H2 and CO in the syngas. A process
overview is visualized in Figure 1.2.
Fuel
H2S-system (ZnO) ATR WGS FC
HDS-system
H2
COFuel
Fuel
H2SZnS CO2
H2
AirH2O
H2
Figure 1.2. Overview of the desulfurization process from logistic fuels to FC.
1.1.1 Logistic Fuels
For FC applications there are a great variety of logistic fuels available. The logistic fuels are
products that originate from refineries and consist of hydrocarbon mixtures. Hydrocarbons with
a carbon number in the range of C9-C28, are all included in the diesel fuel category and consti-
tutes of alkanes, cycloalkanes, and aromatics. Jet A1 is a kerosene-type fuel that is manufac-
tured from distillates out of straight-run petroleum, derived from crude oil without chemical
reaction or molecular modification [3]. Sulfur is an unwanted, but an inevitable component in
logistic fuel, and for most applications, it has to be removed before use. For this, HDS as a
removal method is very suitable and industrially implemented on a large scale.
3
1.1.2 Hydrotreating
Oil fractions in general always contain fractions of unwanted components, especially sulfur,
nitrogen, oxygen and metals. These undesired compounds in the oil fractions have to be re-
moved, and this is done via a reductive treatment called hydrotreating. The main objective with
hydrotreating is simply to remove heteroatoms and, in general, it does not alter the molecular
size substantially. Hydrotreating can be divided into two categories, hydrogenation and hydro-
genolysis. Hydrogenation is generally performed by addition of hydrogen to double or triple
bonds (π-bonds) to saturate a compound. Hydrogenolysis, on the other hand, involves breaking
of the single bonds (γ-bonds), C-S or C-N etc. [1, p. 76]
Oil products can be purified before use for several reasons. Sulfur and nitrogen contribute to
air pollutions which lead to acid rain. Catalysts in processes downstream seldom tolerate any
presence of sulfur as it is poisoning for the catalyst as well as for the system. Since most oil
fractions must be hydrotreated, this has become one of the largest industrial breakthroughs in
industrial catalysis. [4, p. 2695]
The name of the hydrotreating process is determined by which heteroatom that is removed, S,
N, O or M (metal): hydrodesulfurization (HDS), hydrodenitrogenation (HDN), hydrodeoxy-
genation (HDO) and hydrodemetallization (HDM).
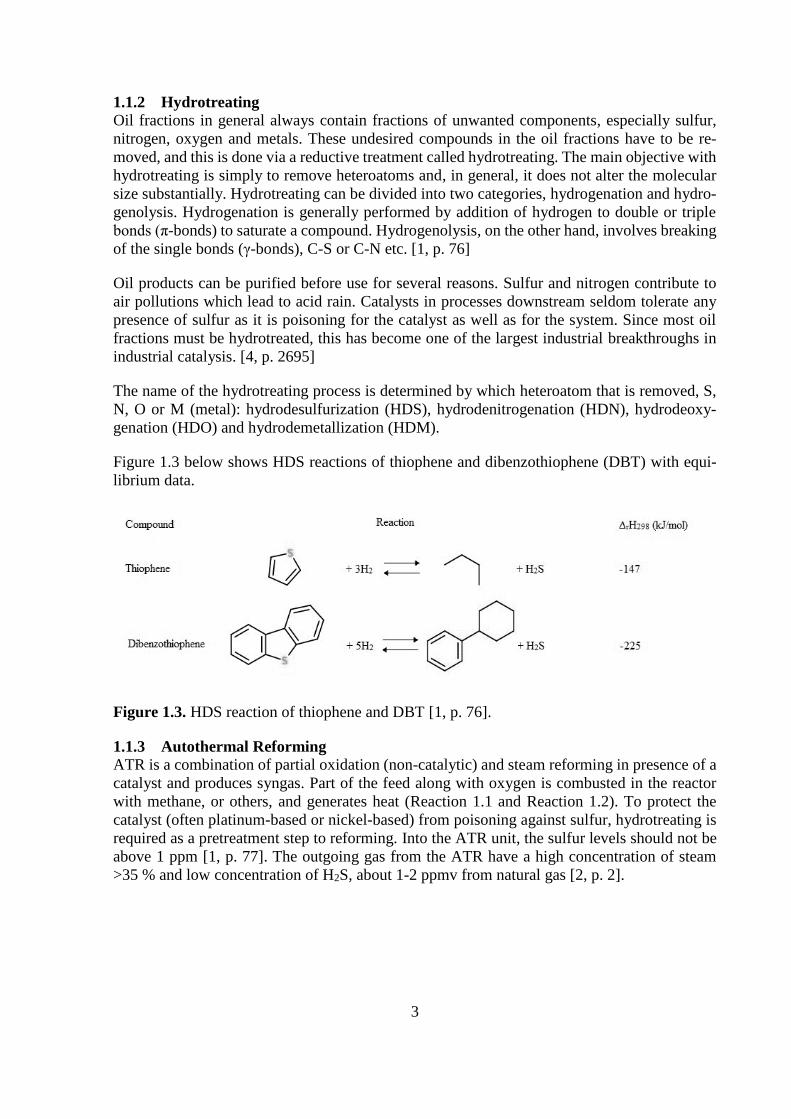
Figure 1.3 below shows HDS reactions of thiophene and dibenzothiophene (DBT) with equi-
librium data.
Figure 1.3. HDS reaction of thiophene and DBT [1, p. 76].
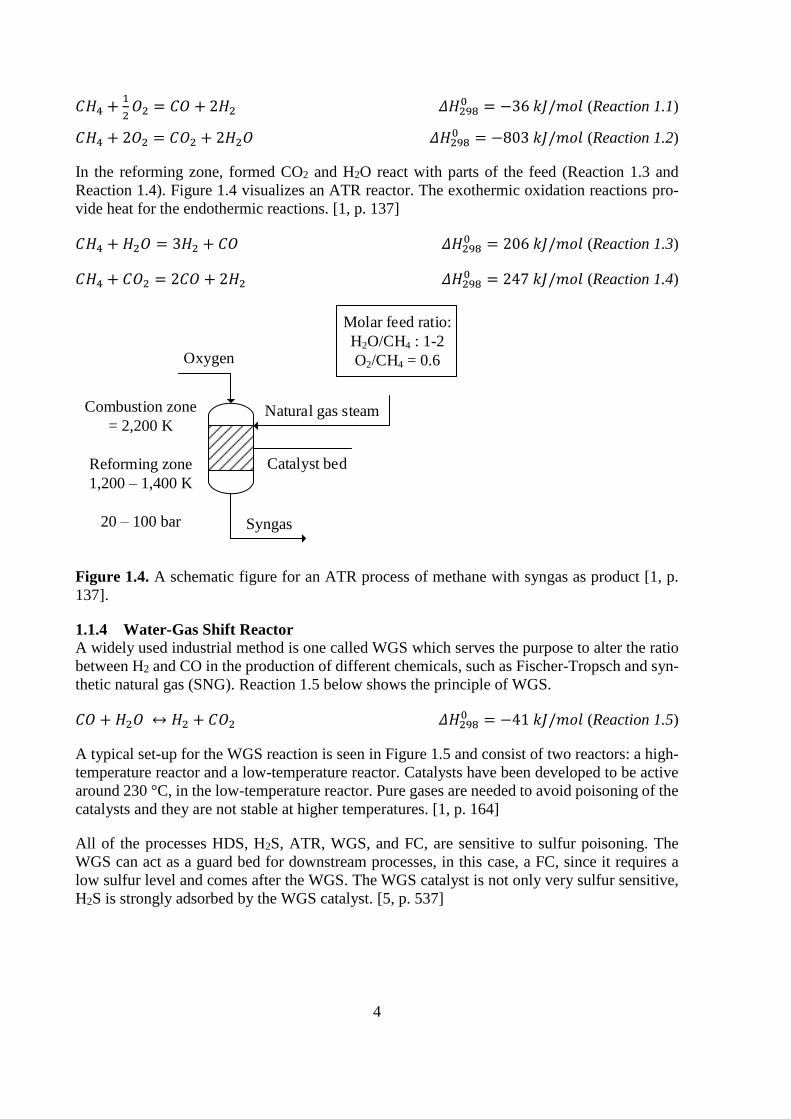
1.1.3 Autothermal Reforming
ATR is a combination of partial oxidation (non-catalytic) and steam reforming in presence of a
catalyst and produces syngas. Part of the feed along with oxygen is combusted in the reactor
with methane, or others, and generates heat (Reaction 1.1 and Reaction 1.2). To protect the
catalyst (often platinum-based or nickel-based) from poisoning against sulfur, hydrotreating is
required as a pretreatment step to reforming. Into the ATR unit, the sulfur levels should not be
above 1 ppm [1, p. 77]. The outgoing gas from the ATR have a high concentration of steam
>35 % and low concentration of H2S, about 1-2 ppmv from natural gas [2, p. 2].
4
𝐶𝐻4 +1
2𝑂2 = 𝐶𝑂 + 2𝐻2 𝛥𝐻298
0 = −36 𝑘𝐽/𝑚𝑜𝑙 (Reaction 1.1)
𝐶𝐻4 + 2𝑂2 = 𝐶𝑂2 + 2𝐻2𝑂 𝛥𝐻2980 = −803 𝑘𝐽/𝑚𝑜𝑙 (Reaction 1.2)
In the reforming zone, formed CO2 and H2O react with parts of the feed (Reaction 1.3 and
Reaction 1.4). Figure 1.4 visualizes an ATR reactor. The exothermic oxidation reactions pro-
vide heat for the endothermic reactions. [1, p. 137]
𝐶𝐻4 + 𝐻2𝑂 = 3𝐻2 + 𝐶𝑂 𝛥𝐻2980 = 206 𝑘𝐽/𝑚𝑜𝑙 (Reaction 1.3)
𝐶𝐻4 + 𝐶𝑂2 = 2𝐶𝑂 + 2𝐻2 𝛥𝐻2980 = 247 𝑘𝐽/𝑚𝑜𝑙 (Reaction 1.4)
Combustion zone
= 2,200 K
Reforming zone
1,200 – 1,400 K
20 – 100 bar
Oxygen
Natural gas steam
Molar feed ratio:
H2O/CH4 : 1-2
O2/CH4 = 0.6
Syngas
Catalyst bed
Figure 1.4. A schematic figure for an ATR process of methane with syngas as product [1, p.
137].
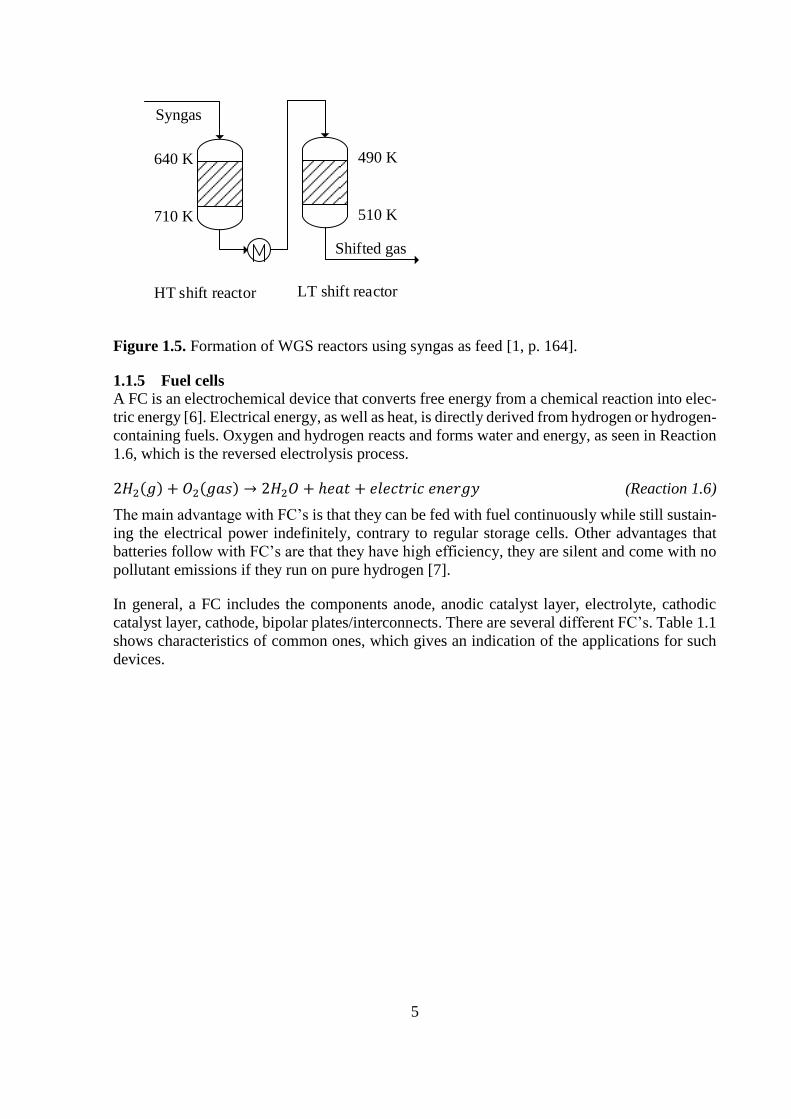
1.1.4 Water-Gas Shift Reactor
A widely used industrial method is one called WGS which serves the purpose to alter the ratio
between H2 and CO in the production of different chemicals, such as Fischer-Tropsch and syn-
thetic natural gas (SNG). Reaction 1.5 below shows the principle of WGS.
𝐶𝑂 + 𝐻2𝑂 ↔ 𝐻2 + 𝐶𝑂2 𝛥𝐻2980 = −41 𝑘𝐽/𝑚𝑜𝑙 (Reaction 1.5)
A typical set-up for the WGS reaction is seen in Figure 1.5 and consist of two reactors: a high-
temperature reactor and a low-temperature reactor. Catalysts have been developed to be active
around 230 °C, in the low-temperature reactor. Pure gases are needed to avoid poisoning of the
catalysts and they are not stable at higher temperatures. [1, p. 164]
All of the processes HDS, H2S, ATR, WGS, and FC, are sensitive to sulfur poisoning. The
WGS can act as a guard bed for downstream processes, in this case, a FC, since it requires a
low sulfur level and comes after the WGS. The WGS catalyst is not only very sulfur sensitive,
H2S is strongly adsorbed by the WGS catalyst. [5, p. 537]
5
490 K
510 K
LT shift reactor
Syngas
640 K
710 K
HT shift reactor
Shifted gas
Figure 1.5. Formation of WGS reactors using syngas as feed [1, p. 164].
1.1.5 Fuel cells
A FC is an electrochemical device that converts free energy from a chemical reaction into elec-
tric energy [6]. Electrical energy, as well as heat, is directly derived from hydrogen or hydrogen-
containing fuels. Oxygen and hydrogen reacts and forms water and energy, as seen in Reaction
1.6, which is the reversed electrolysis process.
2𝐻2(𝑔) + 𝑂2(𝑔𝑎𝑠) → 2𝐻2𝑂 + ℎ𝑒𝑎𝑡 + 𝑒𝑙𝑒𝑐𝑡𝑟𝑖𝑐 𝑒𝑛𝑒𝑟𝑔𝑦 (Reaction 1.6)
The main advantage with FC’s is that they can be fed with fuel continuously while still sustain-
ing the electrical power indefinitely, contrary to regular storage cells. Other advantages that
batteries follow with FC’s are that they have high efficiency, they are silent and come with no
pollutant emissions if they run on pure hydrogen [7].
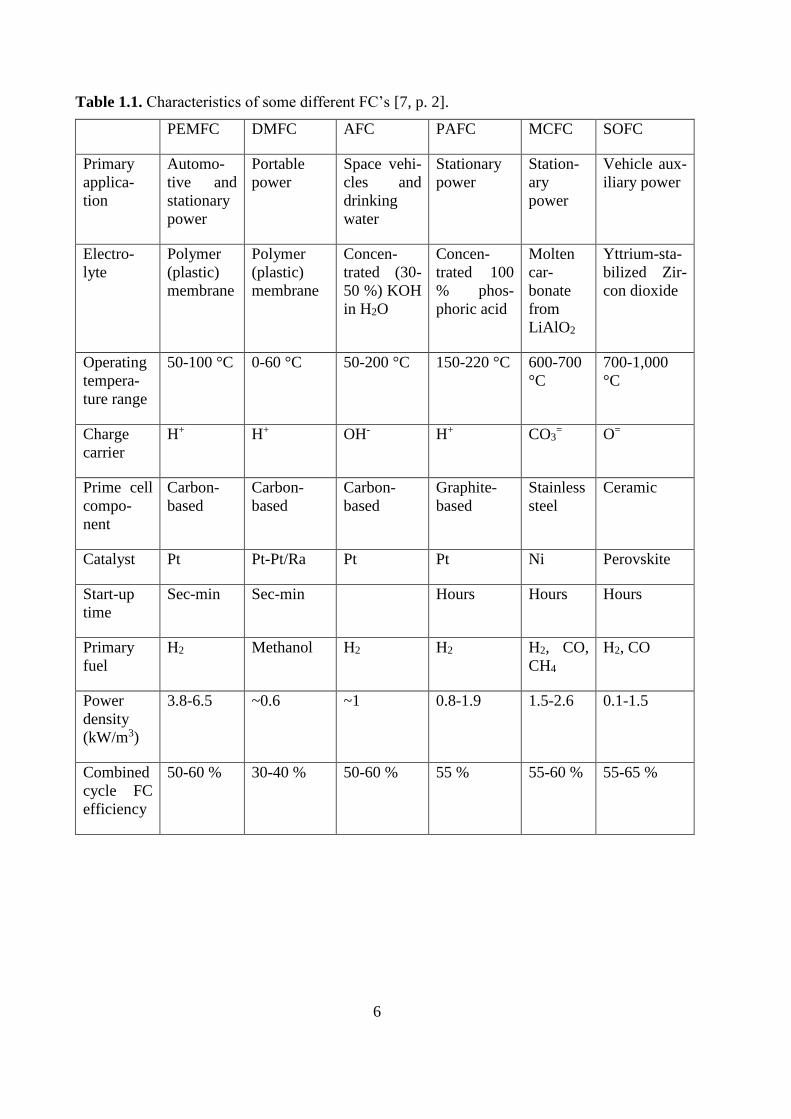
In general, a FC includes the components anode, anodic catalyst layer, electrolyte, cathodic
catalyst layer, cathode, bipolar plates/interconnects. There are several different FC’s. Table 1.1
shows characteristics of common ones, which gives an indication of the applications for such
devices.
6
Table 1.1. Characteristics of some different FC’s [7, p. 2].
PEMFC DMFC AFC PAFC MCFC SOFC
Primary
applica-
tion
Automo-
tive and
stationary
power
Portable
power
Space vehi-
cles and
drinking
water
Stationary
power
Station-
ary
power
Vehicle aux-
iliary power
Electro-
lyte
Polymer
(plastic)
membrane
Polymer
(plastic)
membrane
Concen-
trated (30-
50 %) KOH
in H2O
Concen-
trated 100
% phos-
phoric acid
Molten
car-
bonate
from
LiAlO2
Yttrium-sta-
bilized Zir-
con dioxide
Operating
tempera-
ture range
50-100 °C 0-60 °C 50-200 °C 150-220 °C 600-700
°C
700-1,000
°C
Charge
carrier
H+ H+ OH- H+ CO3= O=
Prime cell
compo-
nent
Carbon-
based
Carbon-
based
Carbon-
based
Graphite-
based
Stainless
steel
Ceramic
Catalyst Pt Pt-Pt/Ra Pt Pt Ni Perovskite
Start-up
time
Sec-min Sec-min Hours Hours Hours
Primary
fuel
H2 Methanol H2 H2 H2, CO,
CH4
H2, CO
Power
density
(kW/m3)
3.8-6.5 ~0.6 ~1 0.8-1.9 1.5-2.6 0.1-1.5
Combined
cycle FC
efficiency
50-60 % 30-40 % 50-60 % 55 % 55-60 % 55-65 %
7
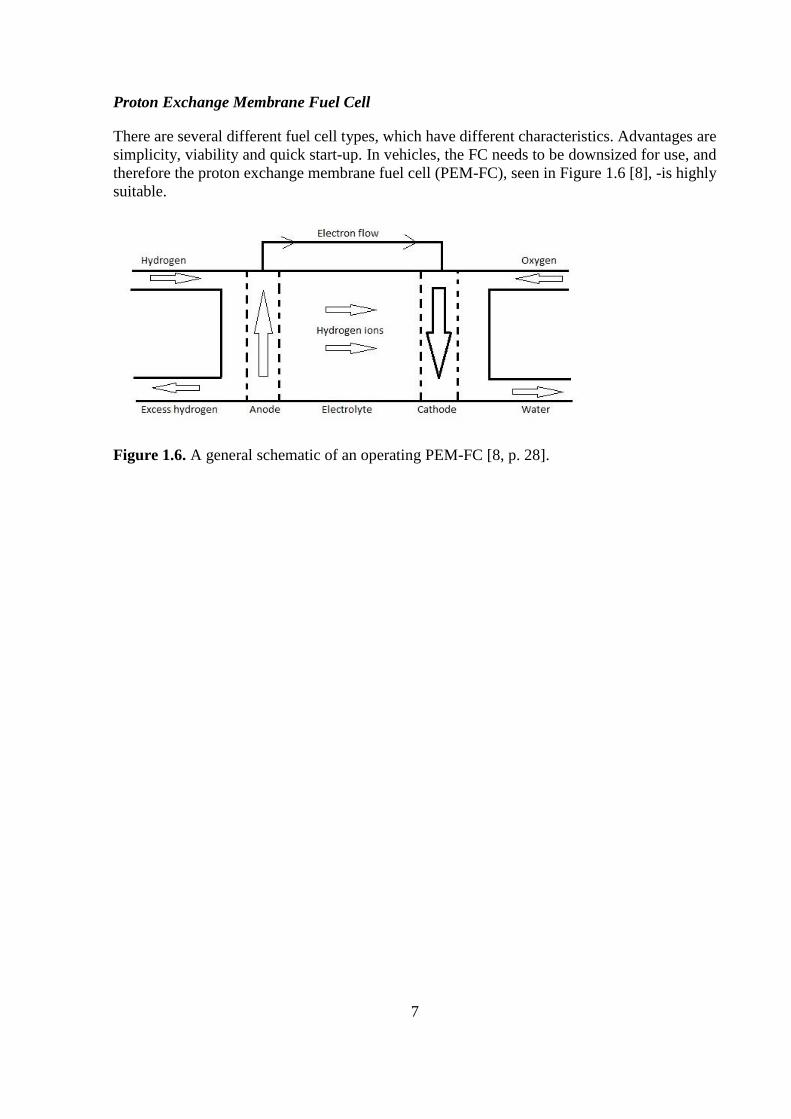
Proton Exchange Membrane Fuel Cell
There are several different fuel cell types, which have different characteristics. Advantages are
simplicity, viability and quick start-up. In vehicles, the FC needs to be downsized for use, and
therefore the proton exchange membrane fuel cell (PEM-FC), seen in Figure 1.6 [8], -is highly
suitable.
Figure 1.6. A general schematic of an operating PEM-FC [8, p. 28].

8
9
2 Hydrodesulfurization
2.1 Commercial HDS systems
There are several commercial and implemented systems for hydrodesulfurization of organo-
sulfur compounds. Basic schematics and principles for three large operators are presented in
this section. Though, the process parameters differ widely from the catalyst optimization reac-
tors. Most significantly, the HDS are performed using a lot higher pressures. The temperature
chosen depends more on the compound that is desulfurized. Too high temperatures, about
>500 °C and above, for too long could cause risk for coking. Coking causes undesired phe-
nomena’s such as reduced heat transfer rates, increased pressure drop and lower yields [1, p.
110].
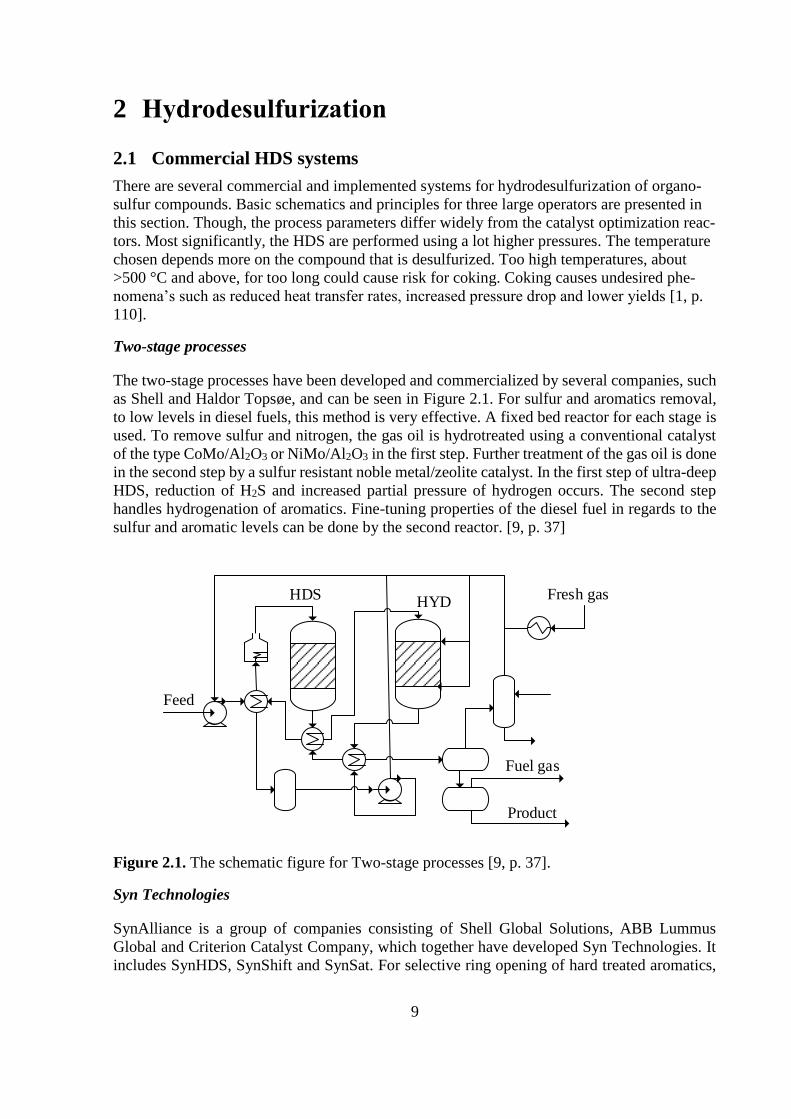
Two-stage processes
The two-stage processes have been developed and commercialized by several companies, such
as Shell and Haldor Topsøe, and can be seen in Figure 2.1. For sulfur and aromatics removal,
to low levels in diesel fuels, this method is very effective. A fixed bed reactor for each stage is
used. To remove sulfur and nitrogen, the gas oil is hydrotreated using a conventional catalyst
of the type CoMo/Al2O3 or NiMo/Al2O3 in the first step. Further treatment of the gas oil is done
in the second step by a sulfur resistant noble metal/zeolite catalyst. In the first step of ultra-deep
HDS, reduction of H2S and increased partial pressure of hydrogen occurs. The second step
handles hydrogenation of aromatics. Fine-tuning properties of the diesel fuel in regards to the
sulfur and aromatic levels can be done by the second reactor. [9, p. 37]
HYDHDS
Product
Fuel gas
Fresh gas
Feed
Figure 2.1. The schematic figure for Two-stage processes [9, p. 37].
Syn Technologies
SynAlliance is a group of companies consisting of Shell Global Solutions, ABB Lummus
Global and Criterion Catalyst Company, which together have developed Syn Technologies. It
includes SynHDS, SynShift and SynSat. For selective ring opening of hard treated aromatics,
10
SynShift is developed to decrease density, improve cetane number, and reduce aromatics con-
tent. SynSat is developed for saturation of aromatics, providing added density reduction and
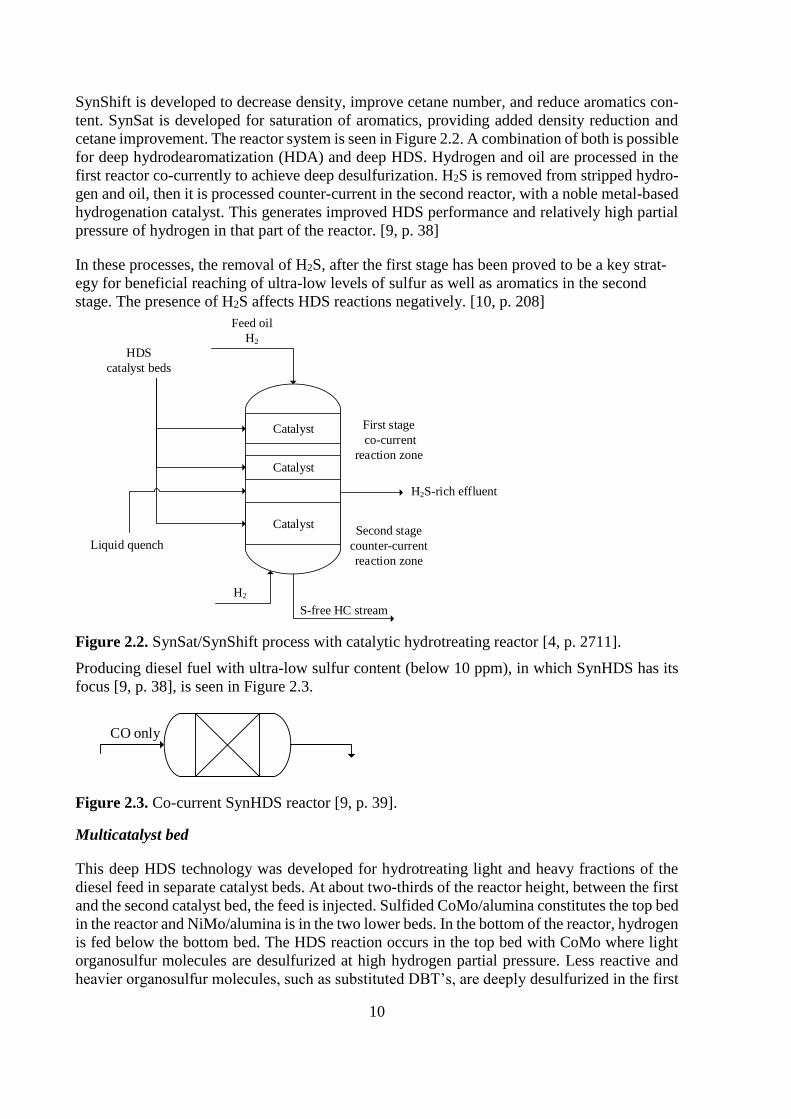
cetane improvement. The reactor system is seen in Figure 2.2. A combination of both is possible
for deep hydrodearomatization (HDA) and deep HDS. Hydrogen and oil are processed in the
first reactor co-currently to achieve deep desulfurization. H2S is removed from stripped hydro-
gen and oil, then it is processed counter-current in the second reactor, with a noble metal-based
hydrogenation catalyst. This generates improved HDS performance and relatively high partial
pressure of hydrogen in that part of the reactor. [9, p. 38]
In these processes, the removal of H2S, after the first stage has been proved to be a key strat-
egy for beneficial reaching of ultra-low levels of sulfur as well as aromatics in the second
stage. The presence of H2S affects HDS reactions negatively. [10, p. 208]
First stage
co-current
reaction zone
Second stage
counter-current
reaction zone
Feed oil
H2
Catalyst
HDS
catalyst beds
Catalyst
Catalyst
Liquid quench
H2
S-free HC stream
H2S-rich effluent
Figure 2.2. SynSat/SynShift process with catalytic hydrotreating reactor [4, p. 2711].
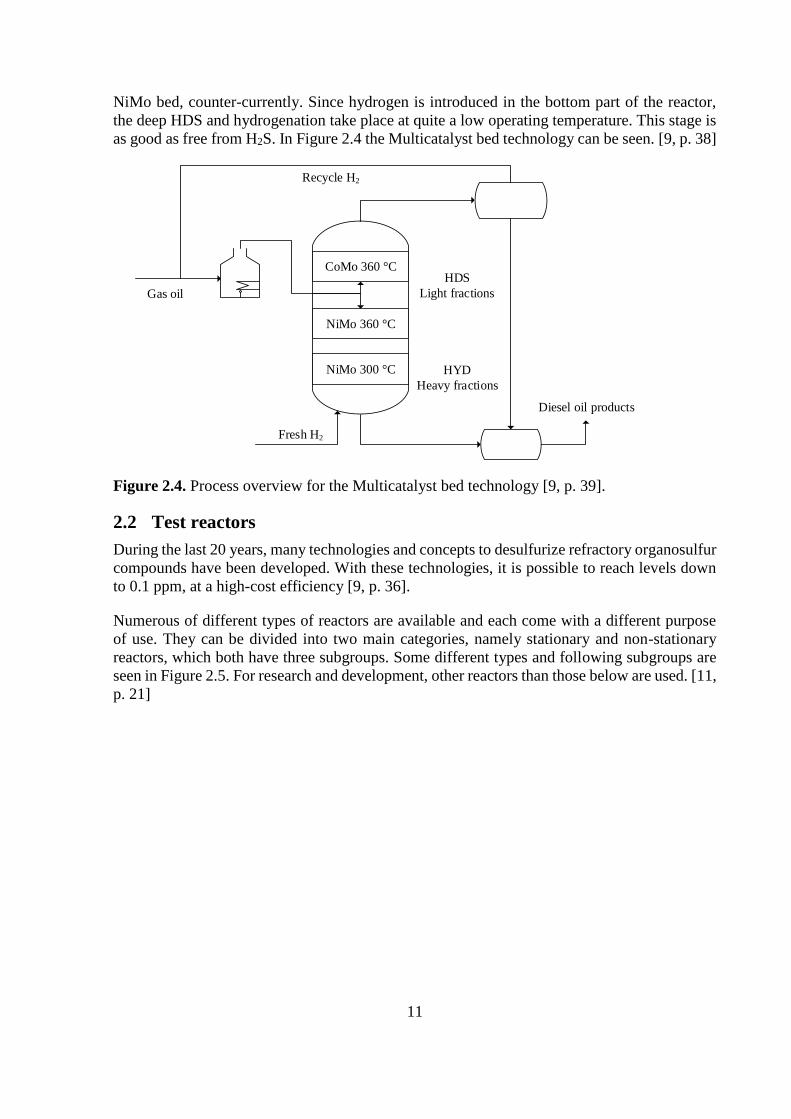
Producing diesel fuel with ultra-low sulfur content (below 10 ppm), in which SynHDS has its
focus [9, p. 38], is seen in Figure 2.3.
CO only
Figure 2.3. Co-current SynHDS reactor [9, p. 39].
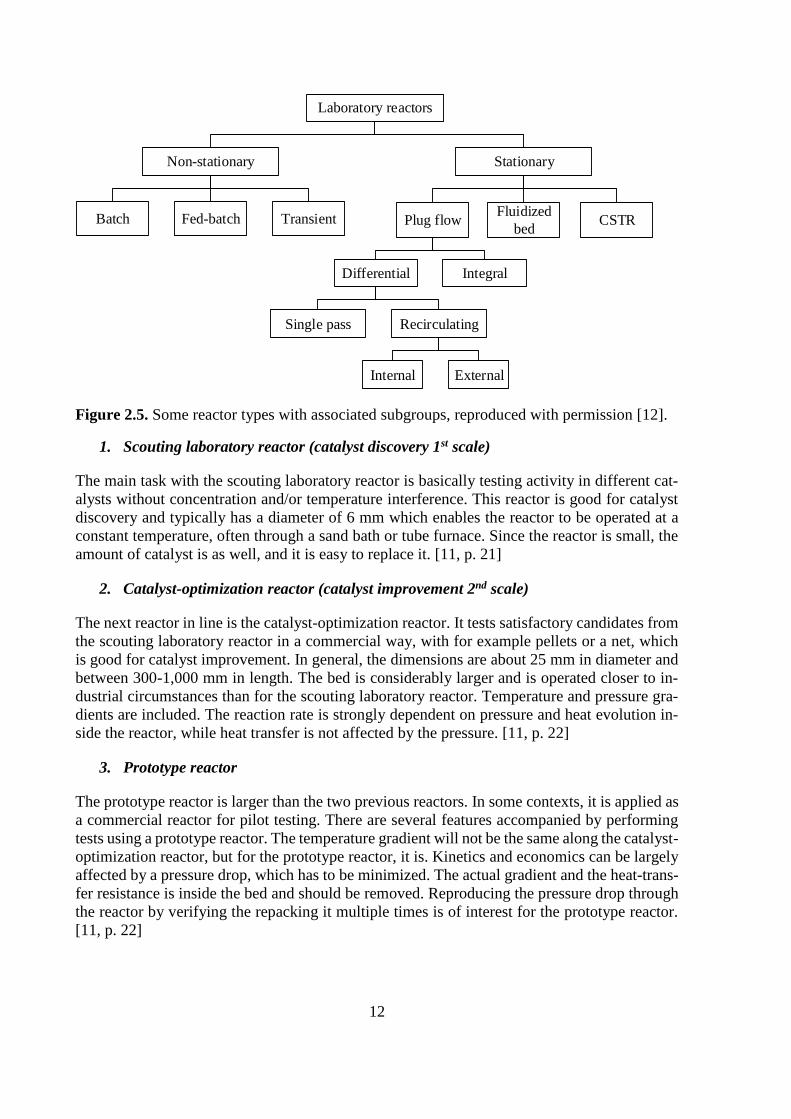
Multicatalyst bed
This deep HDS technology was developed for hydrotreating light and heavy fractions of the
diesel feed in separate catalyst beds. At about two-thirds of the reactor height, between the first
and the second catalyst bed, the feed is injected. Sulfided CoMo/alumina constitutes the top bed
in the reactor and NiMo/alumina is in the two lower beds. In the bottom of the reactor, hydrogen
is fed below the bottom bed. The HDS reaction occurs in the top bed with CoMo where light
organosulfur molecules are desulfurized at high hydrogen partial pressure. Less reactive and
heavier organosulfur molecules, such as substituted DBT’s, are deeply desulfurized in the first
11
NiMo bed, counter-currently. Since hydrogen is introduced in the bottom part of the reactor,
the deep HDS and hydrogenation take place at quite a low operating temperature. This stage is
as good as free from H2S. In Figure 2.4 the Multicatalyst bed technology can be seen. [9, p. 38]
HDS
Light fractions
HYD
Heavy fractions
CoMo 360 °C
NiMo 360 °C
NiMo 300 °C
Gas oil
Fresh H2
Diesel oil products
Recycle H2
Figure 2.4. Process overview for the Multicatalyst bed technology [9, p. 39].
2.2 Test reactors
During the last 20 years, many technologies and concepts to desulfurize refractory organosulfur
compounds have been developed. With these technologies, it is possible to reach levels down
to 0.1 ppm, at a high-cost efficiency [9, p. 36].
Numerous of different types of reactors are available and each come with a different purpose
of use. They can be divided into two main categories, namely stationary and non-stationary
reactors, which both have three subgroups. Some different types and following subgroups are
seen in Figure 2.5. For research and development, other reactors than those below are used. [11,
p. 21]
12
Laboratory reactors
Non-stationary Stationary
Fluidized
bedPlug flow CSTRBatch Fed-batch Transient
Differential
RecirculatingSingle pass
Internal
Integral
External
Figure 2.5. Some reactor types with associated subgroups, reproduced with permission [12].
1. Scouting laboratory reactor (catalyst discovery 1st scale)
The main task with the scouting laboratory reactor is basically testing activity in different cat-
alysts without concentration and/or temperature interference. This reactor is good for catalyst
discovery and typically has a diameter of 6 mm which enables the reactor to be operated at a
constant temperature, often through a sand bath or tube furnace. Since the reactor is small, the
amount of catalyst is as well, and it is easy to replace it. [11, p. 21]
2. Catalyst-optimization reactor (catalyst improvement 2nd scale)
The next reactor in line is the catalyst-optimization reactor. It tests satisfactory candidates from
the scouting laboratory reactor in a commercial way, with for example pellets or a net, which
is good for catalyst improvement. In general, the dimensions are about 25 mm in diameter and
between 300-1,000 mm in length. The bed is considerably larger and is operated closer to in-
dustrial circumstances than for the scouting laboratory reactor. Temperature and pressure gra-
dients are included. The reaction rate is strongly dependent on pressure and heat evolution in-
side the reactor, while heat transfer is not affected by the pressure. [11, p. 22]
3. Prototype reactor
The prototype reactor is larger than the two previous reactors. In some contexts, it is applied as
a commercial reactor for pilot testing. There are several features accompanied by performing
tests using a prototype reactor. The temperature gradient will not be the same along the catalyst-
optimization reactor, but for the prototype reactor, it is. Kinetics and economics can be largely
affected by a pressure drop, which has to be minimized. The actual gradient and the heat-trans-
fer resistance is inside the bed and should be removed. Reproducing the pressure drop through
the reactor by verifying the repacking it multiple times is of interest for the prototype reactor.
[11, p. 22]
13
2.3 Reactor gradients
In non-ideal catalytic reactor systems, a variety of gradients might exist. As for the reactor, a
temperature gradient may emerge if highly exothermic or endothermic reactions take place.
This gradient implies that the temperature varies in the reactor, particularly in the catalyst bed,
i.e. the reactor is not working isothermally.
Another gradient type relevant for the reactor is the concentration gradient. This gradient
arises due to radial or axial dispersion of the reactants in the catalyst bed. The axial dispersion
is inevitable if there is any conversion of the reactants, but can be minimized. Radial disper-
sion is more prominent if the reactant flow is laminar than if it is turbulent.
For reactor systems, a common gradient is flow gradient. This gradient might occur if the ve-
locity through the catalyst bed is not constant, that could cause a difference in reaction rates
inside the catalyst bed.
Concentration gradients may also appear between the bulk and the catalyst pellet or inside the
pellet due to mass transfer limitations.
Concentration and temperature gradients inside a reactor or catalyst particle can influence the
rate of reaction, i.e. the apparent catalyst activity [13, p. 311].
2.4 HDS process parameters
Reactor temperature, hydrogen partial pressure, and SV are factors that all affect the perfor-
mance of hydrotreating systems. Kinetic studies have shown that higher temperature and
pressure, as well as lower SV, will increase the HDS rate and reduce the sulfur content. Alt-
hough, trying to reach ultra-low sulfur levels by further increasing temperature and pressure is
not viable since these severe conditions have a negative impact on cycle length and throughput
time. It is also limited by design pressure, thermodynamic equilibrium and hydrogen availabil-
ity. For ultra-low sulfur levels, the optimum operating conditions for the hydrotreating reactor
is dependent on the feedstock quality, catalyst type, and thermodynamic limitations.
The thermodynamic constraints are not a limiting factor to the actual removal of sulfur, but
rather in the pre-hydrogenation of the polyaromatic compounds in which the sulfur atoms are
present. Since these hydrogenation reactions are exothermic they benefit from a lower temper-
ature, and hence it is not favorable to conduct the desulfurization at too high temperatures. At
low hydrogen pressure, very high reactor temperature will have a negative effect on the desul-
furization of polyaromatic compounds. See Figure 2.6 for an overview on how the different
parameters affect the sulfur removal. [9, p. 28]
14
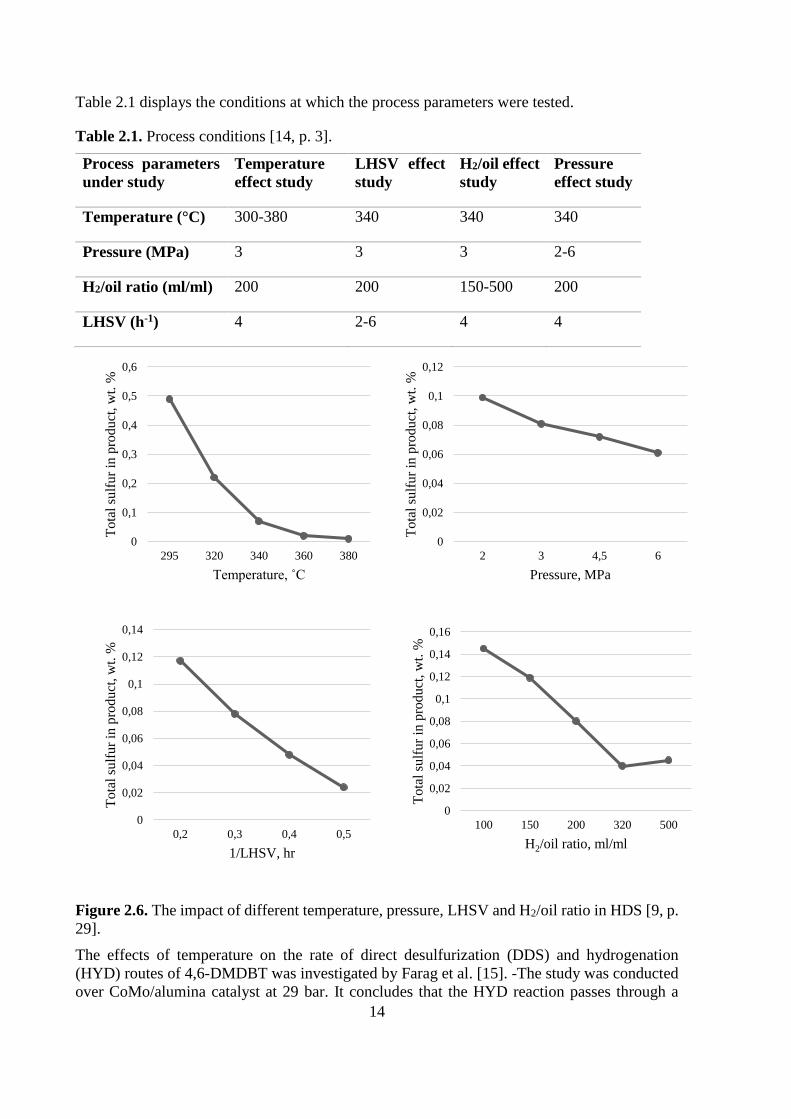
Table 2.1 displays the conditions at which the process parameters were tested.
Table 2.1. Process conditions [14, p. 3].
Process parameters
under study
Temperature
effect study
LHSV effect
study
H2/oil effect
study
Pressure
effect study
Temperature (°C) 300-380 340 340 340
Pressure (MPa) 3 3 3 2-6
H2/oil ratio (ml/ml) 200 200 150-500 200
LHSV (h-1) 4 2-6 4 4
Figure 2.6. The impact of different temperature, pressure, LHSV and H2/oil ratio in HDS [9, p.
29].
The effects of temperature on the rate of direct desulfurization (DDS) and hydrogenation
(HYD) routes of 4,6-DMDBT was investigated by Farag et al. [15]. -The study was conducted
over CoMo/alumina catalyst at 29 bar. It concludes that the HYD reaction passes through a
0
0,1
0,2
0,3
0,4
0,5
0,6
295 320 340 360 380
Tota
l su
lfur
in p
rod
uct
, w
t. %
Temperature, ˚C
0
0,02
0,04
0,06
0,08
0,1
0,12
2 3 4,5 6
Tota
l su
lfur
in p
rod
uct
, w
t. %
Pressure, MPa
0
0,02
0,04
0,06
0,08
0,1
0,12
0,14
0,2 0,3 0,4 0,5
Tota
l su
lfur
in p
roduct
, w
t. %
1/LHSV, hr
0
0,02
0,04
0,06
0,08
0,1
0,12
0,14
0,16
100 150 200 320 500
Tota
l su
lfur
in p
roduct
, w
t. %
H2/oil ratio, ml/ml
15
maximum when the temperature is increased from 300 °C to 380 °C and is the primary reaction
route at temperatures below 340 °C. Above 380 °C, the DDS route becomes more prominent.
This distribution could be due to the thermodynamic limiting of the hydrogenation step [9, p.
29].
Another important parameter to take into account is the LHSV, which is expressed as m3 feed
per m3 catalyst per hour. A decrease in LHSV generally leads to a decrease in sulfur content in
the product, since it entails a longer contact time between the feed and the catalyst. Although,
a decrease in LHSV implies a longer throughput time, and to maintain the same throughput
time at a lower LHSV an increase in catalyst volume is required. What is also beneficial with a
decrease in LHSV is the fact that the reactor can be operated at lower temperatures which ease
the HYD route [9, p. 32].
Changes in hydrogen partial pressure affect which pathway the reaction follows. An increase
in hydrogen pressure promotes the HYD pathway and consequently a decrease in hydrogen
pressure benefits the DDS pathway. Overall, though, an increased hydrogen pressure increases
the HDS rate. Also, by increasing the hydrogen partial pressure, the thermodynamic limitations
caused by the saturation of polyaromatics, are removed. Another advantage with higher hydro-
gen pressure is that it reduces the inhibition effects of for instance H2S [9, p. 33].
2.5 H2S adsorption
Desirable features of an absorbent for gas desulfurization are several. Most importantly it
should be able to, theoretically, reach sulfur levels below 0.1 ppmv, which is required for down-
stream processes. Other desirable qualities are acceptable sulfur capacity for the absorbent, for
it to be regenerable and for it to be able to endure a large number of sulfidation/regeneration
cycles while maintaining the activity and capacity. Also, for FC applications the absorbent has
to be nonpyrophoric. In most cases, it is favorable if the cost of the absorbent is low. [2]
The hydrated iron oxide is efficient but has in general been replaced industrially by ZnO. ZnO
also is nonpyrophoric and is stable in the range of 350-450 °C in a reducing atmosphere. An-
other absorbent is manganese oxide (MnO) which is stable at 400 °C, though, it has a higher
outlet concentration of H2S than ZnO which makes this unsuited for use in FC’s. The reaction
for the absorption of H2S using ZnO as the absorbent is seen below, Reaction 2.1. [2, p. 2]
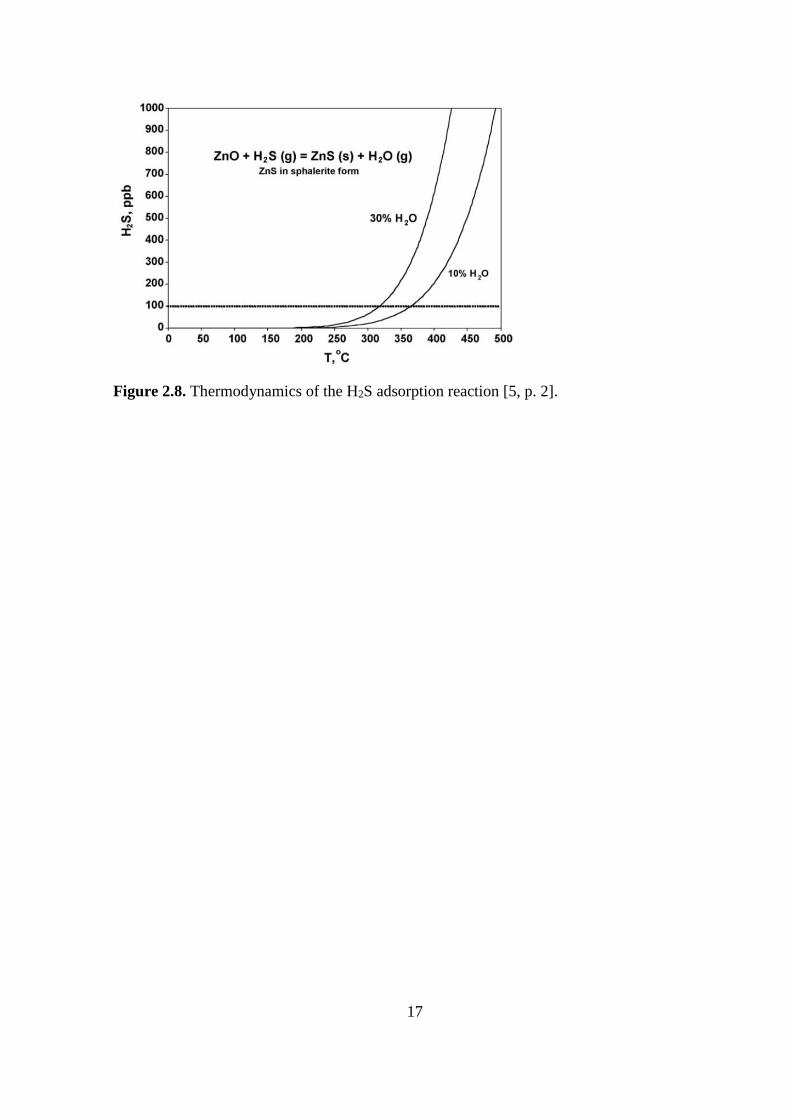
𝑍𝑛𝑂 + 𝐻2𝑆 ↔ 𝑍𝑛𝑆 + 𝐻2𝑂 Δ𝐻2980 = −78 𝑘𝐽/𝑚𝑜𝑙 (Reaction 2.1)
The reaction is an equilibrium reaction that is exothermic, and the H2S concentration is deter-
mined by the temperature, partial pressure of H2O, and to some extent, the ZnO phase. [5, p. 2]
The presence of CO in the feed decreases the sulfur removal in the ZnO since it might form
carbonyl sulfide (COS), according to Reaction 2.2 [16, p. 4], [5, p. 3].
𝐻2𝑆 + 𝐶𝑂 ↔ 𝐻2 + 𝐶𝑂𝑆 (Reaction 2.2)
16
In cases when neither H2O nor CO is present in the feed, while CO2 is, a risk of formation of
COS also occurs. This is seen in Reaction 2.3.
𝐻2𝑆 + 𝐶𝑂2 ↔ 𝐶𝑂𝑆 + 𝐻2𝑂 (Reaction 2.3)
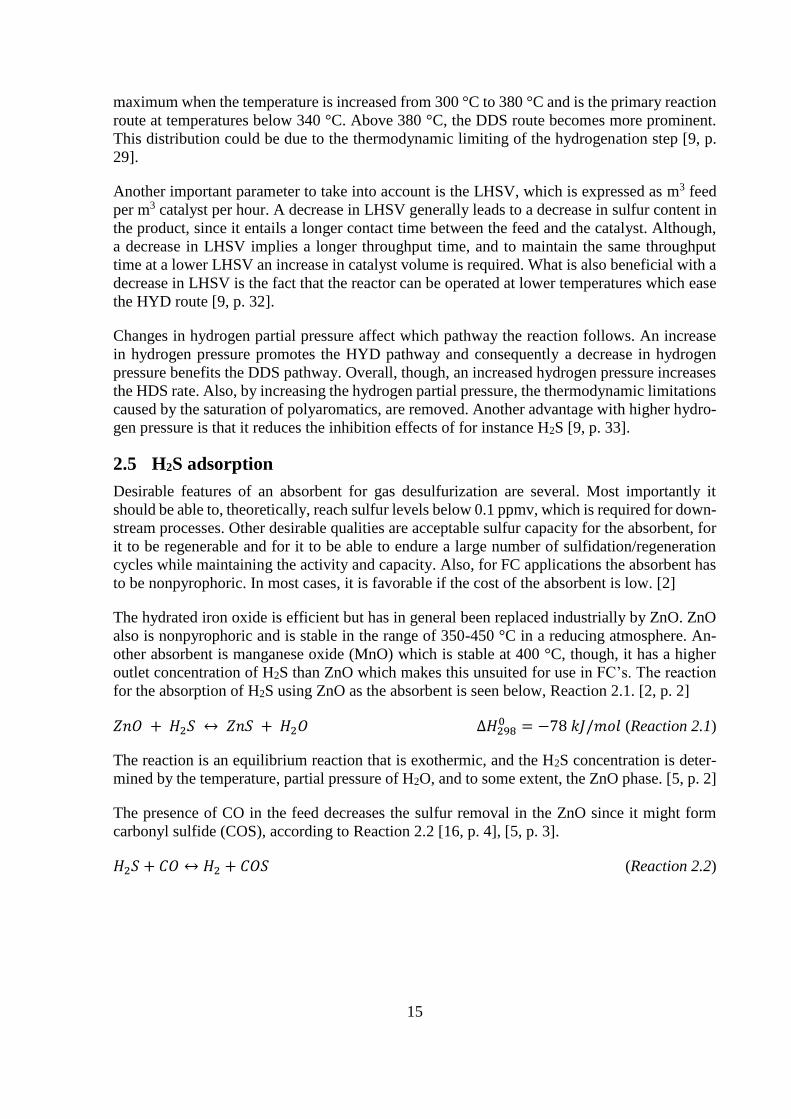
Reactor design
A set-up for H2S adsorption contains four components: gas mixing system, preheater, reactor
and chromatographic analyzer [17, p. 2], [5, p. 2]. The system uses two streams with reactant
gases; one containing a mixture of CO, CO2 and H2 and the other contains H2S in helium. Both
are controlled by mass flow controllers. Water is introduced through a pump and is vaporized
before it is mixed with the two heated gas streams, before entering the reactor. They all enter
upstream of the absorbent bed, containing the ZnO. A thermocouple is attached for heating of
the reactor. Downstream of the reactor, removal of water vapor is done through two Nafion
dryers, and the products are then further led into a gas chromatograph (GC) [5, p. 2]. The set-
up is seen in Figure 2.7.
ZnO
Furnace and reactor
Vent
H2S in He
CO, CO2, H2 mixtureH2O
GC
columnSCD detector
Nafion dryers
Figure 2.7. Small scale process set-up for H2S adsorption with ZnO [5, p. 2].
H2S process parameters
According to Li and King [5], when the temperature where over 315 °C, a sulfur level below
100 ppb was not achieved. Though under 250 °C the kinetics of absorption was slower but still
more favorable for ZnS in equilibrium.
The study showed that below 200 °C, the H2S adsorption was considerable in presence of only
H2 and H2O. CO2 did not affect the uptake of H2S. While CO was present in the feed and with
increasing concentration of it, the sulfur uptake decreased drastically. At 150 °C, the same re-
sults showed.
At low SV, no proven increase in H2S capacity was shown and with a high SV (200 °C h-1) the
capacity showed a decrease.
Finally, with H2O present in the feed, the H2S capacity seemed to increase. With no water in
the feed, the sulfur capture showed to be very small. The thermodynamics for the capture of
H2S is visualized in Figure 2.8. [5, pp. 2–4]
17
Figure 2.8. Thermodynamics of the H2S adsorption reaction [5, p. 2].

18
19
3 Catalytic hydrotreating
3.1 The concept of heterogeneous catalysis
The main purpose of a catalyst is to open new reaction pathways with lower activation ener-
gies than the initial non-catalytic reactions. Heterogeneous catalysis has a large variety of in-
dustrial applications and is estimated to be used in over 90 % of all chemical processes [4, p.
1]. When producing chemicals and fuels from raw materials, via catalytic processes they show
both economic and environmental benefits. Catalysts are used in many different areas such as
chemical industry, food industry, the pharmaceutical industry as well as in the automobile and
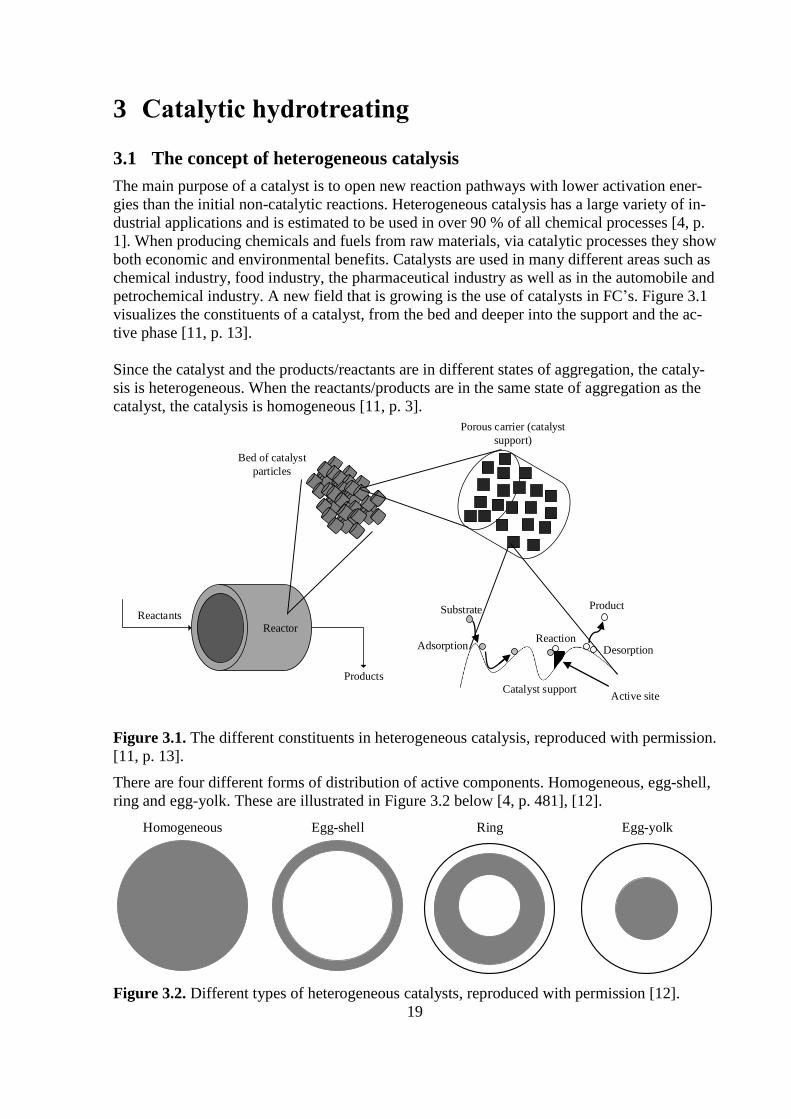
petrochemical industry. A new field that is growing is the use of catalysts in FC’s. Figure 3.1
visualizes the constituents of a catalyst, from the bed and deeper into the support and the ac-
tive phase [11, p. 13].
Since the catalyst and the products/reactants are in different states of aggregation, the cataly-
sis is heterogeneous. When the reactants/products are in the same state of aggregation as the
catalyst, the catalysis is homogeneous [11, p. 3].
ReactantsReactor
Products
Bed of catalyst
particles
Porous carrier (catalyst
support)
Reaction
Substrate
Adsorption Desorption
Catalyst support
Product
Active site
Figure 3.1. The different constituents in heterogeneous catalysis, reproduced with permission.
[11, p. 13].
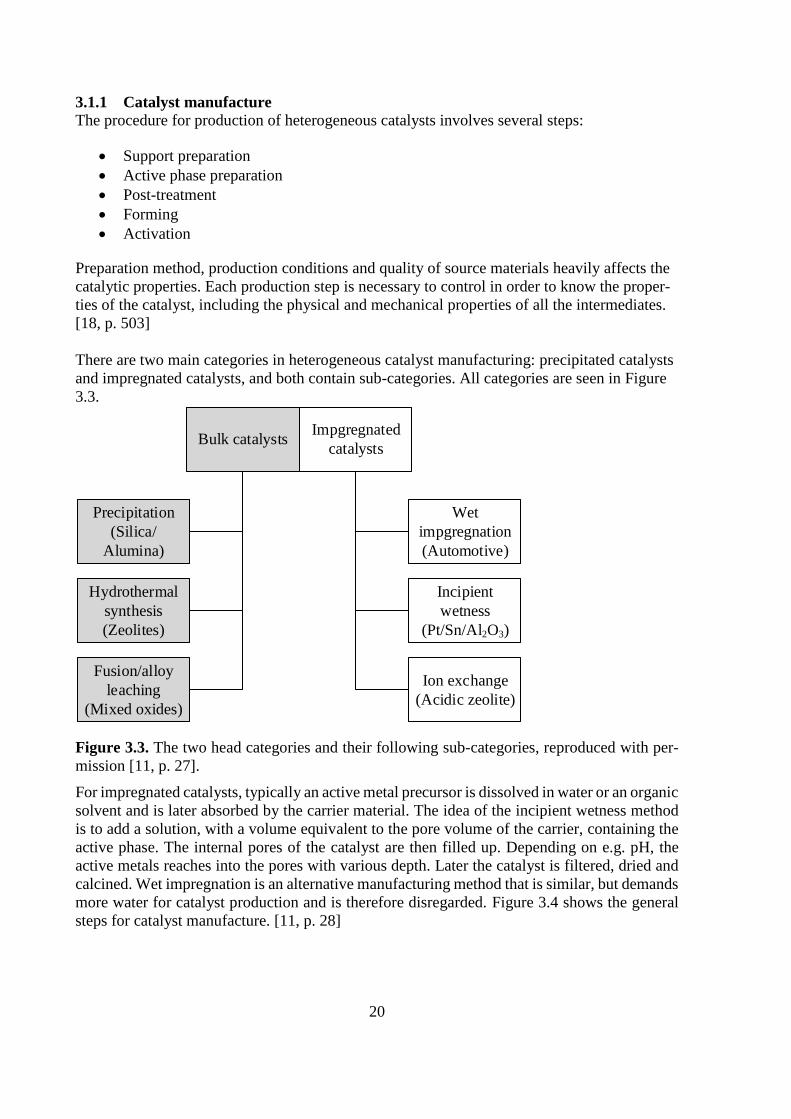
There are four different forms of distribution of active components. Homogeneous, egg-shell,
ring and egg-yolk. These are illustrated in Figure 3.2 below [4, p. 481], [12].
Homogeneous Egg-shell Ring Egg-yolk
Figure 3.2. Different types of heterogeneous catalysts, reproduced with permission [12].
20
3.1.1 Catalyst manufacture
The procedure for production of heterogeneous catalysts involves several steps:
Support preparation
Active phase preparation
Post-treatment
Forming
Activation
Preparation method, production conditions and quality of source materials heavily affects the
catalytic properties. Each production step is necessary to control in order to know the proper-
ties of the catalyst, including the physical and mechanical properties of all the intermediates.
[18, p. 503]
There are two main categories in heterogeneous catalyst manufacturing: precipitated catalysts
and impregnated catalysts, and both contain sub-categories. All categories are seen in Figure
3.3.
Fusion/alloy
leaching
(Mixed oxides)
Hydrothermal
synthesis
(Zeolites)
Precipitation
(Silica/
Alumina)
Ion exchange
(Acidic zeolite)
Wet
impgregnation
(Automotive)
Incipient
wetness
(Pt/Sn/Al2O3)
Impgregnated
catalystsBulk catalysts
Figure 3.3. The two head categories and their following sub-categories, reproduced with per-
mission [11, p. 27].
For impregnated catalysts, typically an active metal precursor is dissolved in water or an organic
solvent and is later absorbed by the carrier material. The idea of the incipient wetness method
is to add a solution, with a volume equivalent to the pore volume of the carrier, containing the
active phase. The internal pores of the catalyst are then filled up. Depending on e.g. pH, the
active metals reaches into the pores with various depth. Later the catalyst is filtered, dried and
calcined. Wet impregnation is an alternative manufacturing method that is similar, but demands
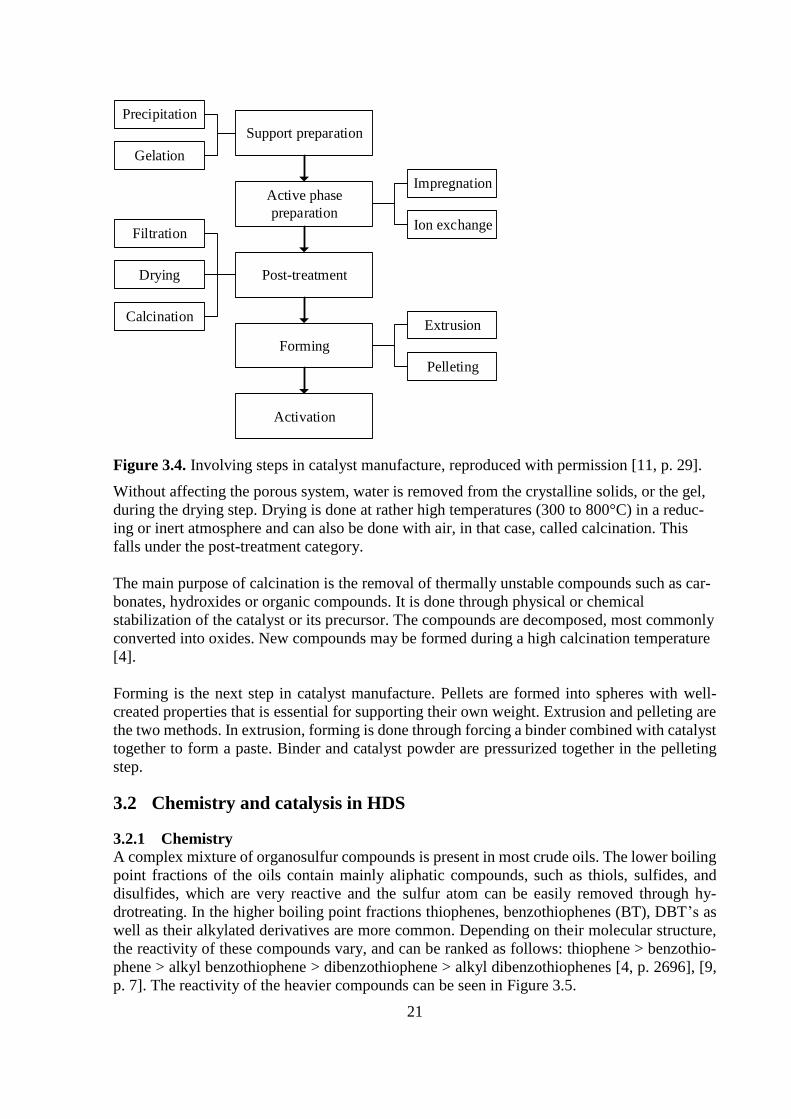
more water for catalyst production and is therefore disregarded. Figure 3.4 shows the general
steps for catalyst manufacture. [11, p. 28]
21
Support preparation
Active phase
preparation
Post-treatment
Forming
Activation
Precipitation
Gelation
Filtration
Drying
Calcination
Impregnation
Ion exchange
Extrusion
Pelleting
Figure 3.4. Involving steps in catalyst manufacture, reproduced with permission [11, p. 29].
Without affecting the porous system, water is removed from the crystalline solids, or the gel,
during the drying step. Drying is done at rather high temperatures (300 to 800°C) in a reduc-
ing or inert atmosphere and can also be done with air, in that case, called calcination. This
falls under the post-treatment category.
The main purpose of calcination is the removal of thermally unstable compounds such as car-
bonates, hydroxides or organic compounds. It is done through physical or chemical
stabilization of the catalyst or its precursor. The compounds are decomposed, most commonly
converted into oxides. New compounds may be formed during a high calcination temperature
[4].
Forming is the next step in catalyst manufacture. Pellets are formed into spheres with well-
created properties that is essential for supporting their own weight. Extrusion and pelleting are
the two methods. In extrusion, forming is done through forcing a binder combined with catalyst
together to form a paste. Binder and catalyst powder are pressurized together in the pelleting
step.
3.2 Chemistry and catalysis in HDS
3.2.1 Chemistry
A complex mixture of organosulfur compounds is present in most crude oils. The lower boiling
point fractions of the oils contain mainly aliphatic compounds, such as thiols, sulfides, and
disulfides, which are very reactive and the sulfur atom can be easily removed through hy-
drotreating. In the higher boiling point fractions thiophenes, benzothiophenes (BT), DBT’s as
well as their alkylated derivatives are more common. Depending on their molecular structure,
the reactivity of these compounds vary, and can be ranked as follows: thiophene > benzothio-
phene > alkyl benzothiophene > dibenzothiophene > alkyl dibenzothiophenes [4, p. 2696], [9,
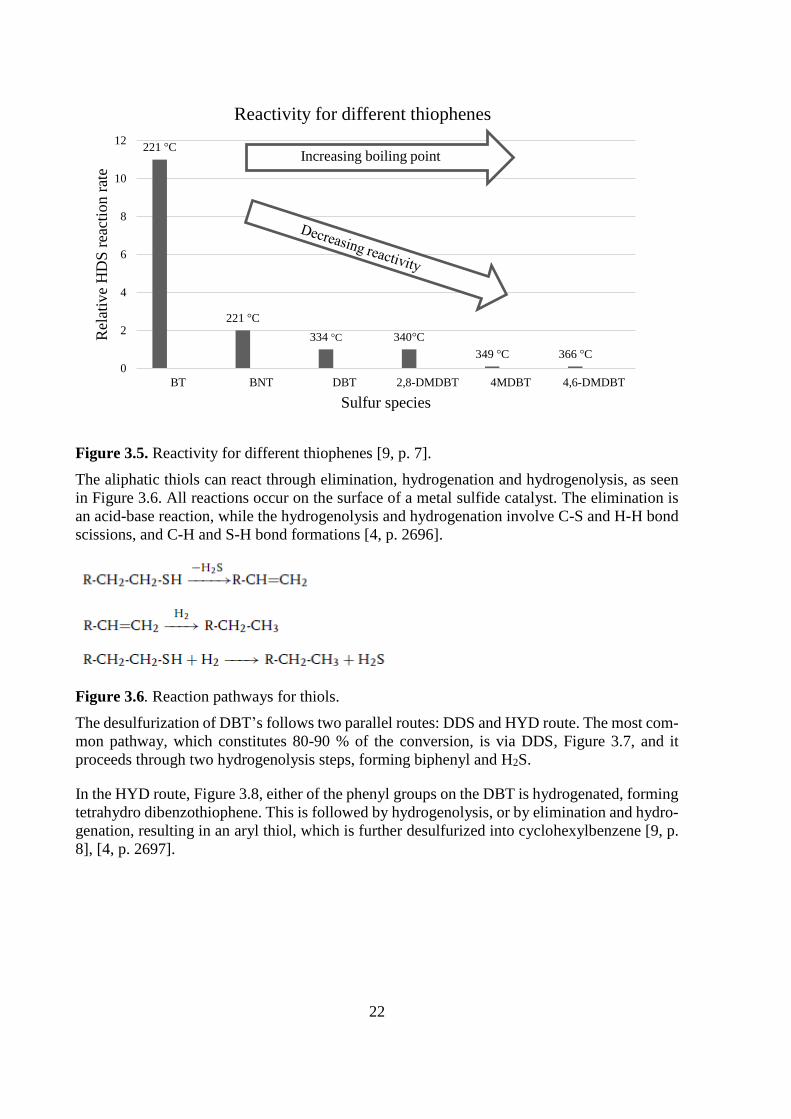
p. 7]. The reactivity of the heavier compounds can be seen in Figure 3.5.
22
Figure 3.5. Reactivity for different thiophenes [9, p. 7].
The aliphatic thiols can react through elimination, hydrogenation and hydrogenolysis, as seen
in Figure 3.6. All reactions occur on the surface of a metal sulfide catalyst. The elimination is
an acid-base reaction, while the hydrogenolysis and hydrogenation involve C-S and H-H bond
scissions, and C-H and S-H bond formations [4, p. 2696].
Figure 3.6. Reaction pathways for thiols.
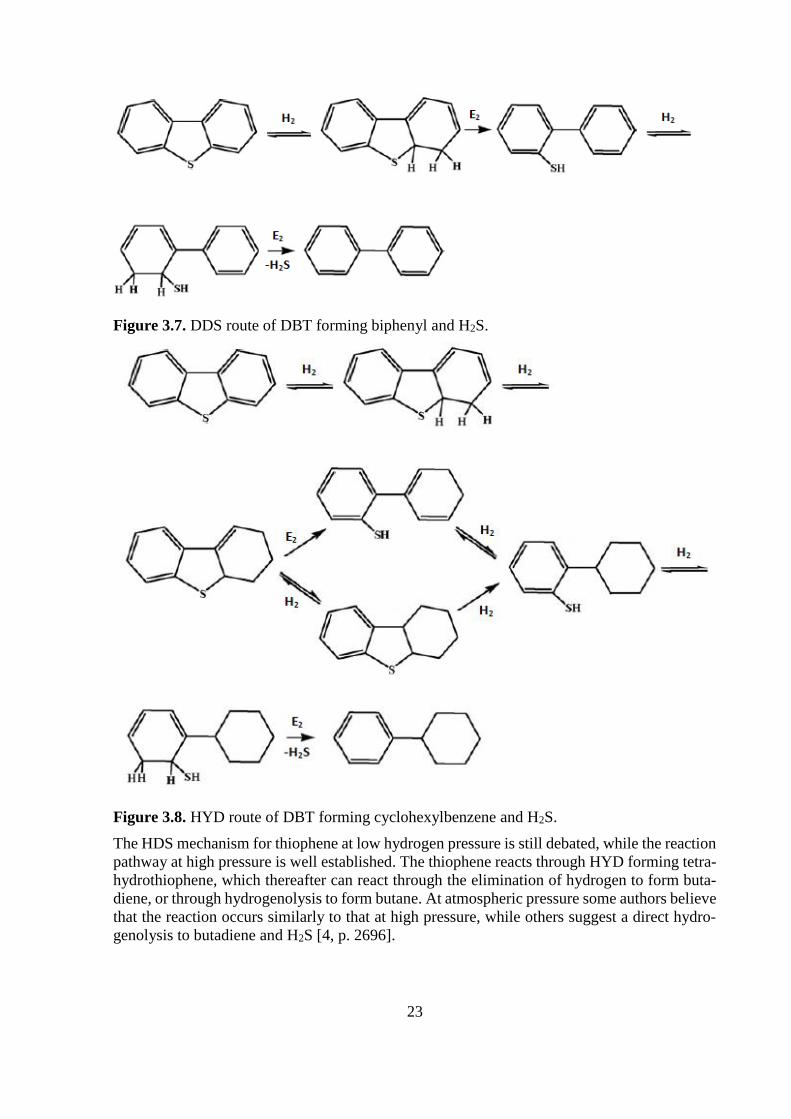
The desulfurization of DBT’s follows two parallel routes: DDS and HYD route. The most com-
mon pathway, which constitutes 80-90 % of the conversion, is via DDS, Figure 3.7, and it
proceeds through two hydrogenolysis steps, forming biphenyl and H2S.
In the HYD route, Figure 3.8, either of the phenyl groups on the DBT is hydrogenated, forming
tetrahydro dibenzothiophene. This is followed by hydrogenolysis, or by elimination and hydro-
genation, resulting in an aryl thiol, which is further desulfurized into cyclohexylbenzene [9, p.
8], [4, p. 2697].
221 °C
221 °C
334 °C 340°C
349 °C 366 °C
0
2
4
6
8
10
12
BT BNT DBT 2,8-DMDBT 4MDBT 4,6-DMDBT
Rel
ativ
e H
DS
rea
ctio
n r
ate
Sulfur species
Reactivity for different thiophenes
Increasing boiling point
23
Figure 3.7. DDS route of DBT forming biphenyl and H2S.
Figure 3.8. HYD route of DBT forming cyclohexylbenzene and H2S.
The HDS mechanism for thiophene at low hydrogen pressure is still debated, while the reaction
pathway at high pressure is well established. The thiophene reacts through HYD forming tetra-
hydrothiophene, which thereafter can react through the elimination of hydrogen to form buta-
diene, or through hydrogenolysis to form butane. At atmospheric pressure some authors believe
that the reaction occurs similarly to that at high pressure, while others suggest a direct hydro-
genolysis to butadiene and H2S [4, p. 2696].
24
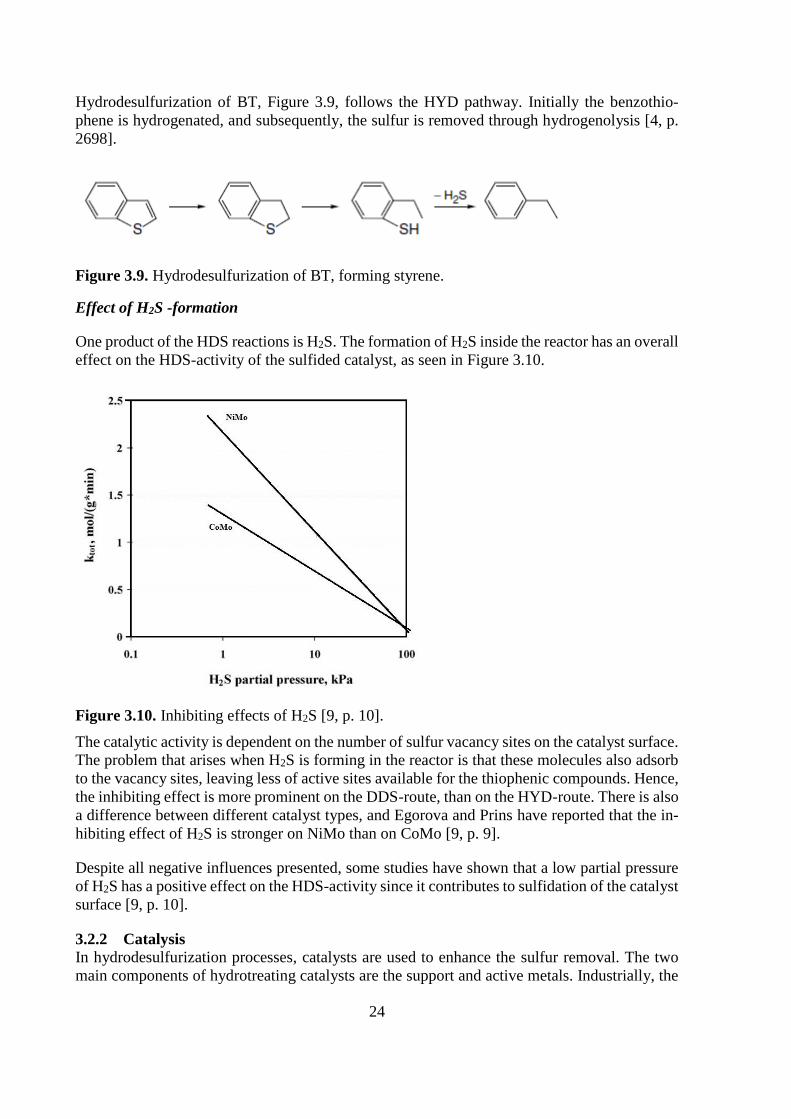
Hydrodesulfurization of BT, Figure 3.9, follows the HYD pathway. Initially the benzothio-
phene is hydrogenated, and subsequently, the sulfur is removed through hydrogenolysis [4, p.
2698].
Figure 3.9. Hydrodesulfurization of BT, forming styrene.
Effect of H2S -formation
One product of the HDS reactions is H2S. The formation of H2S inside the reactor has an overall
effect on the HDS-activity of the sulfided catalyst, as seen in Figure 3.10.
Figure 3.10. Inhibiting effects of H2S [9, p. 10].
The catalytic activity is dependent on the number of sulfur vacancy sites on the catalyst surface.
The problem that arises when H2S is forming in the reactor is that these molecules also adsorb
to the vacancy sites, leaving less of active sites available for the thiophenic compounds. Hence,
the inhibiting effect is more prominent on the DDS-route, than on the HYD-route. There is also
a difference between different catalyst types, and Egorova and Prins have reported that the in-
hibiting effect of H2S is stronger on NiMo than on CoMo [9, p. 9].
Despite all negative influences presented, some studies have shown that a low partial pressure
of H2S has a positive effect on the HDS-activity since it contributes to sulfidation of the catalyst
surface [9, p. 10].
3.2.2 Catalysis
In hydrodesulfurization processes, catalysts are used to enhance the sulfur removal. The two
main components of hydrotreating catalysts are the support and active metals. Industrially, the
25
most widely used catalysts consist of molybdenum, supported on γ-alumina, promoted with
nickel or cobalt [9, p. 17]. In this report, these CoMo/alumina and NiMo/alumina catalysts have
been reviewed regarding catalyst structure and activity.
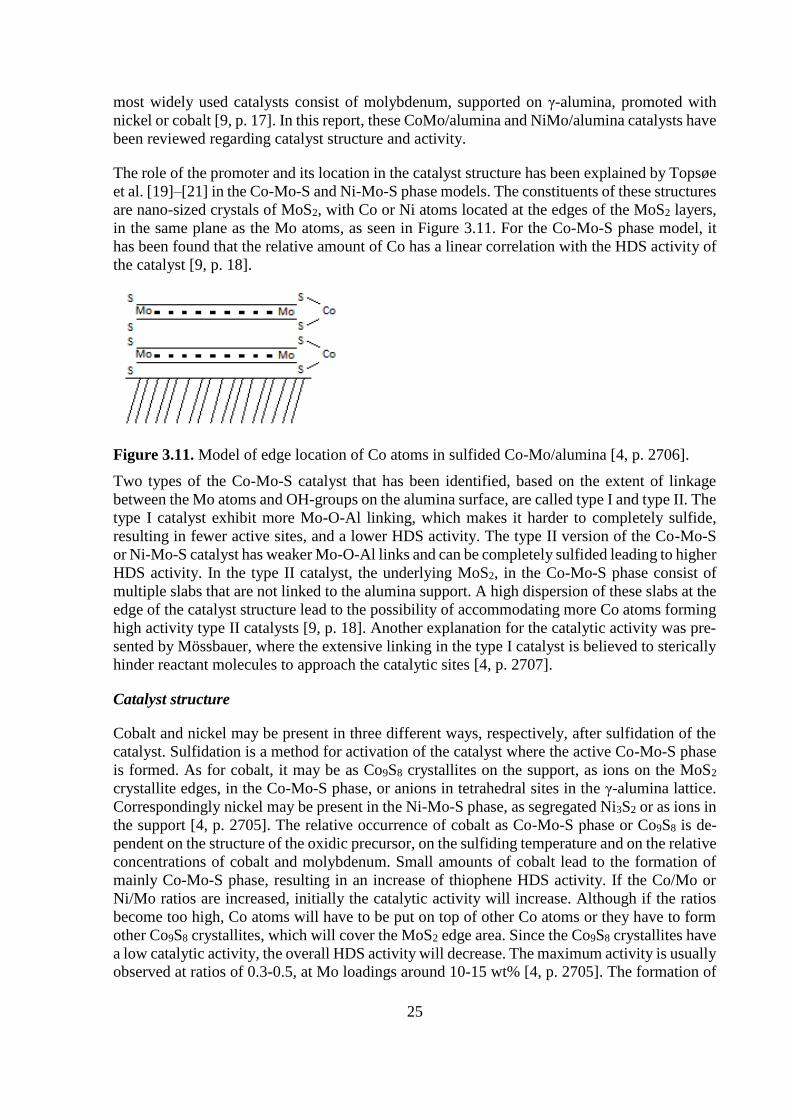
The role of the promoter and its location in the catalyst structure has been explained by Topsøe
et al. [19]–[21] in the Co-Mo-S and Ni-Mo-S phase models. The constituents of these structures
are nano-sized crystals of MoS2, with Co or Ni atoms located at the edges of the MoS2 layers,
in the same plane as the Mo atoms, as seen in Figure 3.11. For the Co-Mo-S phase model, it
has been found that the relative amount of Co has a linear correlation with the HDS activity of
the catalyst [9, p. 18].
Figure 3.11. Model of edge location of Co atoms in sulfided Co-Mo/alumina [4, p. 2706].
Two types of the Co-Mo-S catalyst that has been identified, based on the extent of linkage
between the Mo atoms and OH-groups on the alumina surface, are called type I and type II. The
type I catalyst exhibit more Mo-O-Al linking, which makes it harder to completely sulfide,
resulting in fewer active sites, and a lower HDS activity. The type II version of the Co-Mo-S
or Ni-Mo-S catalyst has weaker Mo-O-Al links and can be completely sulfided leading to higher
HDS activity. In the type II catalyst, the underlying MoS2, in the Co-Mo-S phase consist of
multiple slabs that are not linked to the alumina support. A high dispersion of these slabs at the
edge of the catalyst structure lead to the possibility of accommodating more Co atoms forming
high activity type II catalysts [9, p. 18]. Another explanation for the catalytic activity was pre-
sented by Mössbauer, where the extensive linking in the type I catalyst is believed to sterically
hinder reactant molecules to approach the catalytic sites [4, p. 2707].
Catalyst structure
Cobalt and nickel may be present in three different ways, respectively, after sulfidation of the
catalyst. Sulfidation is a method for activation of the catalyst where the active Co-Mo-S phase
is formed. As for cobalt, it may be as Co9S8 crystallites on the support, as ions on the MoS2
crystallite edges, in the Co-Mo-S phase, or anions in tetrahedral sites in the γ-alumina lattice.
Correspondingly nickel may be present in the Ni-Mo-S phase, as segregated Ni3S2 or as ions in
the support [4, p. 2705]. The relative occurrence of cobalt as Co-Mo-S phase or Co9S8 is de-
pendent on the structure of the oxidic precursor, on the sulfiding temperature and on the relative
concentrations of cobalt and molybdenum. Small amounts of cobalt lead to the formation of
mainly Co-Mo-S phase, resulting in an increase of thiophene HDS activity. If the Co/Mo or
Ni/Mo ratios are increased, initially the catalytic activity will increase. Although if the ratios
become too high, Co atoms will have to be put on top of other Co atoms or they have to form
other Co9S8 crystallites, which will cover the MoS2 edge area. Since the Co9S8 crystallites have
a low catalytic activity, the overall HDS activity will decrease. The maximum activity is usually
observed at ratios of 0.3-0.5, at Mo loadings around 10-15 wt% [4, p. 2705]. The formation of
26
Co9S8 particles can also be caused by high sulfiding temperatures. Optimal temperatures for
sulfidation of Co-Mo/alumina or Ni-Mo/alumina are in the range of 400-500 °C [4, p. 2704].
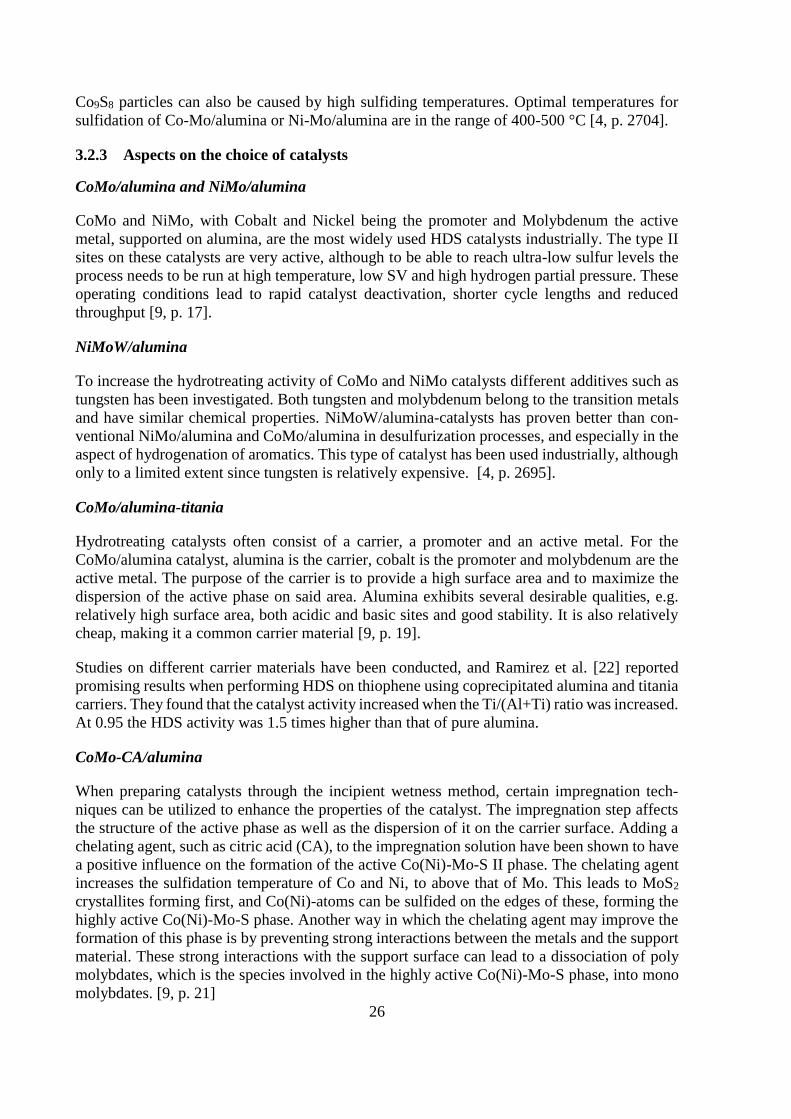
3.2.3 Aspects on the choice of catalysts
CoMo/alumina and NiMo/alumina
CoMo and NiMo, with Cobalt and Nickel being the promoter and Molybdenum the active
metal, supported on alumina, are the most widely used HDS catalysts industrially. The type II
sites on these catalysts are very active, although to be able to reach ultra-low sulfur levels the
process needs to be run at high temperature, low SV and high hydrogen partial pressure. These
operating conditions lead to rapid catalyst deactivation, shorter cycle lengths and reduced
throughput [9, p. 17].
NiMoW/alumina
To increase the hydrotreating activity of CoMo and NiMo catalysts different additives such as
tungsten has been investigated. Both tungsten and molybdenum belong to the transition metals
and have similar chemical properties. NiMoW/alumina-catalysts has proven better than con-
ventional NiMo/alumina and CoMo/alumina in desulfurization processes, and especially in the
aspect of hydrogenation of aromatics. This type of catalyst has been used industrially, although
only to a limited extent since tungsten is relatively expensive. [4, p. 2695].
CoMo/alumina-titania
Hydrotreating catalysts often consist of a carrier, a promoter and an active metal. For the
CoMo/alumina catalyst, alumina is the carrier, cobalt is the promoter and molybdenum are the
active metal. The purpose of the carrier is to provide a high surface area and to maximize the
dispersion of the active phase on said area. Alumina exhibits several desirable qualities, e.g.
relatively high surface area, both acidic and basic sites and good stability. It is also relatively
cheap, making it a common carrier material [9, p. 19].
Studies on different carrier materials have been conducted, and Ramirez et al. [22] reported
promising results when performing HDS on thiophene using coprecipitated alumina and titania
carriers. They found that the catalyst activity increased when the Ti/(Al+Ti) ratio was increased.
At 0.95 the HDS activity was 1.5 times higher than that of pure alumina.
CoMo-CA/alumina
When preparing catalysts through the incipient wetness method, certain impregnation tech-
niques can be utilized to enhance the properties of the catalyst. The impregnation step affects
the structure of the active phase as well as the dispersion of it on the carrier surface. Adding a
chelating agent, such as citric acid (CA), to the impregnation solution have been shown to have
a positive influence on the formation of the active Co(Ni)-Mo-S II phase. The chelating agent
increases the sulfidation temperature of Co and Ni, to above that of Mo. This leads to MoS2
crystallites forming first, and Co(Ni)-atoms can be sulfided on the edges of these, forming the
highly active Co(Ni)-Mo-S phase. Another way in which the chelating agent may improve the
formation of this phase is by preventing strong interactions between the metals and the support
material. These strong interactions with the support surface can lead to a dissociation of poly
molybdates, which is the species involved in the highly active Co(Ni)-Mo-S phase, into mono
molybdates. [9, p. 21]

27
Pt/Pd and Pt
Noble metal catalysts, e.g. Pt and PtPd supported on amorphous silica-alumina (ASA) has
proven to be a promising alternative to the conventional CoMo or NiMo catalysts. These cata-
lysts reduce both sulfur and aromatics content due to high hydrogenation and desulfurization
activity. They are, however, limited by their sulfur resistance and are most suitable for pre-
treated fuels with low sulfur content [4, p. 2715]. Unlike the other catalysts, no activation is
needed. Therefore, the sulfidation step can be disregarded for noble metal type catalysts which
lead to a significantly easier preparation process.

28
29
4 Material and method
In this section, the experimental method for desulfurization is described. A brief explanation of
the approach, and how the experiments were performed, follows. Seven potential catalysts for
desulfurization of logistic fuels was chosen for evaluation and was then manufactured. Recipes
for all of the catalysts are reported in Appendix I. Previous to manufacturing, assembling and
ordering of the needed chemicals for the catalysts was done, a compiled list is reported in Ap-
pendix II. For most catalysts, except for the noble metal based ones, an activation step called
sulfidation was required. Assembling of the reactor systems was done with help of Catator.
System test run and calibration was done to evaluate if the system was intact and able to run at
required pressures. Most steps were conducted at Catator while the reactor was constructed at
Herman Andersson Plåt AB. Two reactor systems were used, a semi-batch system and a PFR
system. All results are based on experiments run in the latter system.
4.1 Catalysts
There are two types of hydrotreatment catalysts that are most common. They consist of an alu-
mina support that is impregnated with two types of catalytic elements, one type is Ni or Co and
the other type being molybdenum oxide or tungsten oxide. The Ni or Co is converted to sulfide
by sulfiding, while molybdenum or tungsten oxides converts to disulfides [23, pp. 138–139].
Below, a list of the seven different catalysts, that from literature was believed to yield the best
conversion of sulfur, can be seen. Five of them involved experimental work in form of manu-
facturing, with γ-alumina (Al2O3) as support, and testing. The Pt catalyst, named PPt-47, is a
commercial catalyst manufactured by Stonemill AB. It was received from Catator. A product
datasheet for PPt-47 is available in Appendix IV. Sulfidation time was 4 h for all catalysts
except one batch of CoMo and NiMo which was sulfided for 6 h. This was done to see if the
time of sulfidation had an impact on the sulfur conversion. Calculations were performed to
receive a standard value which was done as a blind test without a catalyst. Seven different types
of catalysts were chosen from the literature study and regarded for testing in the reactor system.
These are listed in Table 4.1.
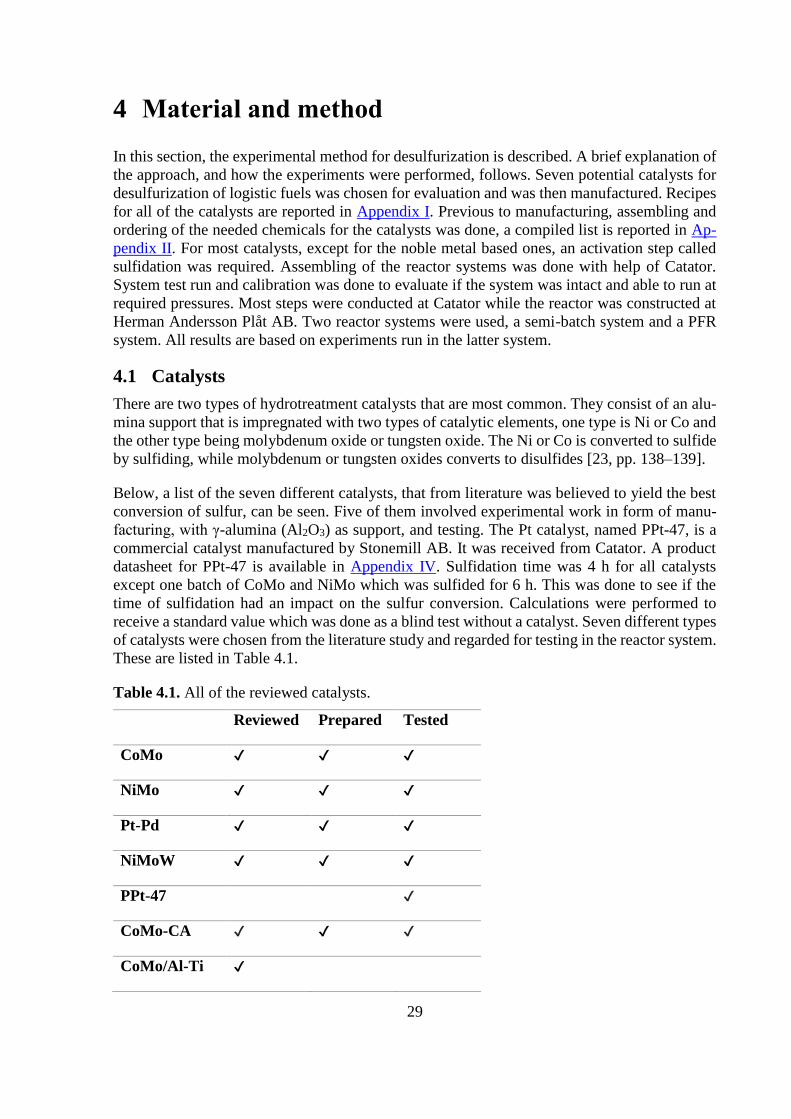
Table 4.1. All of the reviewed catalysts.
Reviewed Prepared Tested
CoMo ✔ ✔ ✔
NiMo ✔ ✔ ✔
Pt-Pd ✔ ✔ ✔
NiMoW ✔ ✔ ✔
PPt-47 ✔
CoMo-CA ✔ ✔ ✔
CoMo/Al-Ti ✔
30
The CoMo/Al-Ti catalyst was reviewed in the literature study but was never prepared or tested
due to difficulties in preparation. The other five catalysts were prepared according to recipes in
Appendix I, and together with PPt-47, tested in the reactor system.
The alumina, which is the support material in all catalysts prepared at Catator, was received
from the department of Chemical Engineering at Lund University. BET-analysis was conducted
for 24 h, with a degassing temperature of 150 °C. The measured pore volume of the alumina
was 0.3538 cm3/g at pressure ratio (P/P0) = 0.9951. The BET surface area was 300.10 m2/g. A
summarized analysis with results from the BET-analysis is reported in Appendix V.
For all but the noble metal catalysts, the final preparation step was to sulfide the catalyst in
order for the active phase to form. The sulfidation was conducted at 400 °C for 4 and 6 h using
a flow of H2S(g) in N2(g) (5,000 ppm) with a flow of 10 l/h and H2 (g) with a flow of 40 l/h,
resulting in 0.1 % ppm H2S.
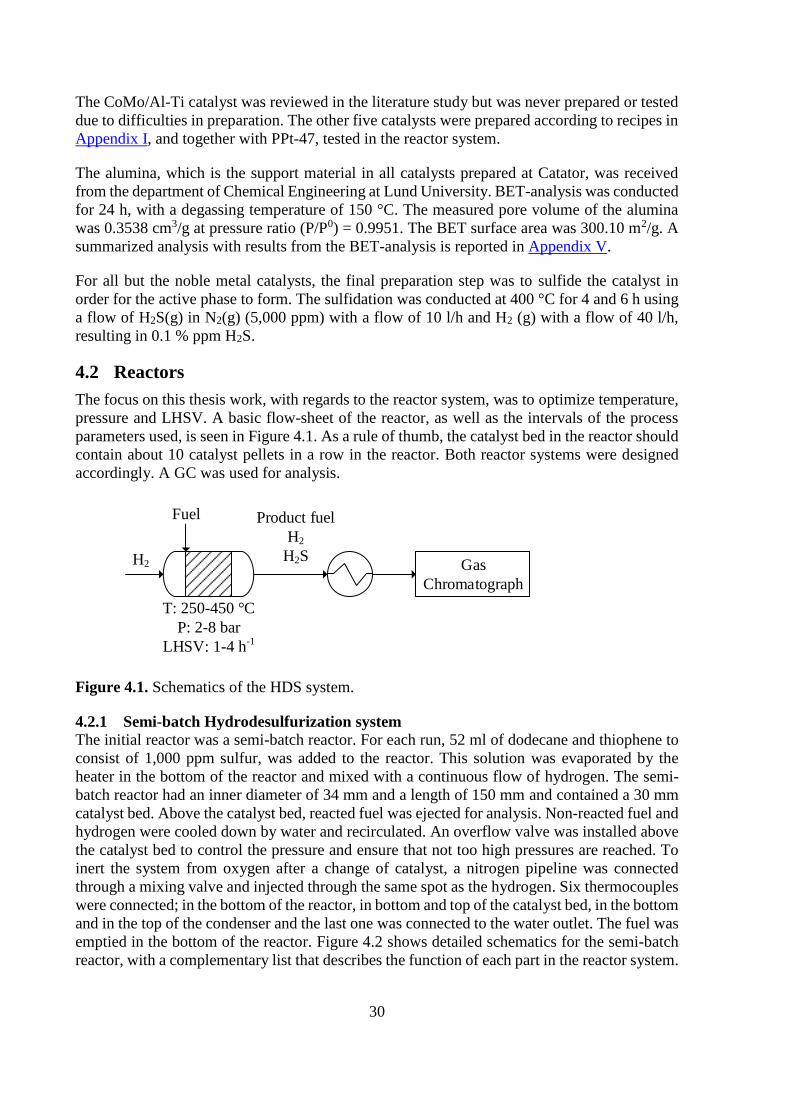
4.2 Reactors
The focus on this thesis work, with regards to the reactor system, was to optimize temperature,
pressure and LHSV. A basic flow-sheet of the reactor, as well as the intervals of the process
parameters used, is seen in Figure 4.1. As a rule of thumb, the catalyst bed in the reactor should
contain about 10 catalyst pellets in a row in the reactor. Both reactor systems were designed
accordingly. A GC was used for analysis.
H2
T: 250-450 °C
P: 2-8 bar
LHSV: 1-4 h-1
Product fuel
H2
H2S Gas
Chromatograph
Fuel
Figure 4.1. Schematics of the HDS system.
4.2.1 Semi-batch Hydrodesulfurization system
The initial reactor was a semi-batch reactor. For each run, 52 ml of dodecane and thiophene to
consist of 1,000 ppm sulfur, was added to the reactor. This solution was evaporated by the
heater in the bottom of the reactor and mixed with a continuous flow of hydrogen. The semi-
batch reactor had an inner diameter of 34 mm and a length of 150 mm and contained a 30 mm
catalyst bed. Above the catalyst bed, reacted fuel was ejected for analysis. Non-reacted fuel and
hydrogen were cooled down by water and recirculated. An overflow valve was installed above
the catalyst bed to control the pressure and ensure that not too high pressures are reached. To
inert the system from oxygen after a change of catalyst, a nitrogen pipeline was connected
through a mixing valve and injected through the same spot as the hydrogen. Six thermocouples
were connected; in the bottom of the reactor, in bottom and top of the catalyst bed, in the bottom
and in the top of the condenser and the last one was connected to the water outlet. The fuel was
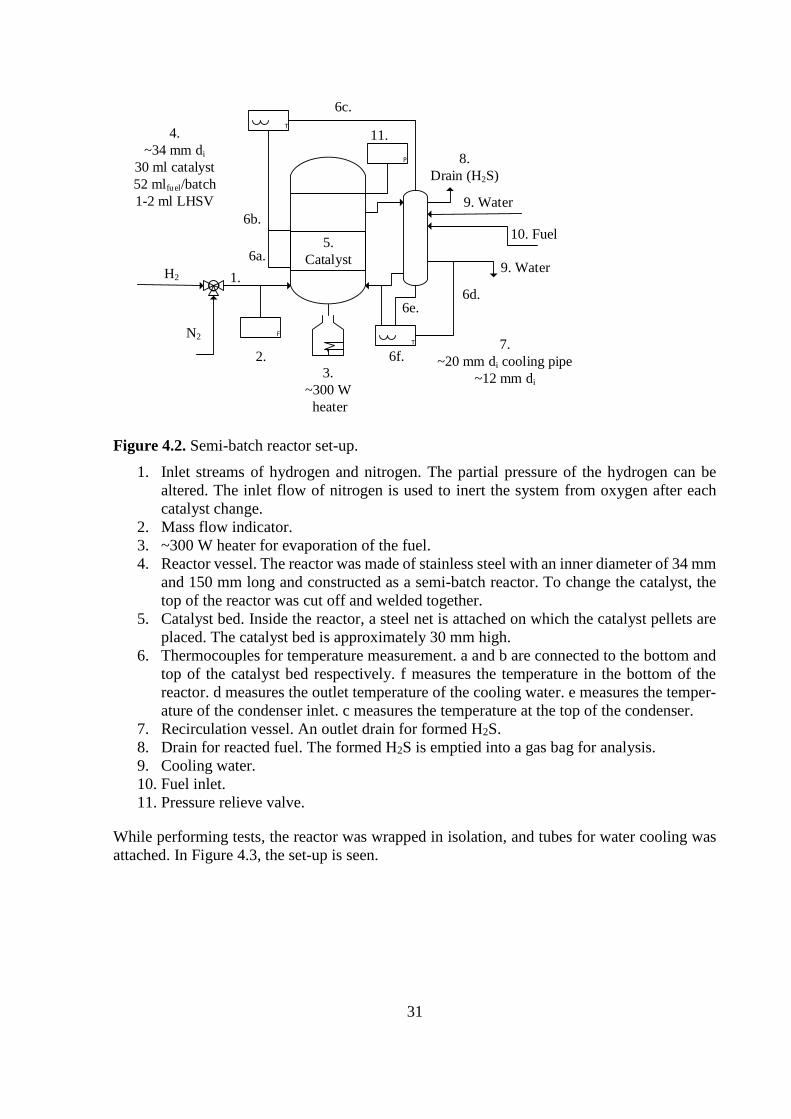
emptied in the bottom of the reactor. Figure 4.2 shows detailed schematics for the semi-batch
reactor, with a complementary list that describes the function of each part in the reactor system.
31
P
11.
F
2.
T
6f.
3.
~300 W
heater
4.
~34 mm di
30 ml catalyst
52 mlfuel/batch
1-2 ml LHSV
5.
CatalystH2
N2
1.
7.
~20 mm di cooling pipe
~12 mm di
9. Water
8.
Drain (H2S)
10. Fuel
T
9. Water6a.
6b.
6d.
6c.
6e.
Figure 4.2. Semi-batch reactor set-up.
1. Inlet streams of hydrogen and nitrogen. The partial pressure of the hydrogen can be
altered. The inlet flow of nitrogen is used to inert the system from oxygen after each
catalyst change.
2. Mass flow indicator.
3. ~300 W heater for evaporation of the fuel.
4. Reactor vessel. The reactor was made of stainless steel with an inner diameter of 34 mm
and 150 mm long and constructed as a semi-batch reactor. To change the catalyst, the
top of the reactor was cut off and welded together.
5. Catalyst bed. Inside the reactor, a steel net is attached on which the catalyst pellets are
placed. The catalyst bed is approximately 30 mm high.
6. Thermocouples for temperature measurement. a and b are connected to the bottom and
top of the catalyst bed respectively. f measures the temperature in the bottom of the
reactor. d measures the outlet temperature of the cooling water. e measures the temper-
ature of the condenser inlet. c measures the temperature at the top of the condenser.
7. Recirculation vessel. An outlet drain for formed H2S.
8. Drain for reacted fuel. The formed H2S is emptied into a gas bag for analysis.
9. Cooling water.
10. Fuel inlet.
11. Pressure relieve valve.
While performing tests, the reactor was wrapped in isolation, and tubes for water cooling was
attached. In Figure 4.3, the set-up is seen.
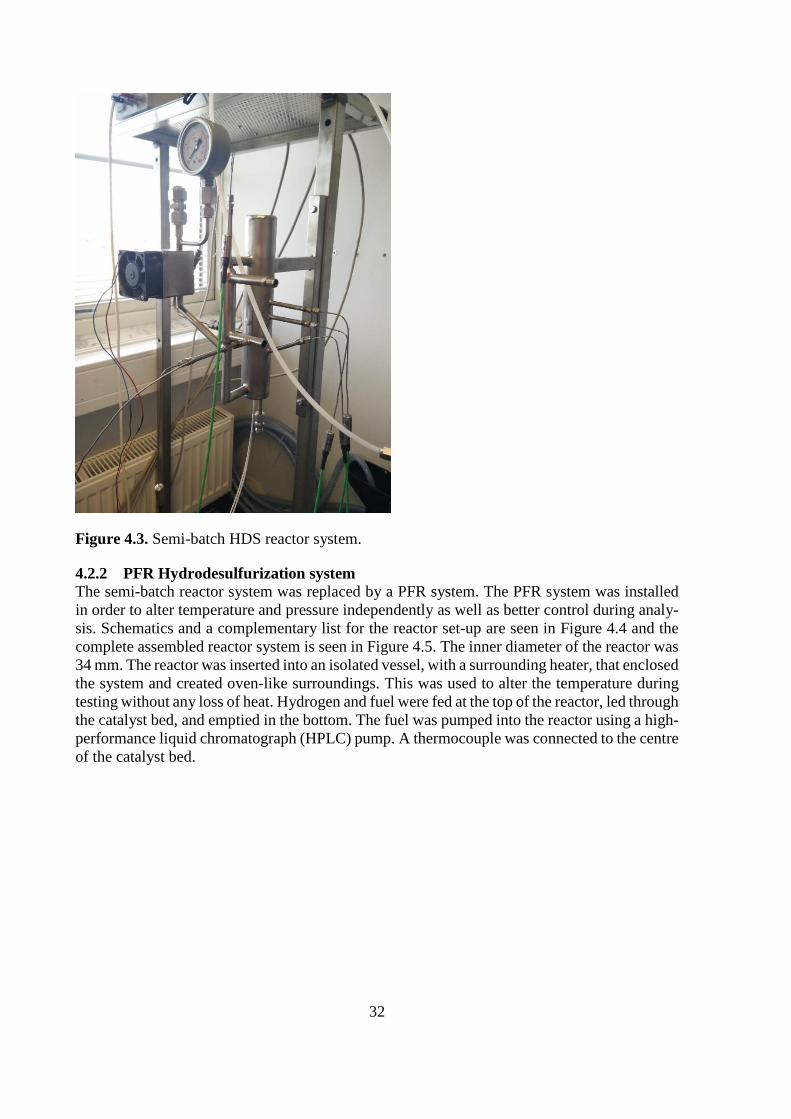
32
Figure 4.3. Semi-batch HDS reactor system.
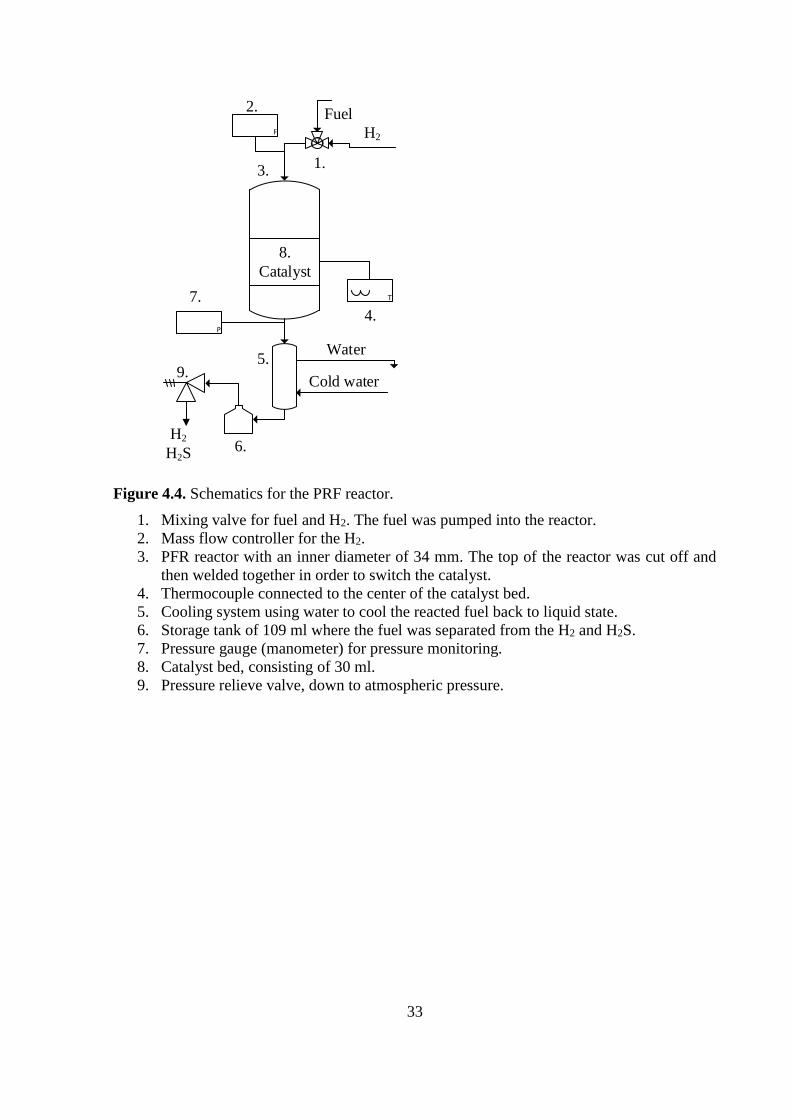
4.2.2 PFR Hydrodesulfurization system
The semi-batch reactor system was replaced by a PFR system. The PFR system was installed
in order to alter temperature and pressure independently as well as better control during analy-
sis. Schematics and a complementary list for the reactor set-up are seen in Figure 4.4 and the
complete assembled reactor system is seen in Figure 4.5. The inner diameter of the reactor was
34 mm. The reactor was inserted into an isolated vessel, with a surrounding heater, that enclosed
the system and created oven-like surroundings. This was used to alter the temperature during
testing without any loss of heat. Hydrogen and fuel were fed at the top of the reactor, led through
the catalyst bed, and emptied in the bottom. The fuel was pumped into the reactor using a high-
performance liquid chromatograph (HPLC) pump. A thermocouple was connected to the centre
of the catalyst bed.
33
F
2.Fuel
1.3.
T
4.
8.
Catalyst
5.
Cold water
6.H2
H2S
Water
P
7.
9.
H2
Figure 4.4. Schematics for the PRF reactor.
1. Mixing valve for fuel and H2. The fuel was pumped into the reactor.
2. Mass flow controller for the H2.
3. PFR reactor with an inner diameter of 34 mm. The top of the reactor was cut off and
then welded together in order to switch the catalyst.
4. Thermocouple connected to the center of the catalyst bed.
5. Cooling system using water to cool the reacted fuel back to liquid state.
6. Storage tank of 109 ml where the fuel was separated from the H2 and H2S.
7. Pressure gauge (manometer) for pressure monitoring.
8. Catalyst bed, consisting of 30 ml.
9. Pressure relieve valve, down to atmospheric pressure.
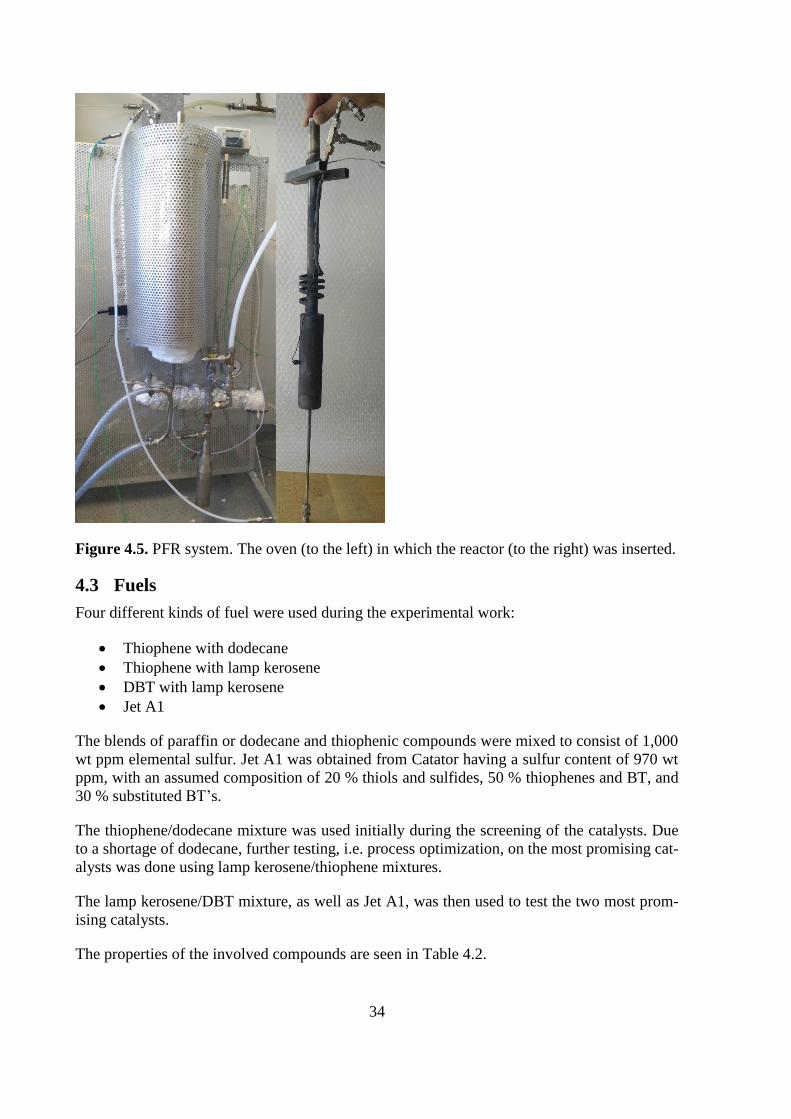
34
Figure 4.5. PFR system. The oven (to the left) in which the reactor (to the right) was inserted.
4.3 Fuels
Four different kinds of fuel were used during the experimental work:
Thiophene with dodecane
Thiophene with lamp kerosene
DBT with lamp kerosene
Jet A1
The blends of paraffin or dodecane and thiophenic compounds were mixed to consist of 1,000
wt ppm elemental sulfur. Jet A1 was obtained from Catator having a sulfur content of 970 wt
ppm, with an assumed composition of 20 % thiols and sulfides, 50 % thiophenes and BT, and
30 % substituted BT’s.
The thiophene/dodecane mixture was used initially during the screening of the catalysts. Due
to a shortage of dodecane, further testing, i.e. process optimization, on the most promising cat-
alysts was done using lamp kerosene/thiophene mixtures.
The lamp kerosene/DBT mixture, as well as Jet A1, was then used to test the two most prom-
ising catalysts.
The properties of the involved compounds are seen in Table 4.2.
35
Table 4.2. Properties for dodecane and the organosulfur compounds.
Molar mass
(g/mol)
Sulfur content
(wt%)
Density
(g/cm3)
Boiling point
(°C)
Dodecane 170.34 - 0.75 216
Thiophene 84.14 38.10 1.05 84
BT 134.2 23.89 1.15 221
DBT 184.26 17.40 1.25 333
4.4 Testing
The most important aspect of investigation in this thesis work was to find the best performing
catalysts, but it was also of interest to optimize reactor settings, where the catalytic activity was
sufficient, with regards to pressure, temperature and LHSV.
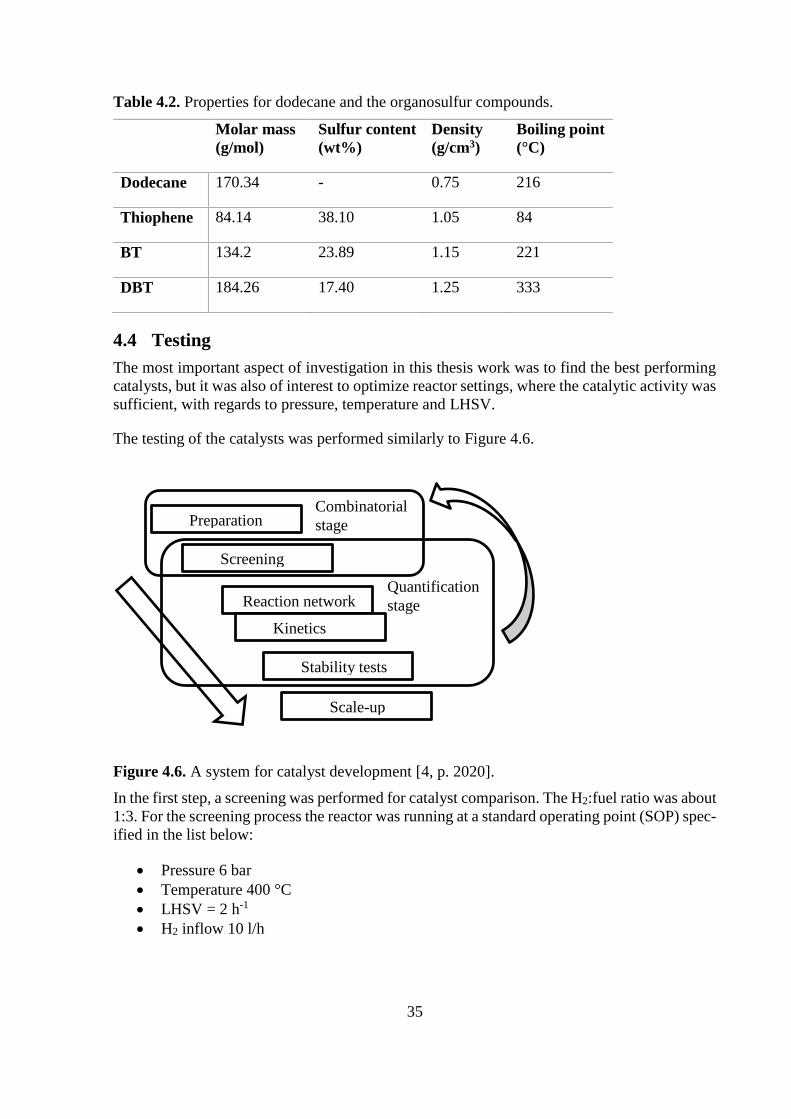
The testing of the catalysts was performed similarly to Figure 4.6.
Figure 4.6. A system for catalyst development [4, p. 2020].
In the first step, a screening was performed for catalyst comparison. The H2:fuel ratio was about
1:3. For the screening process the reactor was running at a standard operating point (SOP) spec-
ified in the list below:
Pressure 6 bar
Temperature 400 °C
LHSV = 2 h-1
H2 inflow 10 l/h
Combinatorial
stage
Quantification
stage
Preparation
Screening
Reaction network
Kinetics
Stability tests
Scale-up
36
The fuel used was the dodecane/thiophene mixture and the catalysts were compared with re-
spect to thiophene conversion. The two most promising catalysts proceeded for further investi-
gations.
For the purpose of optimization of reactor settings, the two catalysts that were chosen in the
screening step were used. The fuel used was the kerosene/thiophene mixture, and thiophene
conversion was again the deciding factor.
Temperature optimization: the system was run with LHSV = 2, a constant pressure of 6
bar, while altering the temperature between 250-450 °C with an interval of 50 °C.
Pressure optimization: the system was run with LHSV = 2, a constant temperature of
400 °C, while altering the pressure between 2-8 bar with an interval of 2 bar.
LHSV optimization: the system was run at 400 °C, 6 bar, while using LHSV = 1 and
LHSV = 4.
Finally, testing on Jet A1 was carried out at optimal process conditions with the two best
performing catalysts with regards for sulfur conversion.
4.5 Analysis
Three different methods for analysis have been used, one method for each sulfur compound.
Thiophene was analysed using a photoionization detector (PID), DBT was analysed by a GC
with a flame ionization detector (FID) and Jet A1 was analysed through Inductively Coupled
Plasma Mass Spectrometry (ICP-MS).
In the screening process, the product gas was injected to a GC for analysis of the sulfur content.
As a detector, a PID was used. A PID ionizes aromatic and unsaturated compounds by using
vacuum ultraviolet radiation. It measures the amount of collected electrons produced by the
ionization. The PID has little or no response for saturated hydrocarbons. [24, p. 582]
The analysis on the detailed attempts with DBT was done through GC-FID. In the flame, CH
radicals as CHO+ ions and electrons, are produced from carbon atoms. A current is produced
by eluted analytes, converted to a voltage and amplified, then the high-frequency noise is fil-
tered and finally converted to a digital signal. The sensitivity for FID is about 100 times higher
than for a thermal conductivity detector (TCD). [24, p. 581]
The product from the Jet A1 test was too crude to be analyzed through the regular PID and FID
detectors. Instead, it was sent for a total sulfur analysis to the department of Physical Geography
and Ecosystem Science at Lund University. ICP-MS has twice as high temperature than a com-
bustion flame, allowing for more elements to simultaneously be excited and measured. The
problem is that the number of emission lines is large and that there is no monochromator with
the required resolution to separate the plurality of lines of all elements in the sample. [24, p.
486]
37
5 Results
Screening
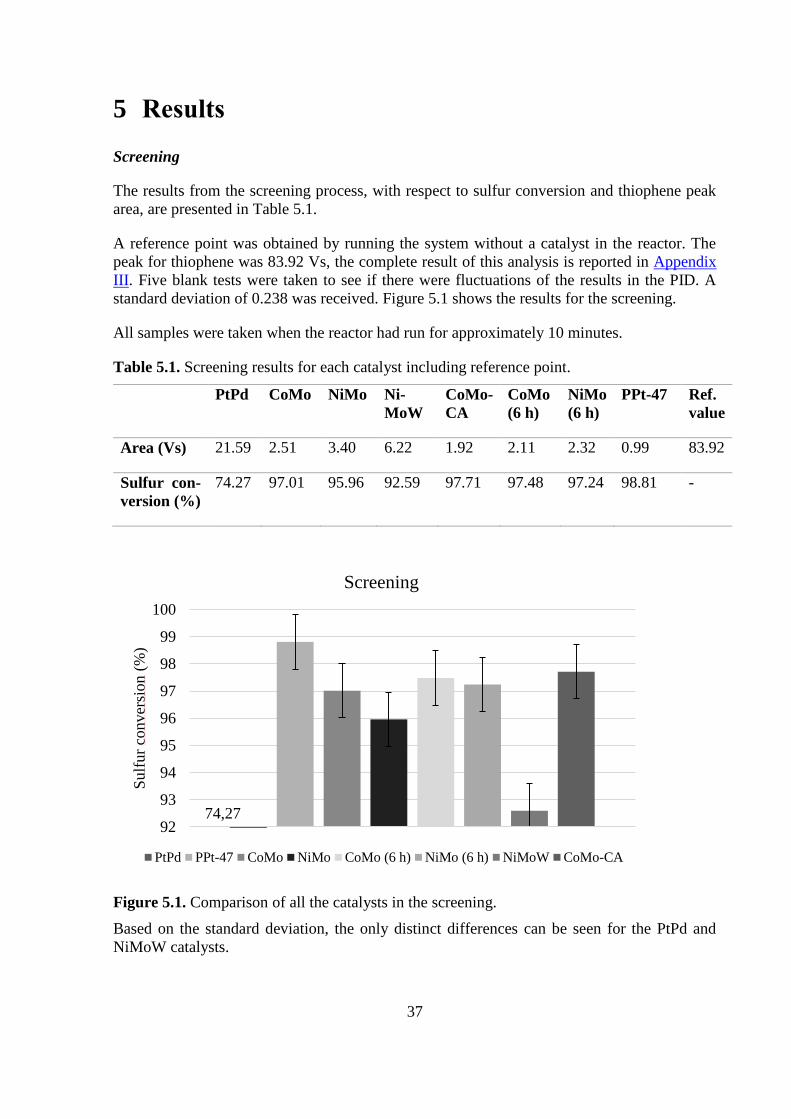
The results from the screening process, with respect to sulfur conversion and thiophene peak
area, are presented in Table 5.1.
A reference point was obtained by running the system without a catalyst in the reactor. The
peak for thiophene was 83.92 Vs, the complete result of this analysis is reported in Appendix
III. Five blank tests were taken to see if there were fluctuations of the results in the PID. A
standard deviation of 0.238 was received. Figure 5.1 shows the results for the screening.
All samples were taken when the reactor had run for approximately 10 minutes.
Table 5.1. Screening results for each catalyst including reference point.
PtPd CoMo NiMo Ni-
MoW
CoMo-
CA
CoMo
(6 h)
NiMo
(6 h)
PPt-47 Ref.
value
Area (Vs) 21.59 2.51 3.40 6.22 1.92 2.11 2.32 0.99 83.92
Sulfur con-
version (%)
74.27 97.01 95.96 92.59 97.71 97.48 97.24 98.81 -
Figure 5.1. Comparison of all the catalysts in the screening.
Based on the standard deviation, the only distinct differences can be seen for the PtPd and
NiMoW catalysts.
92
93
94
95
96
97
98
99
100
Su
lfur
conver
sion
(%)
Screening
PtPd PPt-47 CoMo NiMo CoMo (6 h) NiMo (6 h) NiMoW CoMo-CA
74,27
38
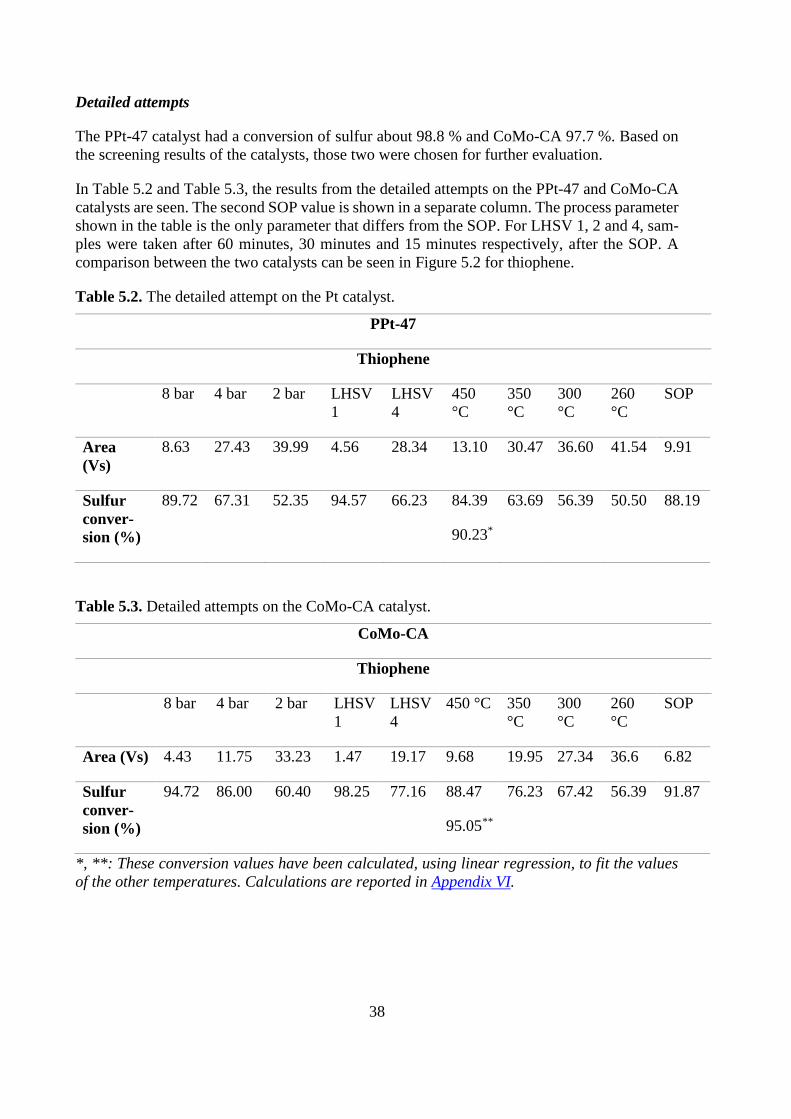
Detailed attempts
The PPt-47 catalyst had a conversion of sulfur about 98.8 % and CoMo-CA 97.7 %. Based on
the screening results of the catalysts, those two were chosen for further evaluation.
In Table 5.2 and Table 5.3, the results from the detailed attempts on the PPt-47 and CoMo-CA
catalysts are seen. The second SOP value is shown in a separate column. The process parameter
shown in the table is the only parameter that differs from the SOP. For LHSV 1, 2 and 4, sam-
ples were taken after 60 minutes, 30 minutes and 15 minutes respectively, after the SOP. A
comparison between the two catalysts can be seen in Figure 5.2 for thiophene.
Table 5.2. The detailed attempt on the Pt catalyst.
PPt-47
Thiophene
8 bar 4 bar 2 bar LHSV
1
LHSV
4
450
°C
350
°C
300
°C
260
°C
SOP
Area
(Vs)
8.63 27.43 39.99 4.56 28.34 13.10 30.47 36.60 41.54 9.91
Sulfur
conver-
sion (%)
89.72 67.31 52.35 94.57 66.23 84.39
90.23*
63.69 56.39 50.50 88.19
Table 5.3. Detailed attempts on the CoMo-CA catalyst.
CoMo-CA
Thiophene
8 bar 4 bar 2 bar LHSV
1
LHSV
4
450 °C 350
°C
300
°C
260
°C
SOP
Area (Vs) 4.43 11.75 33.23 1.47 19.17 9.68 19.95 27.34 36.6 6.82
Sulfur
conver-
sion (%)
94.72 86.00 60.40 98.25 77.16 88.47
95.05**
76.23 67.42 56.39 91.87
*, **: These conversion values have been calculated, using linear regression, to fit the values
of the other temperatures. Calculations are reported in Appendix VI.
39
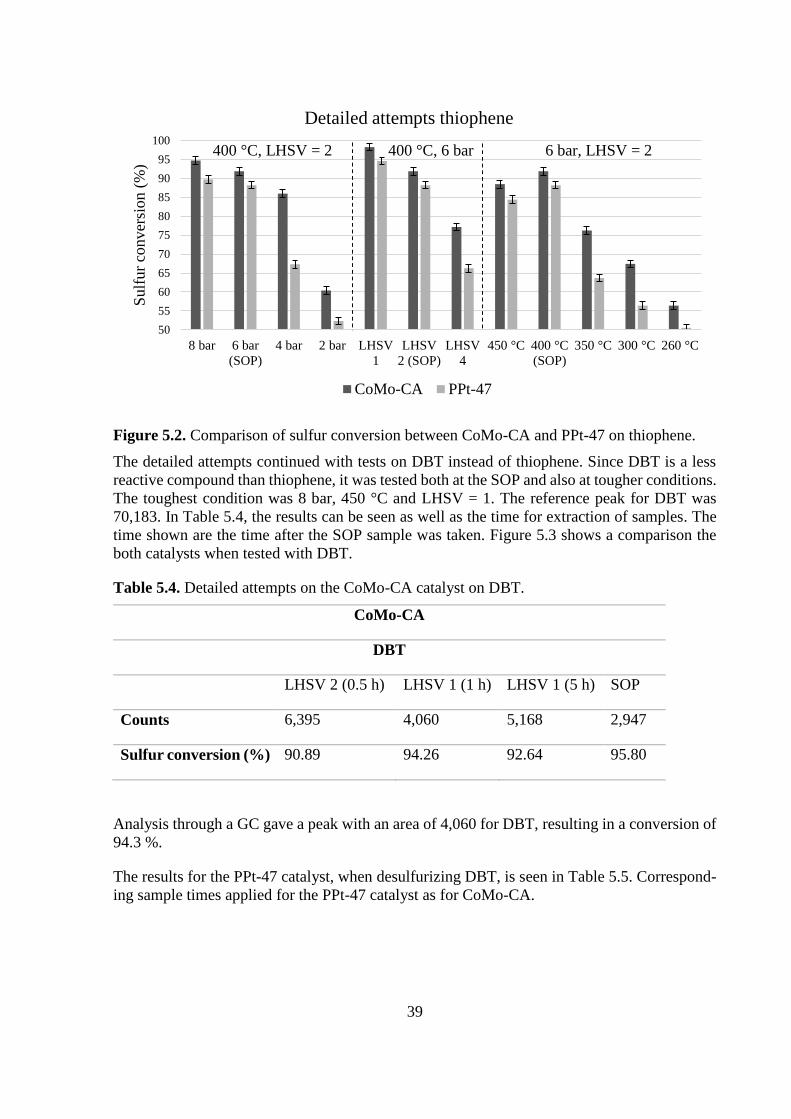
Figure 5.2. Comparison of sulfur conversion between CoMo-CA and PPt-47 on thiophene.
The detailed attempts continued with tests on DBT instead of thiophene. Since DBT is a less
reactive compound than thiophene, it was tested both at the SOP and also at tougher conditions.
The toughest condition was 8 bar, 450 °C and LHSV = 1. The reference peak for DBT was
70,183. In Table 5.4, the results can be seen as well as the time for extraction of samples. The
time shown are the time after the SOP sample was taken. Figure 5.3 shows a comparison the
both catalysts when tested with DBT.
Table 5.4. Detailed attempts on the CoMo-CA catalyst on DBT.
CoMo-CA
DBT
LHSV 2 (0.5 h) LHSV 1 (1 h) LHSV 1 (5 h) SOP
Counts 6,395 4,060 5,168 2,947
Sulfur conversion (%) 90.89 94.26 92.64 95.80
Analysis through a GC gave a peak with an area of 4,060 for DBT, resulting in a conversion of
94.3 %.
The results for the PPt-47 catalyst, when desulfurizing DBT, is seen in Table 5.5. Correspond-
ing sample times applied for the PPt-47 catalyst as for CoMo-CA.
50
55
60
65
70
75
80
85
90
95
100
8 bar 6 bar
(SOP)
4 bar 2 bar LHSV
1
LHSV
2 (SOP)
LHSV
4
450 °C 400 °C
(SOP)
350 °C 300 °C 260 °C
Sulf
ur
conver
sion (
%)
Detailed attempts thiophene
CoMo-CA PPt-47
400 °C, LHSV = 2 400 °C, 6 bar 6 bar, LHSV = 2
40
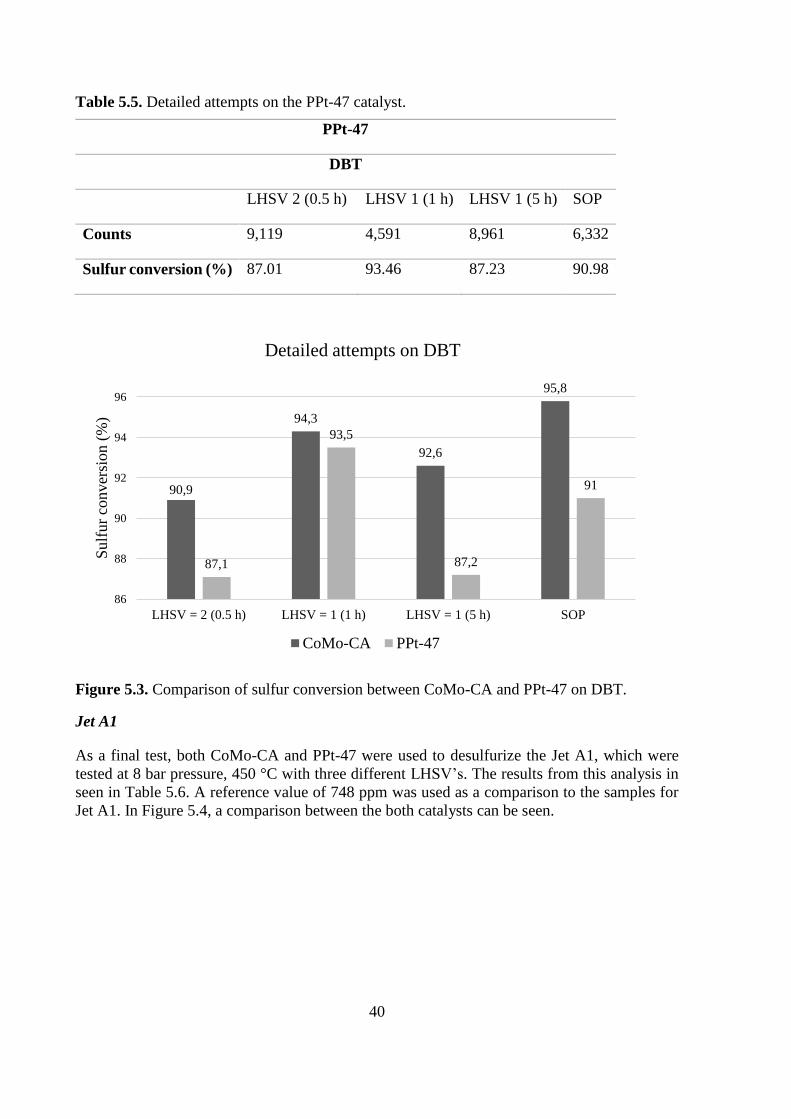
Table 5.5. Detailed attempts on the PPt-47 catalyst.
PPt-47
DBT
LHSV 2 (0.5 h) LHSV 1 (1 h) LHSV 1 (5 h) SOP
Counts 9,119 4,591 8,961 6,332
Sulfur conversion (%) 87.01 93.46 87.23 90.98
Figure 5.3. Comparison of sulfur conversion between CoMo-CA and PPt-47 on DBT.
Jet A1
As a final test, both CoMo-CA and PPt-47 were used to desulfurize the Jet A1, which were
tested at 8 bar pressure, 450 °C with three different LHSV’s. The results from this analysis in
seen in Table 5.6. A reference value of 748 ppm was used as a comparison to the samples for
Jet A1. In Figure 5.4, a comparison between the both catalysts can be seen.
90,9
94,3
92,6
95,8
87,1
93,5
87,2
91
86
88
90
92
94
96
LHSV = 2 (0.5 h) LHSV = 1 (1 h) LHSV = 1 (5 h) SOP
Sulf
ur
conver
sion (
%)
Detailed attempts on DBT
CoMo-CA PPt-47
41
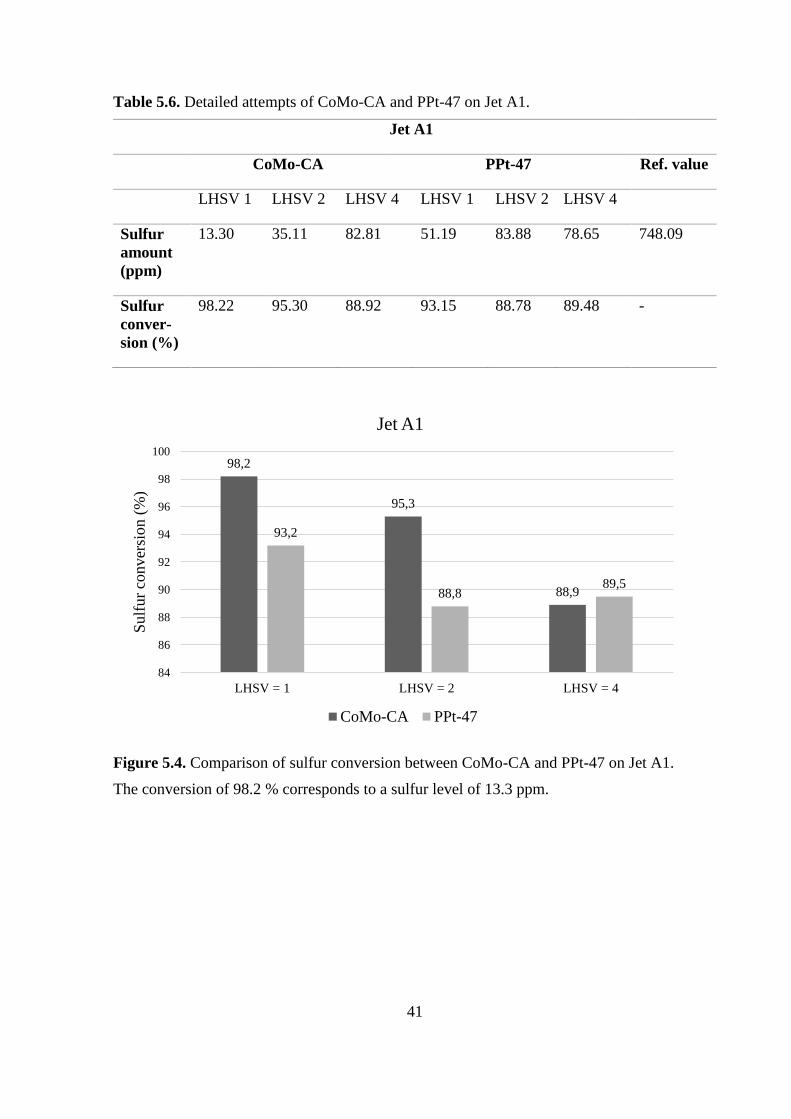
Table 5.6. Detailed attempts of CoMo-CA and PPt-47 on Jet A1.
Jet A1
CoMo-CA PPt-47 Ref. value
LHSV 1 LHSV 2 LHSV 4 LHSV 1 LHSV 2 LHSV 4
Sulfur
amount
(ppm)
13.30 35.11 82.81 51.19 83.88 78.65 748.09
Sulfur
conver-
sion (%)
98.22 95.30 88.92 93.15 88.78 89.48 -
Figure 5.4. Comparison of sulfur conversion between CoMo-CA and PPt-47 on Jet A1.
The conversion of 98.2 % corresponds to a sulfur level of 13.3 ppm.
98,2
95,3
88,9
93,2
88,889,5
84
86
88
90
92
94
96
98
100
LHSV = 1 LHSV = 2 LHSV = 4
Sulf
ur
conver
sion (
%)
Jet A1
CoMo-CA PPt-47

42
43
6 Discussion
To be able to reach as low sulfur levels as in industrial processes, harsh reaction conditions, a
large extent on sulfidation and optimal performance of catalysts is required. Within this thesis,
a micro scale reactor was used which was run at milder conditions than industrial systems. The
same degree of sulfidation, as is suggested in the literature, has not been possible. No charac-
terization, which is necessary to determine the catalyst structure-based performance, was done.
Therefore, in the discussion, when comparing results gathered in this thesis with literature, a
qualitative rather than quantitative approach has been taken.
Sulfidation
The catalysts were sulfided at a H2S/H2 ratio of 0.1 %, at 400 °C for 4 h or 6 h. In the sulfidation
methods encountered in literature, the temperature and duration corresponded to this, but the
H2S/H2 ratio was 10-15 % in different attempts. Despite the difference in activity exhibited by
the NiMo catalysts with the different sulfidation times, the effect of more extensive sulfidation
was not investigated in this thesis due to the health hazards of H2S.
Characterization
For further development of the prepared catalysts, characterization would be necessary. In ad-
dition of the BET-analysis that was performed on the non-impregnated alumina, it would be
essential to characterize the catalysts also after preparation, after sulfidation and after using
them in the reactor. After the preparation, x-ray photoelectron spectroscopy (XPS) and x-ray
diffraction (XRD) characterization would render information about the crystal structure and
identify the outermost atoms on the surface. This would indicate if the impregnation was suc-
cessful and would also be helpful for optimizing the sulfidation step. After the sulfidation, a
new XPS and XRD analysis would give valuable information about the amount and dispersion
of the active phase. After using the catalyst in the reactor system a second BET-analysis could
be done to see if any sintering has occurred. And, again, XPS and XRD would give information
on, e.g., the amount of chemisorption on the catalyst surface.
Gradients
The gradients mentioned in the report, namely concentration and temperature could have neg-
ative effects on the reactor system. Though, it is only believed that there was a concentration
gradient, in the axial dimension, since this is inevitable if there is any conversion of the reac-
tants. All other gradients have been disregarded.
As for the concentration gradient in the radial dimension, that arises from the radial dispersion
of reactants in the catalyst bed, it was neglected since the system is pressurized. The laminar
flow profile of the gas, before reaching the catalyst bed, entails a higher flow rate in the centre
of the pipe. Therefore, the “centre of the flow” is more affected by the pressure drop in the
catalyst bed, leading to a turbulent flow profile through the catalyst bed.
The reactor was inserted into an isolated vessel with a heater surrounding the reactor. This oven-
like set-up and the fact that the temperature was allowed to stabilize before any tests were run
leads to the conclusion that the temperature was constant throughout the system, most im-
portantly in the catalyst bed. The risk of a temperature gradient arising from exothermic or
44
endothermic reactions was disregarded due to the fact that the hydrotreating reaction for thio-
phene and DBT are only slightly exothermic, as reported in the literature study, and the whole
system was considered to run isothermally. Also, the amount of sulfur was low contributing to
that the exothermic reactions should not have affected.
The concentration gradient between the catalyst surface and the bulk, that depends on mass
transfer limitations, was neglected assumed no liquid film was formed on the catalyst. The ac-
tivation energy was calculated for the catalysts, and exceeded 20 kJ/mol for both, indicating
that some diffusion could have inhibited the reaction rates.
Sulfur compounds
Two different sulfur compounds were tested separately: thiophene and DBT mixed with either
dodecane or paraffin. Jet A1 as a fuel was tested and contained thiols, sulfides, thiophenes, BT
and alkylated BT's. Thiophene and DBT were chosen based on their difference in reactivity,
with thiophene being easily reacted in HDS and DBT being much more refractory. Alkyl sub-
stituted DBT’s, were chosen not to be evaluated since they demand harsh reactor conditions
and the micro scale set-up might not be enough to remove these compounds. Moreover, DBT
and the substituted DBT’s are not very common in Jet A1. Another factor favouring thiophene
and DBT is that they have been widely used in previous research on the activity of HDS-cata-
lysts. Jet A1 was chosen since this is the fuel on which the reactor is meant to run on when
instead in the complete FC-application system.
Reactor systems
Two reactor systems were used for testing: a semi-batch system and a PFR system. The semi-
batch system was introduced because of its easy handling in test runs. Though, with the semi-
batch system, the test results from the analysis were unreliable. The problem with the reactor
system was that when the reactor was heated, and the fuel started to boil some of the thiophene
exited through the H2S-drain, Figure 4.2. It was, therefore, hard to determine if the sulfur de-
tected by the GC were only H2S, resulting from the HDS reaction, or separated by boiling thi-
ophene. The boiling point for thiophene is a lot lower and could have started separating early
on during attempts.
Another disadvantage with the semi-batch system was that temperature and pressure could not
be altered independently, and their individual impact on the activity could not be investigated.
These reasons motivated the introduction of the PFR system. In the PFR system, the catalyst
activity was investigated based on thiophene or DBT-conversion, instead of H2S-formation, as
was the case for the semi-batch system. This removed the issue of having any unreacted or-
ganosulfur compound intervening with the analysis.
The PFR also enabled for more detailed testing regarding optimum reactor settings, since tem-
perature and pressure could be altered separately. In the PFR system, a high-pressure pump was
necessary to inject the fuel. This meant that one more component was involved in the system,
implicating a larger risk for failure in operation.
45
Screening tests
The noble metal catalysts exhibited large differences in catalytic activity in the screening test.
The commercial catalyst PPt-47 was the best catalyst with a thiophene conversion of 98.81 %
while the PtPd catalyst, manufactured within this thesis work, had a thiophene conversion of
74.27 %, which was worse than all other catalysts. The poor activity of the PtPd catalyst might
be a result of a too high sulfur level in the fuel. As reported by Sarrazin et al. [4, p. 2715], this
type of catalyst is more suitable for pretreated fuels, with low sulfur levels. The PPt-47 has a
high level of active metal on the very surface of the alumina pellets. As for the PtPd catalyst,
some amount of the active metals may have been absorbed by the pellet leading to a reduced
activity.
There was a slight difference in activity for the NiMo and CoMo catalysts sulfided for 4 h, and
those sulfided for 6 h. Only 1.33 % and 0.48 % better conversion for NiMo and CoMo respec-
tively. Although the differences in activity corresponded to the trends suggested by the
literature, it is hard to assign them to the altered sulfidation time.
The NiMoW catalyst gave a slightly lower sulfur conversion than the CoMo catalyst and the
NiMo catalysts without the added tungsten, differing from what Thomazeau et al. [25] sug-
gested. This may be due to a complicated preparation process for this catalyst. After adding the
pH-adjusting ammonia to the impregnation solution, its volume greatly exceeded that of the
alumina pores. Also, two phases emerged in the solution, and it is possible that some of the
active phases remained in the precipitated phase.
The CoMo-CA catalyst, prepared with citric acid present in the impregnation step, gave a sulfur
conversion negligibly higher than the CoMo catalyst prepared in a conventional way. Stanislaus
et al. [9] suggested that an important effect of the chelating agent was to increase the sulfidation
temperature of the promoter metals, and since the extent of sulfidation for the catalysts in this
thesis work is significantly less than what literature proposes, the effect of the chelating agent
might not assert itself.
Detailed tests
When increasing the pressure, or decreasing the LHSV in the reactor system, the literature sug-
gests, that the sulfur conversion should increase. These trends are evident in the detailed at-
tempts run on PPt-47 and CoMo-CA, presented in Table 5.2 and Table 5.3 respectively.
According to literature HDS activity should increase when reactor temperature is increased,
within reasonable limits. This pattern is seen for both catalysts, with the exception of the con-
version at the SOP which exceeds the conversion reached at 450 °C. The expected values have
been calculated through linear regression and were found to be 90.22 % for PPt-47 and 95.05
% for CoMo-CA, instead of 84.39 % and 88.47 %, which was the result of the analysis. By-
products, similar to thiophene could have been formed at the high temperature, contributing to
an apparent lower sulfur conversion than was expected. Another explanation could be that the
thiophene, adsorbed on the catalyst at lower temperature testing, was fully desorbed at 450 °C,
leading to an increased sulfur concentration in the product gas.
In the detailed attempts, the sulfur conversion was lower than in the screening when comparing
the SOP results. In the screening tests, samples were taken after ca 8 minutes, instead of after
30 minutes as in the detailed attempts. The reason for the difference can be explained by an
46
adsorption of the sulfur compounds to the catalyst pellets, contributing to a lower sulfur content
in the outlet stream, at an early stage of the attempt. At steady state, when the sulfur compounds
have broken through the catalyst bed, and the sulfur levels are dependent only on the catalyst
activity, the measured sulfur levels are higher. Thiophene is rather easily reacted and should
not take very long time to reach steady-state, though steady-state was not reached during the
screening tests.
When desulfurizing the more refractory DBT’s, literature proposes more severe reactor condi-
tions, why the tests were conducted at a pressure of 8 bar and a temperature of 450 °C, and the
only process parameter altered was the fuel flow. In accordance with the literature, the conver-
sion for both CoMo-CA and PPt-47 was higher at a LHSV 1 than for LHSV 2.
Comparing the sample taken after of 1 h with the sample taken after 5 h of operation (at 8 bar,
450 °C, LHSV 1), the 1 h sample shows a higher conversion. This is evident for both catalysts
and can be seen in Table 5.4 and Table 5.5. This indicates the absorption of sulfur compounds
to the catalyst, as previously described. Also, when comparing the SOP values for PPt-47 and
CoMo-CA on DBT and thiophene, a lower conversion of sulfur is expected for DBT. However,
the results are the opposite, which again indicates that there is an absorption and that the effect
is more prominent for DBT than for thiophene.
Jet A1-attempts
For the CoMo-CA catalyst, the sulfur conversion increases as the LHSV decreases. This trend
is expected and is coherent both with literature and with previous investigations on the effect
of LHSV conducted in the detailed attempts. Although a lower sulfur conversion was expected,
since Jet A1 contains rather refractory sulfur compounds such as BT and substituted BT’s. This
can be explained by the diversity of sulfur compounds present in the Jet A1. Compounds such
as thiols and thiophenes are easily reacted and indicate a high total sulfur conversion, even if
the more refractory compounds remain unreacted. This effect is more prominent for high
LHSV’s.
The result, in sulfur conversion, for PPt-47 at LHSV 4 (89.48 %) was higher than the result for
LHSV 2 (88.78 %). The former value is higher than anticipated. It could not be concluded if
this was an error in the analysis or the sample was taken earlier on than it should, contributing
to a higher sulfur conversion.
47
7 Conclusion
Using a microscale catalytic reactor system, the primary goal was to reduce the sulfur level of
the Jet A1 to a level below 10 ppm, thereby making it feasible for use in FC applications. A
level of 13.3 ppm was achieved and several factors may have inhibited the performance of the
system; the micro scale set-up, the level of sulfidation and the structure of the manufactured
catalysts.
PPt-47 and CoMo-CA exhibited the highest conversion in the catalyst screening tests. These
catalysts were used in the detailed attempts, run on thiophene and DBT, and the effects of pres-
sure, temperature and LHSV, in the interval of 260-400 °C, were in accordance with previous
research. At the highest temperature, 450 °C, the conversion was lower than expected, and these
results are regarded as a consequence of adsorption of the sulfur compounds to the catalyst
pellets. As for their individual activity, the CoMo-CA has consistently been the better perform-
ing catalyst.
The results for Jet A1 follow the same trends as the detailed attempts, with CoMo-CA outper-
forming the PPt-47. Though, the overall conversion of the Jet A1 attempts was higher than what
the detailed attempts suggest, and this is believed to be a result of a complete conversion of the
least refractory compounds, while some of the substituted BT’s remained unreacted.
As for gradients in the system, the activation energy indicates that mass transport limitations
have been present in the catalyst pores. This did not affect the catalyst screening test but likely
suppressed the overall activity of the system.

48

49
8 Future work
Since the activity of the catalysts increased using longer sulfidation time, or higher H2S/H2
ratio, it would be interesting to further evaluate the effect of the extent of sulfidation on the
sulfur conversion. On the same subject, it would be useful to optimize the sulfidation method,
and for this optimization characterization of the catalyst surface would be necessary. Charac-
terization would also give information about possible sintering of the catalyst pellets.
Investigating the time it takes to reach steady-state for both thiophene and DBT would be in-
teresting in order to determine the sulfur conversion based on the actual HDS-activity of the
catalysts rather than on chemisorption.
The experimental values obtained throughout the thesis work can be used in order to model
the correlation between temperature, pressure and LHSV expressed in conversion (x), and can
be seen in the equation below: 𝑥 = 1 − 𝑒𝑘0⋅𝑃⋅𝑒𝐸𝑎𝑅⋅𝑇⋅
𝑊
𝐹 ,𝑊
𝐹=
1
𝐿𝐻𝑆𝑉
This correlation can be set up as a 3D-model to overview how the sulfur conversion is af-
fected by all of the parameters. The model gives the opportunity to see how the system per-
forms even at reactor settings that were not tested.

50
51
9 Reference list
[1] J. A. Moulijn, M. Makkee, and A. E. Van Diepen, Chemical Process Technology. 2013.
[2] I. I. Novochinskii, C. Song, X. Ma, X. Liu, L. Shore, J. Lampert, and R. J. Farrauto,
“Low-Temperature H2S Removal from Steam-Containing Gas Mixtures with ZnO for
Fuel Cell Application. 1. ZnO Particles and Extrudates,” Energy, vol. 81, no. 2, pp. 584–
589, 2004.
[3] C. Mengel, D. M. Konrad, and L. Hartmann, “Liquid logistic fuels for fuel cells –
requirements and prospects.”
[4] G. Ertl, H. Knözinger, F. Schüth, J. W. Editors, W. V. Gmbh, and C. Kgaa, HANDBOOK
OF HETEROGENEOUS CATALYSIS, vol. 7, no. 4. 2008.
[5] L. Li and D. L. King, “H2S removal with ZnO during fuel processing for PEM fuel cell
applications,” Catal. Today, vol. 116, no. 4, pp. 537–541, 2006.
[6] R. K. Shah, “Introduction to Fuel Cells,” no. 1, pp. 1–9.
[7] B. Cook, “Introduction to fuel cells and hydrogen technology,” no. December, 2002.
[8] F. Barbir, “PEM Fuel Cells,” PEM Fuel Cells, pp. 373–434, 2013.
[9] A. Stanislaus, A. Marafi, and M. S. Rana, “Recent advances in the science and
technology of ultra low sulfur diesel (ULSD) production,” Catal. Today, vol. 153, no.
1–2, pp. 1–68, 2010.
[10] R. Ojeda, J. A.; Krishna, “STRIPPING OF H2S IN GASOIL
HYDRODESULPHURIZATION Reactor Design Considerations,” Chem. Eng., vol. 82,
no. February, pp. 208–214, 2004.
[11] C. Hulteberg, “An Introduction to Catalysis,” vol. 1, 2015.
[12] C. Hulteberg, “Hulteberg Chemistry & Engineering Catalysis – from idea to
implementation,” pp. 1–37, 2016.
[13] G. W. Roberts, Chemical Reactions and Chemical Reactors. 2008.
[14] M. K. Andari, F. Abu-Seedo, A. Stanislaus, and H. M. Qabazard, “Kinetics of individual
sulfur compounds in deep hydrodesulfurization of Kuwait diesel oil,” Fuel, vol. 75, no.
14, pp. 1664–1670, 1996.
[15] H. Farag, D. D. Whitehurst, K. Sakanishi, and I. Mochida, “Carbon versus Alumina as a
Support for Co-Mo Catalysts Reactivity towards HDS of Dibenzothiophenes and Diesel
Fuel,” Catal. Today, vol. 50, no. 1, pp. 9–17, 1999.
[16] J. M. Sánchez, E. Ruiz, and J. Otero, “Selective Removal of Hydrogen Sulfide from
Gaseous Streams Using a Zinc-Based Sorbent,” Ind. Eng. Chem. Res., vol. 44, no. 2, pp.
241–249, 2005.
52
[17] K. Kim and N. Park, “Removal of Hydrogen Sulfide from a Steam-Hydrogasifier
Product Gas by Zinc Oxide Sorbent,” J. Ind. Eng. Chem., vol. 16, no. 6, pp. 967–972,
2010.
[18] A. Behr, “Hetergenous Catalysis and Solid Catalysts, 2. Development and Types of Solid
Catalysts,” Ullmann’s Encyclopedia of Industrial Chemistry. pp. 223–269, 2012.
[19] H. Topsøe, B. S. Clausen, and F. E. Massoth, Hydrotreating Catalysis, vol. 11. 1996.
[20] H. Topsøe, B. S. Clausen, N.-Y. Topsøe, and P. Zeuthen, “Catalysts in Petroleum
Refining 1989, Proceedings of the Conference on Catalysts in Petroleum Refining,”
Stud. Surf. Sci. Catal., vol. 53, no. vi, pp. 77–102, 1989.
[21] H. Topsøe, “The role of Co-Mo-S type structures in hydrotreating catalysts,” Appl. Catal.
A Gen., vol. 322, no. SUPPL., pp. 3–8, 2007.
[22] J. Ramirez, “Titania-alumina mixed oxides as supports for molybdenum hydrotreating
catalysts,” vol. 93, pp. 163–180, 1993.
[23] T. A. Stiles, Alvin B.; Koch, Catalyst Manufacture, 2nd ed. CRC Press, 1995.
[24] D. C. Harris, Quantitative Chemical Analysis, no. 8. W. H. Freeman, 2010.
[25] C. Thomazeau, C. Geantet, M. Lacroix, M. Danot, V. Harlé, and P. Raybaud, “Predictive
approach for the design of improved HDT catalysts: γ-Alumina supported (Ni, Co)
promoted Mo1-xWxS2 active phases,” Appl. Catal. A Gen., vol. 322, no. SUPPL., pp.
92–97, 2007.
53
10 Appendices
Appendix I: Catalyst recipes
Appendix II: List of chemicals for catalyst manufacture
Appendix III: Results from analysis
Appendix IV: PPt-47 – Product Data Sheet
Appendix V: Bet Summary Report
Appendix VI: Expected sulfur conversion at 450 °C

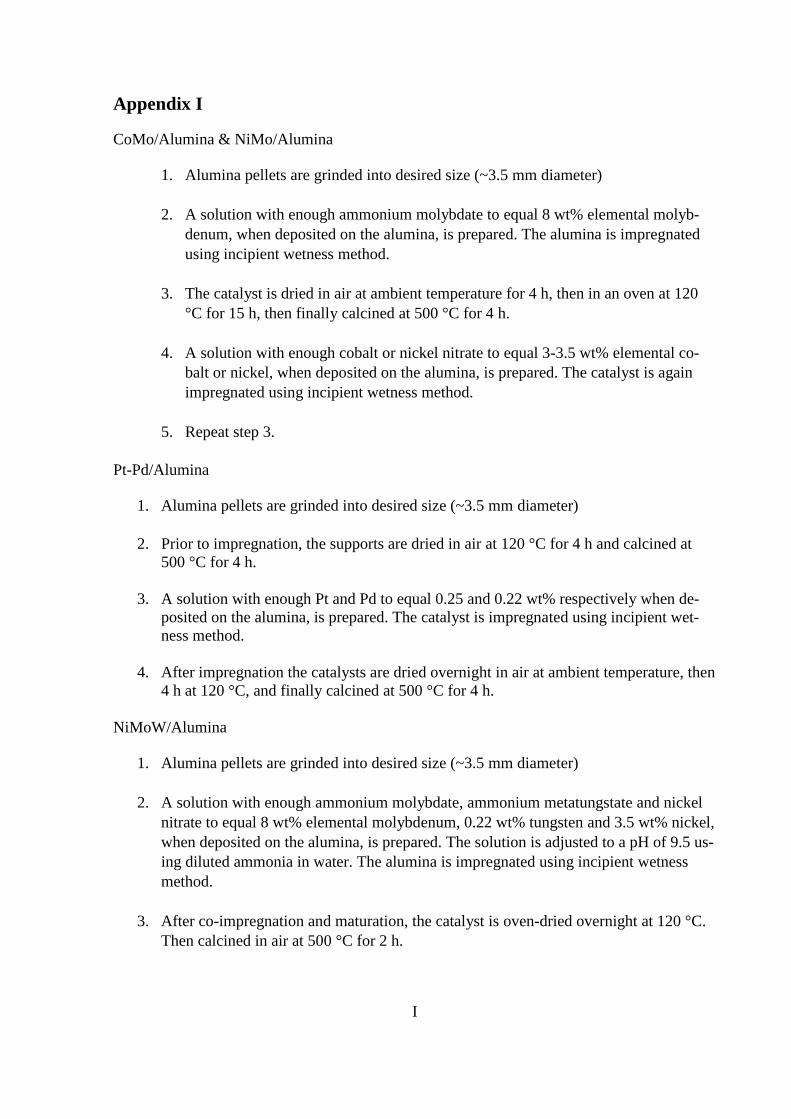
I
Appendix I
CoMo/Alumina & NiMo/Alumina
1. Alumina pellets are grinded into desired size (~3.5 mm diameter)
2. A solution with enough ammonium molybdate to equal 8 wt% elemental molyb-
denum, when deposited on the alumina, is prepared. The alumina is impregnated
using incipient wetness method.
3. The catalyst is dried in air at ambient temperature for 4 h, then in an oven at 120
°C for 15 h, then finally calcined at 500 °C for 4 h.
4. A solution with enough cobalt or nickel nitrate to equal 3-3.5 wt% elemental co-
balt or nickel, when deposited on the alumina, is prepared. The catalyst is again
impregnated using incipient wetness method.
5. Repeat step 3.
Pt-Pd/Alumina
1. Alumina pellets are grinded into desired size (~3.5 mm diameter)
2. Prior to impregnation, the supports are dried in air at 120 °C for 4 h and calcined at
500 °C for 4 h.
3. A solution with enough Pt and Pd to equal 0.25 and 0.22 wt% respectively when de-
posited on the alumina, is prepared. The catalyst is impregnated using incipient wet-
ness method.
4. After impregnation the catalysts are dried overnight in air at ambient temperature, then
4 h at 120 °C, and finally calcined at 500 °C for 4 h.
NiMoW/Alumina
1. Alumina pellets are grinded into desired size (~3.5 mm diameter)
2. A solution with enough ammonium molybdate, ammonium metatungstate and nickel
nitrate to equal 8 wt% elemental molybdenum, 0.22 wt% tungsten and 3.5 wt% nickel,
when deposited on the alumina, is prepared. The solution is adjusted to a pH of 9.5 us-
ing diluted ammonia in water. The alumina is impregnated using incipient wetness
method.
3. After co-impregnation and maturation, the catalyst is oven-dried overnight at 120 °C.
Then calcined in air at 500 °C for 2 h.
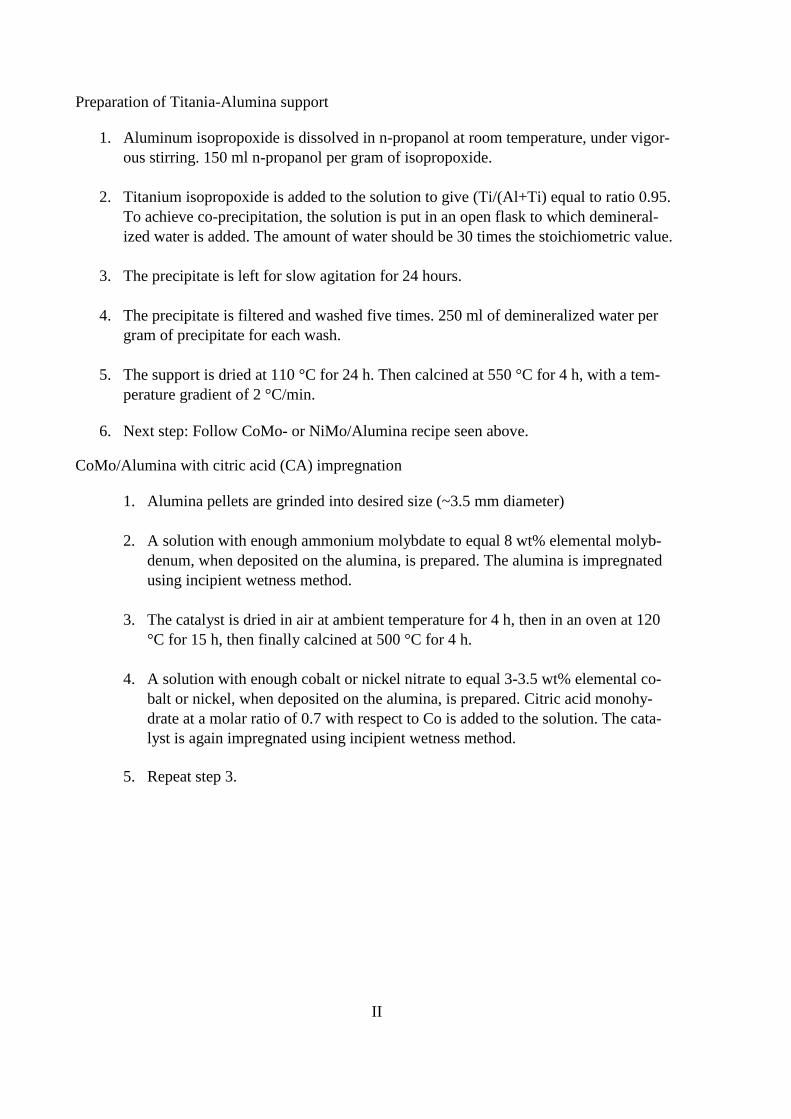
II
Preparation of Titania-Alumina support
1. Aluminum isopropoxide is dissolved in n-propanol at room temperature, under vigor-
ous stirring. 150 ml n-propanol per gram of isopropoxide.
2. Titanium isopropoxide is added to the solution to give (Ti/(Al+Ti) equal to ratio 0.95.
To achieve co-precipitation, the solution is put in an open flask to which demineral-
ized water is added. The amount of water should be 30 times the stoichiometric value.
3. The precipitate is left for slow agitation for 24 hours.
4. The precipitate is filtered and washed five times. 250 ml of demineralized water per
gram of precipitate for each wash.
5. The support is dried at 110 °C for 24 h. Then calcined at 550 °C for 4 h, with a tem-
perature gradient of 2 °C/min.
6. Next step: Follow CoMo- or NiMo/Alumina recipe seen above.
CoMo/Alumina with citric acid (CA) impregnation
1. Alumina pellets are grinded into desired size (~3.5 mm diameter)
2. A solution with enough ammonium molybdate to equal 8 wt% elemental molyb-
denum, when deposited on the alumina, is prepared. The alumina is impregnated
using incipient wetness method.
3. The catalyst is dried in air at ambient temperature for 4 h, then in an oven at 120
°C for 15 h, then finally calcined at 500 °C for 4 h.
4. A solution with enough cobalt or nickel nitrate to equal 3-3.5 wt% elemental co-
balt or nickel, when deposited on the alumina, is prepared. Citric acid monohy-
drate at a molar ratio of 0.7 with respect to Co is added to the solution. The cata-
lyst is again impregnated using incipient wetness method.
5. Repeat step 3.
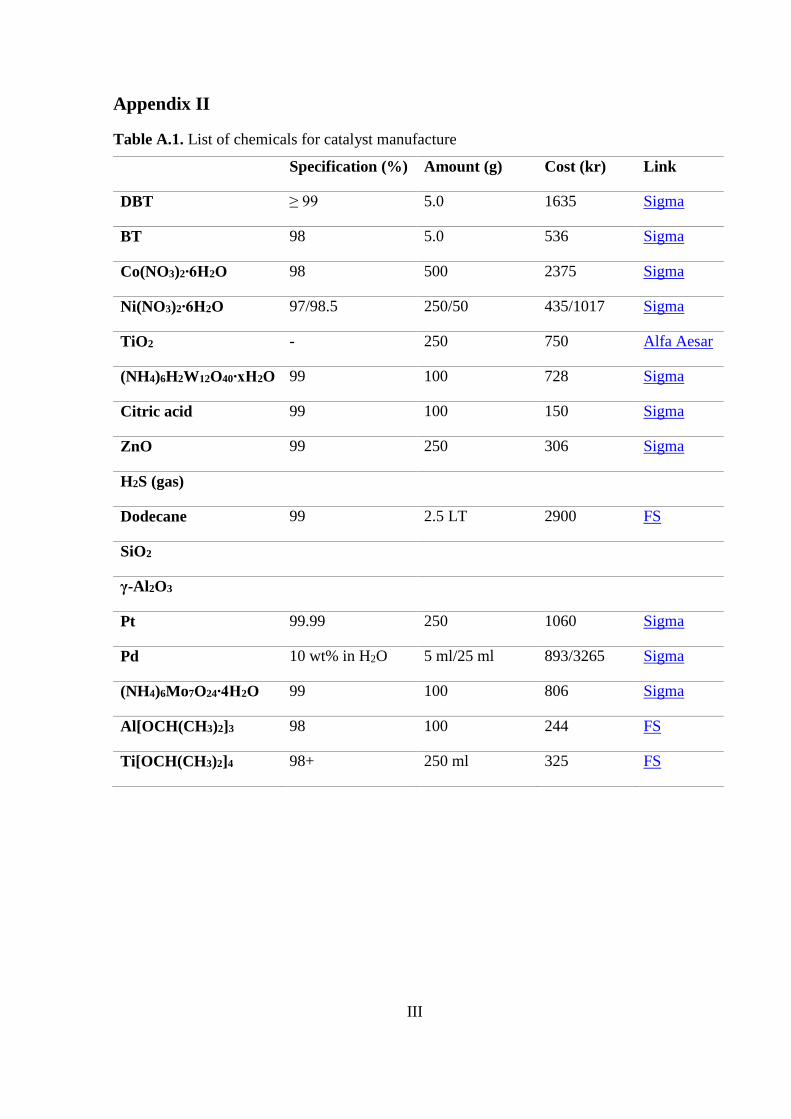
III
Appendix II
Table A.1. List of chemicals for catalyst manufacture
Specification (%) Amount (g) Cost (kr) Link
DBT ≥ 99 5.0 1635 Sigma
BT 98 5.0 536 Sigma
Co(NO3)2∙6H2O 98 500 2375 Sigma
Ni(NO3)2∙6H2O 97/98.5 250/50 435/1017 Sigma
TiO2 - 250 750 Alfa Aesar
(NH4)6H2W12O40∙xH2O 99 100 728 Sigma
Citric acid 99 100 150 Sigma
ZnO 99 250 306 Sigma
H2S (gas)
Dodecane 99 2.5 LT 2900 FS
SiO2
γ-Al2O3
Pt 99.99 250 1060 Sigma
Pd 10 wt% in H2O 5 ml/25 ml 893/3265 Sigma
(NH4)6Mo7O24∙4H2O 99 100 806 Sigma
Al[OCH(CH3)2]3 98 100 244 FS
Ti[OCH(CH3)2]4 98+ 250 ml 325 FS
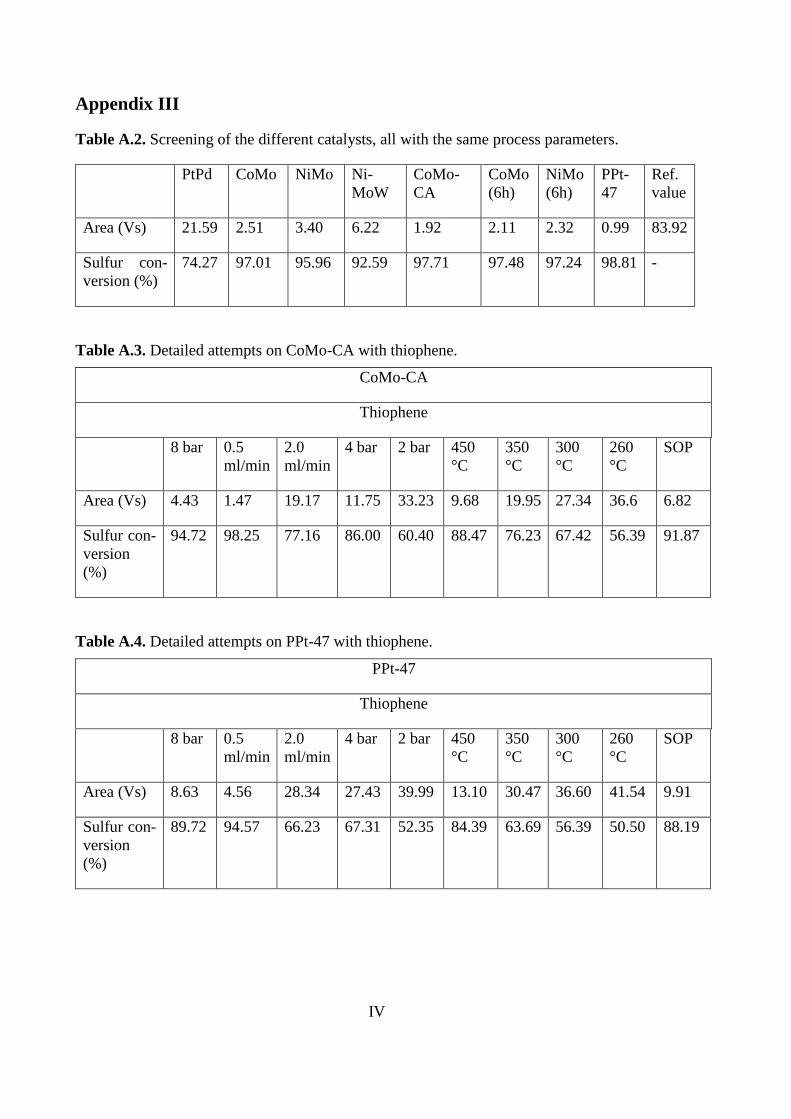
IV
Appendix III
Table A.2. Screening of the different catalysts, all with the same process parameters.
PtPd CoMo NiMo Ni-
MoW
CoMo-
CA
CoMo
(6h)
NiMo
(6h)
PPt-
47
Ref.
value
Area (Vs) 21.59 2.51 3.40 6.22 1.92 2.11 2.32 0.99 83.92
Sulfur con-
version (%)
74.27 97.01 95.96 92.59 97.71 97.48 97.24 98.81 -
Table A.3. Detailed attempts on CoMo-CA with thiophene.
CoMo-CA
Thiophene
8 bar 0.5
ml/min
2.0
ml/min
4 bar 2 bar 450
°C
350
°C
300
°C
260
°C
SOP
Area (Vs) 4.43 1.47 19.17 11.75 33.23 9.68 19.95 27.34 36.6 6.82
Sulfur con-
version
(%)
94.72 98.25 77.16 86.00 60.40 88.47 76.23 67.42 56.39 91.87
Table A.4. Detailed attempts on PPt-47 with thiophene.
PPt-47
Thiophene
8 bar 0.5
ml/min
2.0
ml/min
4 bar 2 bar 450
°C
350
°C
300
°C
260
°C
SOP
Area (Vs) 8.63 4.56 28.34 27.43 39.99 13.10 30.47 36.60 41.54 9.91
Sulfur con-
version
(%)
89.72 94.57 66.23 67.31 52.35 84.39 63.69 56.39 50.50 88.19
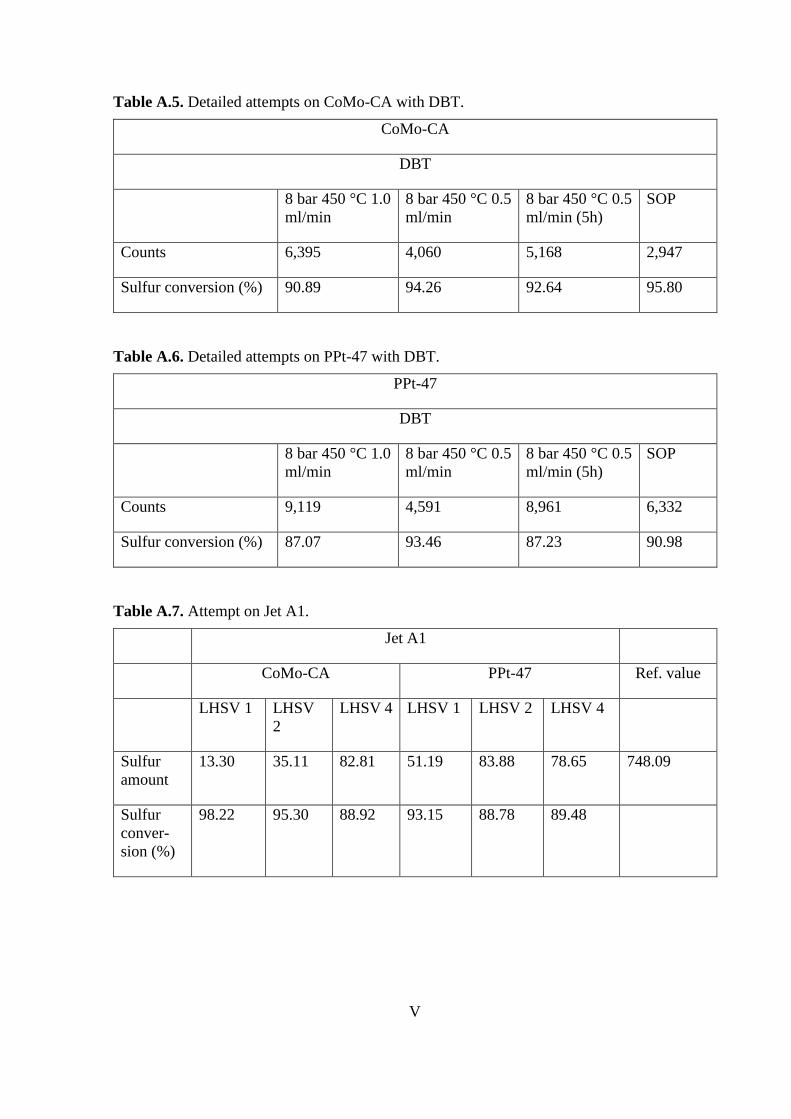
V
Table A.5. Detailed attempts on CoMo-CA with DBT.
CoMo-CA
DBT
8 bar 450 °C 1.0
ml/min
8 bar 450 °C 0.5
ml/min
8 bar 450 °C 0.5
ml/min (5h)
SOP
Counts 6,395 4,060 5,168 2,947
Sulfur conversion (%) 90.89 94.26 92.64 95.80
Table A.6. Detailed attempts on PPt-47 with DBT.
PPt-47
DBT
8 bar 450 °C 1.0
ml/min
8 bar 450 °C 0.5
ml/min
8 bar 450 °C 0.5
ml/min (5h)
SOP
Counts 9,119 4,591 8,961 6,332
Sulfur conversion (%) 87.07 93.46 87.23 90.98
Table A.7. Attempt on Jet A1.
Jet A1
CoMo-CA PPt-47 Ref. value
LHSV 1 LHSV
2
LHSV 4 LHSV 1 LHSV 2 LHSV 4
Sulfur
amount
13.30 35.11 82.81 51.19 83.88 78.65 748.09
Sulfur
conver-
sion (%)
98.22 95.30 88.92 93.15 88.78 89.48
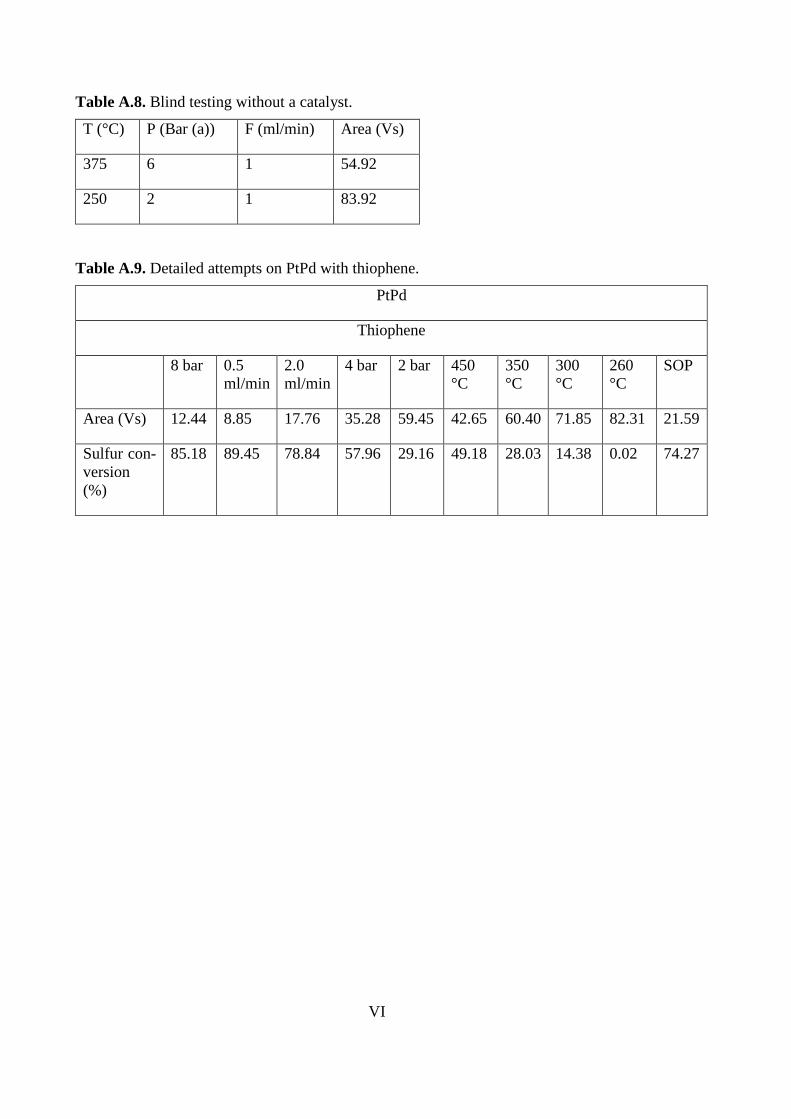
VI
Table A.8. Blind testing without a catalyst.
T (°C) P (Bar (a)) F (ml/min) Area (Vs)
375 6 1 54.92
250 2 1 83.92
Table A.9. Detailed attempts on PtPd with thiophene.
PtPd
Thiophene
8 bar 0.5
ml/min
2.0
ml/min
4 bar 2 bar 450
°C
350
°C
300
°C
260
°C
SOP
Area (Vs) 12.44 8.85 17.76 35.28 59.45 42.65 60.40 71.85 82.31 21.59
Sulfur con-
version
(%)
85.18 89.45 78.84 57.96 29.16 49.18 28.03 14.38 0.02 74.27
VII
Appendix IV
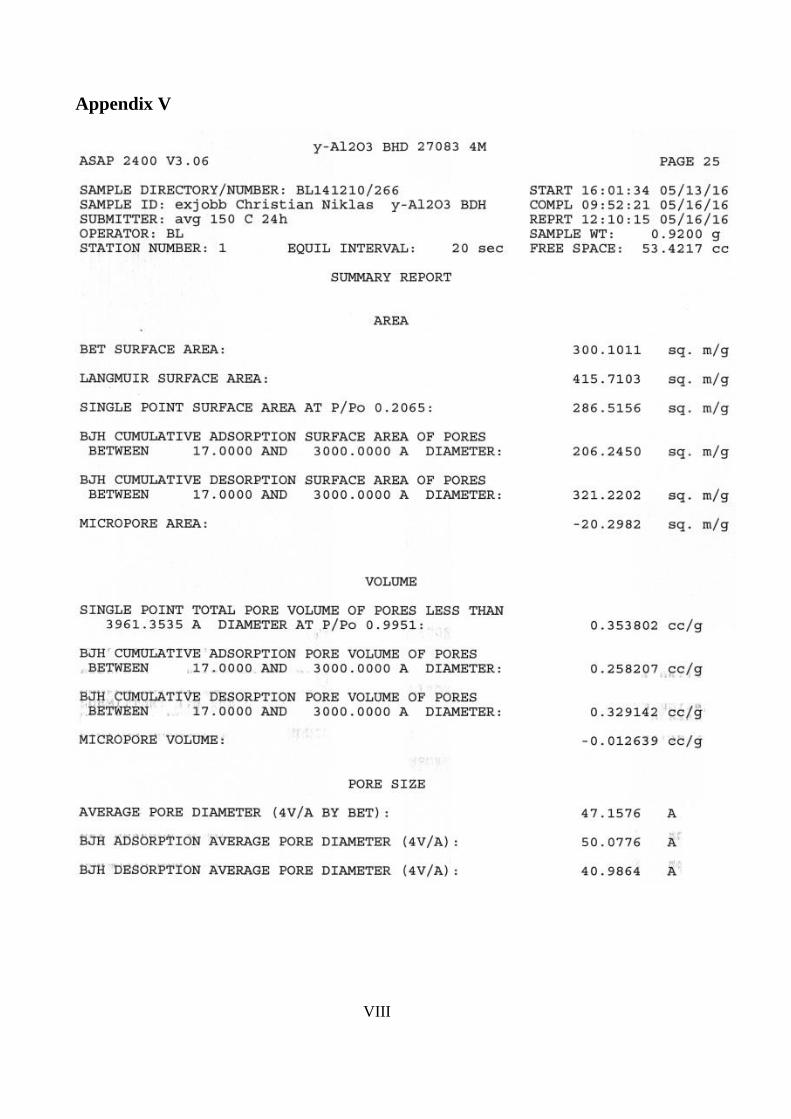
VIII
Appendix V
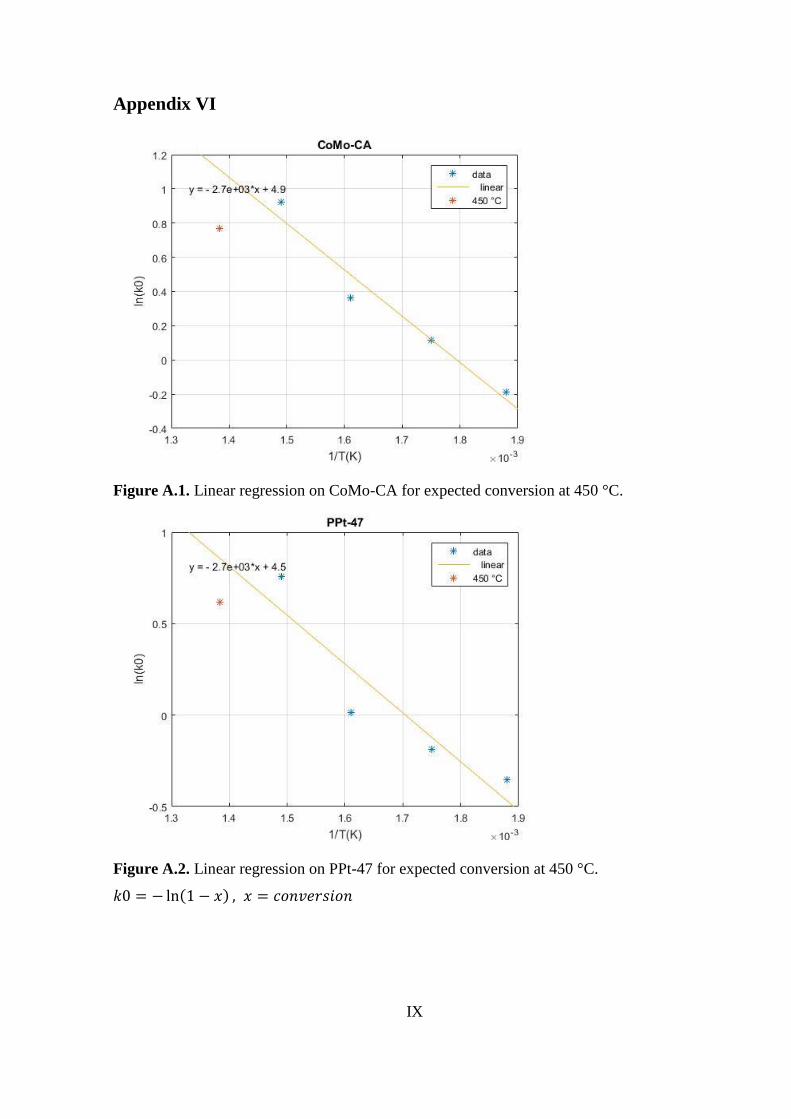
IX
Appendix VI
Figure A.1. Linear regression on CoMo-CA for expected conversion at 450 °C.
Figure A.2. Linear regression on PPt-47 for expected conversion at 450 °C.
𝑘0 = − ln(1 − 𝑥) , 𝑥 = 𝑐𝑜𝑛𝑣𝑒𝑟𝑠𝑖𝑜𝑛
Top Related