
γλώσσες
Σελίδες
Νομικός

3Agro FOOD Industry Hi Tech - vol 25(5) - September October 2014
After injecting 5 μL of sample extract, the separation was performed in the Agilent/eclipse XDBC-18 4.6x150 mm column. Two solvents were used for the gradient elution: A-(H2O+5 percent HCOOH) and B-(80 percent ACN+5 percentHCOOH+H2O). The elution program used was as follows: from 0 to 10 min 0 percent B, from 10 to 28 min gradually increases 0-25 percent B, from 28 to 30 min 25 percent B, from 30 to 35 min gradually increases 25-50 percent B, from 35 to 40 min gradually increases 50-80 percent B, and finally for the last 5 min gradually decreases 80-0 percent B. The detection wavelengths were 320, 360 and 520 nm. The identification and quantitation of the various phenolic compounds were performed by means of calibration curves obtained with standard solutions of cyanidin 3-glucoside, pelargonidin 3-glucoside, quercetin, kaemferol, and p-coumaric acid. The results are expressed as mg/100 g of d.f.
Statistical analysisThe data were reported as mean±standard deviation (SD) with triplicate determinations. The significance of inter-group differences was determined by the analysis of variance (ANOVA). The p value of p<0.05 was considered statistically significant.
RESULTS
Strawberry fruits contain compounds that exhibit antioxidant, anticancer, antiatherosclerotic, antiinflammatory and anti-neurodegenerative properties. The total phenolics, flavonoids, and the antioxidant capacity determined by spectrophotometry in each dried strawberry sample grown in the Serbia presented in Table 1. The content of total phenolics in strawberry extracts was determined spectrophotometrically using Folin-Ciocalteau reagent and calculated as Galic Acig Equivalent (GAE). The highest quantity of total phenolics was achieved in acetone extracts (14.93 – 20.38 mg GAE/g d.f.) and the lowest in methanol extracts (9.59 – 15.02 mg GAE/g d.f.). In our study we observed that the solvent used in the extraction of strawberry samples had a significant effect (p<0.05) on the total phenols content of the extracts. Some differences were found between wild strawberries grown in different location in Serbia (Vlasina and Jastrebac), also, and between cv. “Roxana” grown in different location (Velika Plana, Vladicin Han). All of these differences were statistically significant.The total flavonoid content of dried strawberries was also determined. The amounts of total flavonoid content in different solvent extracts of strawberries is shown in Table 1. The results revealed that extractability of flavonoids was also affected by the solvent used. The acetone was the best solvent for extracting flavonoid compounds (mean 10.52 mg CE/g d.f.). The methanol and ethanol were not good solvent for extraction of flavonoids from strawberries. The flavonoids were found in high concentrations ranging from 52.8 to 65.2 percent of total phenolic content in samples.
The radical scavenging activity of dried strawberries was measured using the DPPH radical assay. The method was based on the reaction of stable DPPH nitrogen radicals in the presence of antioxidants. The total antioxidant activity of the dried strawberry extracts tested varied. The
and Watman No.1 filter paper. The solid residues were rinsed for several times in order to gain transparent extracts. Finally, the obtained strawberry extracts were collected in a graduated flask of the same volume of 50 ml.
Determination of the total phenolic compoundsFolin-Ciocalteu reagent was used to determined the total phenolic compounds (TP) (5). A volume of 1 mL of dried strawberry extract, diluted 5-6 times with some solvent (to obtain absorbance within the range of the prepared calibration curve), was mixed with 0.5 mL of Folin-Ciocalteu reagent previous diluted with distilled water (1:2). A volume of 2 mL of 20 percent sodium carbonate solution was added to the mixture, shaken thoroughly and diluted to 10 mL by adding the distilled water. The mixture was to stand for 120 min and the blue colour formed was measured at 760 nm with a spectrophotometer (UV/Vis spectrometer agilent 8454; agilent, Santa Clara, CA, USA). Gallic acid (GA) was used as a standard for the calibration curve. The concentrations of gallic acid in the solution from which the curve was prepared were 0,50, 100, 150, 250, and 500 mg/L (R2=0,996). The content of TP was expressed as mg of gallic acid equivalent (GAE)/g of dried fruit (d.f.). All measurements were carried out in 3 repetitions.
Determination of the total flavonoid contentThe total flavonoids (TF) assay was performed as previously described by Yang et al. (2004) (6) with minor modifications. A volume of 1 mL of diluted extracts or standard solution of gallic acid (50-500 mg/L) was placed in a 10-mL volumetric flask, then 4 mL of deionized water, after 5 min 0.3 ml of NaNO2 (5 percent) and 1.5 mL of AlCl3 (2 percent) were added. The mixture was shaken and 5 min later 2 ml of 1M solution of NaOH were added, again well shaken. The absorbance was measured at 510 nm against the blank. The results were calculated according to the calibration curve for gallic acid (R2=0,998). The content of TF was expressed as mg of catechin equivalent (GAE)/g d.f. All samples were analyzed in triplicate.
Measurements of DPPH• scavenging activityThe free radical scavenging capacity of dried strawberry extracts was determined according to the previously reported procedure using the stable (DPPH) radicals (7). The method was based on the reduction of stable DPPH nitrogen radicals in the presence of antioxidants. An aliquot of vineyard peach extracts or methanol solution of Trolox (10-30 mM) was mixed with 2.5 mL of 0.1 mM DPPH methanolic solution. The mixture was thoroughly vortexed, kept in the dark for 30 min, and after that the absorbance was measured at 515 nm against a blank of methanol without DPPH. The results were calculated according to the calibration curve for Trolox (R2=0.994). DPPH values, derived from triplicate analysis, were expressed as mmol of TE/g d.f.
HPLC-DAD determination of phenolics compositionThe individual phenolics were analyzed by the direct injection of the extracts (previously filtered through a 0.45 μm pore size membrane filter) into a Agilent 1200 chromatographic system equipped with a quaternary pump, and Agilent 1200 DAD with radiofrequency identification tracking technology for flow cells, a UV lamp, an 8 μL flow cell, and automatic injector and ChemStation softwere. The columm temperature was 30°C.
KEYWORDS: strawberry, solvent extraction, phenolic compounds, antioxidant activity
AbstractStrawberry fruits contain phenolic compounds that exhibit antioxidant, anticancer, antitherosclerotic, antiinflammatory and anti-neurodegenerative properties. This study was aimed to evaluate and
characterize the phenolic composition and antioxidant activities of wild and cultivated strawberries native to Serbia. Three solvent systems were used for phenolic extraction (methanol, ethanol, and acetone) at the same concentrations (70 percent) and with 100 percent deionized water in presence 0.1 percent HCl. The efficiency of the solvents used to extract phenols from the 4 dried strawberry samples varied considerably. The polyphenol content of the dried strawberry samples was 9.54 to 20.38 mg gallic acid equivalent/g dried fruit. Photodiode-array detection (DAD) has been used for screening of the different classes of phenolic compounds. The total phenolics and antioxidant activities in extracts of a wild strawberry were higher than those cultivated samples.
Effects of solvent extraction system on concentration and antioxidant activity of strawberry phenolics
2
INTRODUCTION
Berries such as strawberres are widely appreciated for its characteristic aroma, bright red colour, juicy texture and sweetness. They are used as processed food materials for juice, jam, dried fruits, ice cream, etc., and therefore are quite prevalent in our lives. Berries contain many phenolic substances, and attention is being paid to health promoting foods that have phenolic bioactivities (1). Strawberries are a very rich source of polyphenols in the human diet containing polyphenols from all classes. The variety and high content makes strawberries a very interesting sample for studies of polyphenols (2-4).The critical point in studying polyphenols in fruit materials is the extraction procedure used since it dictates the nature and quantity of polyphenols that will be transferred to the extract and futher characterized. Their polarity makes them soluble in several types of polar solvents, such as methanol, ethanol, acetone, and water. Solvent extraction of polyphenolics is the initial step prior to quantification, purification, separation, and characterisation and generally involved the use of an acidified extragent.The main objective of this study were to determine the polyphenolic content and antioxidant capacity of wild and cultivated strawberries from two different geographical regions and to examine the efficiency of different solvent systems for the extraction of polyphenols. The phenolic compounds were extracted from the fruits by using three conventional solvents, namely methanol, ethanol and acetone.
MATERIAL AND METHODS
ChemicalsStandards of catechin, quercetin, kaemferol, and phenolic acid standards, such as gallic, p-coumaric, and ellagic acids, were purchased from Sigma-Aldrich (St. Louis, MO, USA). Cyaniding 3-glucoside and pelargonidin 3-glucoside were purchased from Extrasynthese (Ganay, France). DPPH were purchased from Sigma-Aldrich (Steinheim, Germany). Trolox and Folin-Ciocalteu,s phenol reagent were obtained from Merck (Darmstadt, Germany). Other chemicals and solvent were of analytical grade.
Fruit samplesStrawberry cultivar “Roxana” from two different geographical regions: Velika Plana (sample 1) and Vladicin Han (sample 2) and wield strawberry from two different geographical regions: Jastrebac (sample 3) and Vlasina (sample 4) were analyzed. The strawberries were harvested at commercial ripeness. The strawberries were harvested on May 2009, 500g was randomly sampled and samples were taken from 20 bushes and dried at room temperature until content weight.Firstly, strawberry samples (10g) in blender were homogenous, and samples (each weighted 3.00 g) extracted with the methanol-water system, ethanol-water system, and acetone-water system (80 percent methanol, ethanol, or acetone) containing 0.1 percent HCl volumes (20, 10 and 10 ml, respectively) 3 times in the further course. The samples were mixed in an ultrasound bath during the extraction procedure. Such obtained extracts were filtered using the Bucher funnel
ANTIOXIDANTSMILAN N. MITIĆ, DANIJELA A. KOSTIĆ, ALEKSANDRA N. PAVLOVIĆ, DANICA S. DIMITRIJEVIC*,
JOVANA N VELJKOVIC*Corresponding author
University of Niš, Faculty of Sciences and Mathematics, Department of Chemistry, Višegradska 33, P.O.Box 224, 18000 Niš, Serbia
Agro FOOD Industry Hi Tech - vol 25(5) - September October 2014
Danica S. Dimitrijevic
54 Agro FOOD Industry Hi Tech - vol 25(5) - September October 2014 Agro FOOD Industry Hi Tech - vol 25(5) - September October 2014
polar solvents (16). Also, the present study revealed that the wild strawberries to Serbia contained higher total phenolics (mean 19.60 mg GAE/g d.f.) compared to cv. “Roxana” (mean 17.97 mg GAE/g d.f). Generrally, strawberry fruits grown in the Serbia are a rich source of poliphenols. Kähkönen et al. (2001) (17) found similar content of total phenolics in strawberries (16.0 – 24.1 mg GAE/g d.f. using 70 percent acetone as extraction solvent).Flavonoids are a group of polyphenolic compounds naturally present in most edible fruit and vegetable plants. They constitute most of the yellow, red and blue colours in the fruit (18). Flavonoids from the fruit and vegetables are currently widely studied as components that have the potential to provide multiple health benefits.Methanol-water with 0.1 percent HCl mixture has been used for extraction systematical study at anthocyanins in fruits and berries (2, 3). Also, the highest phenolic acid content were observed in extracts with methanol. The results are in accordance with those reported by Beevi et al. (2010) (16).The results of this study of flavonols agree will with the literature (3, 19). Among with flavonols quercetin and kaemferol, some authors reported low level of myricetin (20, 21).According to previous study, the main representative of phenolic acids in strawberry was ellagic acid or its derivatives, followed by p-coumaric acid with is consistent with the results in this study (15, 19). Some authors reported that the p-coumaric acid was the dominant phenolic acid in strawberries, with ellagic acid being second (20).
CONCLUSIONS
As a continuation of our study on strawberry extracts were prepared using different organic solvents. As observed, extracts with higher antioxidant activity also had higher polyphenolic content. Acetone showed slightly better characteristics than ethanol and methanol as a solvent for total phenolic compounds, total flavonoids and flavonols. The highest anthocyanin and phenolic acid content were observed in extract with methanol. Our results can contributed to the selection of the most efficient extraction solvents to be use when analysis of total extractable polyphenols or specific groups of polyphenols are to be
Table 3 shows the levels of the flavonols determined in dried strawberries samples. The concentration of the total flavonols was the lowest in sample 1 with a mean content 10.46 mg/100g d.f. and highest in sample 2, with a mean content 29.41 mg/100g d.f. in this study, quercetin was the main flavonol (>79.9 percent of total flavonol amount), followed by kaemferol. Quercetin content ranged from 4.85 to 32.92 mg/100g d.f. Myrecetin was no detected in all samples. The different results may be explained by differences in growing conditions. Also, the different extraction conditions influenced the results.The HPLC chromatogram of dried strawberry extract, recorded at 320 nm with a diode array detector, is shown in Figure 3. Content of phenolic acids is given in Table 4.
In strawberry, the concentration of phenolic acids was higher than concentration of flavonoids. The main phenolic acid found in strawberry was ellagic acid (mean 31.58 mg/100g d.f in methanol extracts), followed by p-coumaric acid (mean 20.26 mg/100g d.f.).
DISCUSSION
Previous studies indicated a similar trend whereby the most typical polyphenolics were significantly extracted into the
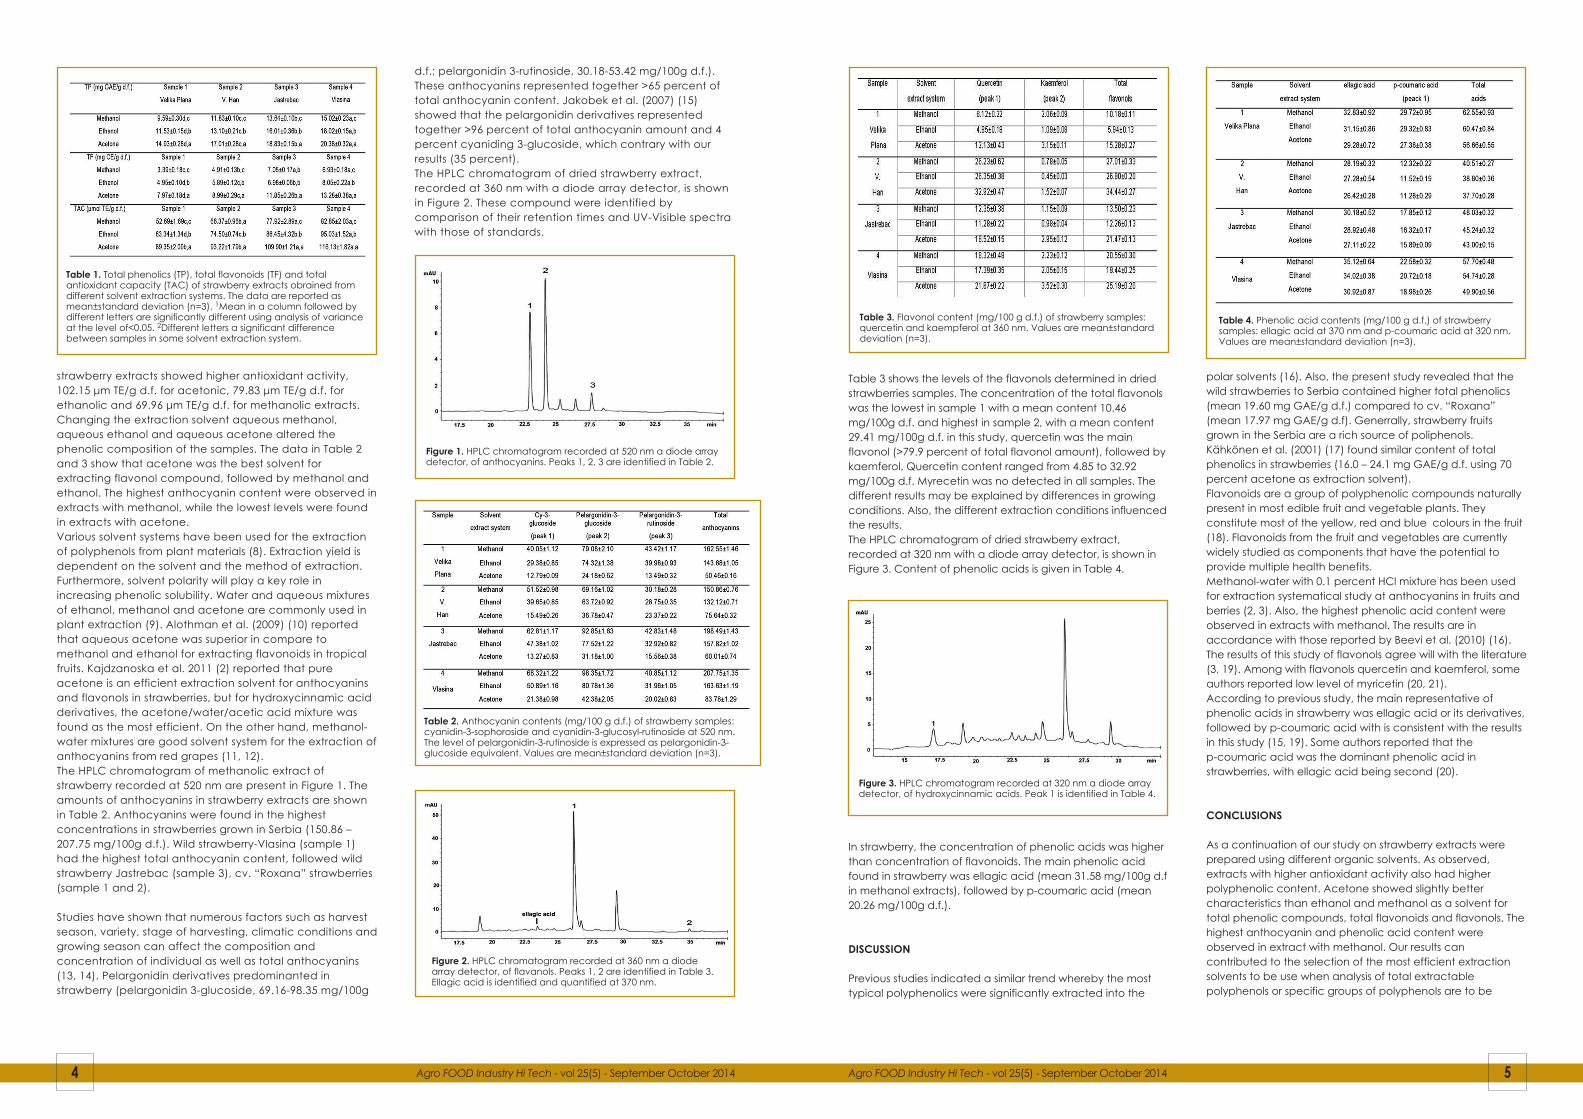
d.f.; pelargonidin 3-rutinoside, 30.18-53.42 mg/100g d.f.). These anthocyanins represented together >65 percent of total anthocyanin content. Jakobek et al. (2007) (15) showed that the pelargonidin derivatives represented together >96 percent of total anthocyanin amount and 4 percent cyaniding 3-glucoside, which contrary with our results (35 percent).The HPLC chromatogram of dried strawberry extract, recorded at 360 nm with a diode array detector, is shown in Figure 2. These compound were identified by comparison of their retention times and UV-Visible spectra with those of standards.
strawberry extracts showed higher antioxidant activity, 102.15 μm TE/g d.f. for acetonic, 79.83 μm TE/g d.f. for ethanolic and 69.96 μm TE/g d.f. for methanolic extracts.Changing the extraction solvent aqueous methanol, aqueous ethanol and aqueous acetone altered the phenolic composition of the samples. The data in Table 2 and 3 show that acetone was the best solvent for extracting flavonol compound, followed by methanol and ethanol. The highest anthocyanin content were observed in extracts with methanol, while the lowest levels were found in extracts with acetone.Various solvent systems have been used for the extraction of polyphenols from plant materials (8). Extraction yield is dependent on the solvent and the method of extraction. Furthermore, solvent polarity will play a key role in increasing phenolic solubility. Water and aqueous mixtures of ethanol, methanol and acetone are commonly used in plant extraction (9). Alothman et al. (2009) (10) reported that aqueous acetone was superior in compare to methanol and ethanol for extracting flavonoids in tropical fruits. Kajdzanoska et al. 2011 (2) reported that pure acetone is an efficient extraction solvent for anthocyanins and flavonols in strawberries, but for hydroxycinnamic acid derivatives, the acetone/water/acetic acid mixture was found as the most efficient. On the other hand, methanol-water mixtures are good solvent system for the extraction of anthocyanins from red grapes (11, 12).The HPLC chromatogram of methanolic extract of strawberry recorded at 520 nm are present in Figure 1. The amounts of anthocyanins in strawberry extracts are shown in Table 2. Anthocyanins were found in the highest concentrations in strawberries grown in Serbia (150.86 – 207.75 mg/100g d.f.). Wild strawberry-Vlasina (sample 1) had the highest total anthocyanin content, followed wild strawberry Jastrebac (sample 3), cv. “Roxana” strawberries (sample 1 and 2).
Studies have shown that numerous factors such as harvest season, variety, stage of harvesting, climatic conditions and growing season can affect the composition and concentration of individual as well as total anthocyanins (13, 14). Pelargonidin derivatives predominanted in strawberry (pelargonidin 3-glucoside, 69.16-98.35 mg/100g
Table 1. Total phenolics (TP), total flavonoids (TF) and total antioxidant capacity (TAC) of strawberry extracts obrained from different solvent extraction systems. The data are reported as mean±standard deviation (n=3). 1Mean in a column followed by different letters are significantly different using analysis of variance at the level of<0.05. 2Different letters a significant difference between samples in some solvent extraction system.
Figure 1. HPLC chromatogram recorded at 520 nm a diode array detector, of anthocyanins. Peaks 1, 2, 3 are identified in Table 2.
Table 2. Anthocyanin contents (mg/100 g d.f.) of strawberry samples: cyanidin-3-sophoroside and cyanidin-3-glucosyl-rutinoside at 520 nm. The level of pelargonidin-3-rutinoside is expressed as pelargonidin-3-glucoside equivalent. Values are mean±standard deviation (n=3).
Figure 2. HPLC chromatogram recorded at 360 nm a diode array detector, of flavanols. Peaks 1, 2 are identified in Table 3. Ellagic acid is identified and quantified at 370 nm.
Table 3. Flavonol content (mg/100 g d.f.) of strawberry samples: quercetin and kaempferol at 360 nm. Values are mean±standard deviation (n=3).
Figure 3. HPLC chromatogram recorded at 320 nm a diode array detector, of hydroxycinnamic acids. Peak 1 is identified in Table 4.
Table 4. Phenolic acid contents (mg/100 g d.f.) of strawberry samples: ellagic acid at 370 nm and p-coumaric acid at 320 nm.Values are mean±standard deviation (n=3).
6 Agro FOOD Industry Hi Tech - vol 25(5) - September October 2014
8. A.A. Mohday, M.A. Sarhan, I. Smetanska, A. Mahmoud. J. Sci. Food Agric., 90, pp. 218-226 (2010).
9. T. Sun, C. Ho. Food Chem., 90, pp. 743-749 (2005).10. A. Alothman, R. Bhat, A.A. Karim, Food Chem., 115, pp. 785-
788 (2009).11. E. Revilla, J.M. Ryan, G. Martin-Ortega. J. Agric. Food Chem.,
46, pp. 4592-4597 (2009).12. S. Gomez-Alonso, E. Garcia-Romero, I. Hermosin-Gutierrez. J.
Food Comp. Analys., 20, pp. 618-626 (2007).13. F.A. Tomas-Barberan, J.C. Espin. J Sci. Food Agric., 81, pp.
853-876 (2001).14. A. Sass-Kiss, J. Kiss et al., Food Res. Int., 38, pp. 1023-1029
(2005).15. M. Jakobek, M. Šeruga et al., Deutsche Lebensmittel-
Rundschau, 103, pp. 369-378 (2007).16. S.S. Beevi, M.L. Narasu, B.B.Gowda. Plant Foods Hum. Nutr., 65,
pp. 8-17 (2010).17. M.P. Kähkönen, A.I. Hopia, M. Heinonen. J. Agric Food Chem.,
49, pp. 4076-4082 (2001).18. U.B. Jagtap, S.N. Panaskar, V.A. Bapat. Plant Foods Hum Nutr.,
pp. 99-104 (2010).19. M.I. Gil, D.M. Holcroft, A.A. Kader. J Agric Food Chem., 45, pp.
1662-1667 (1997).20. K. Skupien, J. Oszmionski. Eur Food Res Technol., 219, pp. 66-70
(2004).21. S. Häkkinen, M. Heinonen et al., Food Res Int., 32, pp. 345-353.
(1999).
made. Also, the present study revealed that the wild strawberries contained higher total phenolics and antioxidant activities compare to cv. “Roxana”.
ACKNOWLEDGMENTS
This work was supported by the Serbian Ministry of Education and Science Protection (grant number 174007).
REFERENCES AND NOTES
1. Y. Amakura, Y. Umino et al., J. Agric. Food Chem., 48, pp. 6292-6297 (2000).
2. M. Kajdžanoska, J. Petreska, M. Stefova. J. Agric. Food Chem., 59, pp. 5272-5278 (2011).
3. N.P. Seeram, R. Lee et al., Food Chem., 97, pp. 1-11 (2006).4. M. Kosar, E. Kafkas et al., J Agric Food Chem., 52, pp. 1586-1589
(2004).5. R.L. Prior, X. Wu, K. Schiach. J. Agric. Food Chem., 53, pp. 4290-
4302 (2005).6. J. Yang, K.J. Meyers et al., J. Agric Food Chem., 52, pp. 6787-6793
(2004).7. W. Brand-Williams, M.E. Cuvelier, C. Berset. Lebensm.-Wiss.
Technol., 28, pp. 25-30 (1995).
Top Related