
γλώσσες
Σελίδες
Νομικός

High pT dihadron vs. single hadron suppression
— what is different?
Thorsten Renk
in collaboration with J. Ruppert and Kari J. Eskola
Introduction
What information is in RAA at RHIC?Tomography using RAA
- opening the kinematic windowTomography beyond RAA
- γ-hadron correlations- RAA vs. reaction plane- dihadron correlationsConclusions
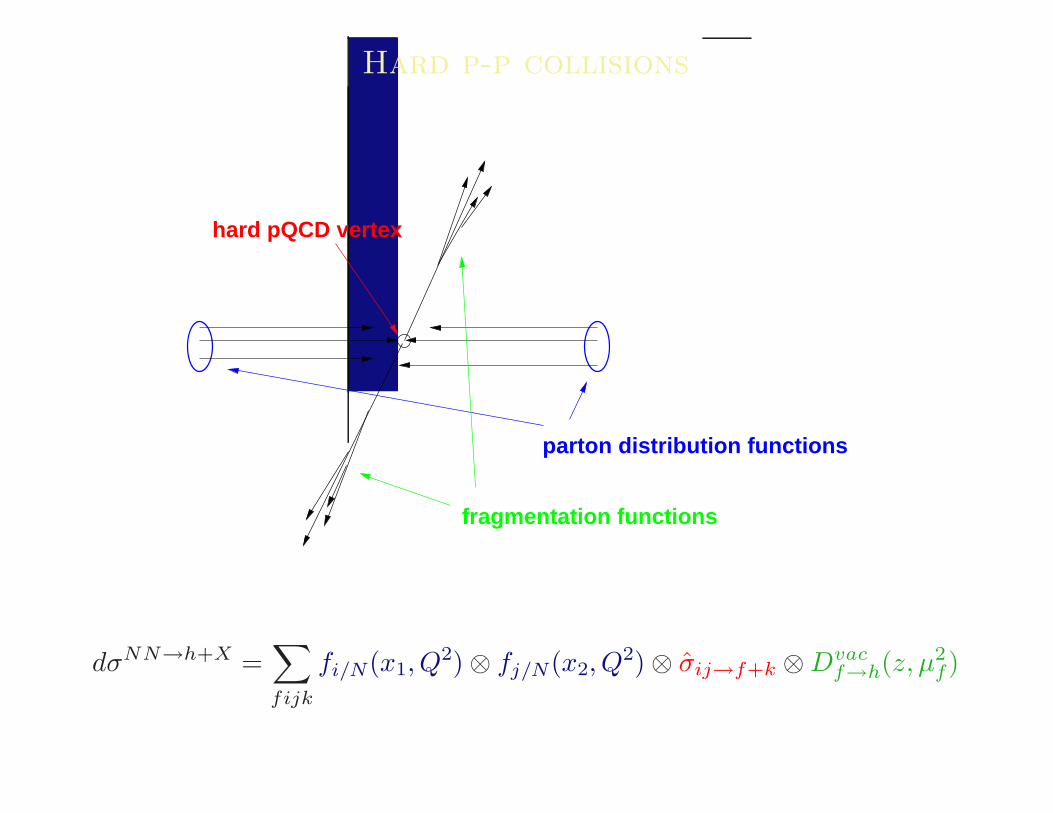
Hard p-p collisions
hard pQCD vertex
parton distribution functions
fragmentation functions
dσNN→h+X =∑
fijk
fi/N(x1, Q2) ⊗ fj/N(x2, Q
2) ⊗ σ̂ij→f+k ⊗ Dvacf→h(z, µ2
f)
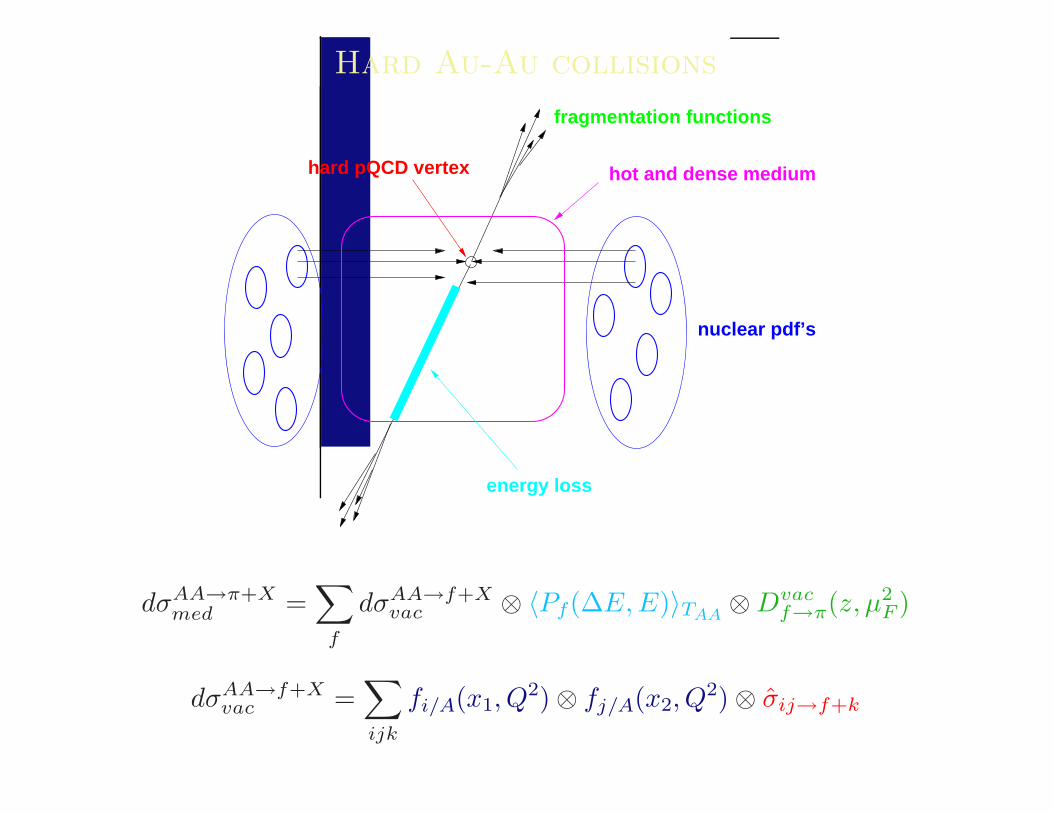
Hard Au-Au collisions
hard pQCD vertex hot and dense medium
nuclear pdf’s
fragmentation functions
energy loss
dσAA→π+Xmed =
∑
f
dσAA→f+Xvac ⊗ 〈Pf(∆E, E)〉TAA
⊗ Dvacf→π(z, µ2
F )
dσAA→f+Xvac =
∑
ijk
fi/A(x1, Q2) ⊗ fj/A(x2, Q
2) ⊗ σ̂ij→f+k
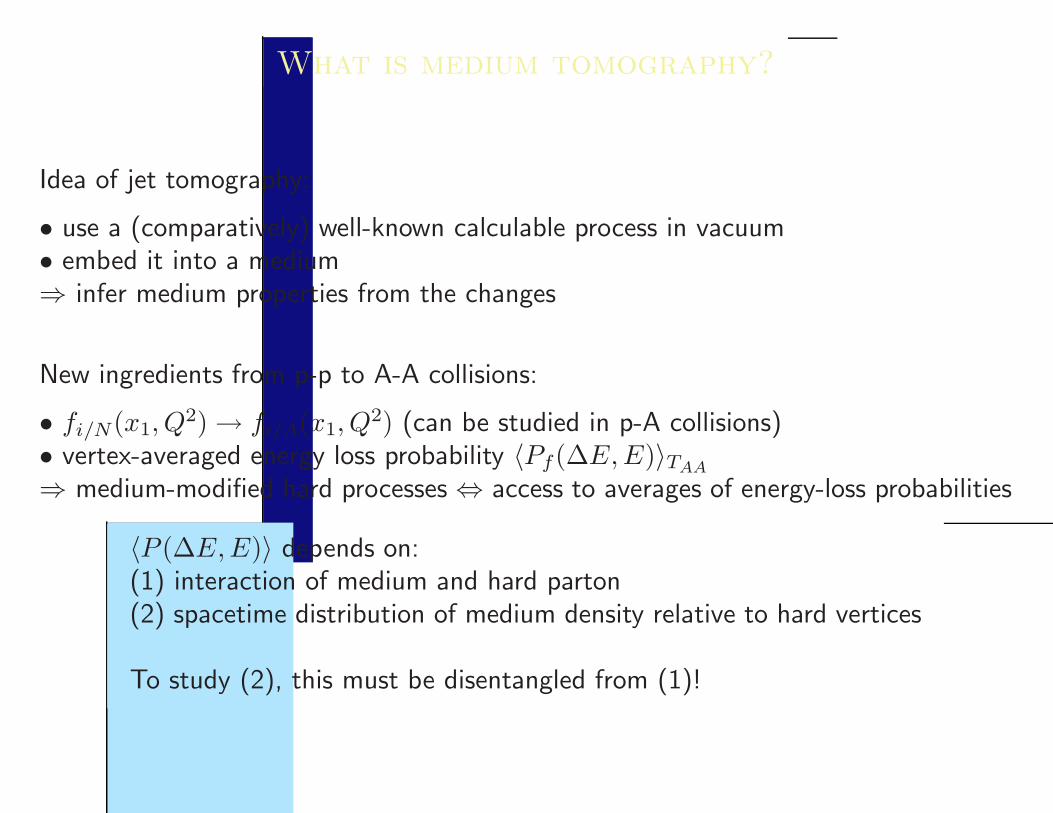
What is medium tomography?
Idea of jet tomography:
• use a (comparatively) well-known calculable process in vacuum• embed it into a medium⇒ infer medium properties from the changes
New ingredients from p-p to A-A collisions:
• fi/N(x1, Q2) → fi/A(x1, Q
2) (can be studied in p-A collisions)• vertex-averaged energy loss probability 〈Pf(∆E, E)〉TAA
⇒ medium-modified hard processes ⇔ access to averages of energy-loss probabilities
〈P (∆E,E)〉 depends on:(1) interaction of medium and hard parton(2) spacetime distribution of medium density relative to hard vertices
To study (2), this must be disentangled from (1)!
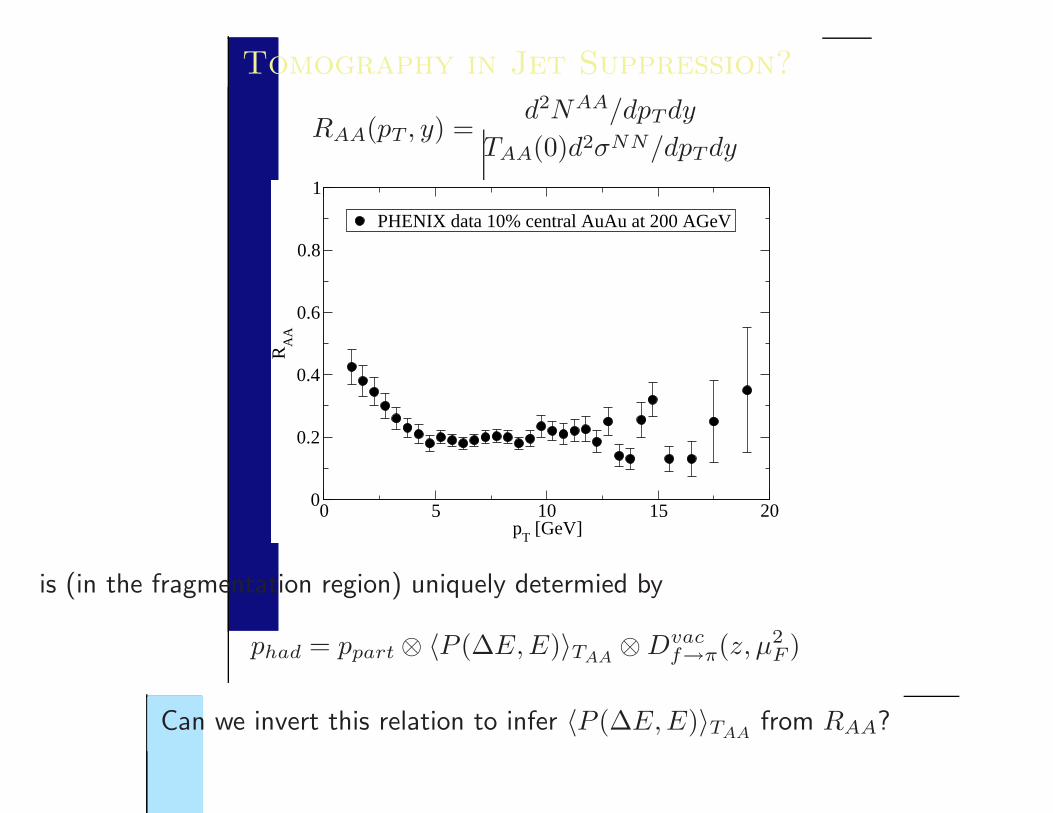
Tomography in Jet Suppression?
RAA(pT , y) =d2NAA/dpTdy
TAA(0)d2σNN/dpTdy
0 5 10 15 20p
T [GeV]
0
0.2
0.4
0.6
0.8
1
RA
A
PHENIX data 10% central AuAu at 200 AGeV
is (in the fragmentation region) uniquely determied by
phad = ppart ⊗ 〈P (∆E,E)〉TAA⊗ Dvac
f→π(z, µ2F )
Can we invert this relation to infer 〈P (∆E,E)〉TAAfrom RAA?
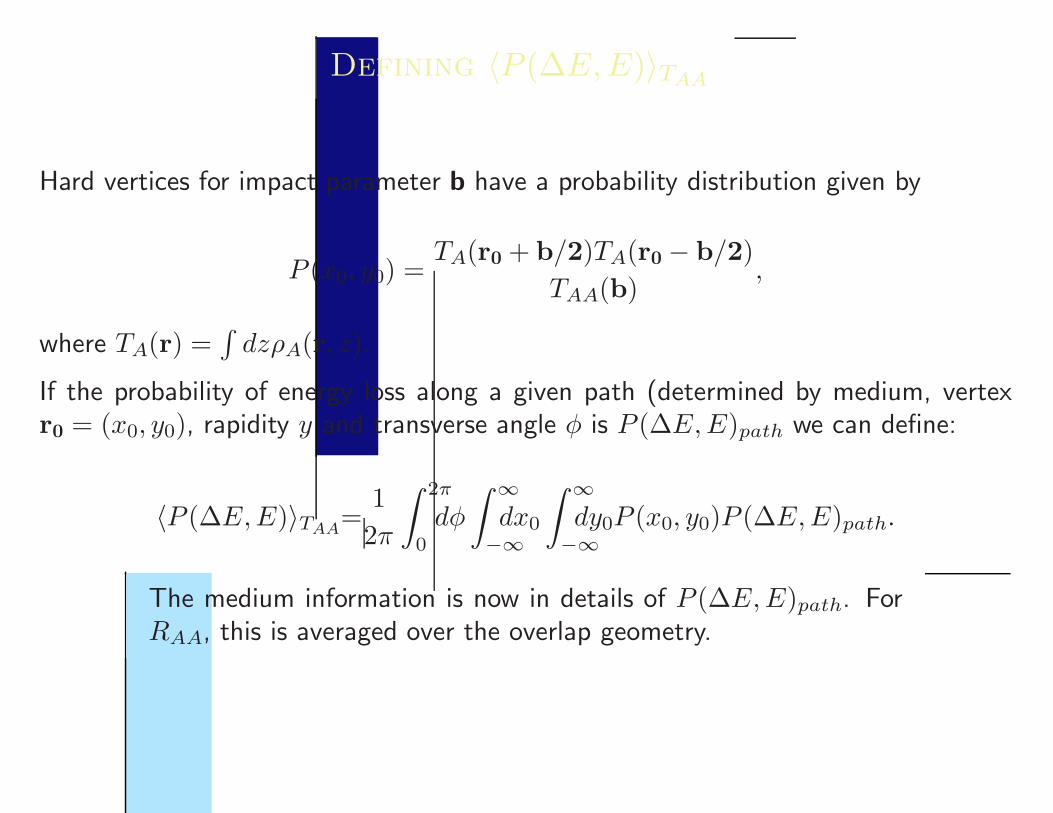
Defining 〈P (∆E,E)〉TAA
Hard vertices for impact parameter b have a probability distribution given by
P (x0, y0) =TA(r0 + b/2)TA(r0 − b/2)
TAA(b),
where TA(r) =∫
dzρA(r, z).
If the probability of energy loss along a given path (determined by medium, vertexr0 = (x0, y0), rapidity y and transverse angle φ is P (∆E, E)path we can define:
〈P (∆E,E)〉TAA=
1
2π
∫ 2π
0
dφ
∫
∞
−∞
dx0
∫
∞
−∞
dy0P (x0, y0)P (∆E,E)path.
The medium information is now in details of P (∆E, E)path. ForRAA, this is averaged over the overlap geometry.
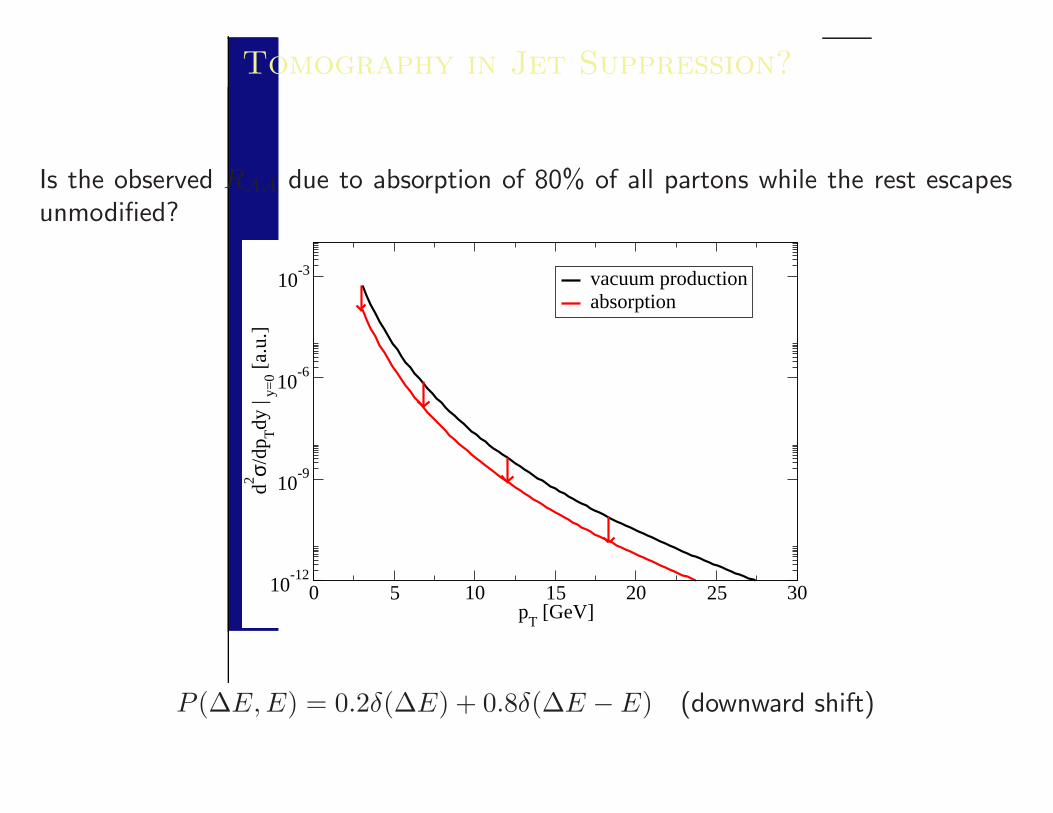
Tomography in Jet Suppression?
Is the observed RAA due to absorption of 80% of all partons while the rest escapesunmodified?
0 5 10 15 20 25 30p
T [GeV]
10-12
10-9
10-6
10-3
d2 σ/dp
Tdy
| y=
0 [a.
u.]
vacuum productionabsorption
P (∆E, E) = 0.2δ(∆E) + 0.8δ(∆E − E) (downward shift)
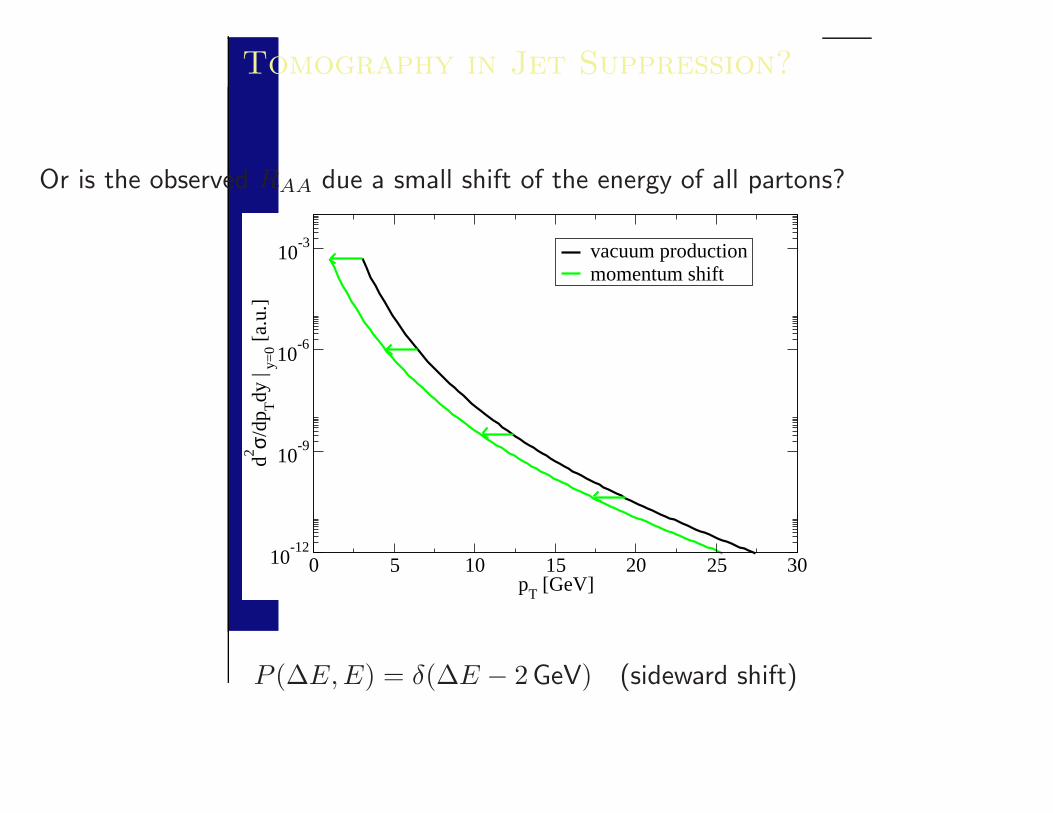
Tomography in Jet Suppression?
Or is the observed RAA due a small shift of the energy of all partons?
0 5 10 15 20 25 30p
T [GeV]
10-12
10-9
10-6
10-3
d2 σ/dp
Tdy
| y=
0 [a.
u.]
vacuum productionmomentum shift
P (∆E,E) = δ(∆E − 2GeV) (sideward shift)
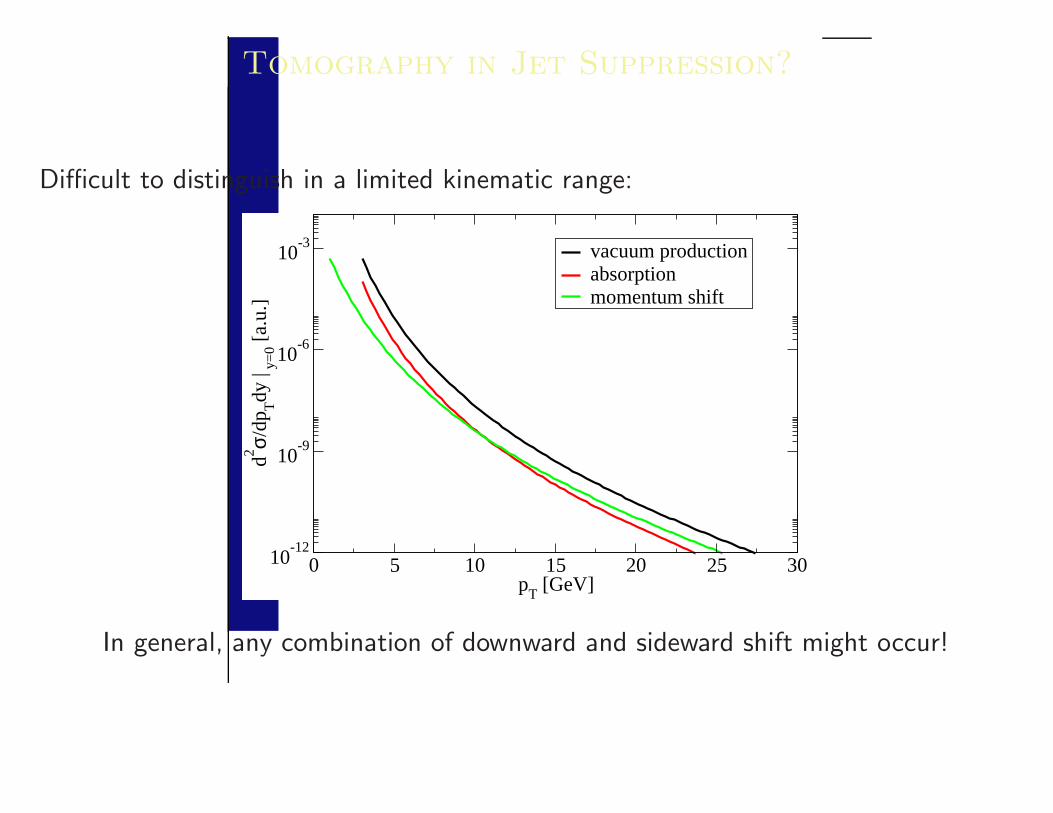
Tomography in Jet Suppression?
Difficult to distinguish in a limited kinematic range:
0 5 10 15 20 25 30p
T [GeV]
10-12
10-9
10-6
10-3
d2 σ/dp
Tdy
| y=
0 [a.
u.]
vacuum productionabsorptionmomentum shift
In general, any combination of downward and sideward shift might occur!
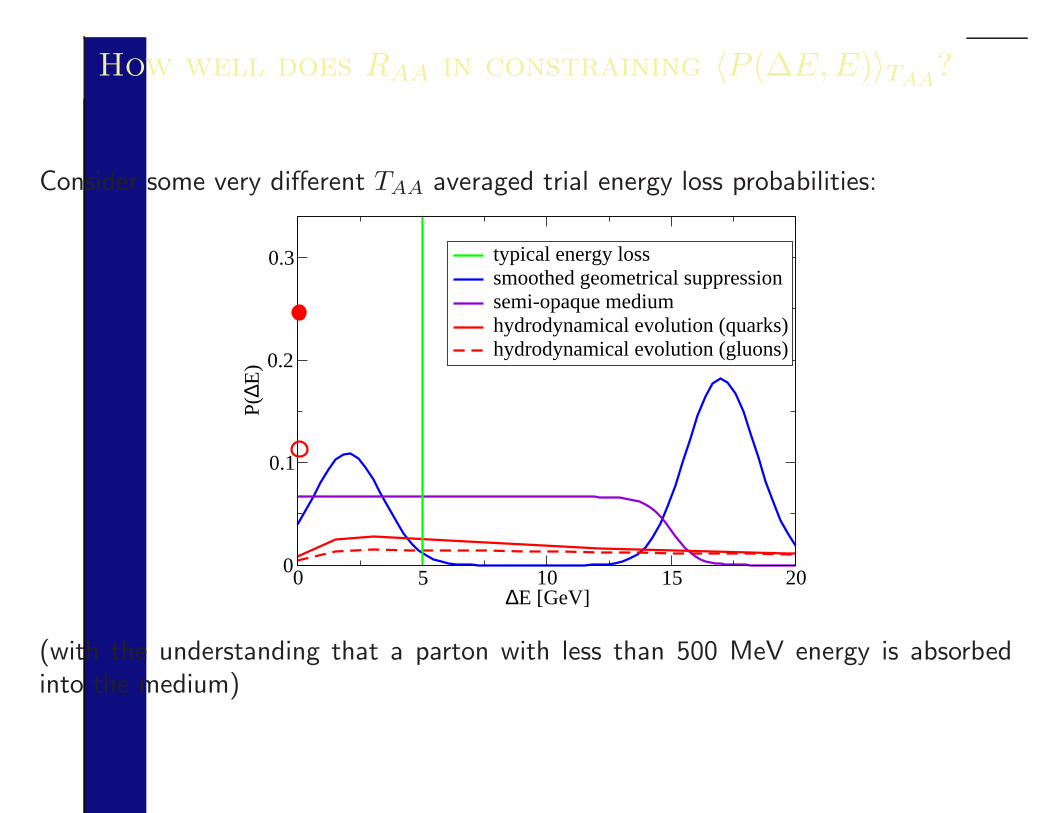
How well does RAA in constraining 〈P (∆E,E)〉TAA?
Consider some very different TAA averaged trial energy loss probabilities:
0 5 10 15 20∆E [GeV]
0
0.1
0.2
0.3P(
∆E)
typical energy losssmoothed geometrical suppressionsemi-opaque mediumhydrodynamical evolution (quarks)hydrodynamical evolution (gluons)
(with the understanding that a parton with less than 500 MeV energy is absorbedinto the medium)

How well does RAA in constraining 〈P (∆E,E)〉TAA?
RAA does not strongly constrain the energy loss probability distribution:
0 5 10 15 20p
T [GeV/c]
0
0.25
0.5
0.75
1
RA
APHENIX datatypical fractional energy losstypical energy losssmoothed geometrical suppressionsemi-opaque mediumhydrodynamicsgeometrical suppression
usually 1-parameter tuning brings a trial 〈P (∆E,E)〉TAAdistribution to the data:
Quenching has to be substantial, but we don’t really measure even 〈P (∆E, E)〉TAA!
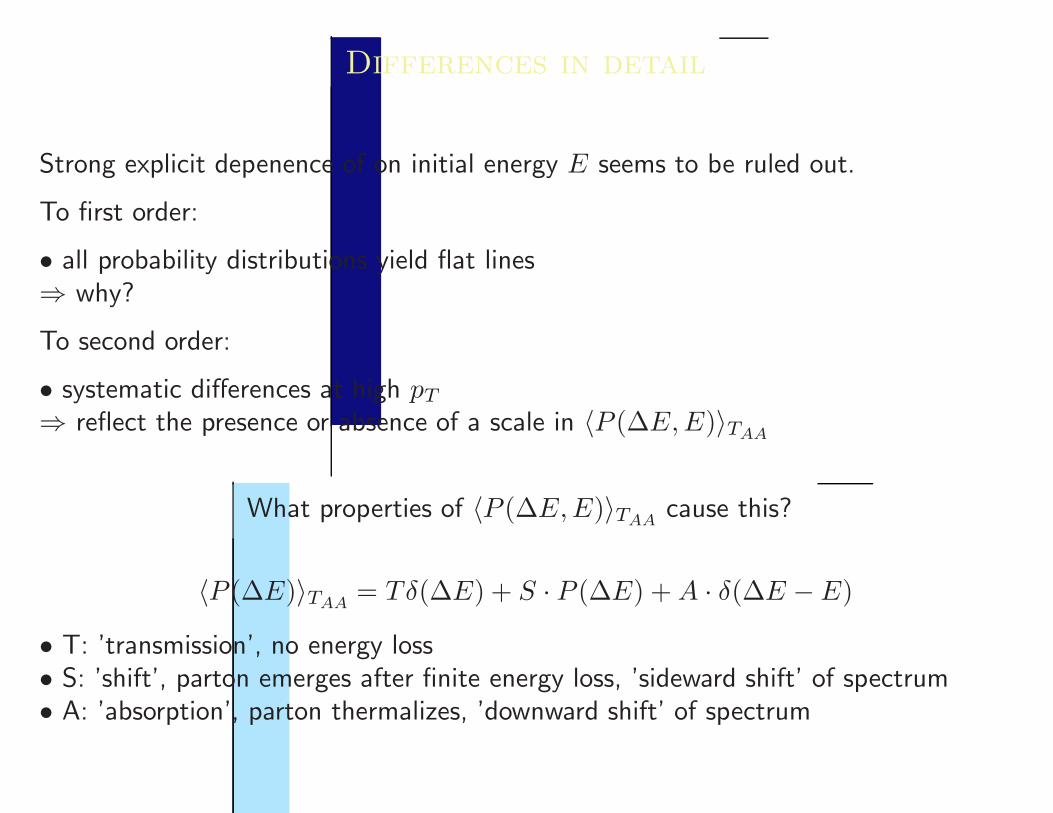
Differences in detail
Strong explicit depenence of on initial energy E seems to be ruled out.
To first order:
• all probability distributions yield flat lines⇒ why?
To second order:
• systematic differences at high pT
⇒ reflect the presence or absence of a scale in 〈P (∆E, E)〉TAA
What properties of 〈P (∆E,E)〉TAAcause this?
〈P (∆E)〉TAA= Tδ(∆E) + S · P (∆E) + A · δ(∆E − E)
• T: ’transmission’, no energy loss• S: ’shift’, parton emerges after finite energy loss, ’sideward shift’ of spectrum• A: ’absorption’, parton thermalizes, ’downward shift’ of spectrum
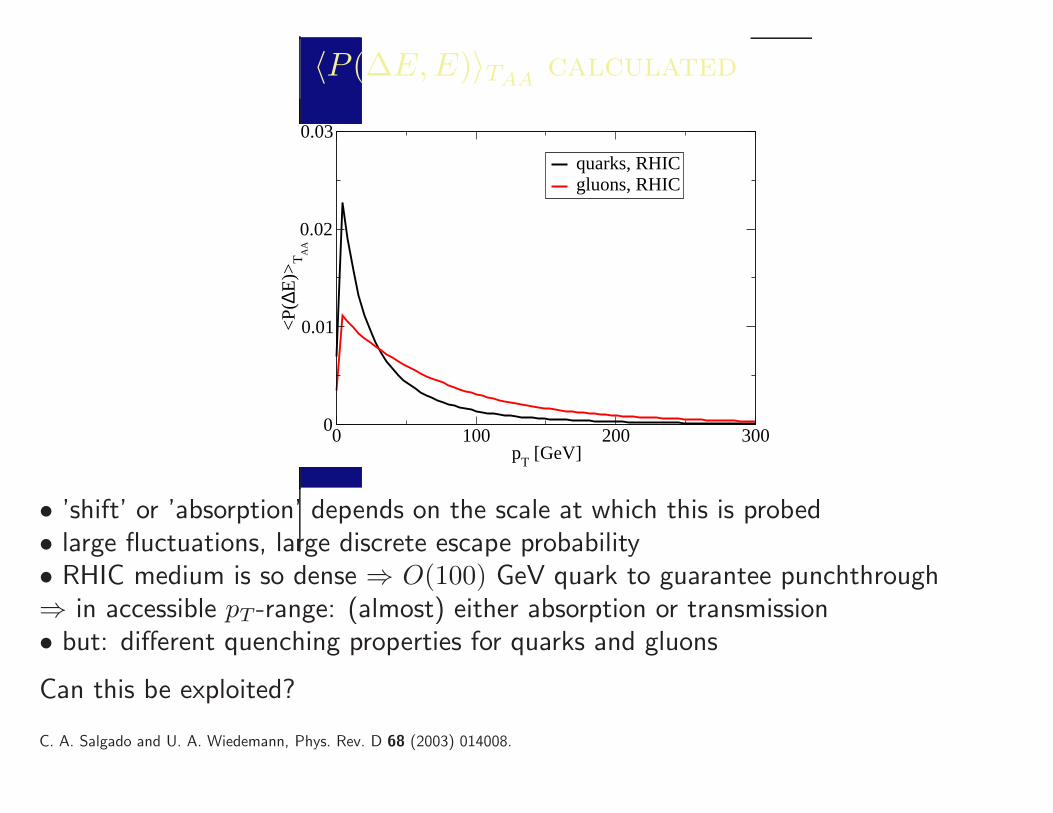
〈P (∆E,E)〉TAAcalculated
0 100 200 300p
T [GeV]
0
0.01
0.02
0.03
<P(
∆E)>
TA
A
quarks, RHICgluons, RHIC
• ’shift’ or ’absorption’ depends on the scale at which this is probed• large fluctuations, large discrete escape probability• RHIC medium is so dense ⇒ O(100) GeV quark to guarantee punchthrough⇒ in accessible pT -range: (almost) either absorption or transmission• but: different quenching properties for quarks and gluons
Can this be exploited?
C. A. Salgado and U. A. Wiedemann, Phys. Rev. D 68 (2003) 014008.
Experimental evidence
Generically, gluons have stronger interaction with the medium (different color factor)
Idea: find probes which are dominated by
• quark fragmentation (D- and B-meson production, not topic of this talk)• both quark and gluon fragmentation (pions)• gluon fragmentation (protons, according to AKK fragmentation function)
If the medium is very dilute. . .. . . energy loss happens throughout the medium inducing shift
⇒ the probes should show different suppression
If the medium is very dense. . .. . . a completely absorbing core is surrounded by a transmitting halo, suface bis⇒ the probes should show the same suppression
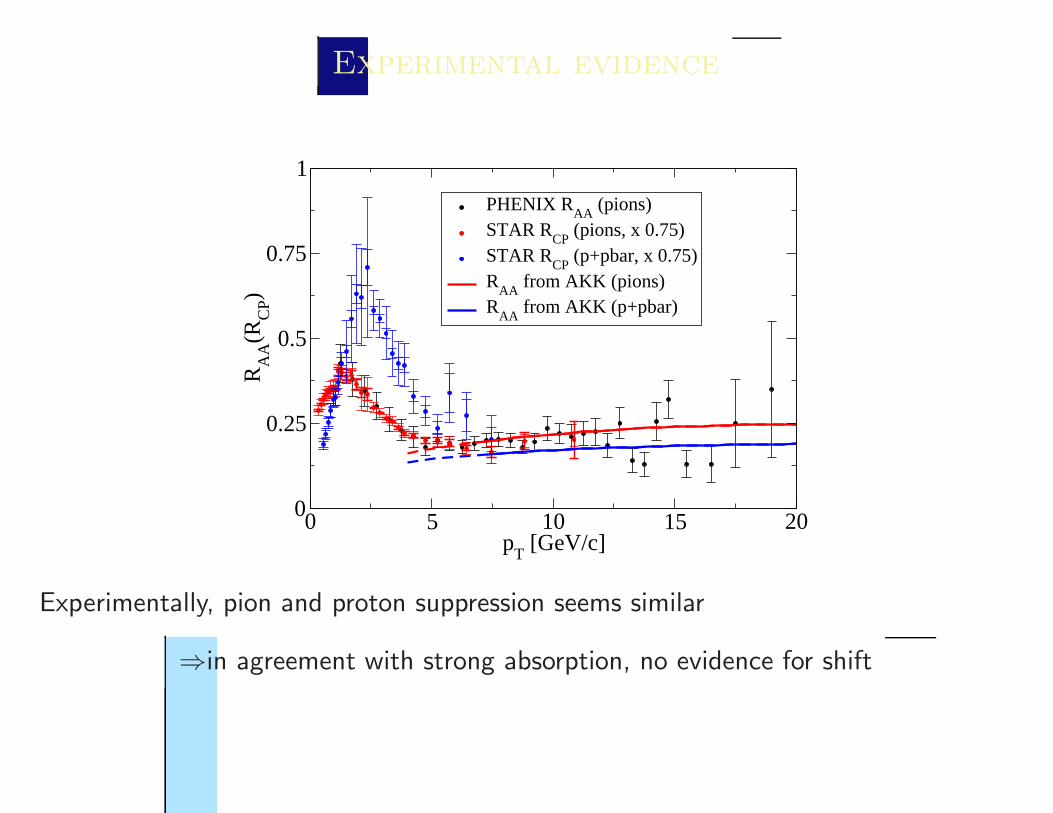
Experimental evidence
0 5 10 15 20p
T [GeV/c]
0
0.25
0.5
0.75
1
RA
A(R
CP)
PHENIX RAA
(pions)STAR R
CP (pions, x 0.75)
STAR RCP
(p+pbar, x 0.75)R
AA from AKK (pions)
RAA
from AKK (p+pbar)
Experimentally, pion and proton suppression seems similar
⇒in agreement with strong absorption, no evidence for shift
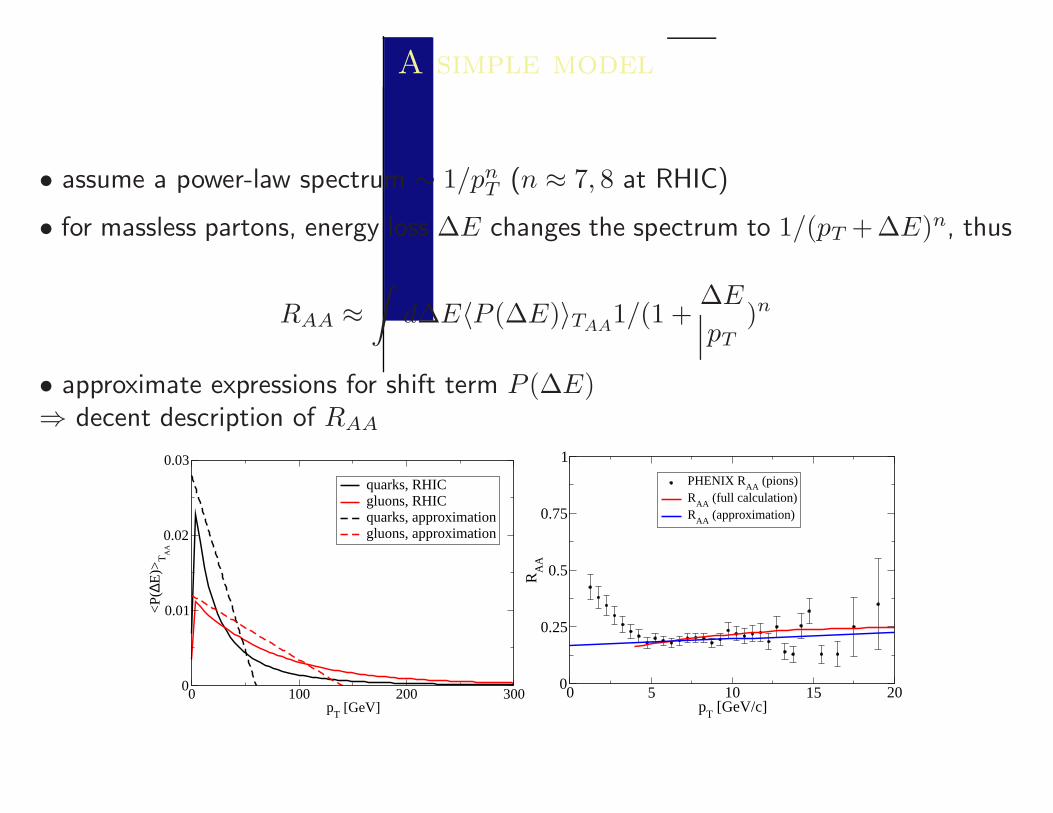
A simple model
• assume a power-law spectrum ∼ 1/pnT (n ≈ 7, 8 at RHIC)
• for massless partons, energy loss ∆E changes the spectrum to 1/(pT +∆E)n, thus
RAA ≈∫
d∆E〈P (∆E)〉TAA1/(1 +
∆E
pT)n
• approximate expressions for shift term P (∆E)⇒ decent description of RAA
0 100 200 300p
T [GeV]
0
0.01
0.02
0.03
<P(
∆E)>
TA
A
quarks, RHICgluons, RHICquarks, approximationgluons, approximation
0 5 10 15 20p
T [GeV/c]
0
0.25
0.5
0.75
1
RA
A
PHENIX RAA
(pions)R
AA (full calculation)
RAA
(approximation)

A simple model
• suppression by ∆E ⇔ penalty factor S(∆E) = 1/(1 + ∆EpT
)n
• at a scale pT , we observe 〈P (∆E)〉TAAthrough this filter
5
0.016
0.008
00
0.004
DE
2010 15
0.012
∆
10 GeV
∆ ∆
P( E)
P( E) * S( E)
20
0.016
0.008
1500
DE
0.012
5 10
0.004
∆
20 GeV
∆ ∆
P( E)
P( E) * S( E)
⇒ shift becomes unobservable long before ∆E ≈ E⇒ at RHIC, pT can never be enough to observe more than the onset of 〈P (∆E)〉TAA
⇒ on the other hand, parametrically a rise of RAA with pT is unavoidable
⇒ This seems to be the fundamental reason for the observed flatness of RAA
What can LHC do?
When going to higher energies
• the medium density grows like ∼ log(√
s) (PHOBOS) or ∼√
(s)0.574 (EKRT)• the kinematically accessible region grows like ∼ √
s/2
⇒ the kinematical window will always win out
⇒ quite generic expectation for a rise of RAA in the pT range of LHC
since the reason for the rise is the shift term becoming more and more visible
Magnitude and shape of the rise will reflect the shape of theunderlying energy loss probability distribution - needs high statisticsand large pT range
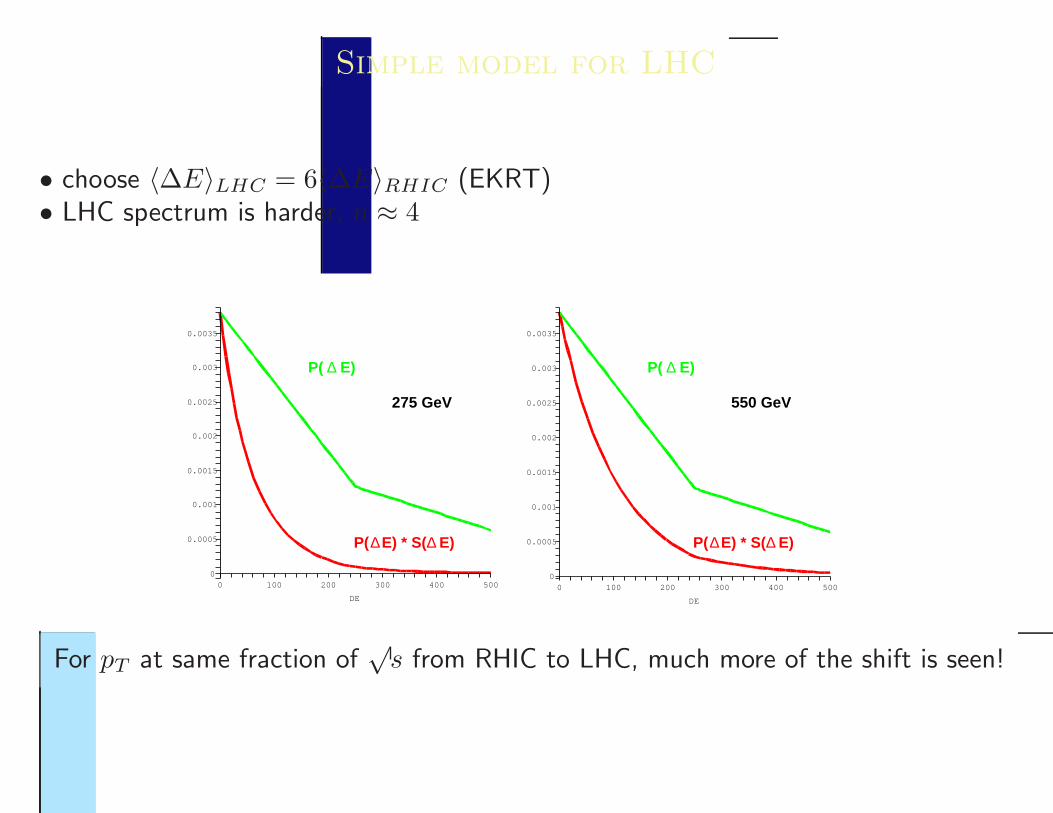
Simple model for LHC
• choose 〈∆E〉LHC = 6〈∆E〉RHIC (EKRT)• LHC spectrum is harder, n ≈ 4
0.0035
0.0025
0.0005
0.003
0.002
0.001
0.0015
0
DE
500400300100 2000
P( E)∆
P( E) * S( E)∆ ∆
275 GeV
0.0035
0.0025
0.0005
0.003
0 100
0.002
0.001
0.0015
0
DE
500300 400200
P( E)∆
P( E) * S( E)∆ ∆
550 GeV
For pT at same fraction of√
s from RHIC to LHC, much more of the shift is seen!
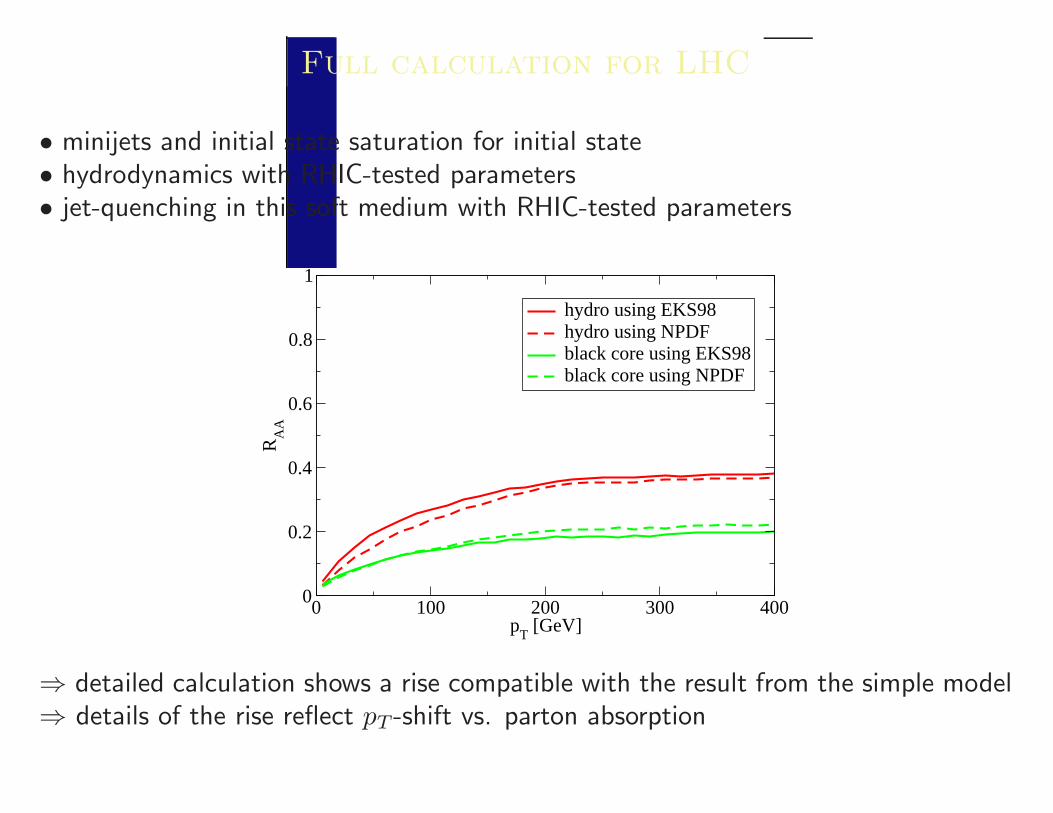
Full calculation for LHC
• minijets and initial state saturation for initial state• hydrodynamics with RHIC-tested parameters• jet-quenching in this soft medium with RHIC-tested parameters
0 100 200 300 400p
T [GeV]
0
0.2
0.4
0.6
0.8
1R
AA
hydro using EKS98hydro using NPDFblack core using EKS98black core using NPDF
⇒ detailed calculation shows a rise compatible with the result from the simple model⇒ details of the rise reflect pT -shift vs. parton absorption
Single hadron observables
+ value of RAA indicates strong quenching
+ flat RAA and proton RAA point to dominance of absorption
- small sensitivity to shift, hence little tomographical information
- difficult to disentangle medium geometry and energy loss
+ expected to improve at LHC
Improvements are possible: RAA vs. reaction plane and RAA fordifferent system size provide systematic variations of pathlength
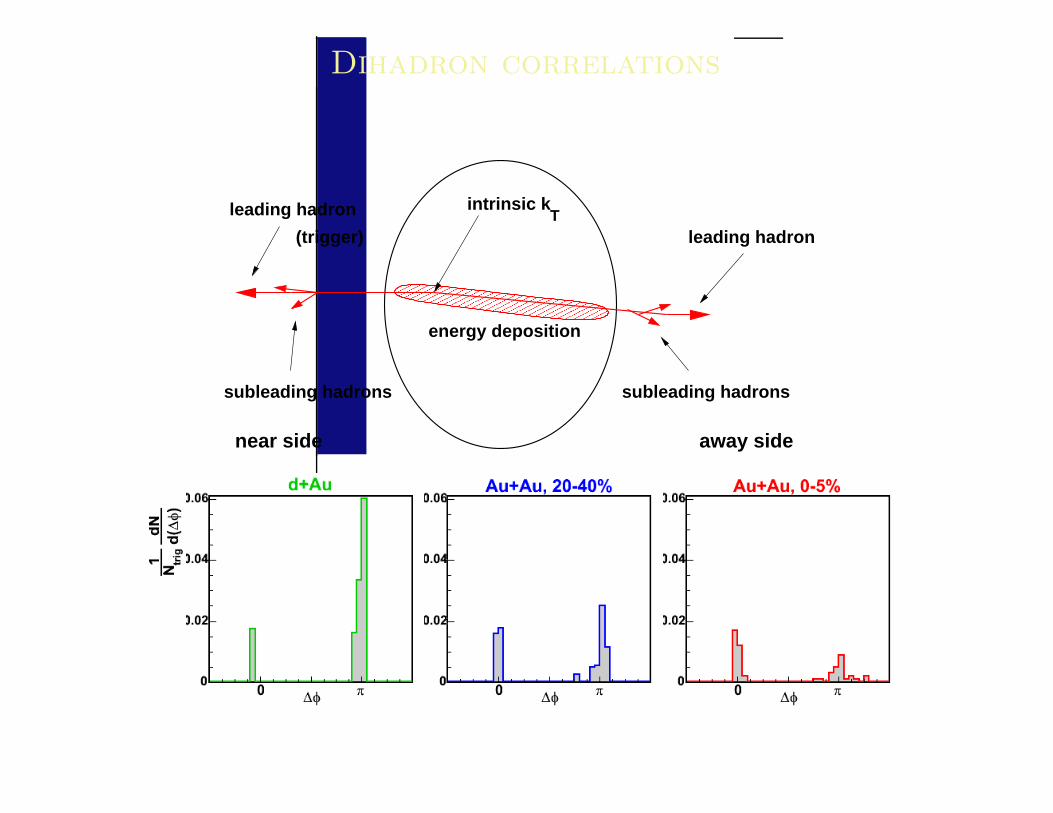
Dihadron correlations
��������������������������������������������������������
������������������������������������������������������������
������������������������������������
����������������������������������������
����������������������������
����������������������������
���������������������
���������������������
��������������
��������������
���������������
���������������
leading hadron
leading hadron
subleading hadrons
near side away side
energy deposition
intrinsic k
(trigger)
subleading hadrons
T
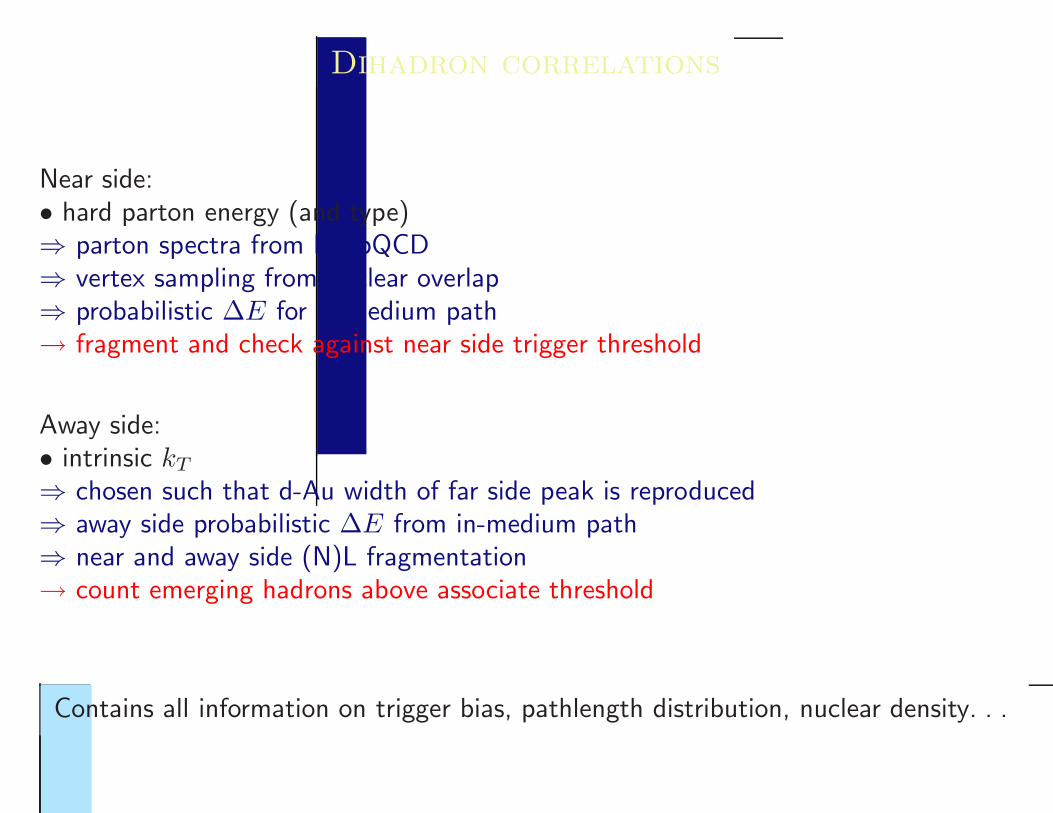
Dihadron correlations
Near side:• hard parton energy (and type)⇒ parton spectra from LO pQCD⇒ vertex sampling from nuclear overlap⇒ probabilistic ∆E for in-medium path→ fragment and check against near side trigger threshold
Away side:• intrinsic kT
⇒ chosen such that d-Au width of far side peak is reproduced⇒ away side probabilistic ∆E from in-medium path⇒ near and away side (N)L fragmentation→ count emerging hadrons above associate threshold
Contains all information on trigger bias, pathlength distribution, nuclear density. . .
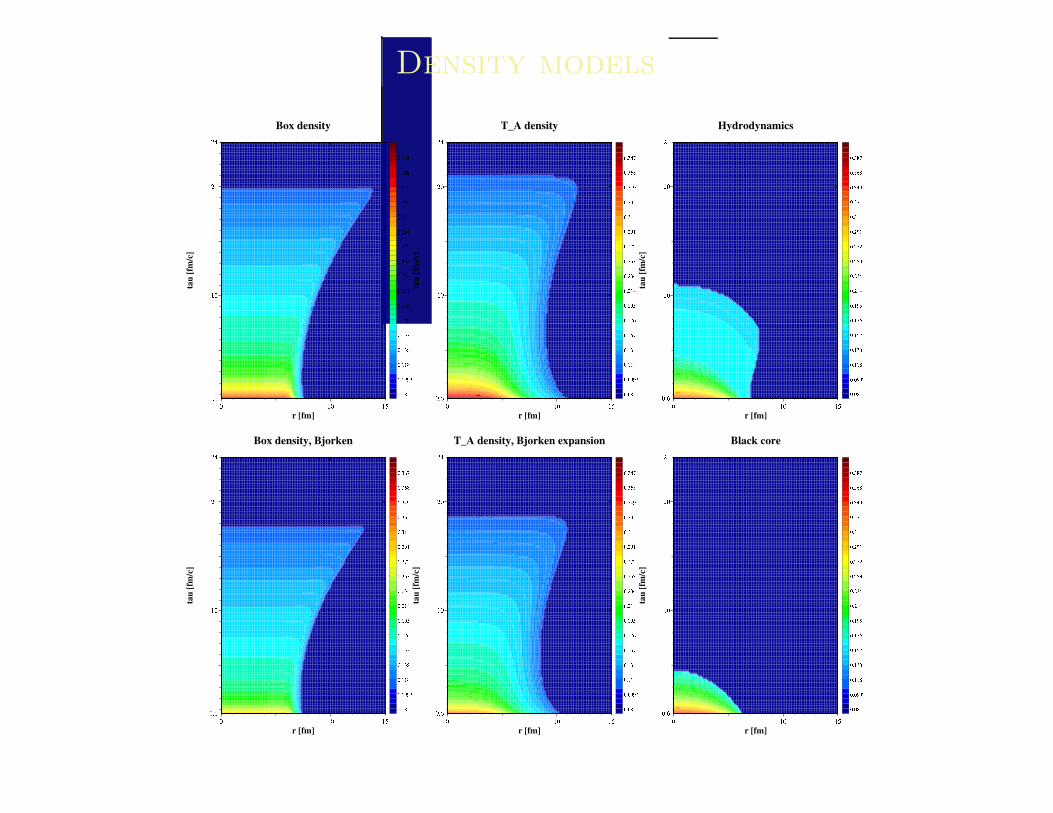
Density models
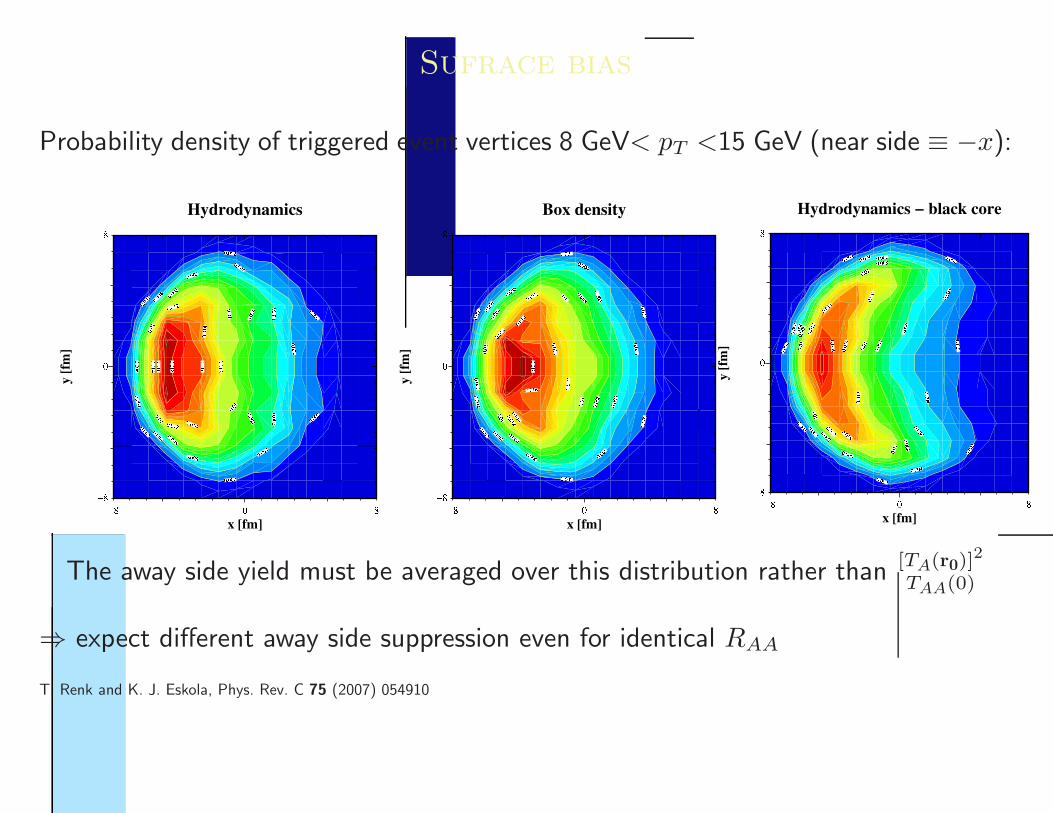
Sufrace bias
Probability density of triggered event vertices 8 GeV< pT <15 GeV (near side ≡ −x):
The away side yield must be averaged over this distribution rather than [TA(r0)]2
TAA(0)
⇒ expect different away side suppression even for identical RAA
T. Renk and K. J. Eskola, Phys. Rev. C 75 (2007) 054910
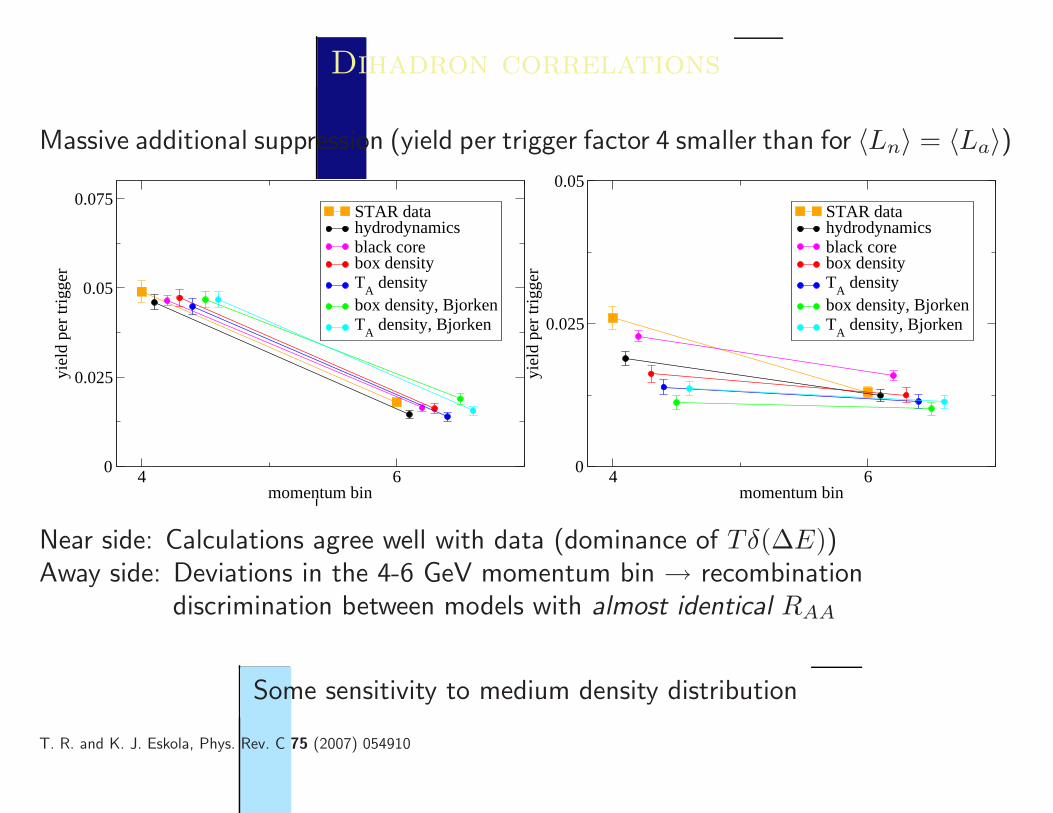
Dihadron correlations
Massive additional suppression (yield per trigger factor 4 smaller than for 〈Ln〉 = 〈La〉)
4 6momentum bin
0
0.025
0.05
0.075
yiel
d pe
r tr
igge
r
STAR datahydrodynamicsblack corebox densityT
A density
box density, BjorkenT
A density, Bjorken
4 6momentum bin
0
0.025
0.05
yiel
d pe
r tr
igge
r
STAR datahydrodynamicsblack corebox densityT
A density
box density, BjorkenT
A density, Bjorken
Near side: Calculations agree well with data (dominance of Tδ(∆E))Away side: Deviations in the 4-6 GeV momentum bin → recombination
discrimination between models with almost identical RAA
Some sensitivity to medium density distribution
T. R. and K. J. Eskola, Phys. Rev. C 75 (2007) 054910
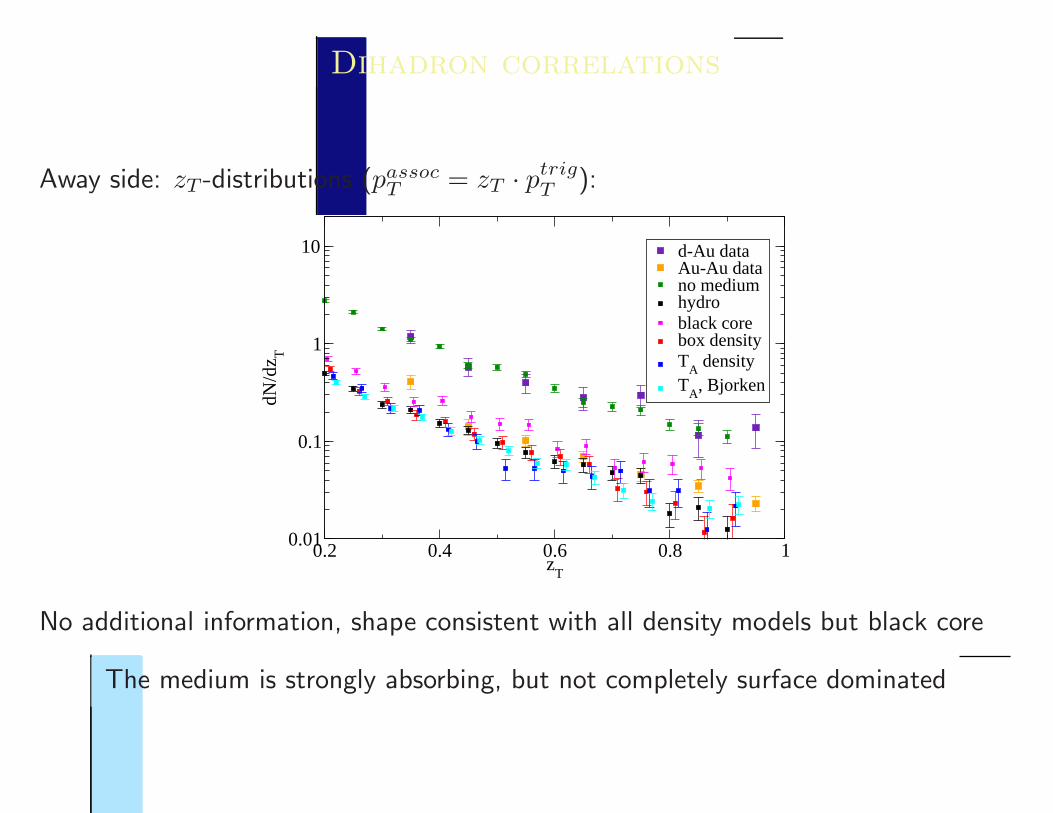
Dihadron correlations
Away side: zT -distributions (passocT = zT · ptrig
T ):
0.2 0.4 0.6 0.8 1z
T
0.01
0.1
1
10dN
/dz T
d-Au dataAu-Au datano mediumhydroblack corebox densityT
A density
TA
, Bjorken
No additional information, shape consistent with all density models but black core
The medium is strongly absorbing, but not completely surface dominated
Dihadron correlations
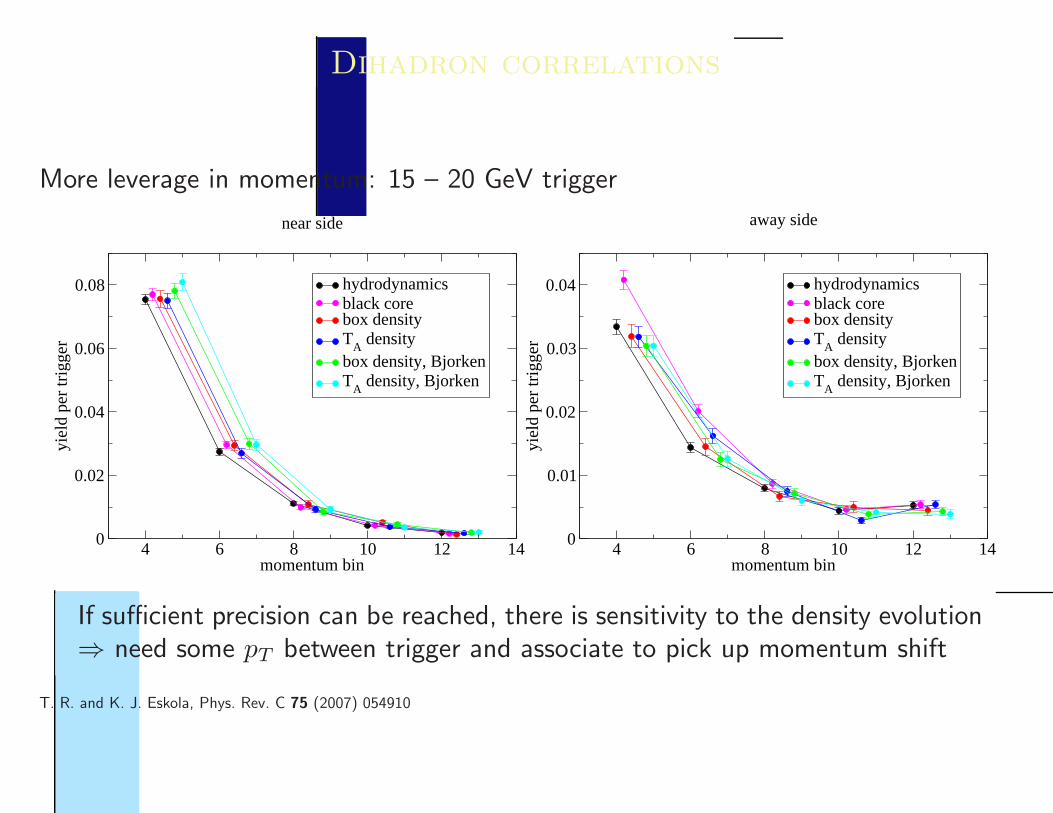
More leverage in momentum: 15 – 20 GeV trigger
4 6 8 10 12 14momentum bin
0
0.02
0.04
0.06
0.08
yiel
d pe
r tr
igge
r
hydrodynamicsblack corebox densityT
A density
box density, BjorkenT
A density, Bjorken
near side
4 6 8 10 12 14momentum bin
0
0.01
0.02
0.03
0.04
yiel
d pe
r tr
igge
r
hydrodynamicsblack corebox densityT
A density
box density, BjorkenT
A density, Bjorken
away side
If sufficient precision can be reached, there is sensitivity to the density evolution⇒ need some pT between trigger and associate to pick up momentum shift
T. R. and K. J. Eskola, Phys. Rev. C 75 (2007) 054910
Origin of dihadrons
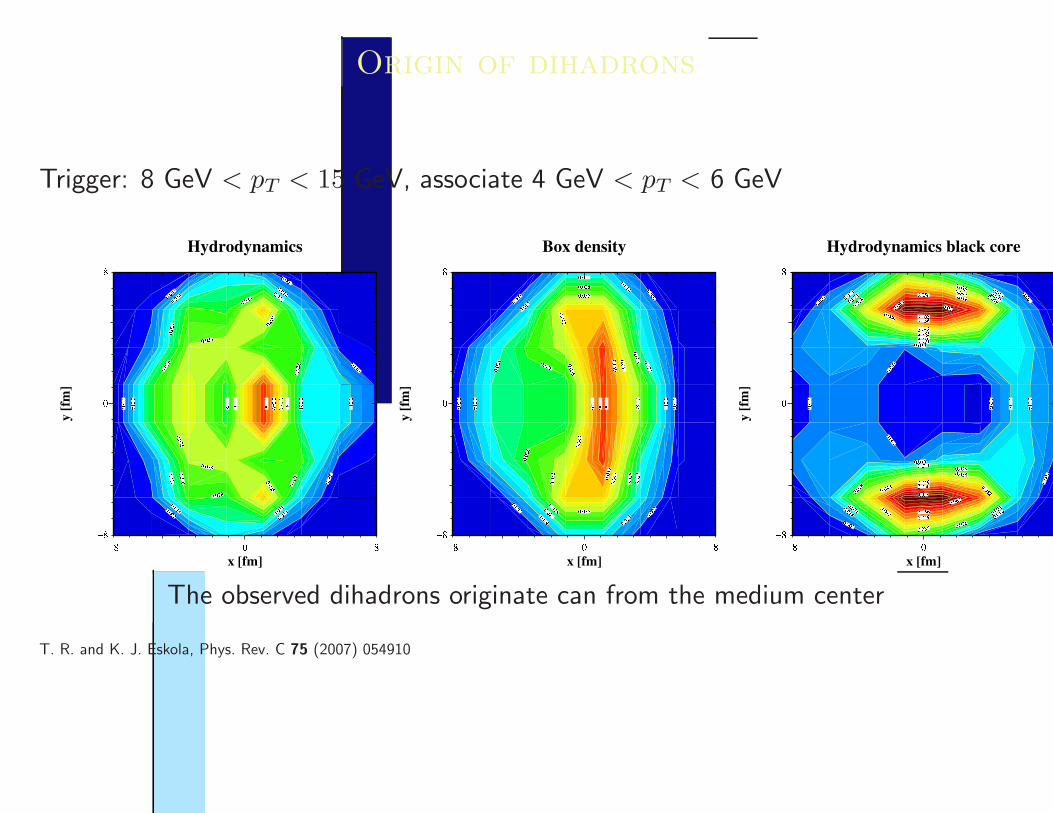
Trigger: 8 GeV < pT < 15 GeV, associate 4 GeV < pT < 6 GeV
The observed dihadrons originate can from the medium center
T. R. and K. J. Eskola, Phys. Rev. C 75 (2007) 054910
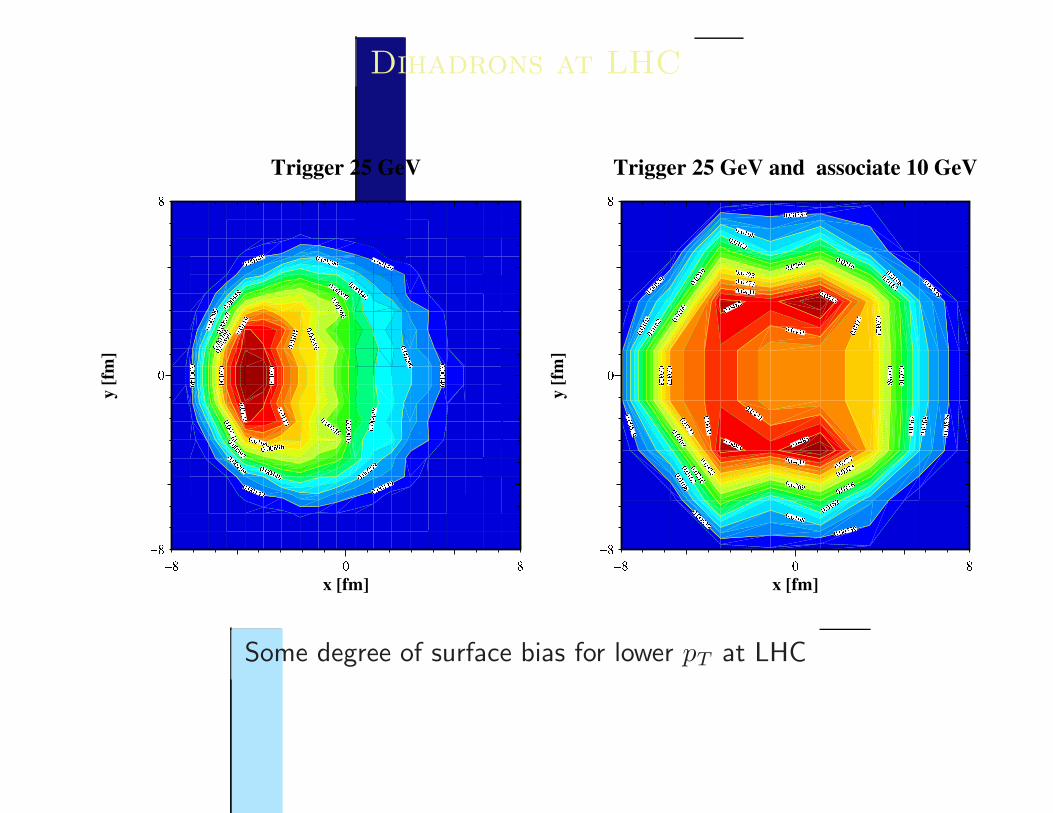
Dihadrons at LHC
Some degree of surface bias for lower pT at LHC
Hard di-hadron correlations
+ tomographical information beyond RAA
+ probes medium center
+ very suited to large momentum lever-arm at LHC
- test of a density model, not measurement of a density
- needs high precision
If sufficient precision can be reached and the parton-mediuminteraction can be established, information about the mediumdensity can be inferred from this observable.
Summary
• Jet quenching is established⇒ now we’re capable of addressing quantitative questions
• RAA is of limited value for medium tomography
• but we have other measurements to overcome this problem:
∗ γ-hadron correlations: TAA averaged energy loss probability∗ dihadron correlations: density distribution at medium center∗ RAA vs. reaction plane: early hydro evolution at edge
• we need:
∗ good medium models∗ refined jet-medium interaction models∗ high precision data
Lots of exciting results still to come!
Top Related