


![UK Domain Average Windstorm Risk S] risk non-SJ risk Wind ...sws98slg/Downloads/RMetS-NCAS-2016-StingJet... · UK Domain Average Windstorm Risk S] risk non-SJ risk Wind speed threshold](https://static.fdocument.org/doc/165x107/5bfce26209d3f264188c4657/uk-domain-average-windstorm-risk-s-risk-non-sj-risk-wind-sws98slgdownloadsrmets-ncas-2016-stingjet.jpg)
γλώσσες
Σελίδες
Νομικός

CBOE Risk Management Conference March 2013
Volatility Trading
Sheldon Natenberg Chicago Trading Co.
440 South LaSalle St. Chicago, IL 60605 (312) 863-8004
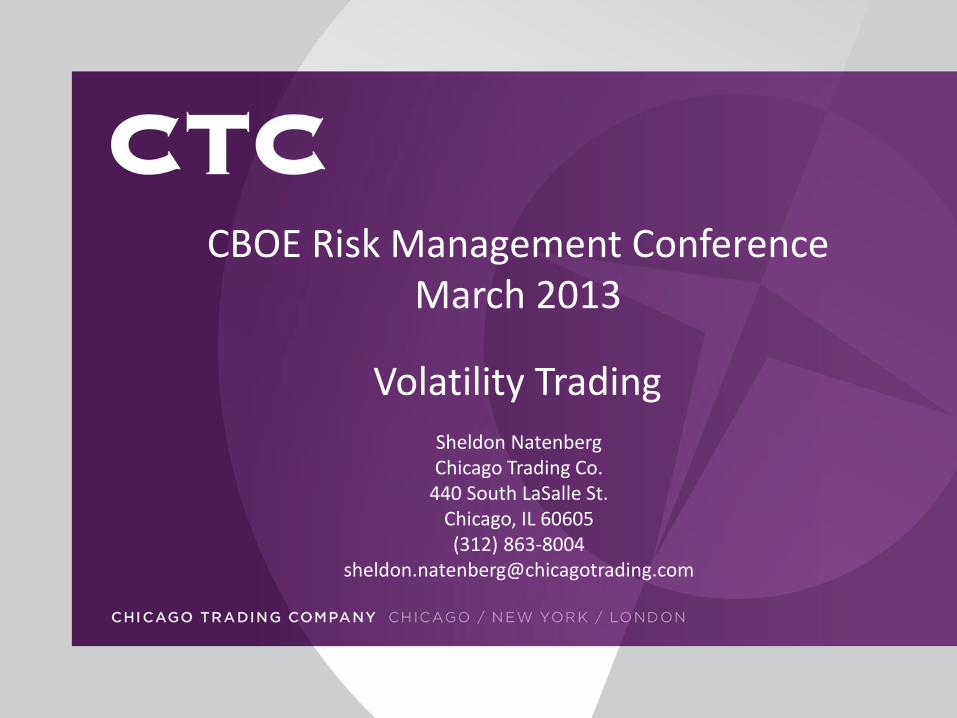
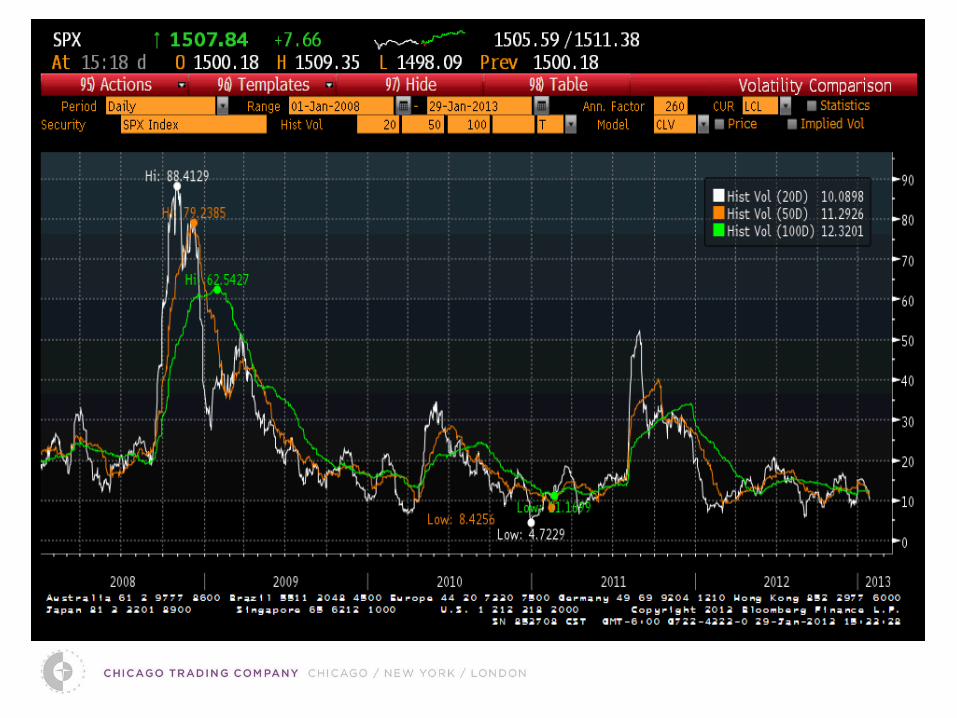
Volatility − the degree to which the price of a contract tends to fluctuate over time
Annualized standard deviation
of percent (logarithmic) price changes.
σ
The price changes are assumed to be normally distributed and
continuously compounded.
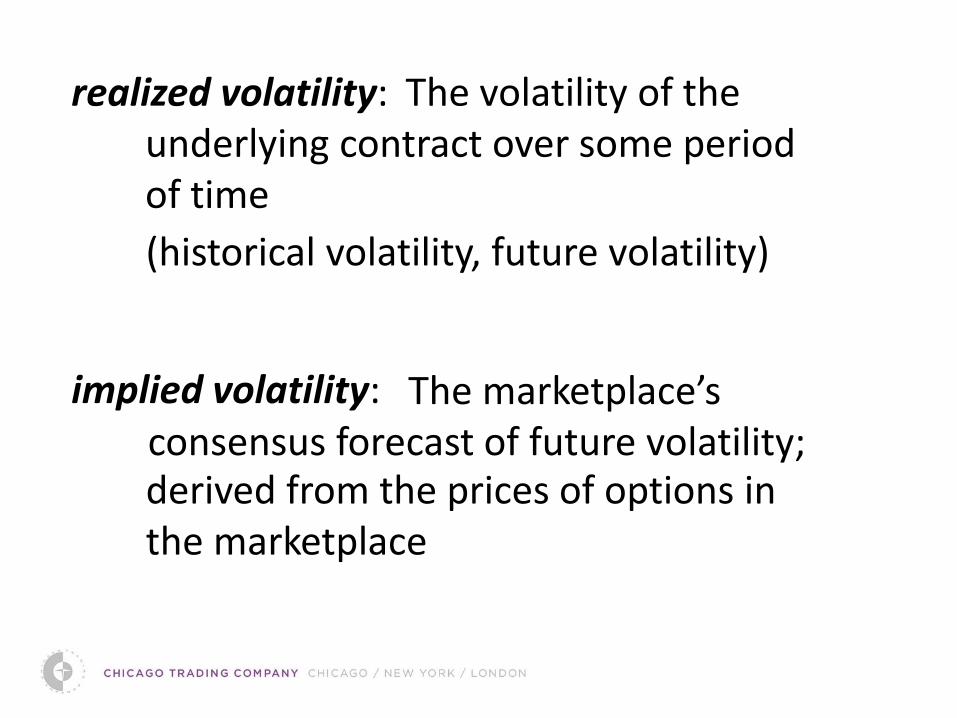
The volatility of the underlying contract over some period of time
realized volatility:
derived from the prices of options in the marketplace
implied volatility: The marketplace’s consensus forecast of future volatility;
(historical volatility, future volatility)
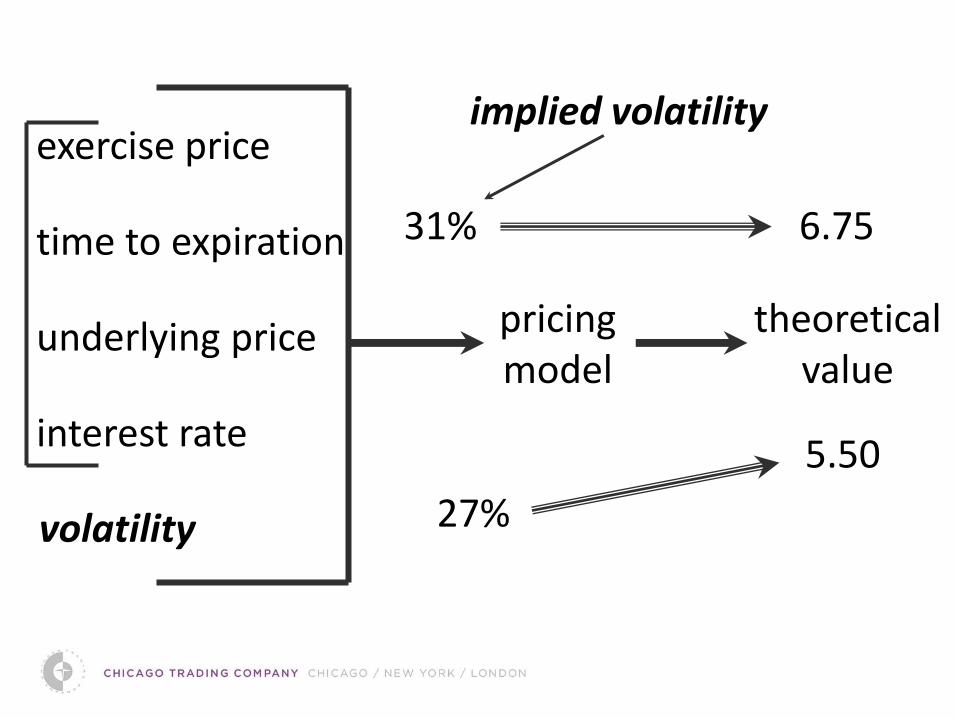
pricing model
theoretical value
5.50
6.75
exercise price
time to expiration
underlying price
interest rate
volatility 27% volatility
??? 31%
implied volatility
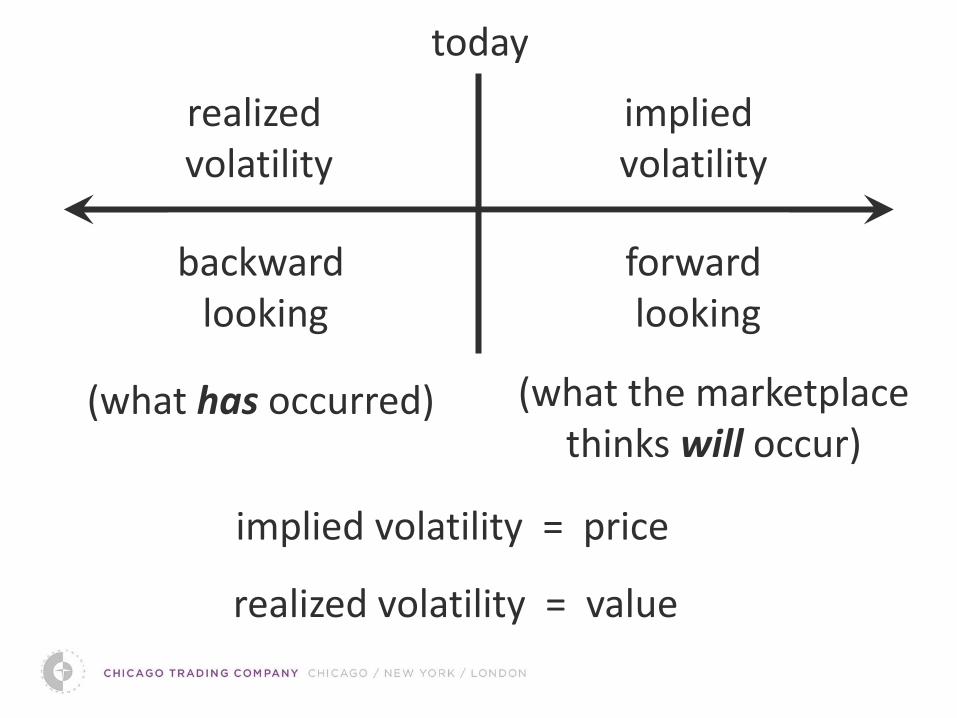
today
realized volatility
backward looking
(what has occurred)
implied volatility
forward looking
(what the marketplace thinks will occur)
implied volatility = price
realized volatility = value
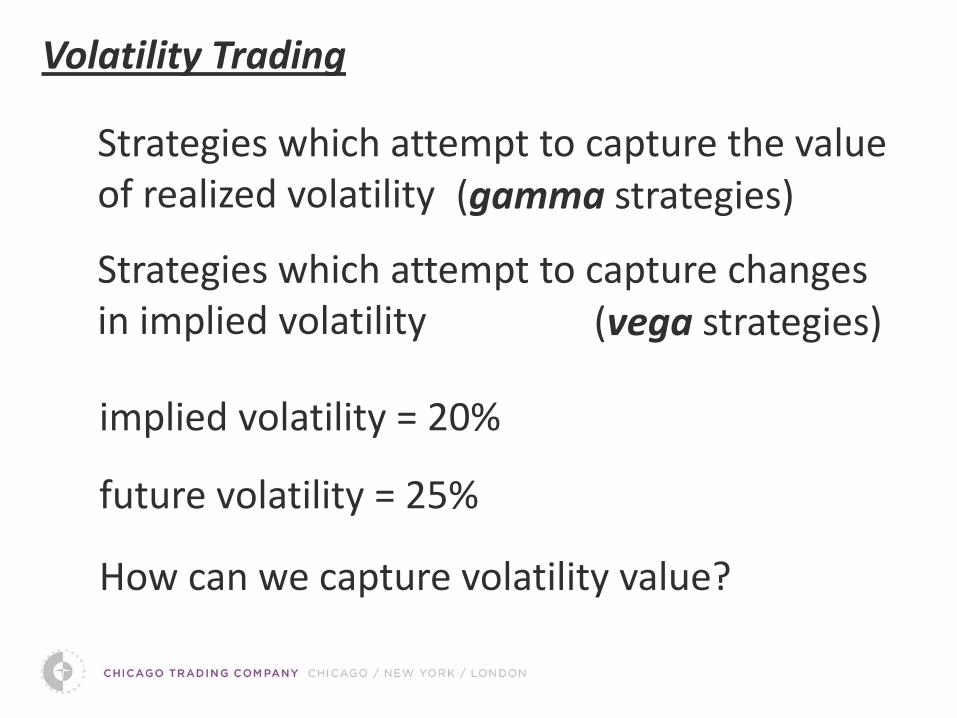
Strategies which attempt to capture the value of realized volatility
Volatility Trading
Strategies which attempt to capture changes in implied volatility
How can we capture volatility value?
implied volatility = 20%
future volatility = 25%
(gamma strategies)
(vega strategies)
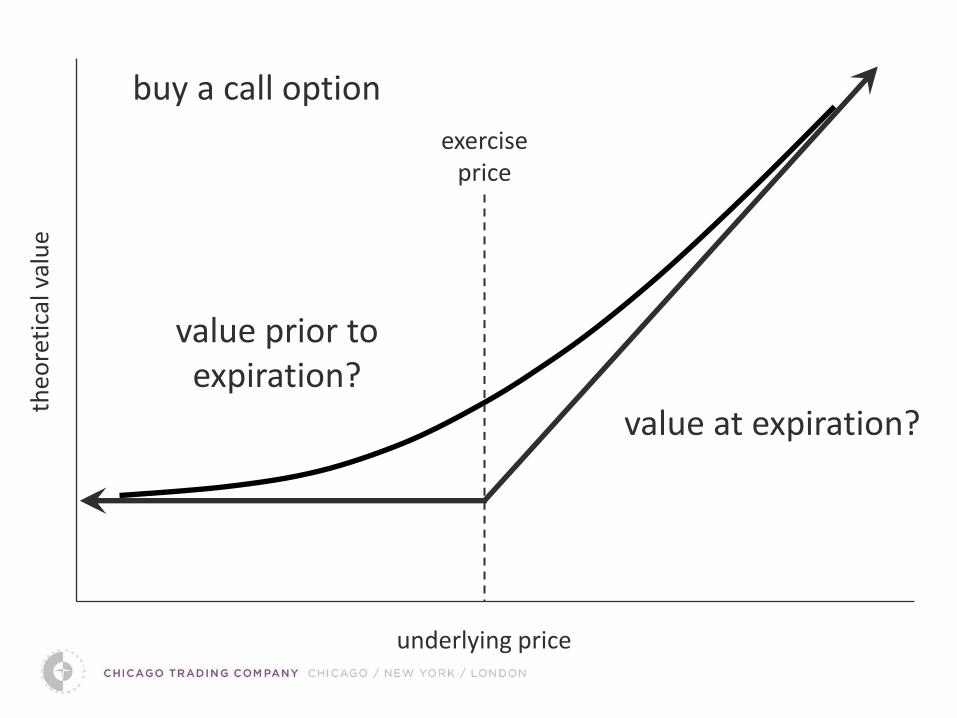
buy a call option
theo
reti
cal v
alu
e
underlying price
exercise price
value at expiration?
value prior to expiration?
theo
reti
cal v
alu
e
underlying price
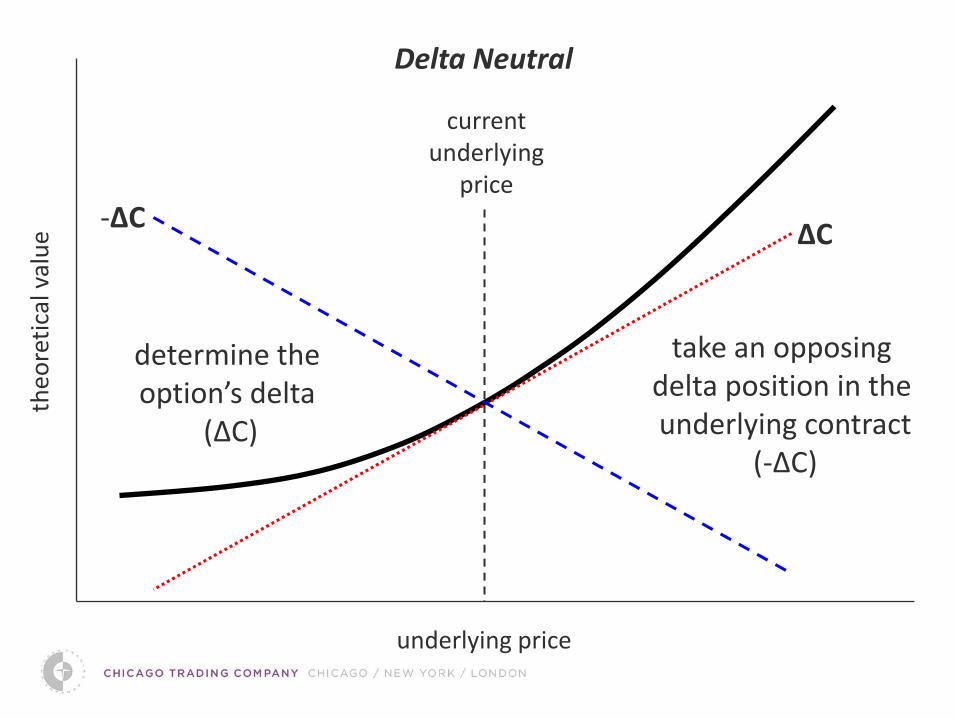
current underlying
price
determine the option’s delta
(ΔC)
ΔC
take an opposing delta position in the underlying contract
(-ΔC)
-ΔC
Delta Neutral
theo
reti
cal v
alu
e
underlying price
ΔC -ΔC
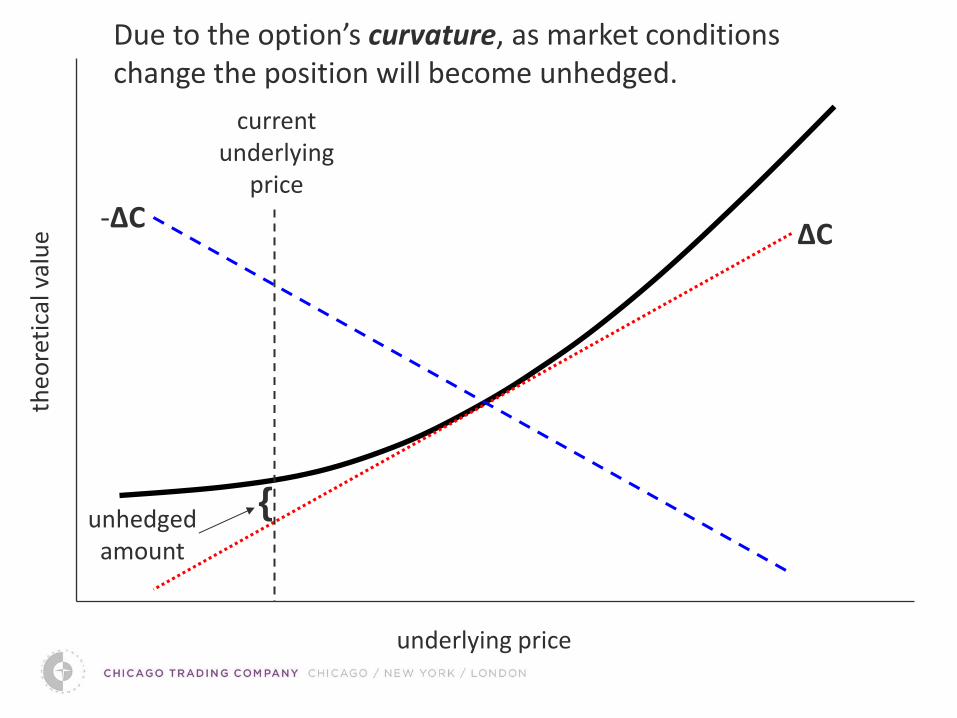
Due to the option’s curvature, as market conditions change the position will become unhedged.
current underlying
price
{ unhedged
amount
theo
reti
cal v
alu
e
underlying price
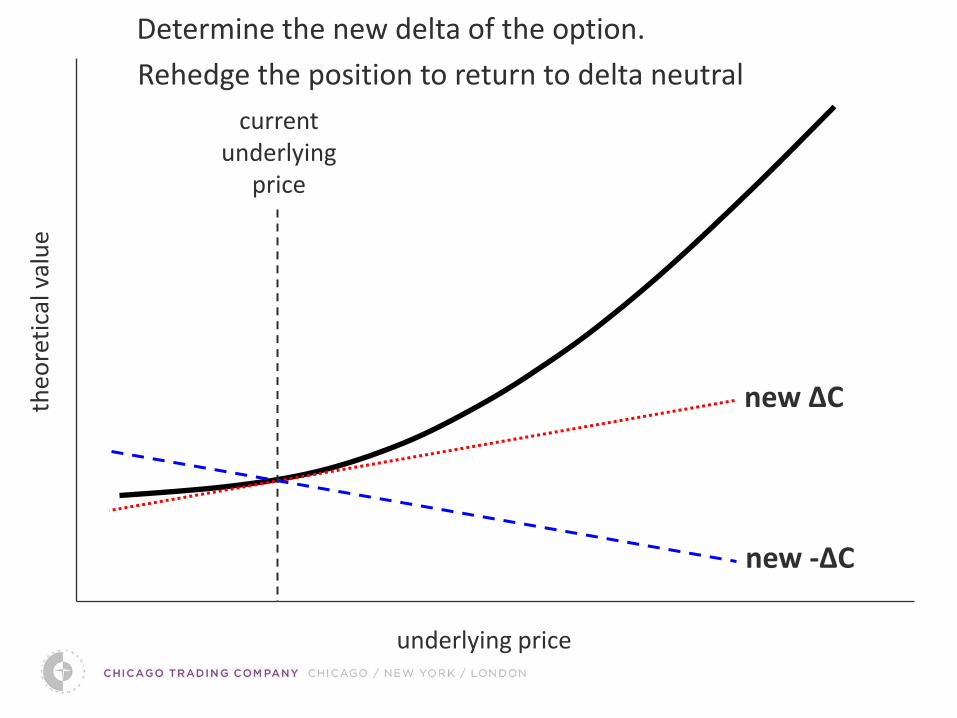
Determine the new delta of the option.
Rehedge the position to return to delta neutral
current underlying
price
new ΔC
new -ΔC
theo
reti
cal v
alu
e
underlying price
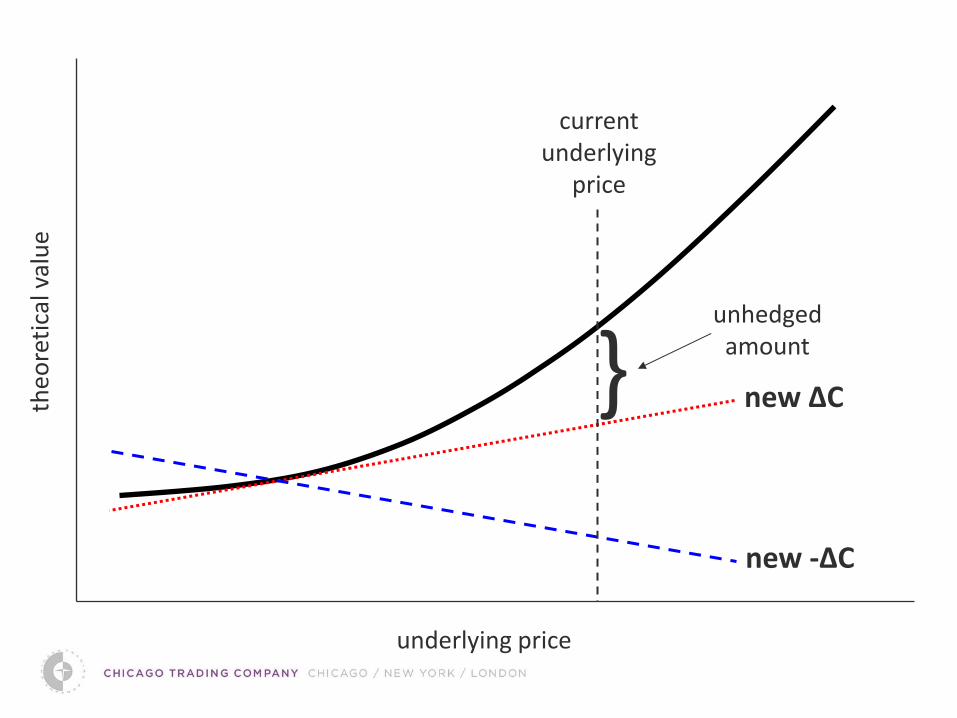
current underlying
price
} unhedged
amount
new ΔC
new -ΔC
theo
reti
cal v
alu
e
underlying price
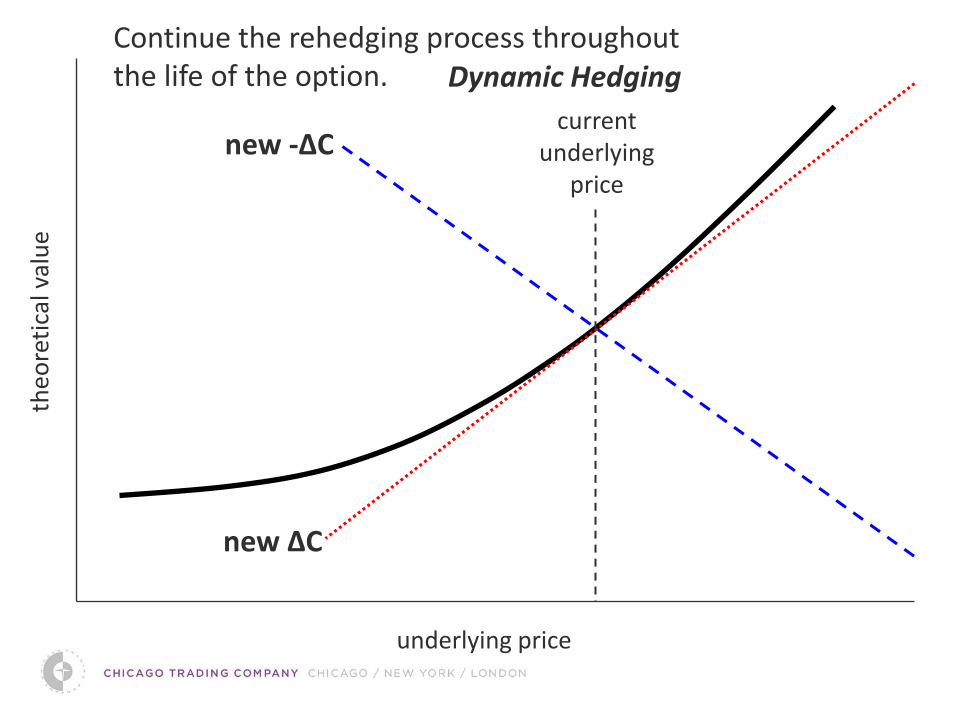
current underlying
price
new ΔC
new -ΔC
Dynamic Hedging Continue the rehedging process throughout the life of the option.
Suppose we add up all the profit opportunities over the life of the option which result from the rehedging process.
the option’s theoretical value
The rehedging process is a type of statistical arbitrage.
What should this equal?
Each time the position becomes unhedged there is a potential profit opportunity. We can capture this profit by rehedging the position.
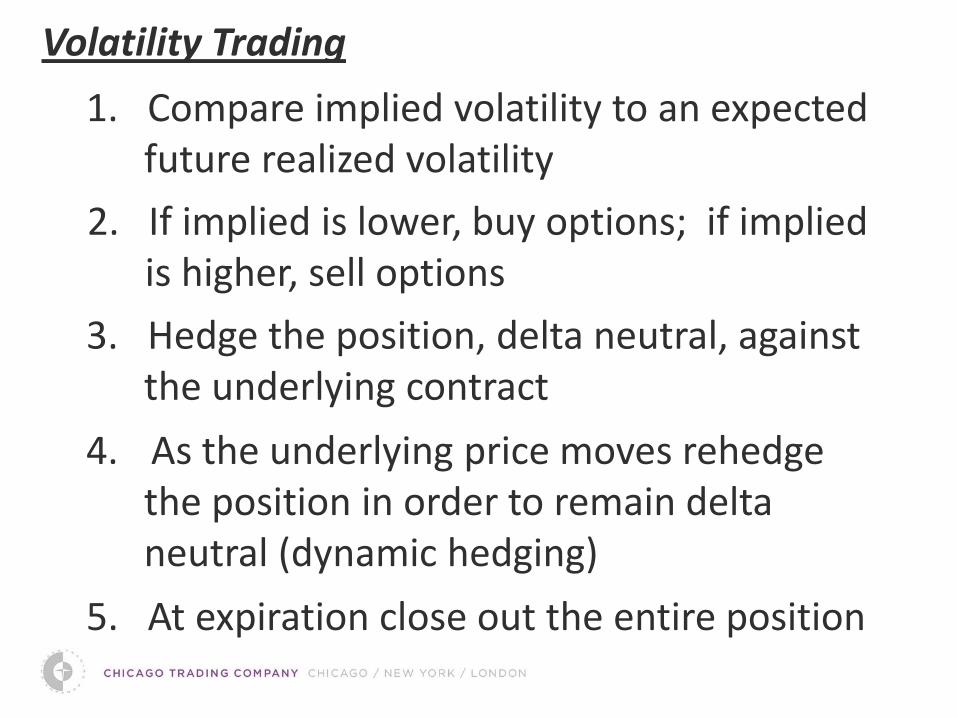
Volatility Trading
1. Compare implied volatility to an expected future realized volatility
2. If implied is lower, buy options; if implied is higher, sell options
3. Hedge the position, delta neutral, against the underlying contract
4. As the underlying price moves rehedge the position in order to remain delta neutral (dynamic hedging)
5. At expiration close out the entire position
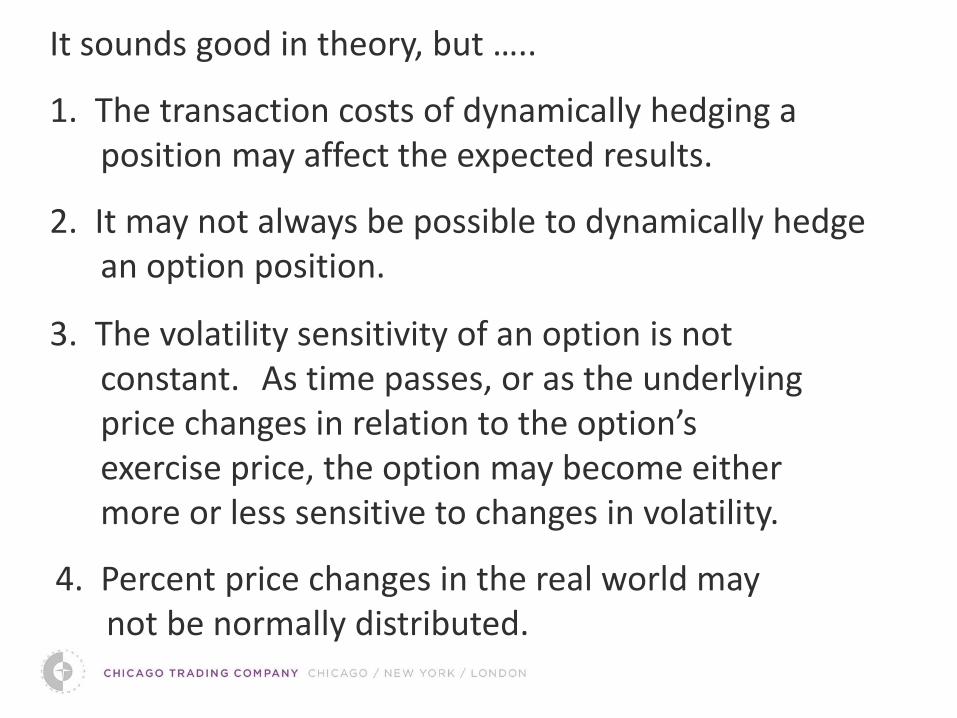
It sounds good in theory, but …..
2. It may not always be possible to dynamically hedge an option position.
3. The volatility sensitivity of an option is not constant. As time passes, or as the underlying price changes in relation to the option’s exercise price, the option may become either more or less sensitive to changes in volatility.
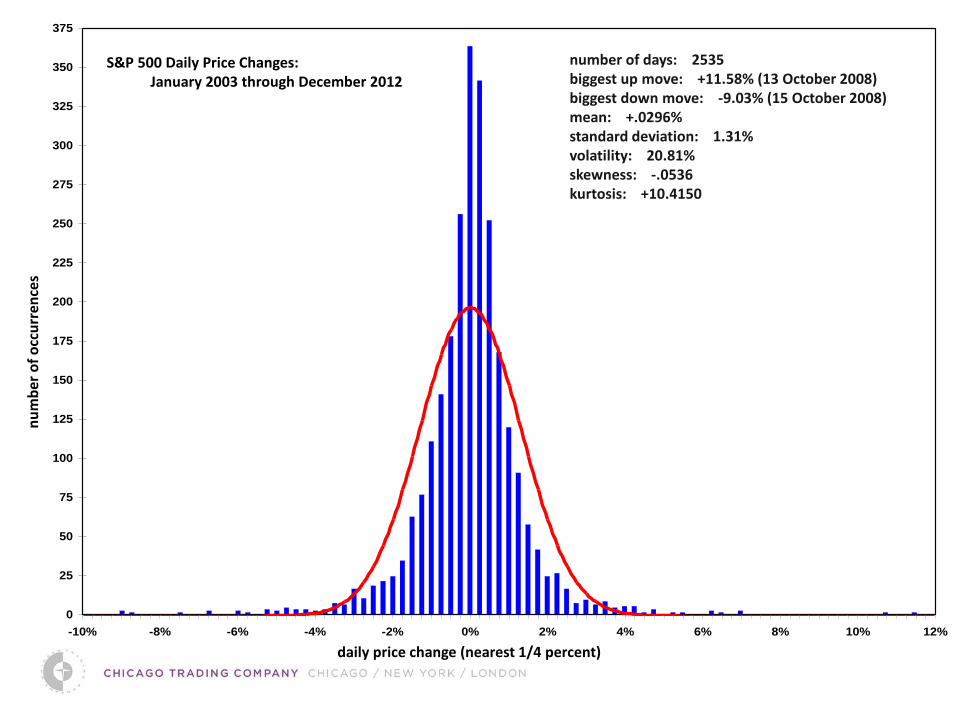
4. Percent price changes in the real world may not be normally distributed.
1. The transaction costs of dynamically hedging a position may affect the expected results.
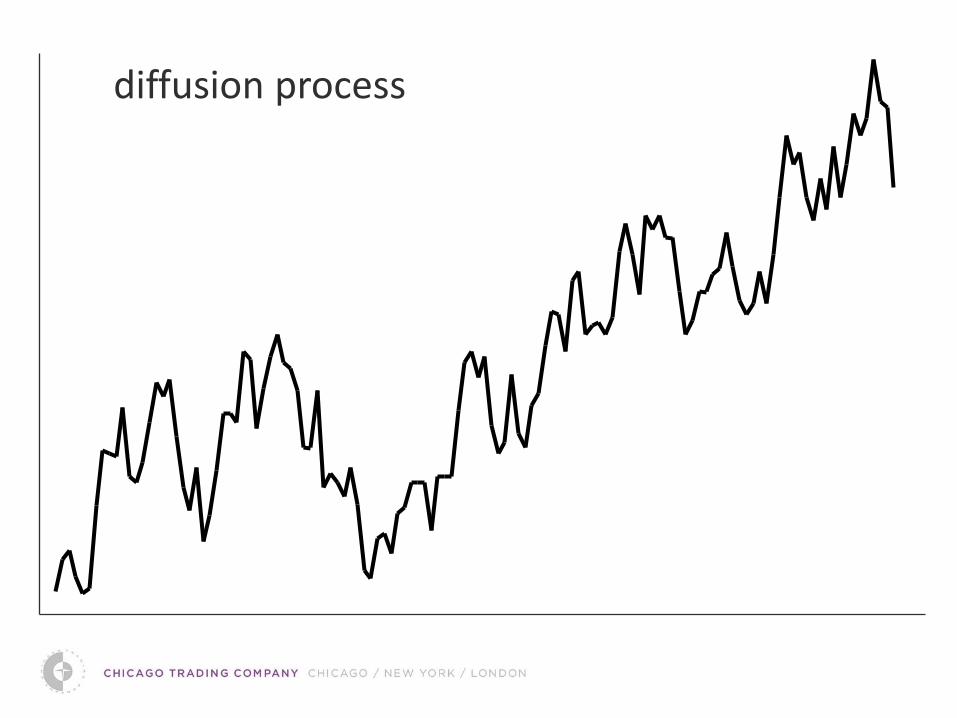
diffusion process
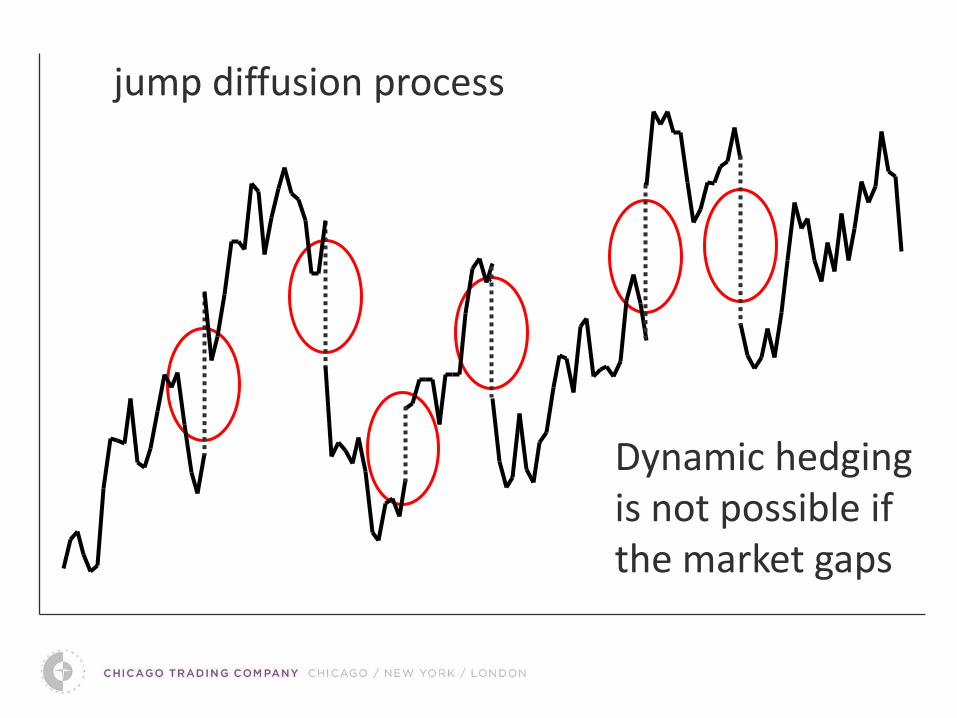
Dynamic hedging is not possible if the market gaps
jump diffusion process
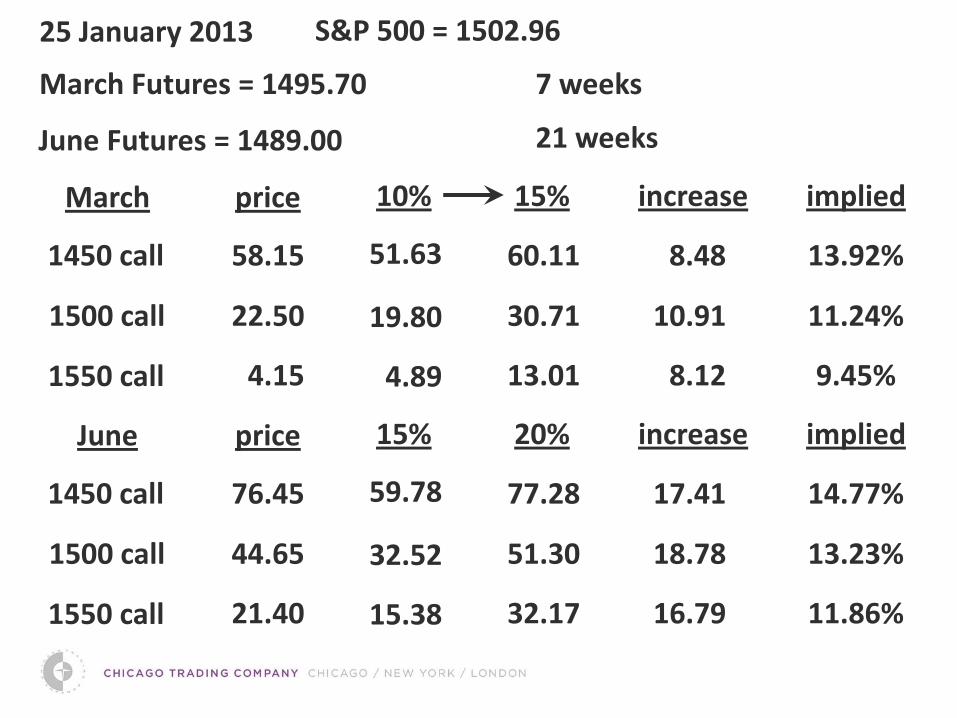
25 January 2013 S&P 500 = 1502.96
June Futures = 1489.00
1450 call
1500 call
1550 call
increase implied
13.92%
11.24%
9.45%
8.48
10.91
8.12
March
March Futures = 1495.70 7 weeks
21 weeks
price 10% 15%
58.15
22.50
4.15
51.63
19.80
4.89
60.11
30.71
13.01
1450 call
1500 call
1550 call
increase implied
14.77%
13.23%
11.86%
17.41
18.78
16.79
June price 15% 20%
76.45
44.65
21.40
59.78
32.52
15.38
77.28
51.30
32.17
90
95
100
105
110
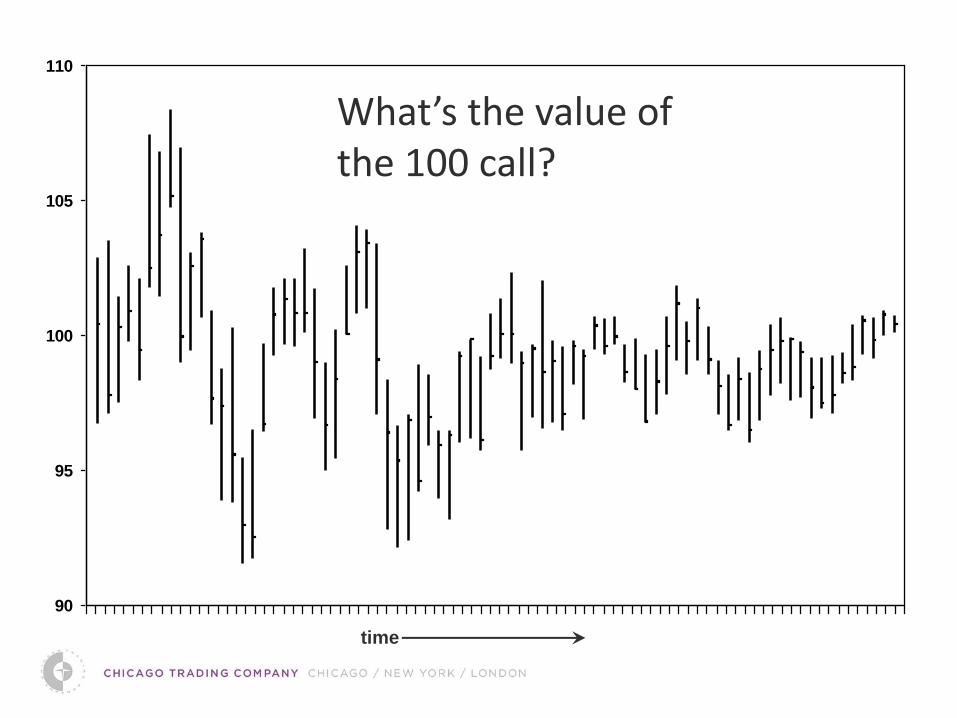
What’s the value of the 100 call?
time
90
95
100
105
110
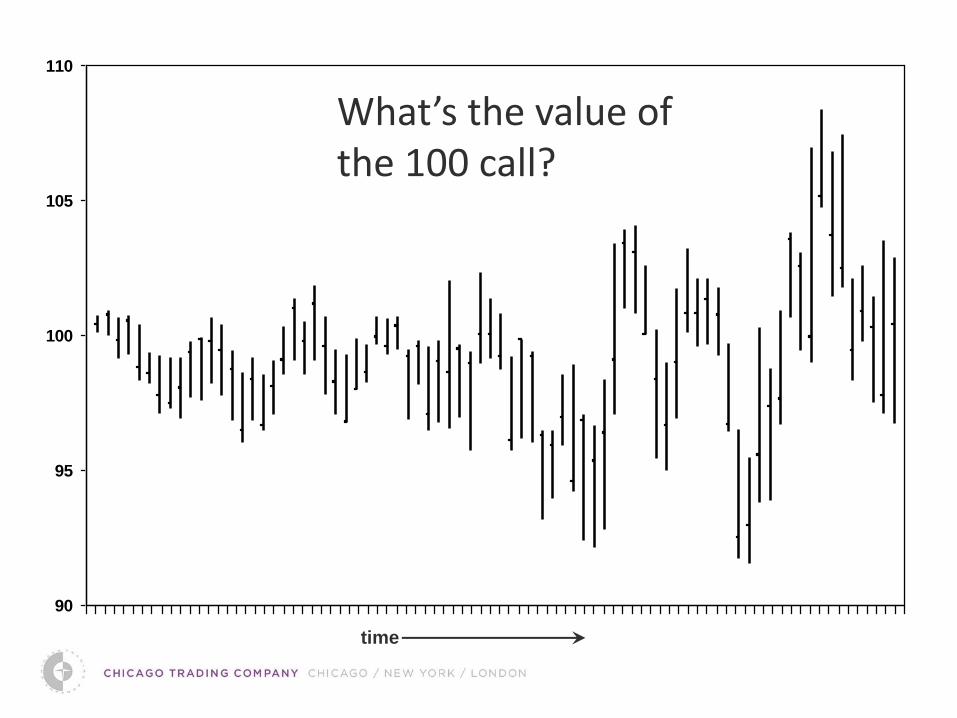
What’s the value of the 100 call?
time
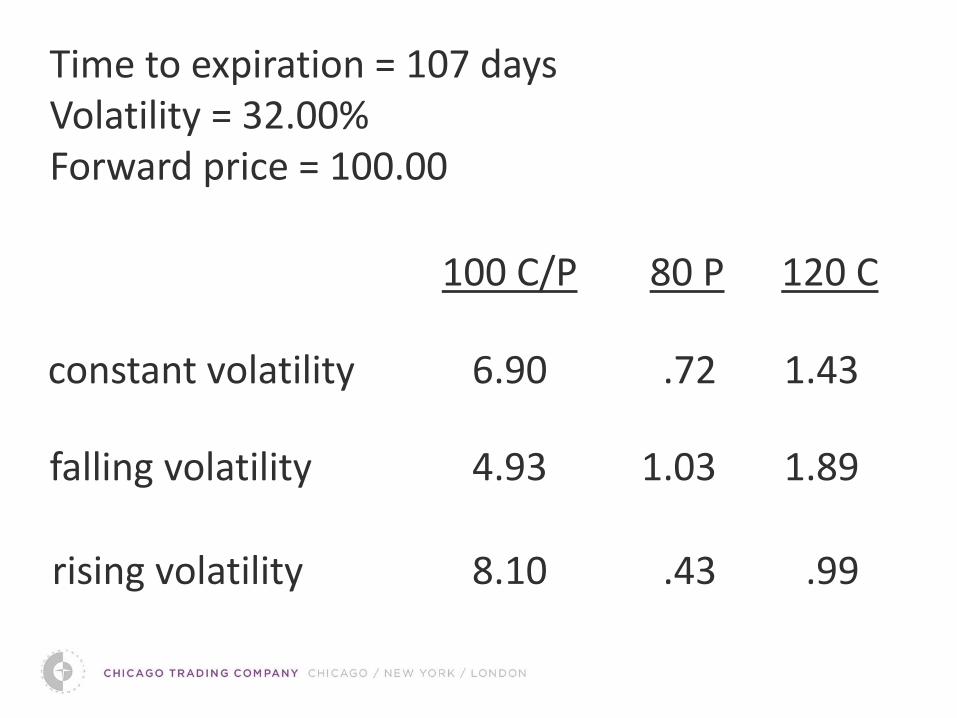
Time to expiration = 107 days Volatility = 32.00% Forward price = 100.00
100 C/P
constant volatility
rising volatility
falling volatility
6.90
4.93
8.10
80 P
.72
1.03
.43
120 C
1.43
1.89
.99
nu
mb
er o
f o
ccu
rren
ces
daily price change (nearest 1/4 percent)
S&P 500 Daily Price Changes: January 2003 through December 2012
number of days: 2535 biggest up move: +11.58% (13 October 2008) biggest down move: -9.03% (15 October 2008) mean: +.0296% standard deviation: 1.31% volatility: 20.81% skewness: -.0536 kurtosis: +10.4150
0
25
50
75
100
125
150
175
200
225
250
275
300
325
350
375
-10% -8% -6% -4% -2% 0% 2% 4% 6% 8% 10% 12%
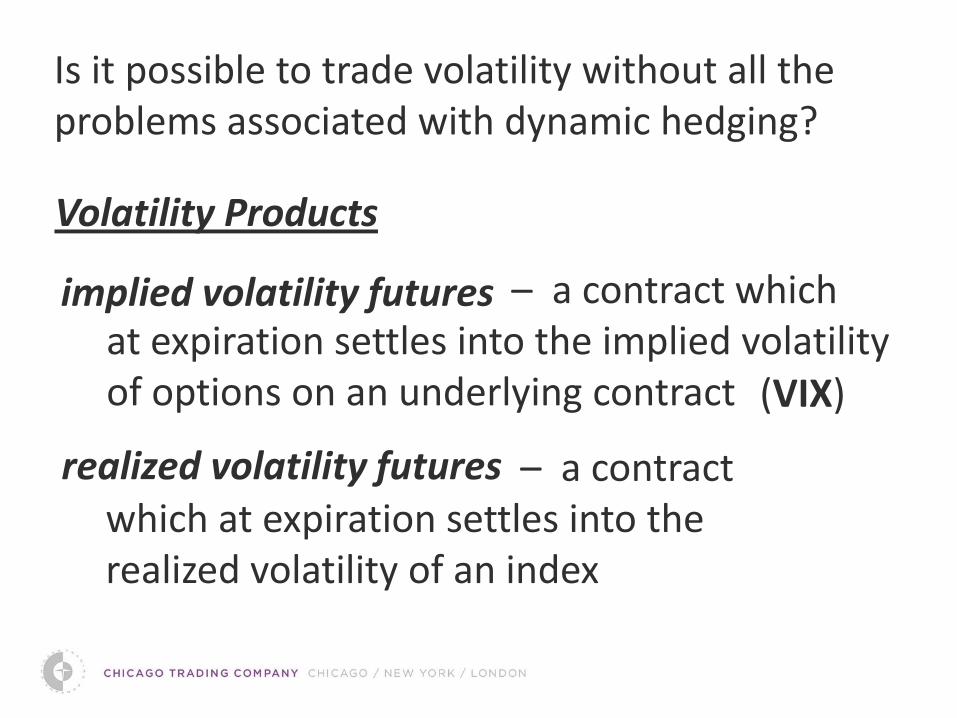
Volatility Products
implied volatility futures – a contract which at expiration settles into the implied volatility of options on an underlying contract
realized volatility futures – a contract which at expiration settles into the realized volatility of an index
Is it possible to trade volatility without all the problems associated with dynamic hedging?
(VIX)
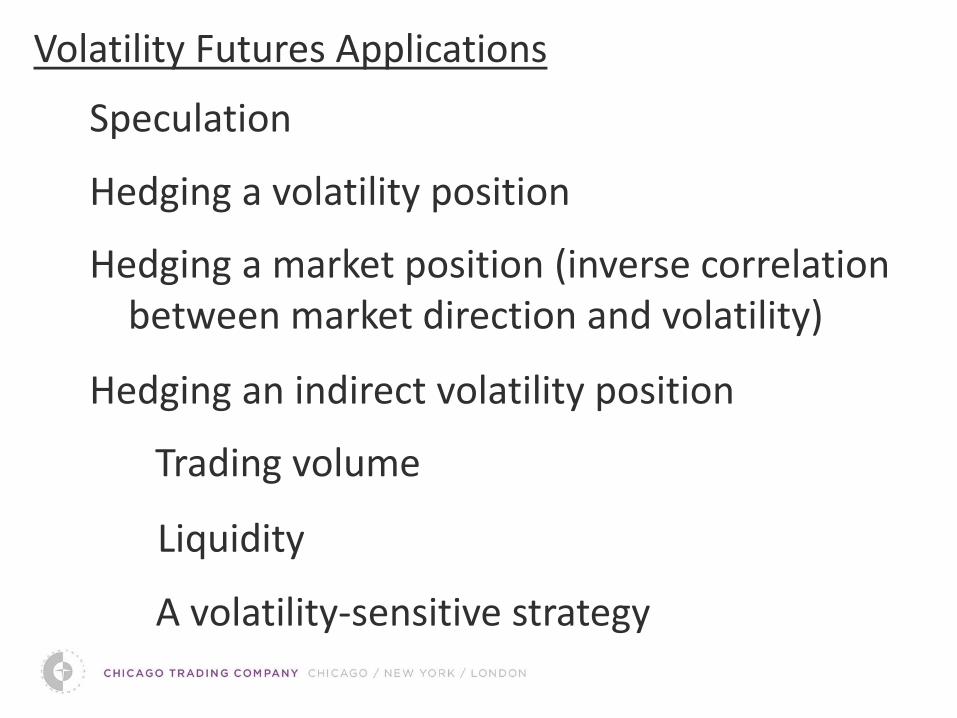
Volatility Futures Applications
Speculation
Hedging a volatility position
Hedging a market position (inverse correlation between market direction and volatility)
Hedging an indirect volatility position
Trading volume
Liquidity
A volatility-sensitive strategy
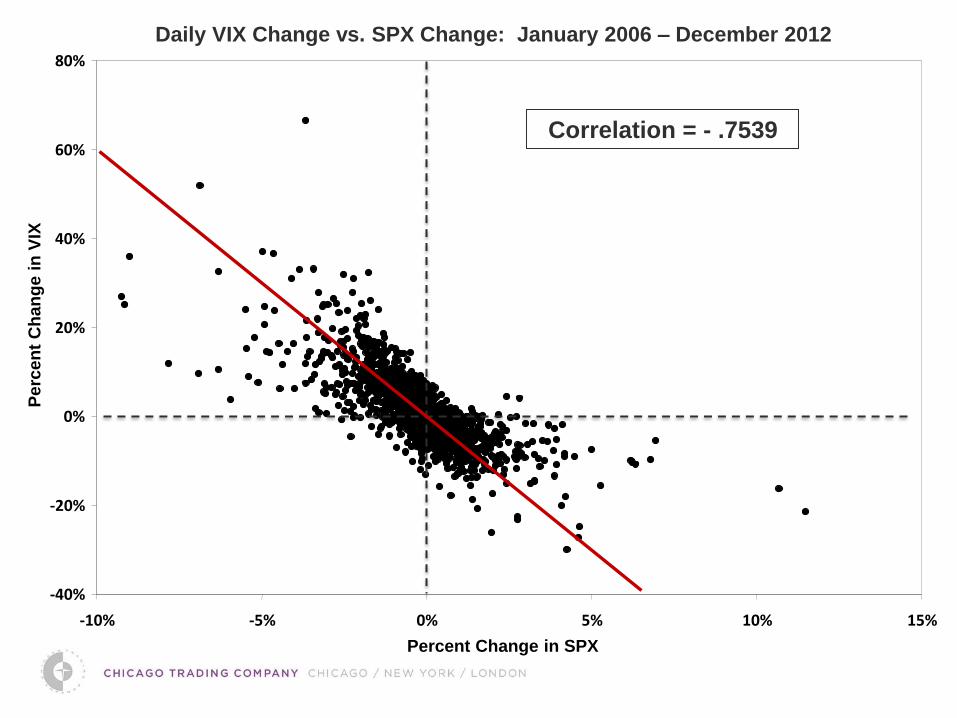
Daily VIX Change vs. SPX Change: January 2006 – December 2012
Correlation = - .7539
-40%
-20%
0%
20%
40%
60%
80%
-10% -5% 0% 5% 10% 15%
Percent Change in SPX
Perc
en
t C
han
ge i
n V
IX
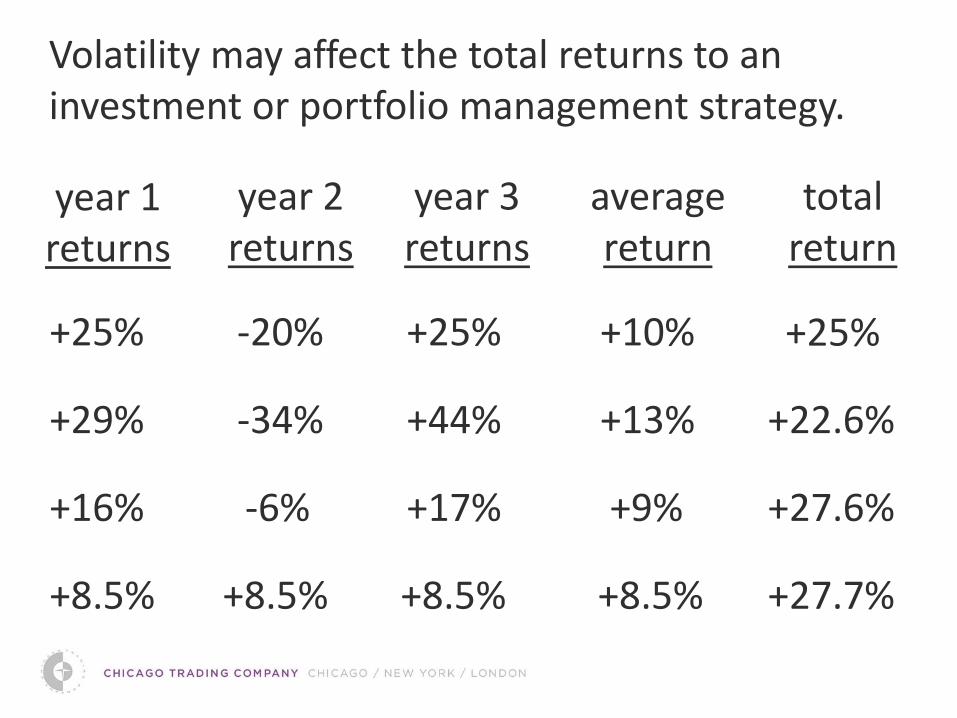
Volatility may affect the total returns to an investment or portfolio management strategy.
year 1 returns
year 2 returns
year 3 returns
average return
+25%
total return
-20% +10% +25%
+29% -34% +13% +44%
+25%
+22.6%
+16% -6% +9% +17% +27.6%
+8.5% +8.5% +8.5% +8.5% +27.7%
Top Related