


γλώσσες
Σελίδες
Νομικός

Body Size and Scaling
Size Matters in Physiology
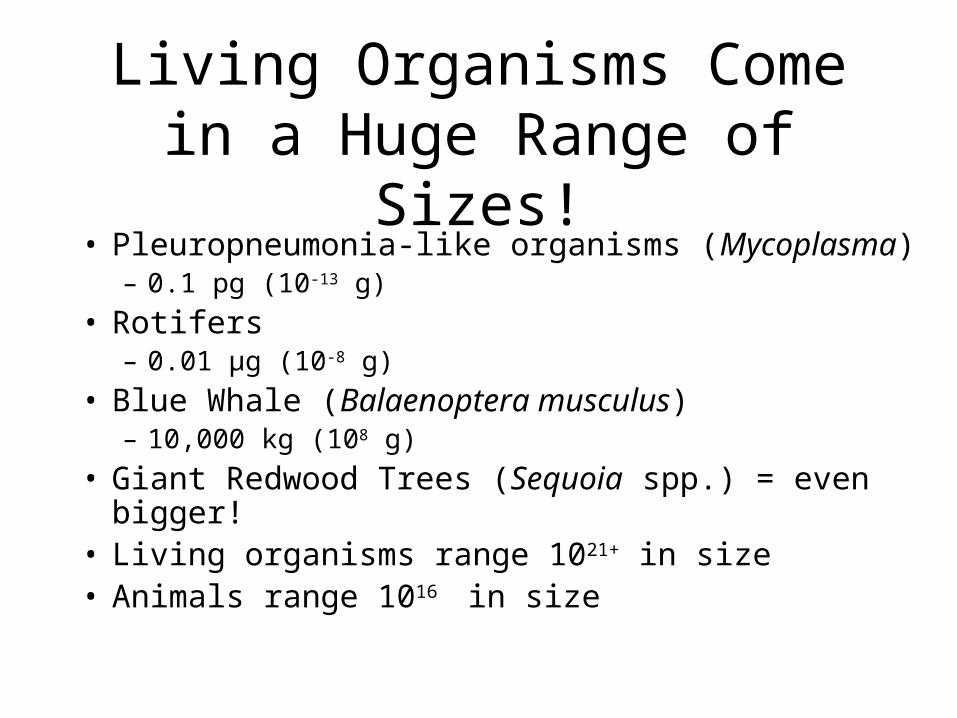
Living Organisms Come in a Huge Range of Sizes!
• Pleuropneumonia-like organisms (Mycoplasma) – 0.1 pg (10-13 g)
• Rotifers– 0.01 μg (10-8 g)
• Blue Whale (Balaenoptera musculus)– 10,000 kg (108 g)
• Giant Redwood Trees (Sequoia spp.) = even bigger!• Living organisms range 1021+ in size • Animals range 1016 in size
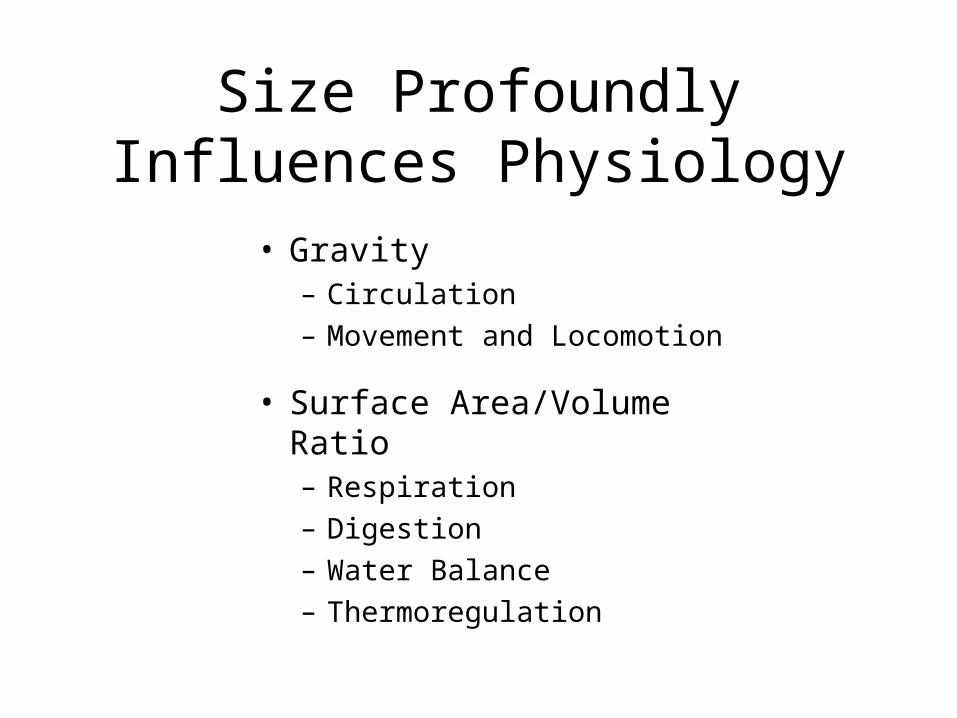
Size Profoundly Influences Physiology
• Gravity– Circulation– Movement and Locomotion
• Surface Area/Volume Ratio– Respiration– Digestion– Water Balance– Thermoregulation
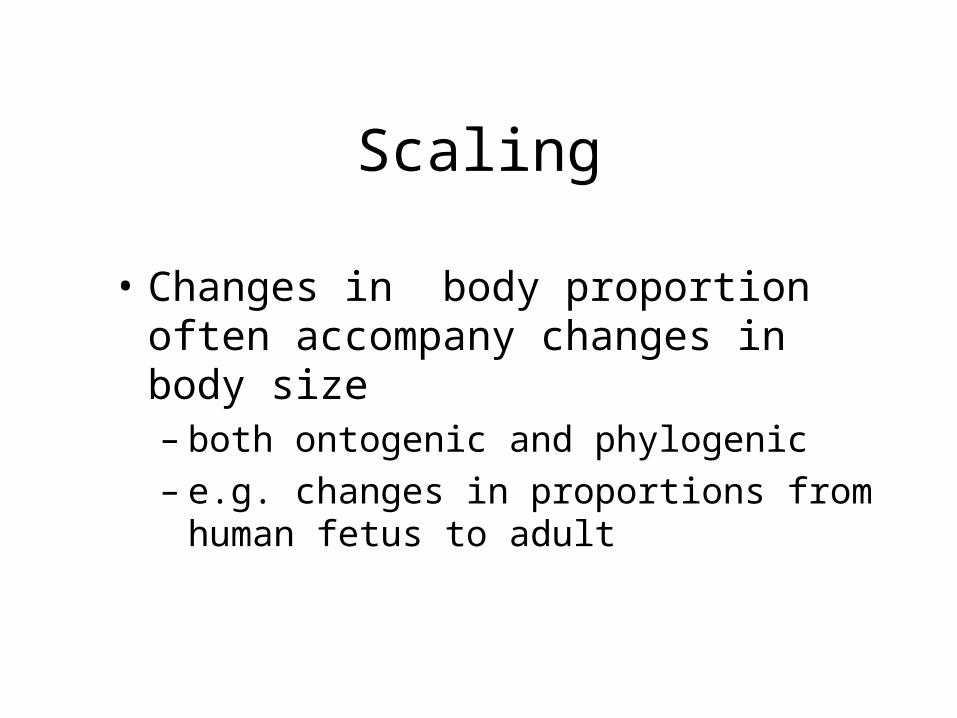
Scaling
• Changes in body proportion often accompany changes in body size– both ontogenic and phylogenic– e.g. changes in proportions from human fetus
to adult
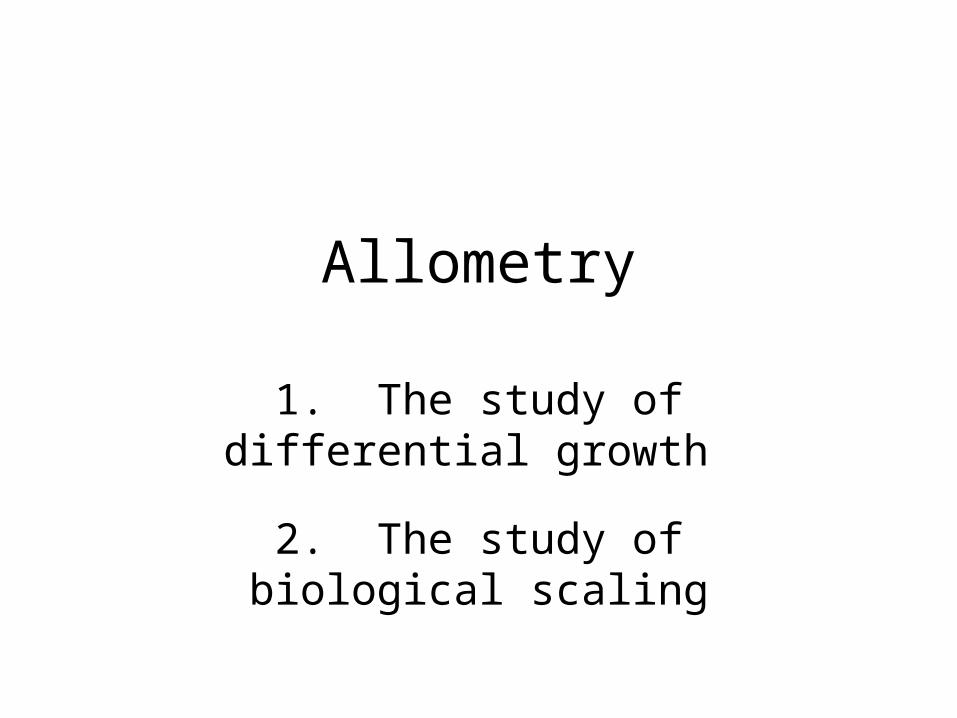
Allometry
1. The study of differential growth
2. The study of biological scaling
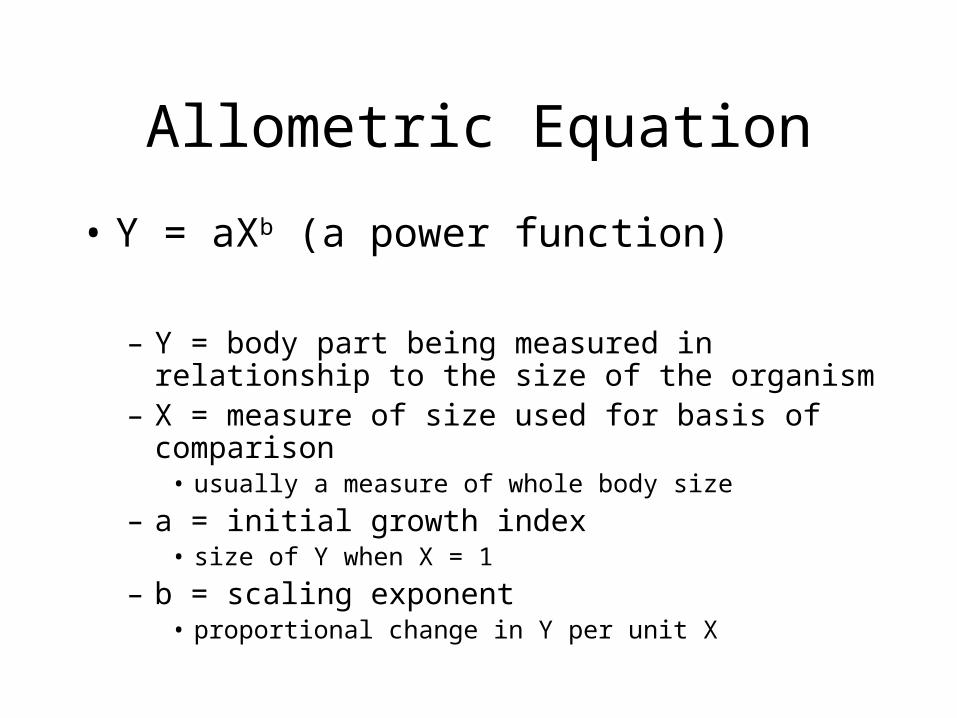
Allometric Equation
• Y = aXb (a power function)
– Y = body part being measured in relationship to the size of the organism
– X = measure of size used for basis of comparison • usually a measure of whole body size
– a = initial growth index • size of Y when X = 1
– b = scaling exponent • proportional change in Y per unit X
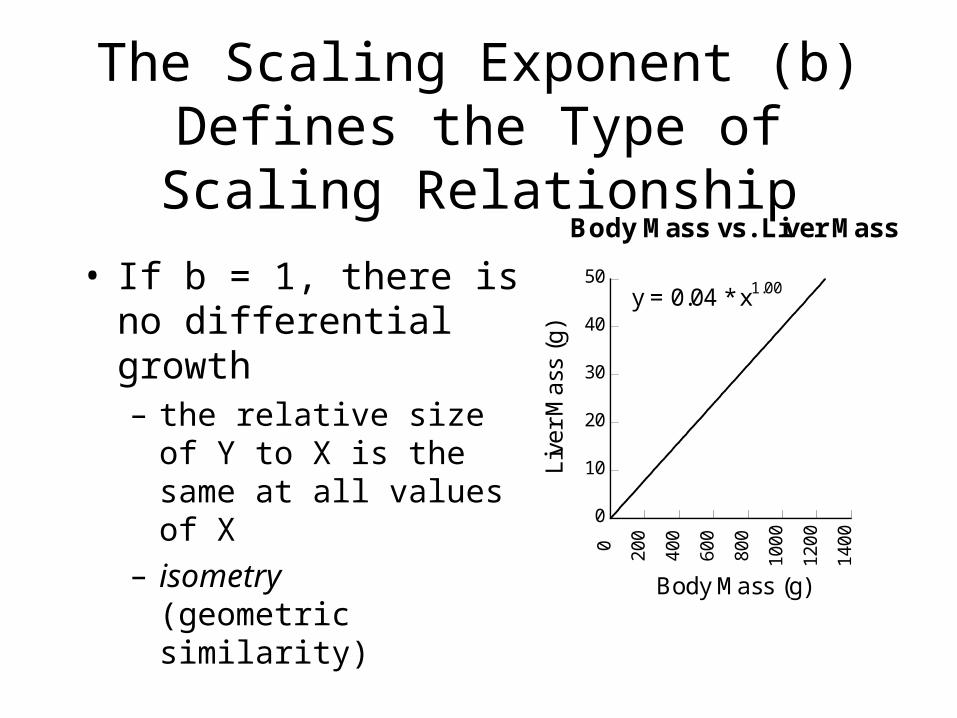
The Scaling Exponent (b) Defines the Type of Scaling Relationship
• If b = 1, there is no differential growth– the relative size of Y to X is
the same at all values of X– isometry
(geometric similarity)0
10
20
30
40
50
0 200
400
600
800
1000
1200
1400
Body Mass vs. Liver Mass
Live
r Mas
s (g
)Body Mass (g)
y = 0.04 * x1.00
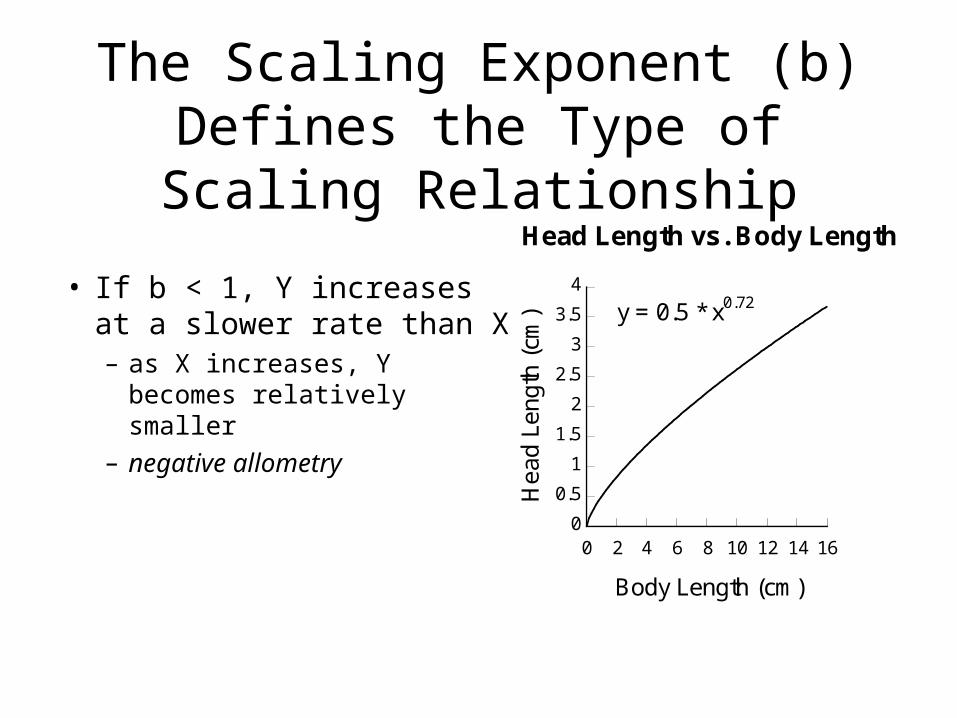
The Scaling Exponent (b) Defines the Type of Scaling Relationship
• If b < 1, Y increases at a slower rate than X– as X increases, Y becomes
relatively smaller– negative allometry
Hea
d Le
ngth
(cm
)
0
0.5
1
1.5
2
2.5
3
3.5
4
0 2 4 6 8 10 12 14 16
Head Length vs. Body Length
Hea
d Le
ngth
(cm
)
Body Length (cm)
y = 0.5 * x0.72
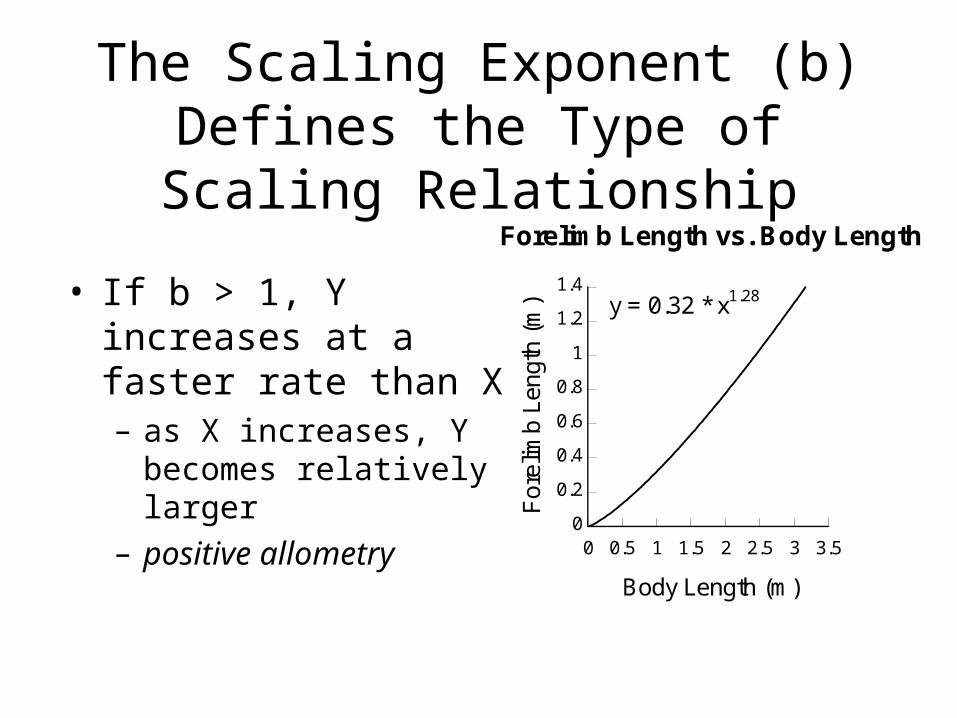
The Scaling Exponent (b) Defines the Type of Scaling Relationship
• If b > 1, Y increases at a faster rate than X– as X increases, Y becomes
relatively larger– positive allometry
0
0.2
0.4
0.6
0.8
1
1.2
1.4
0 0.5 1 1.5 2 2.5 3 3.5
Forelimb Length vs. Body Length
Fore
limb
Leng
th (m
)
Body Length (m)
y = 0.32 * x1.28
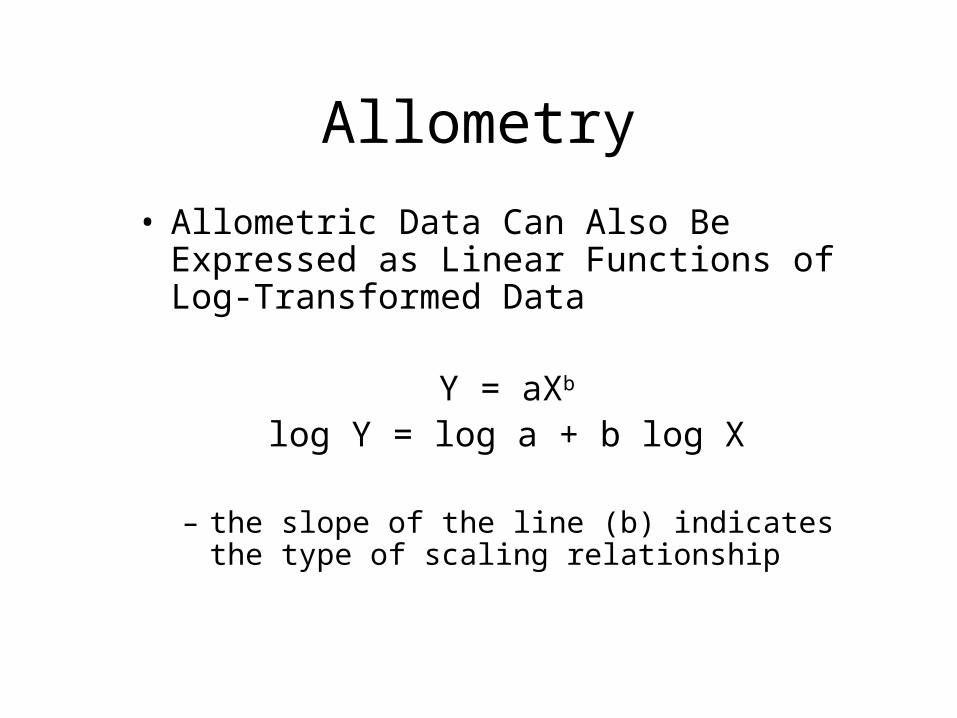
Allometry• Allometric Data Can Also Be Expressed as
Linear Functions of Log-Transformed Data
Y = aXb
log Y = log a + b log X
– the slope of the line (b) indicates the type of scaling relationship
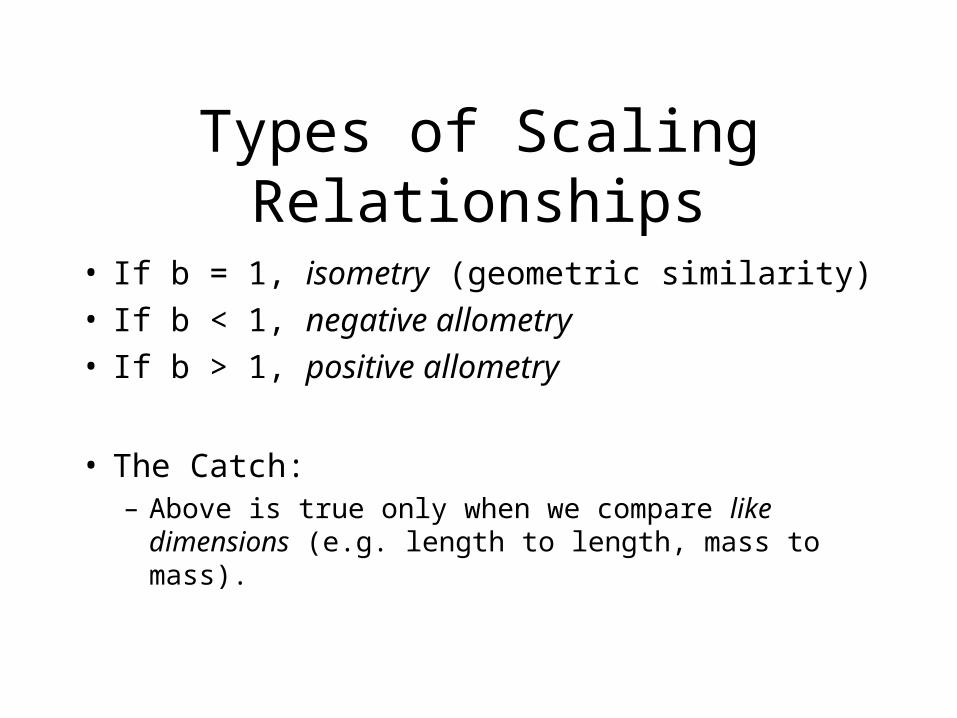
Types of Scaling Relationships
• If b = 1, isometry (geometric similarity)• If b < 1, negative allometry• If b > 1, positive allometry
• The Catch: – Above is true only when we compare like dimensions
(e.g. length to length, mass to mass).
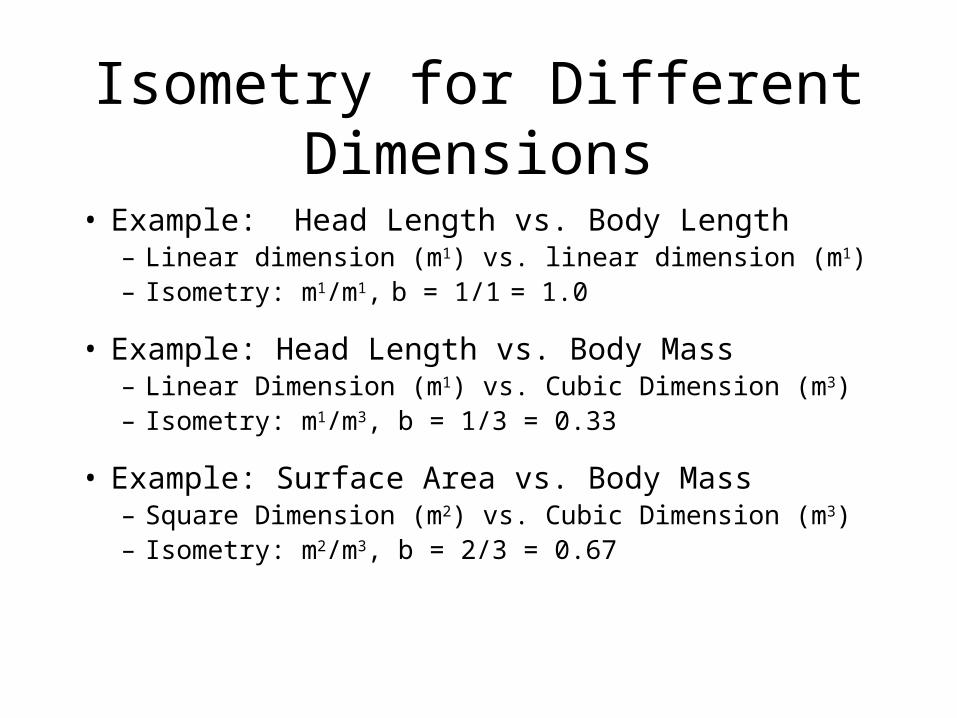
Isometry for Different Dimensions
• Example: Head Length vs. Body Length– Linear dimension (m1) vs. linear dimension (m1)– Isometry: m1/m1, b = 1/1 = 1.0
• Example: Head Length vs. Body Mass– Linear Dimension (m1) vs. Cubic Dimension (m3)– Isometry: m1/m3, b = 1/3 = 0.33
• Example: Surface Area vs. Body Mass– Square Dimension (m2) vs. Cubic Dimension (m3)– Isometry: m2/m3, b = 2/3 = 0.67
Differential Scaling is Common
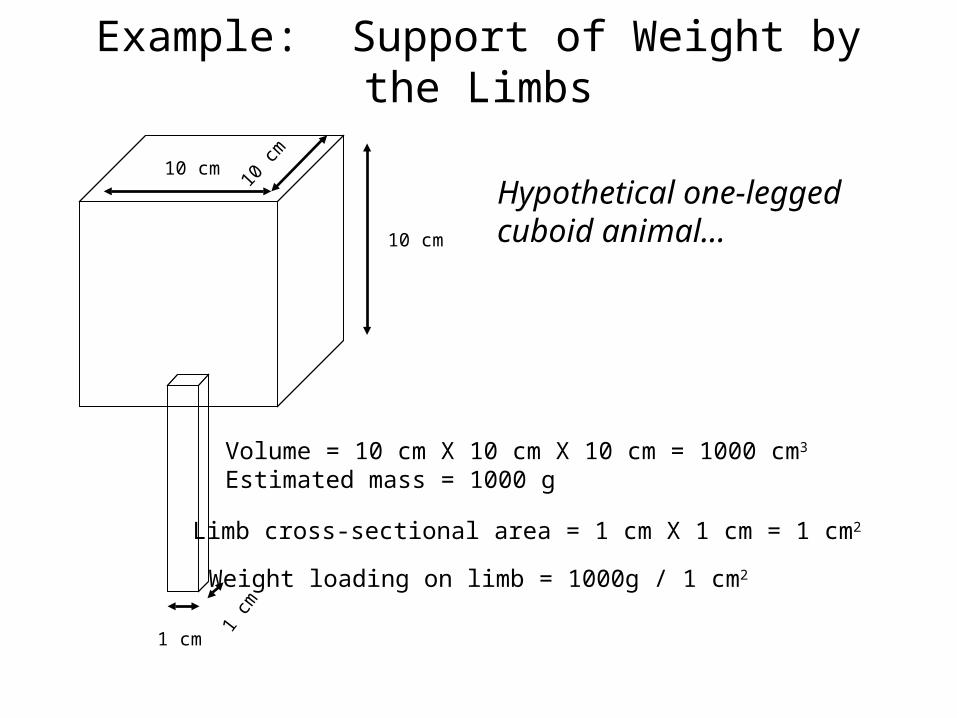
1 cm
1 cm
10 cm
10 cm 10 cm
Limb cross-sectional area = 1 cm X 1 cm = 1 cm2
Volume = 10 cm X 10 cm X 10 cm = 1000 cm3
Estimated mass = 1000 g
Weight loading on limb = 1000g / 1 cm2
Hypothetical one-legged cuboid animal…
Example: Support of Weight by the Limbs
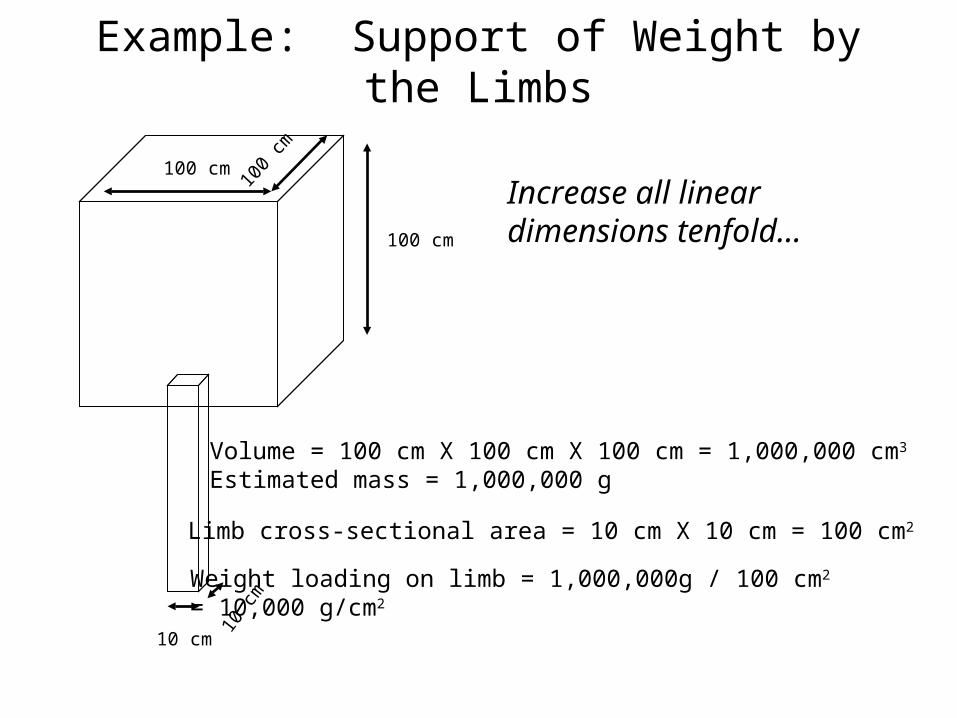
10 cm
10 cm
100 cm
100 cm 100 c
m
Limb cross-sectional area = 10 cm X 10 cm = 100 cm2
Volume = 100 cm X 100 cm X 100 cm = 1,000,000 cm3
Estimated mass = 1,000,000 g
Weight loading on limb = 1,000,000g / 100 cm2 = 10,000 g/cm2
Increase all linear dimensions tenfold…
Example: Support of Weight by the Limbs
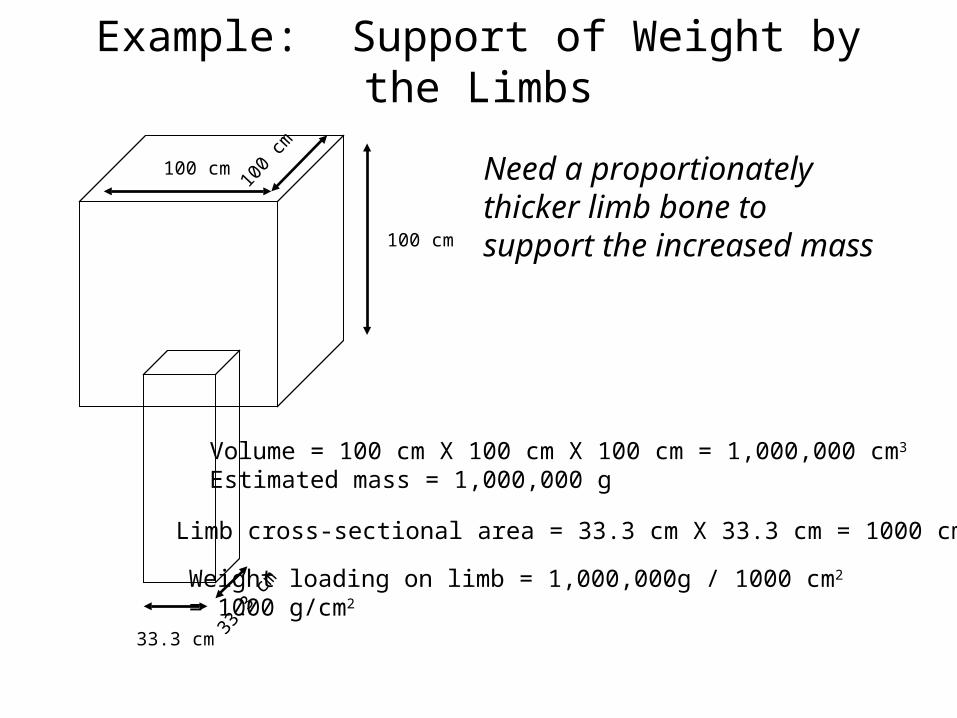
33.3 cm
33.3
cm100 cm
100 cm 100 c
m
Limb cross-sectional area = 33.3 cm X 33.3 cm = 1000 cm2
Volume = 100 cm X 100 cm X 100 cm = 1,000,000 cm3
Estimated mass = 1,000,000 g
Weight loading on limb = 1,000,000g / 1000 cm2 = 1000 g/cm2
Need a proportionately thicker limb bone to support the increased mass
Example: Support of Weight by the Limbs
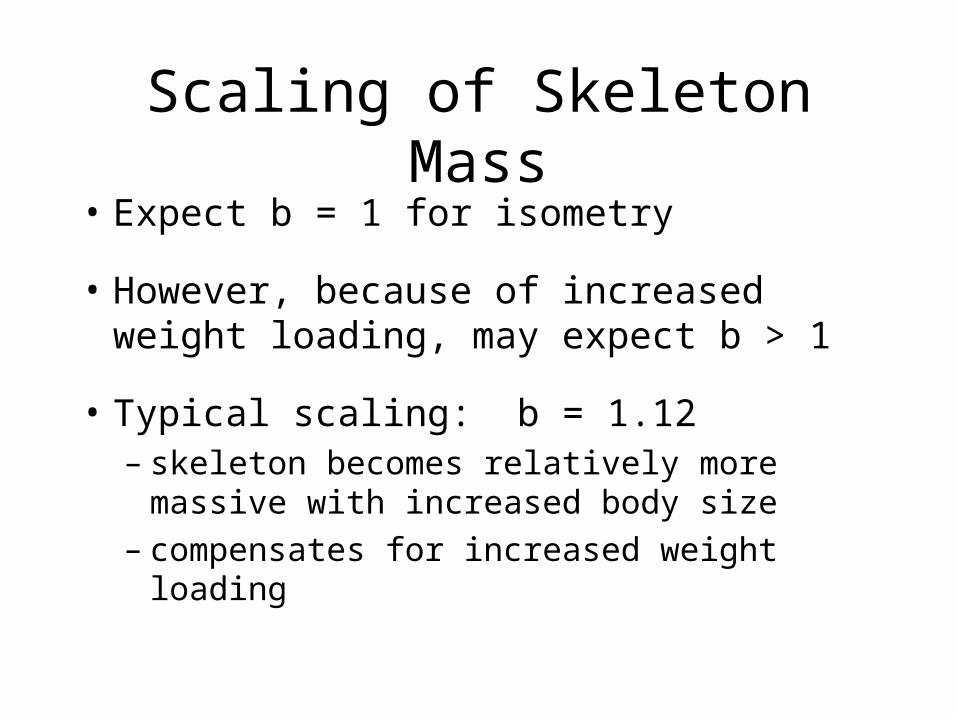
Scaling of Skeleton Mass• Expect b = 1 for isometry
• However, because of increased weight loading, may expect b > 1
• Typical scaling: b = 1.12– skeleton becomes relatively more massive with
increased body size– compensates for increased weight loading
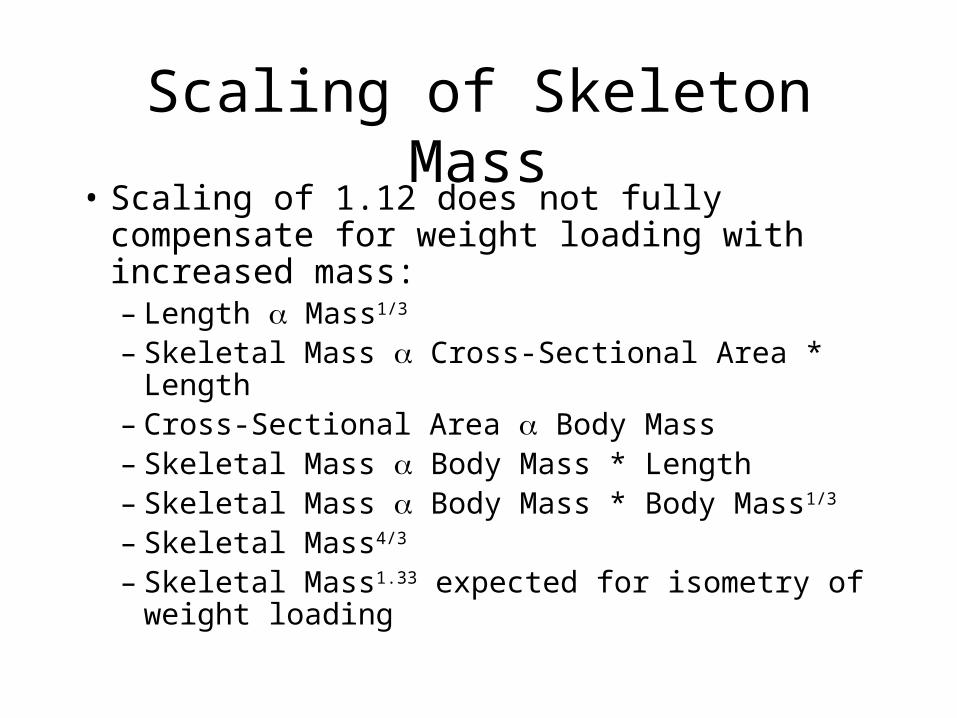
Scaling of Skeleton Mass• Scaling of 1.12 does not fully compensate for
weight loading with increased mass:– Length Mass1/3
– Skeletal Mass Cross-Sectional Area * Length– Cross-Sectional Area Body Mass– Skeletal Mass Body Mass * Length– Skeletal Mass Body Mass * Body Mass1/3
– Skeletal Mass4/3
– Skeletal Mass1.33 expected for isometry of weight loading
Scaling of Skeleton Mass
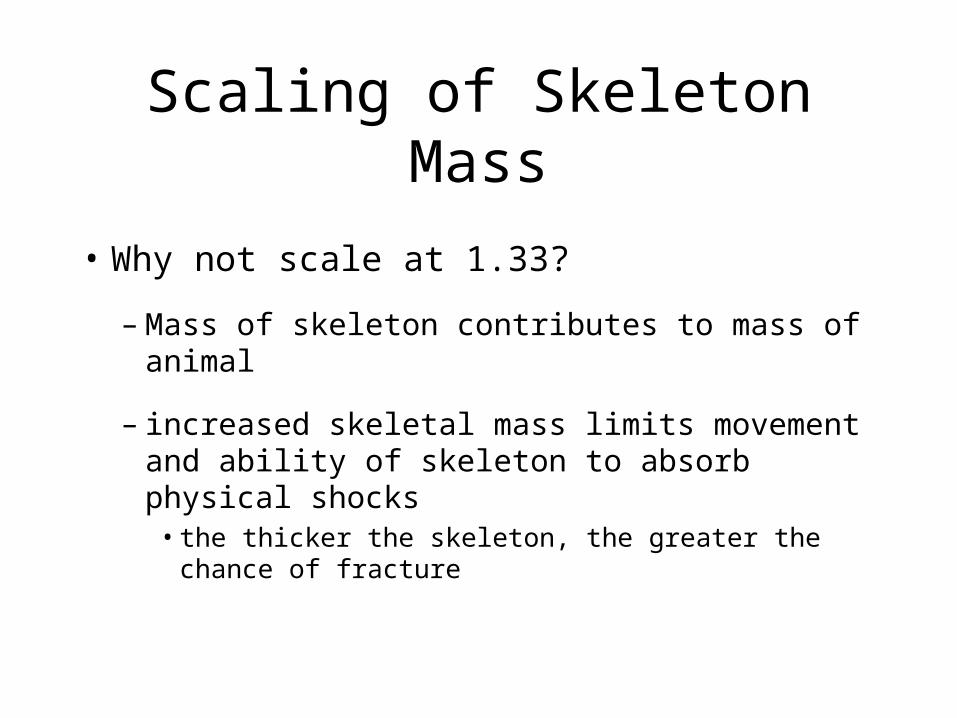
• Why not scale at 1.33?
– Mass of skeleton contributes to mass of animal
– increased skeletal mass limits movement and ability of skeleton to absorb physical shocks
• the thicker the skeleton, the greater the chance of fracture
Scaling of Skeleton Mass
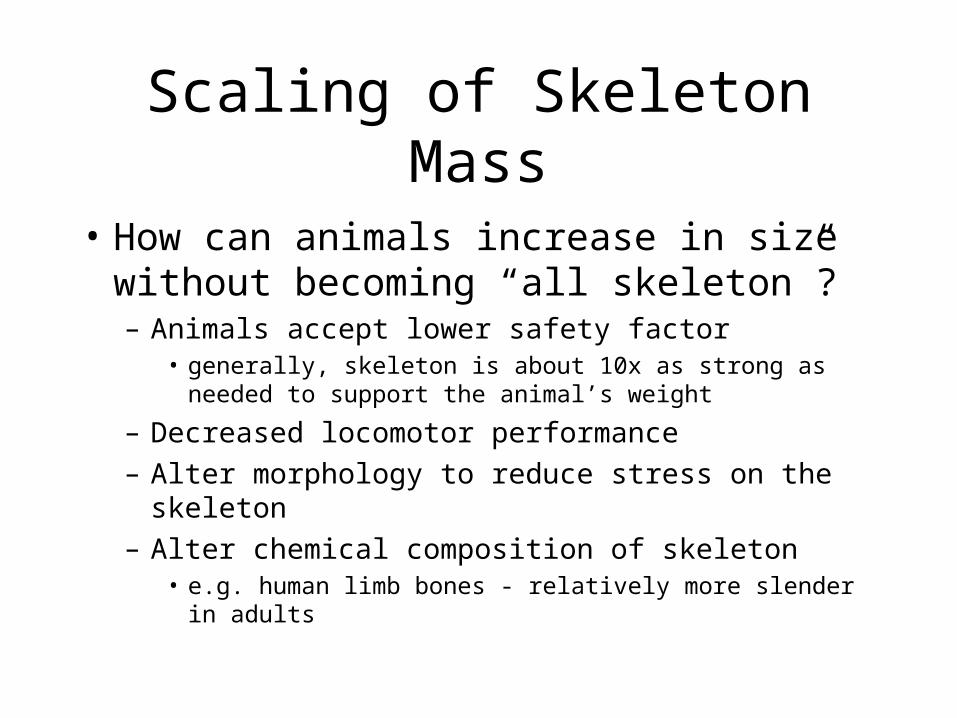
• How can animals increase in size without becoming “all skeleton”?– Animals accept lower safety factor
• generally, skeleton is about 10x as strong as needed to support the animal’s weight
– Decreased locomotor performance– Alter morphology to reduce stress on the skeleton– Alter chemical composition of skeleton
• e.g. human limb bones - relatively more slender in adults
How Does Differential Scaling Arise?
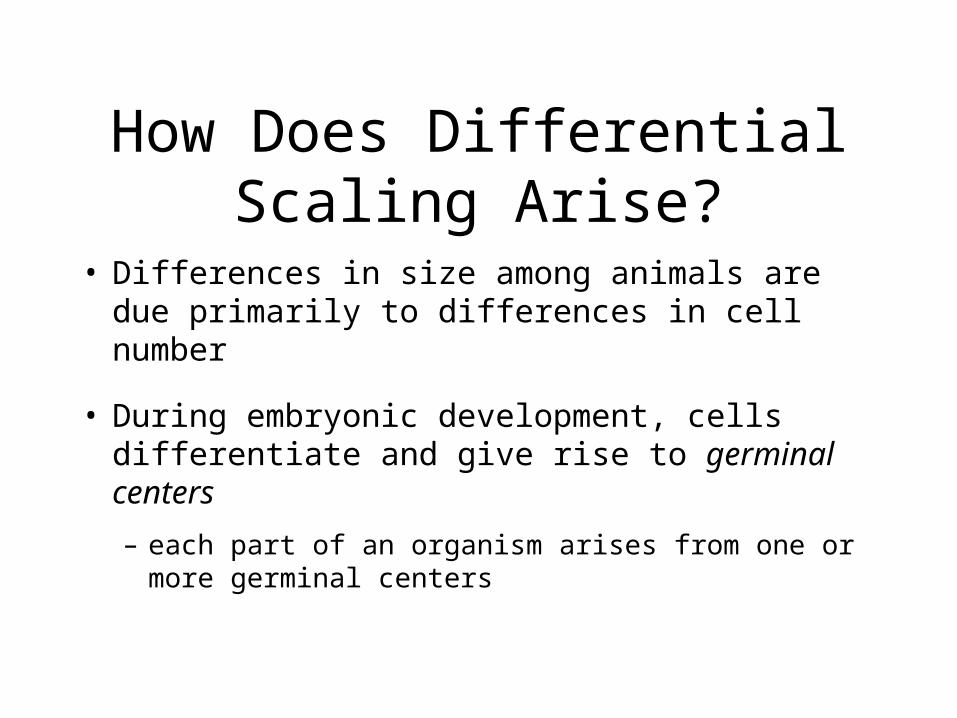
• Differences in size among animals are due primarily to differences in cell number
• During embryonic development, cells differentiate and give rise to germinal centers– each part of an organism arises from one or more
germinal centers
How Does Differential Scaling Arise?
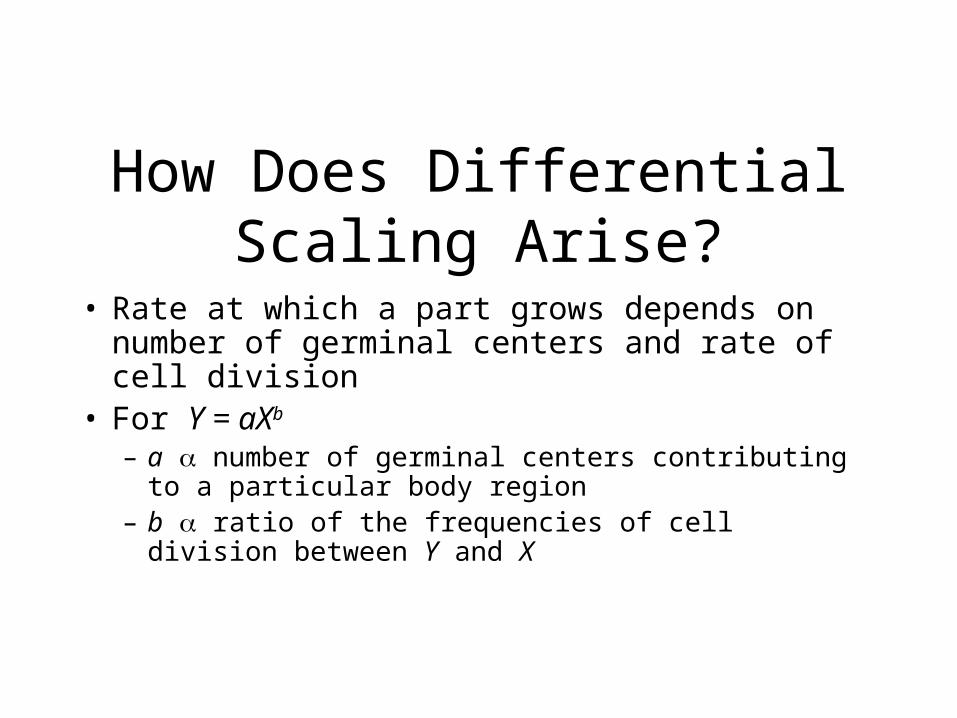
• Rate at which a part grows depends on number of germinal centers and rate of cell division
• For Y = aXb
– a number of germinal centers contributing to a particular body region
– b ratio of the frequencies of cell division between Y and X
Top Related