


γλώσσες
Σελίδες
Νομικός

Engineering of Science and Military Technologies ISSN: 2357- 0954Volume (1) - Issue (2) - 2017 DOI: 10.21608/ejmtc.2017.391.1009
58 2357-0954 © 2017 The Military Technical College
Key words: Added mass, Plunging, Reduced frequency
Corresponding Author: Mohamed Yehia Zakaria, PhD., Department of Aerospace, Tel: +222035656, E-mail: [email protected]
AbstractExperiments were conducted to measure the unsteady plunging forces on a NACA- 0012 airfoil at zero undisturbed flow velocity. The aim is to investigate the vari- ation of the added forces associated with high oscillation frequencies at various angles of attack. Data of the measured forces are presented and compared with the predicted forces from potential flow approximations. The results show a signifi- cant departure from those estimates particularly at high frequencies. The results show that the measured added forces varies in a cubic manner with the frequency of oscillations. These results were revealed to be different in its formulation com- pared to the formulation using Stokes flow. The measured forces were proposed to be a function of the local acceleration and drag forces that is function of the square of the wing section velocity.
I. INTRODUCTIONThe concept of added mass was proposed by Friedrich
Bessel in 1828 to explain differences between the periods [Stokes (1851)]. In his quest to explain the period of oscillations of a pendulum when submerged in fluids and vacuum. He concluded that the inertial mass of the pendulum must be increased to account for the increase in kinetic energy of the fluid around it. For a pendulum with a spherical shape attached to a thin wire, the added mass was found to be one half of the displaced fluid mass.
Inviscid potential flow analysis around a sphere accelerating in an otherwise stationary fluid reveals that the force on the sphere is totally due to the pressure
gradient on the surface of the sphere that balances the local acceleration ρ ∂ →−V /∂ t
and the pressure gradient that balances the convective term (non linear) accelera- tion V • 5−V produces zero forces. Inviscid potential flow theory is usually used
to predict the added mass tensor for accelerating bodies by considering the rate
of change of the kinetic energy of the surrounding fluid [Newman (1977)]. Ac- cording to that theory, a non lifting surface deeply submerged in fluids and in steady motion experiences zero net force, whereas a body flying steadily near or intersecting a free surface experiences a wave drag. In conclusion, if the viscosity effects are ignored, the fluid force on a body in oscillating motion
is solely due to the rate of change of the kinetic of the surrounding fluid.
Fluid viscosity significantly influences the fluid force on a body in unsteady motion not only because of the rate of change of the fluid kinetic energy but also because it modifies the time dependent pressure gradient on the body, shear stress, flow separation and vortex shedding. For the present configuration, we use the airfoil chord as a reference length, haω as a reference velocity and 1/ω as a reference time. By writing the non dimensional momentum equation,
Where λ 2 = ω c2/µ and Re = ω hac/µ are the non-dimensional frequency and then Reynolds number, respectively.
The fluid flow on oscillating spheres and related geometry such as ellipsoids and discs are well documented for stokes flow (Re → 0). For example, Lawrence and Weinbaum (1988) predict the force on an ellipsoid in longitudinal oscillation. If the velocity of the ellipsoid center is U cos(ωt), then the approximation of the force is:
Original Article
An Experimental Assessment of Unsteady Forces on a Plunging Airfoil Oscillating in Stationary Fluid at High Frequencies
Mohamed Y. Zakaria1, D. A. Pereira2, Muhammad R. Hajj3, Saad A., Ragab4, F. D. Marques5
1PhD, Assistant Professor, Aerospace Engineering Department, Military Technical College, Cairo 11766, Egypt.([email protected]), Corresponding author, 2MSc. in Engineering,
University of Sa˜o Paulo (EESC/USP), Brazil, 3Professor, Biomedical Engineering and Mechanics, Norris Hall, 4Professor, Biomedical Engineering and Mechanics, Norris Hall, 5Associate professor, University of Sa˜o Paulo (EESC/USP), Brazil.

Engineering of Science and Military TechnologiesVolume (7) - Issue (2) - 2017
59
Where Fs is stokes drag which is function of relative velocity, B is the Basset force which corresponds to the flow memory and (F − B) is a shape correction factor for spheroids.
To be concise, the added mass term could be produced using a potential flow formulation from the local acceleration term as well as could be evolved from Stoksian flow using the local acceleration term while considering the viscous shear wall forces. For the case of airfoil with sharp trailing edge and rounded leading edge, the vortex shedding from those edges might contribute to the total unsteady forces associated with the airfoil motion and dominated by increasing the frequency of oscillations.
On the other hand, fluid viscosity significantly influences the fluid force on a body in unsteady motion not only because of the rate of change of the fluid kinetic energy but also because it modifies the time dependent pressure gradient on the body and other forces due to shear stress, flow separation and vortex shedding. In classical unsteady aerodynamic problems, the forces are usually split into those due to the relative acceleration between a moving body immersed in a fluid and circulatory forces induced by the vortical structure interaction associated with the wake [Theodorsen (1935); Kussner (1936); Von Karman (1938)]. Yet, such a separation is not very clear in some applications. For instance, an oscillating airfoil in still air may generate its own flow patterns. As such, additional forces are not related to added mass forces only but to forces generated by the vortex shedding and flow separation.
Chen et al. (1976) derived a closed-form solution for the added mass and damping coefficient on a cylindrical rod vibrating in a viscous fluid contained in a fixed cylindrical shell. They also performed experimental measurements. Their analytical and experimental results for the added mass coefficient and damping ratio were found to be in good agreement. However, their linear theory was based on the assumption that the vibration amplitude is small. Brennen (1982) reviewed the state of knowledge, at that time, concerning the evaluation of the forces im- posed by a body in a fluid due to acceleration of either the body or the fluid. He suggested that the added mass for a body of complex geometry might be estimated for each direction of acceleration from the principal dimensions of the projected area in that direction and a corresponding approximate equation. Lissaman and Brown (1993) studied the added mass effects on flight dynamics of parafoils. The authors concluded that, for reduced frequency 0.3 ≤ k (π f c/U∞) ≤ 0.4, the effect of vorticity is to cancel the apparent mass effect, which reduces the
rate of change of static lift with the angle of attack. They proposed a constant (C) as an alleviat- ing factor for the relative frequency of motion in case that it is not considered in the theoretical unsteady CL˙α term.
Yadykin et al. (2003) performed a three-dimensional analysis for calculating the added mass of a cantilever plate undergoing first-mode vibrations. Their ap- proach assumes a spanwise half-sine fundamental mode and a single natural mode in the chordwise direction. The thin airfoil theory was used to calculate the forces. Their main findings are: (a) the nondimensional added mass is a function of the plate’s aspect ratio and the order of the natural modes of vibration, (b) the increase of the order of the chordwise natural mode of vibration decreases the value of the added mass, (c) decreasing the aspect ratio leads to a decrease of the added mass and attenuates the dependence of the added mass on the order of the chordwise natural mode. This dependence diminishes as the aspect ratio approaches 0.01. For an aspect ratio that is equal to one, the results obtained by a three-dimensionaltheory are close to those calculated by a two-dimensional one (A=∞). Finally, the commonly used slender-wing approximation for calculating the added mass tendsto overestimate the results for aspect ratios higher than ≈0.7 and underestimates these values for lower aspect ratio plates vibrating at the fundamental mode.
Granlund and Simpson (2007) showed experimentally that the added mass is linearly dependent on the plunging velocity of a three-dimensional ellipsoid. They supported their experiments by potential flow arguments. Maniaci and Li (2011) found that the added mass effect caused a 3.6 % change in thrust for a rapid pitch case of a wind turbine blade and a change in the amplitude and phase of the thrust for a case with 30o of yaw. Granlund et al. (2014) performed experiments in a wa- ter tunnel to study the nonlinearity effects of leading and trailing vortex interac- tions on two cascaded plunging plates. Their results show a quadratic relation for the normalized added mass force with the oscillation frequency at low plunging speeds. In addition, they observed an optimum spacing between the two plunging wings in which the nonlinear interactions takes place.
The current literature does not include a discussion of the unsteady forces for airfoils oscillating at high frequencies as well as high angles of attack in still air. The major challenge that needs to be addressed is the contribution to the total forces by the added mass and the unsteady forces. In this effort, we performed experiments to measure the aerodynamic loads on an airfoil undergoing plunging oscillations over a frequency range between 18 and 100 rad/s and with angles of attack up to 50 degrees. We estimated the added forces by subtracting the inertial loads from the total measured forces and compared to the potential flow approximations. This allowed us to determine the contribution of the unsteady forces.
II. POTENTIAL FLOW PREDICTIONWhen an airfoil undergoes oscillations in a fluid,

Mohamed Y. Zakaria et al
60
additional pressure forces are required to accelerate the fluid in its vicinity. These forces, which are referred to as the added mass effect, are functions of the local accelerations of the moving body. Based on Theodorsen’s theory [Theodorsen (1935)], the total unsteady force calculated on a thin airfoil with a chord length b undergoing a plunging and pitching motion at small angles of attack is given by:
Since we are interested in plunging motion only with no free stream velocity (V=0), the expression for the non circulatory added force can be written as:
Theodosen’s formulation for the added mass force given in eq. 4 does not account for the angle of attack dependency as it is valid at low angles. In order to account for the angle of attack dependence, we apply Kochin and Roze (1964) formulation considering the two-dimensional unsteady potential flow induced by an unsteady motion of an elliptic cylinder in a quiescent fluid as shown in Figure 1. Writing the instantaneous velocity of the cylinder center
Where x and y are the Cartesian coordinates along the major and minor axes of the ellipse, respectively, Γ is the circulation around the cylinder and a and b are the semi major and minor axes. Next, we consider an elliptic cylinder whose major axis is inclined at an angle α with the horizontal (defined here as an angle of attack) and its center moves vertically with a velocity W (t) as shown in Figure 2.
Fig. 1: Elliptical cylinder moving in quiescent fluidAssuming that the circulation around the cylinder is
zero, (Γ = 0), the vertical and horizontal components of the aerodynamic force are given by:
Considering that the plunging force is the vertical component of the force and
Fig. 2: Vertical and horizontal aerodynamic forces acting on a two-dimensional ellipse assuming the case of a flat plate (b → 0), we obtain a plunging force of the form:
The non-circulatory lift associated with a plunging flat plat can then be written as:
The theoretical prediction matches with the geometrically unsteady potential flow model developed by Yan et al. (2014) for airfoils undergoing large amplitude ma- neuvers. The issue with the potential flow assumption when it comes to prediction of the added forces is the neglection of other unsteady forces that contributes to the total produced forces by the fluid due to viscous effects. The basic definition of the added mass is the force required to accelerate the body in a fluid. In viscous quiescent flow, the acceleration of the body may create flow patterns in the vicin- ity of the body that affect the pressure distribution and consequently contribute to additional unsteady forces associated with the motion.
III. EXPERIMENTAL TESTINGExperiments were conducted at Virginia Tech in
Aerospace and Ocean Engi- neering department. The test rig described Previously by Zakaria et al. (2015a,b,c) was used in these experiments. The wing section profile is NACA-0012 and has a chord length of 0.14 m and span of 0.63 m and is shown in Figure 10 (a). Figure 3(b) shows a schematic of the imposed motion during the tests. End plates were attached to the wing tip to reduce the three
Engineering of Science and Military TechnologiesVolume (7) - Issue (2) - 2017
61
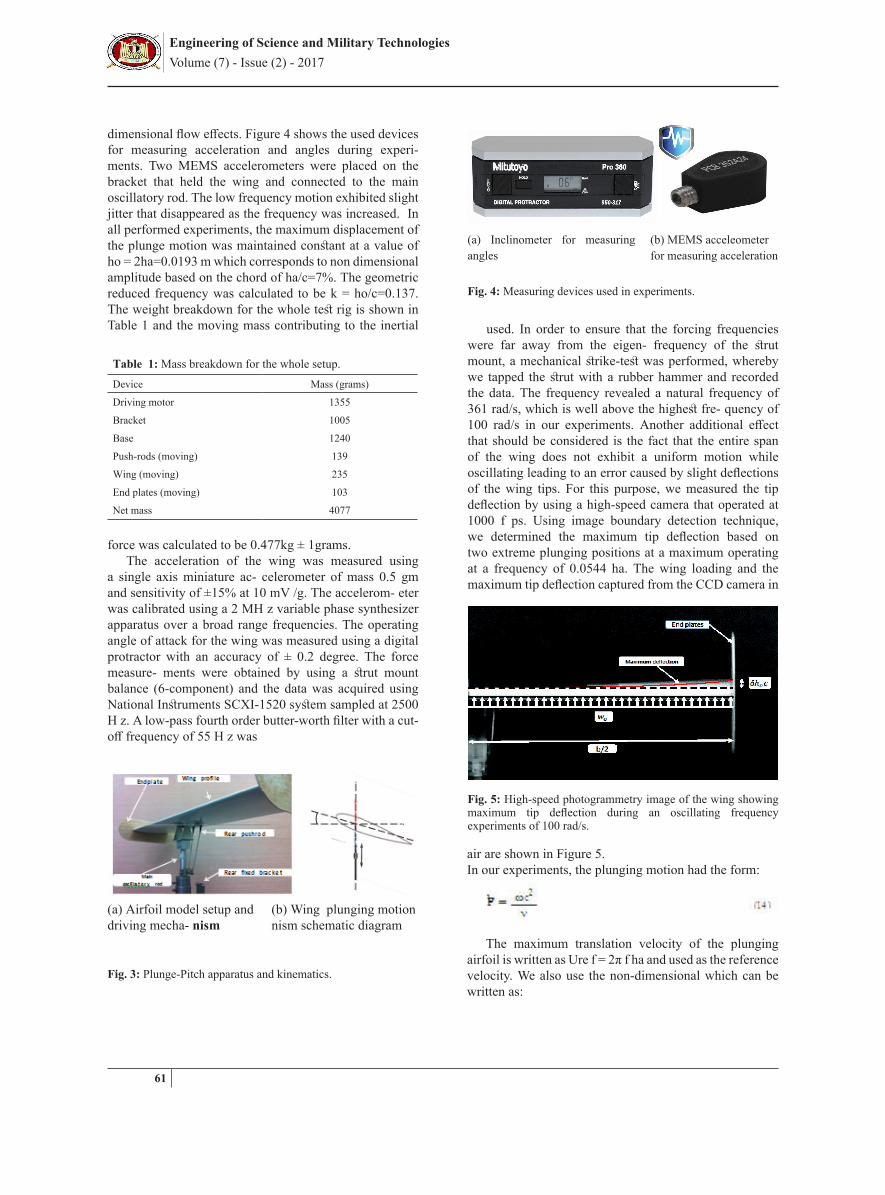
dimensional flow effects. Figure 4 shows the used devices for measuring acceleration and angles during experi- ments. Two MEMS accelerometers were placed on the bracket that held the wing and connected to the main oscillatory rod. The low frequency motion exhibited slight jitter that disappeared as the frequency was increased. In all performed experiments, the maximum displacement of the plunge motion was maintained constant at a value of ho = 2ha=0.0193 m which corresponds to non dimensional amplitude based on the chord of ha/c=7%. The geometric reduced frequency was calculated to be k = ho/c=0.137. The weight breakdown for the whole test rig is shown in Table 1 and the moving mass contributing to the inertial
Table 1: Mass breakdown for the whole setup.
Device Mass (grams)
Driving motor 1355
Bracket 1005
Base 1240
Push-rods (moving) 139
Wing (moving) 235
End plates (moving) 103
Net mass 4077
force was calculated to be 0.477kg ± 1grams.The acceleration of the wing was measured using
a single axis miniature ac- celerometer of mass 0.5 gm and sensitivity of ±15% at 10 mV /g. The accelerom- eter was calibrated using a 2 MH z variable phase synthesizer apparatus over a broad range frequencies. The operating angle of attack for the wing was measured using a digital protractor with an accuracy of ± 0.2 degree. The force measure- ments were obtained by using a strut mount balance (6-component) and the data was acquired using National Instruments SCXI-1520 system sampled at 2500 H z. A low-pass fourth order butter-worth filter with a cut-off frequency of 55 H z was
(a) Airfoil model setup and driving mecha- nism
(b) Wing plunging motion nism schematic diagram
Fig. 3: Plunge-Pitch apparatus and kinematics.
(a) Inclinometer for measuring angles
(b) MEMS acceleometer for measuring acceleration
Fig. 4: Measuring devices used in experiments.
used. In order to ensure that the forcing frequencies were far away from the eigen- frequency of the strut mount, a mechanical strike-test was performed, whereby we tapped the strut with a rubber hammer and recorded the data. The frequency revealed a natural frequency of 361 rad/s, which is well above the highest fre- quency of 100 rad/s in our experiments. Another additional effect that should be considered is the fact that the entire span of the wing does not exhibit a uniform motion while oscillating leading to an error caused by slight deflections of the wing tips. For this purpose, we measured the tip deflection by using a high-speed camera that operated at 1000 f ps. Using image boundary detection technique, we determined the maximum tip deflection based on two extreme plunging positions at a maximum operating at a frequency of 0.0544 ha. The wing loading and the maximum tip deflection captured from the CCD camera in
Fig. 5: High-speed photogrammetry image of the wing showing maximum tip deflection during an oscillating frequency experiments of 100 rad/s.
air are shown in Figure 5.In our experiments, the plunging motion had the form:
The maximum translation velocity of the plunging airfoil is written as Ure f = 2π f ha and used as the reference velocity. We also use the non-dimensional which can be written as:
Mohamed Y. Zakaria et al
62
Where ω is the oscillation frequency, c is the chord length and µ is the kinematic viscosity. Based on eq. 13, the plunging velocity and acceleration are respectively given by:
The theoretical plunging force obtained by accounting for both inertia and added mass of the wing is then given by:
Assuming that the measured forces is a function of the frequency and amplitude of the oscillations and the angle of attack, we write the more general expression
the last term in eq. 18 accounts for the unsteady added forces that will be obtained from the measured values. We defined the added force as:
|Fadded | = |N pmeasured | − mmoving ω 2ha (19)
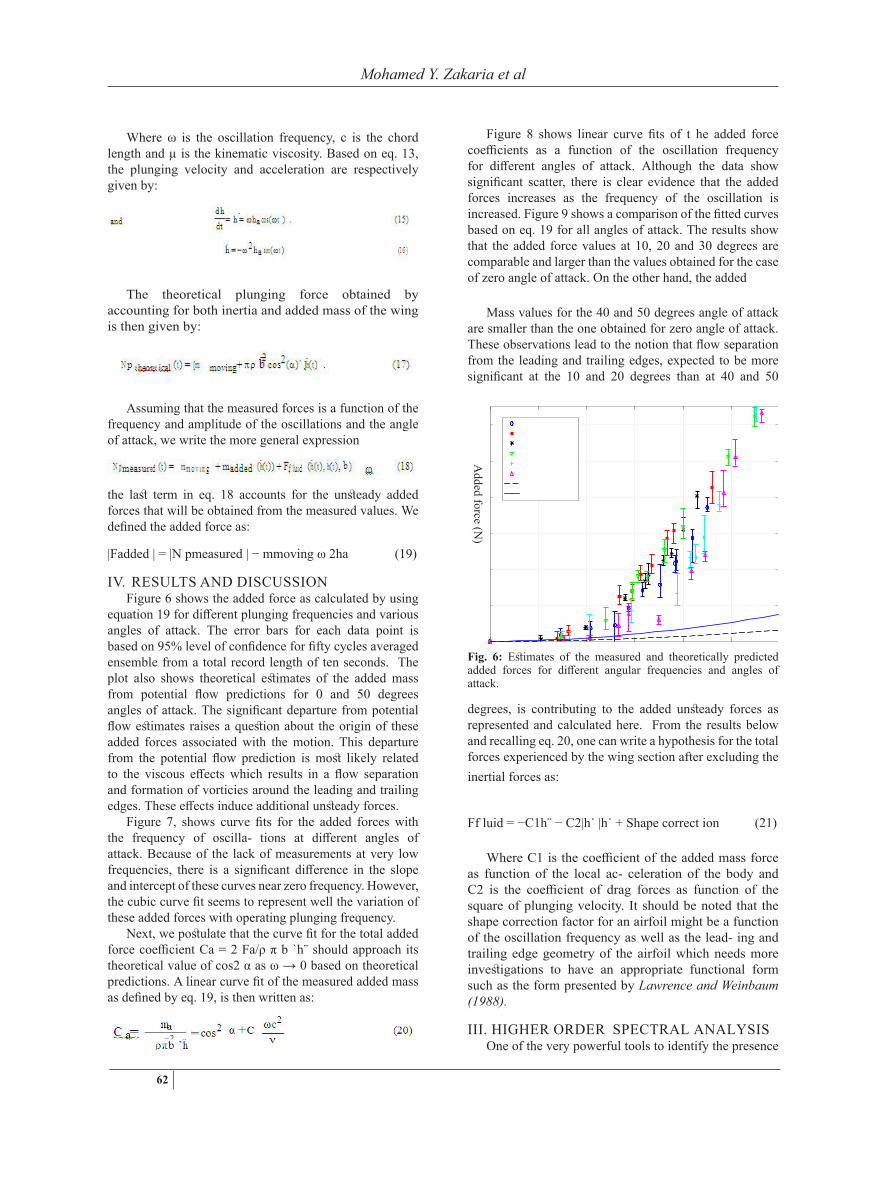
IV. RESULTS AND DISCUSSIONFigure 6 shows the added force as calculated by using
equation 19 for different plunging frequencies and various angles of attack. The error bars for each data point is based on 95% level of confidence for fifty cycles averaged ensemble from a total record length of ten seconds. The plot also shows theoretical estimates of the added mass from potential flow predictions for 0 and 50 degrees angles of attack. The significant departure from potential flow estimates raises a question about the origin of these added forces associated with the motion. This departure from the potential flow prediction is most likely related to the viscous effects which results in a flow separation and formation of vorticies around the leading and trailing edges. These effects induce additional unsteady forces.
Figure 7, shows curve fits for the added forces with the frequency of oscilla- tions at different angles of attack. Because of the lack of measurements at very low frequencies, there is a significant difference in the slope and intercept of these curves near zero frequency. However, the cubic curve fit seems to represent well the variation of these added forces with operating plunging frequency.
Next, we postulate that the curve fit for the total added force coefficient Ca = 2 Fa/ρ π b `h¨ should approach its theoretical value of cos2 α as ω → 0 based on theoretical predictions. A linear curve fit of the measured added mass as defined by eq. 19, is then written as:
Figure 8 shows linear curve fits of t he added force coefficients as a function of the oscillation frequency for different angles of attack. Although the data show significant scatter, there is clear evidence that the added forces increases as the frequency of the oscillation is increased. Figure 9 shows a comparison of the fitted curves based on eq. 19 for all angles of attack. The results show that the added force values at 10, 20 and 30 degrees are comparable and larger than the values obtained for the case of zero angle of attack. On the other hand, the added
Mass values for the 40 and 50 degrees angle of attack are smaller than the one obtained for zero angle of attack. These observations lead to the notion that flow separation from the leading and trailing edges, expected to be more significant at the 10 and 20 degrees than at 40 and 50
Fig. 6: Estimates of the measured and theoretically predicted added forces for different angular frequencies and angles of attack.
degrees, is contributing to the added unsteady forces as represented and calculated here. From the results below and recalling eq. 20, one can write a hypothesis for the total forces experienced by the wing section after excluding the inertial forces as:
Ff luid = −C1h¨ − C2|h˙ |h˙ + Shape correct ion (21)
Where C1 is the coefficient of the added mass force as function of the local ac- celeration of the body and C2 is the coefficient of drag forces as function of the square of plunging velocity. It should be noted that the shape correction factor for an airfoil might be a function of the oscillation frequency as well as the lead- ing and trailing edge geometry of the airfoil which needs more investigations to have an appropriate functional form such as the form presented by Lawrence and Weinbaum (1988).
III. HIGHER ORDER SPECTRAL ANALYSISOne of the very powerful tools to identify the presence
Added force (N
)

Engineering of Science and Military TechnologiesVolume (7) - Issue (2) - 2017
63
Fig. 7: Apparent mass force at different operating angular frequencies and angles of attack
of nonlinearities in the system is the higher-order spectral analysis (HOS) [Nayfeh and Balachandran (1995)]. HOS are based on the Fourier transforms of higher-order moment func- tions, which can be used to obtain more information about the harmonics gener-ated by nonlinear couplings [Hajj et al. (1997)]. The power spectrum is obtained from the Fourier transform of the second-order correlation. The Fourier transform of a time series x(t) is given by:
Fig. 8: Measured apparent mass coefficient at different operating frequencies and angles of attack.
Where f denotes the frequency and X ( f ) is a complex quantity. The power spectrum (Sxx) is the Fourier transform of the second-order correlation given by:

Mohamed Y. Zakaria et al
64
Fig 9: Plunging force with frequency at different operating angular frequencies and angles of attack
Where f denotes the frequency and X ( f ) is a complex quantity.
The power spectrum (Sxx) is the Fourier transform of the second-order correlation given by:
Where X ( f ) is the Fourier transform, the superscript (*) denotes complex conju- gate and E is the expected value, which is calculated by the arithmetic average estimator for M sets of data records [Kim and Powers (1979)]. The information embedded in a power spectrum represents the distribution of energy at different frequencies, which fully characterizes a linear system in the frequency domain. The normalized value of the cross-power spectrum captures the phase relation at the same frequency between two different signals. However, for a nonlinear system, higher-order spectrum analysis is needed because the power spectrum cannot portray the energy relation between the various frequency components which is a typical feature of nonlinear systems.
In nonlinear systems, the frequencies can combine with themselves to create new components at their sum or difference frequency. When the frequencies are interacting, the phase of the new component is related to the phases of the primary interacting modes, therefore by inspecting the phase relation it is possible to iden- tify any nonlinear coupling [Hajj and Beran (2008)]. The detection of quadratic nonlinear couplings among frequency modes relies on the fact that the interaction of two frequency
Fig. 10: Vector representation of N estimates of bispectrum, where
components ( f1 and f2) and their sum components ( f1 + f2) leads to significant values of bispectrum. If the system has a quadratic nonlinearity, the complex bispectrum results exhibits a phase relation as showed in Figure 10.
The auto-bispectrum is obtained from the Fourier transform of third-order cor- relation and can be estimated as:
The auto-bispectrum is usually normalized with respect to the amplitudes of the individual spectral components to yield the auto-bicoherence.Based on the Schwartz inequality, the auto-bicoherence defined as:
Is bounded by 0 and one (i.e. 0 < b2 ( f1, f j ) < 1). If b2 ( f1, f j ) = 1, then the pair of frequency components at f1 and f j , as well as their sum f1 + f j , are quadratically coupled. If b2 ( f1, f j ) = 0, frequency components are not coupled, and partially coupled if 0 < b2 ( f1, f j ) < 1. To understand the HOS results, one should analyze the bicoherence in a two-dimensional plot of the cut-off planes, which have a range between 0 and 1. Figure 11(a) shows the bicoherence plot. The frequencies f1 and f2 can be related in four ways: (i) f1 + f2, (ii) f1 − f2, (iii) − f1 + f2 and (iv) − f1 − f2, which are presented in the four quadrants. Thoseregions can be divided into eight parts using two dashed lines ( f1 + f2 = 0 and

Engineering of Science and Military TechnologiesVolume (7) - Issue (2) - 2017
65
Fig. 11: (a) Bicoherence computation and its symmetry properties. (b) Countour plot to identify the nonlinear quadratic couplings.
Fig. 12: 3D Power spectral density for the plunging force and the operating acceleration.
We note the appearance of super harmonics in all cases for different angles of attack with small amplitudes, which indicates the presence of nonlinearities in the system.
5.1. Auto Bicoherence analysisFigures 13 shows the auto-bicoherence for the case of the airfoil set at 20 degrees AoA and plunging frequency of 13.75 H z.

Mohamed Y. Zakaria et al
66
Fig. 13: Auto-bicoherence of the force at 13.75 H z and 20 degrees angle of attack.
Fig. 14: Auto bicoherence analysis for the plunging force and operating acceleration at various angles of attack.

Engineering of Science and Military TechnologiesVolume (7) - Issue (2) - 2017
67
The plot shows peaks are centered at ( f0, f0) and at ( f0, 2 f0), which indicates that the force contains components at twice, trice and four times the forcing fre- quency. This indicates that the force is proportional to terms other than the accel- erations.
Figure 14 shows the auto bi-coherence plots for two different forcing frequen- cies, 8.75 H z and 13.75 H z and various preset angles of attack. The results show that the acceleration signal does not exhibit any nonlinear coupling, which indi- cates that it consists of a single frequency. On the other hand, the auto-bicoherence plots of the measured forces exhibit coupling between the forced frequency and its harmonic. The highest levels of these couplings is over the range between 10o and 30o. This should be considered in concert with the results presented above that showed larger forces at these angles of attack. That is the contributions of the unsteady forces is the highest over this range of angles of attack.
5.2. Cross bicoherence analysisThe results shown in this subsection are for specific
cases and aim to show the nonlinear dependence on the added force and the acceleration. Figures 15, 17 and 19 show the power spectral density and linear coherence for
Fig. 15: PSD for added forces and plunging acceleration and their linear bicoherence at 0◦
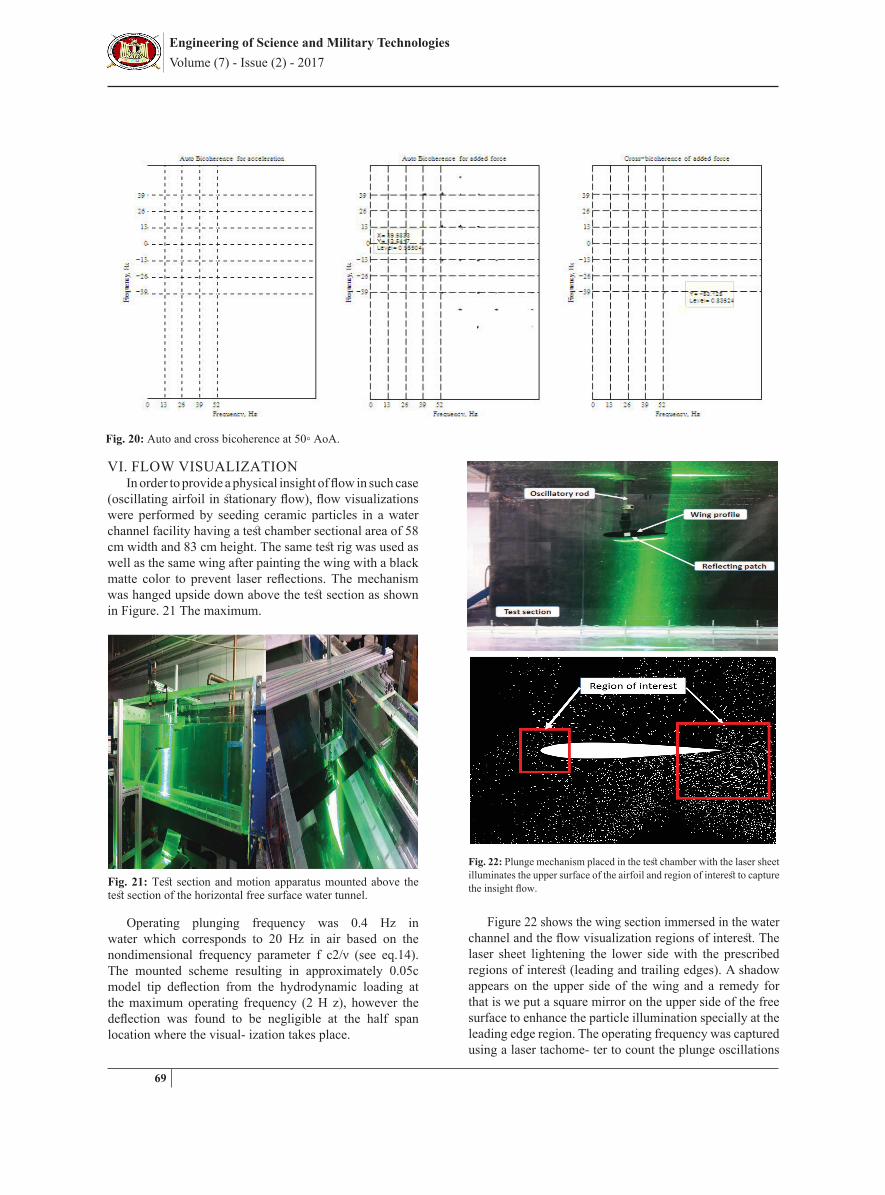
Fig. 16: Auto and cross bicoherence at 0◦ AoA
the added force and acceleration at 0◦, 20◦ and 50◦ angles of attack. These results are followed by re- sults for the same angles at the same selected frequency representing the auto and cross bicoherence shown in Figures. 16, 18 and 20. In Figure 15, the results show a linear coherence of 0.74 for the added force with the plunging acceleration atthe operating frequency for zero angle of attack. However, at 20◦ the linear coher- ence is increased to 0.87 and increased again to reach 0.95 for 50◦ AoA. Figure 16 shows the cross bispectral analysis for 0o angle of attack at an operating frequency of 13.5 H z and a cutoff ratio is 0.93. It is clear that only the auto bispectral anal- ysis for the added force shows coupling with the subharmonics of the signal and concentrating around an operating frequency of 13.5 H z. At higher angle of attack (20o), as shown in Figure 18, we observe two high contours. The first is at 27.08 H z and 13.5 H z, and the second is 41.66 H z and 28.1 H z, respectively. These high contours show the nonlinear quadratic coupling between the added force and the acceleration that results from the interaction between the sub-harmonics ( fo,2 fo) and (3 fo, 2 fo). The results in Figure 20 show weak coupling between the added force and the acceleration at (5 fo, 4 fo).

Mohamed Y. Zakaria et al
68
Fig 17: PSD for added forces and plunging acceleration and their linear bicoherence at 20◦ AoA.
Fig. 18: Auto and cross bicoherence at 20◦ AoA.
Fig. 19: PSD for added forces and plunging acceleration and their linear bicoherence at 50◦bAoA.
Engineering of Science and Military TechnologiesVolume (7) - Issue (2) - 2017
69
Fig. 20: Auto and cross bicoherence at 50◦ AoA.
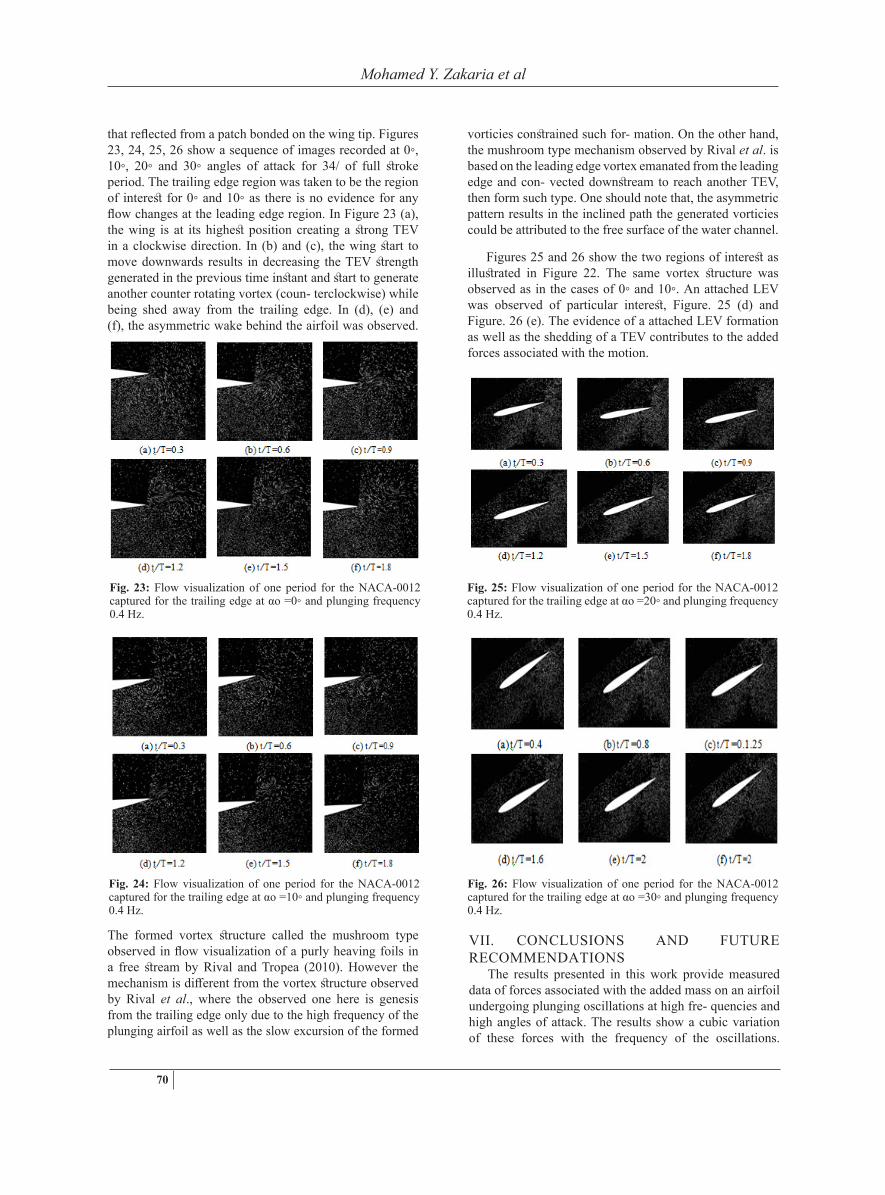
VI. FLOW VISUALIZATIONIn order to provide a physical insight of flow in such case
(oscillating airfoil in stationary flow), flow visualizations were performed by seeding ceramic particles in a water channel facility having a test chamber sectional area of 58 cm width and 83 cm height. The same test rig was used as well as the same wing after painting the wing with a black matte color to prevent laser reflections. The mechanism was hanged upside down above the test section as shown in Figure. 21 The maximum.
Fig. 21: Test section and motion apparatus mounted above the test section of the horizontal free surface water tunnel.
Operating plunging frequency was 0.4 Hz in water which corresponds to 20 Hz in air based on the nondimensional frequency parameter f c2/ν (see eq.14). The mounted scheme resulting in approximately 0.05c model tip deflection from the hydrodynamic loading at the maximum operating frequency (2 H z), however the deflection was found to be negligible at the half span location where the visual- ization takes place.
Figure 22 shows the wing section immersed in the water channel and the flow visualization regions of interest. The laser sheet lightening the lower side with the prescribed regions of interest (leading and trailing edges). A shadow appears on the upper side of the wing and a remedy for that is we put a square mirror on the upper side of the free surface to enhance the particle illumination specially at the leading edge region. The operating frequency was captured using a laser tachome- ter to count the plunge oscillations
Fig. 22: Plunge mechanism placed in the test chamber with the laser sheet illuminates the upper surface of the airfoil and region of interest to capture the insight flow.
Mohamed Y. Zakaria et al
70
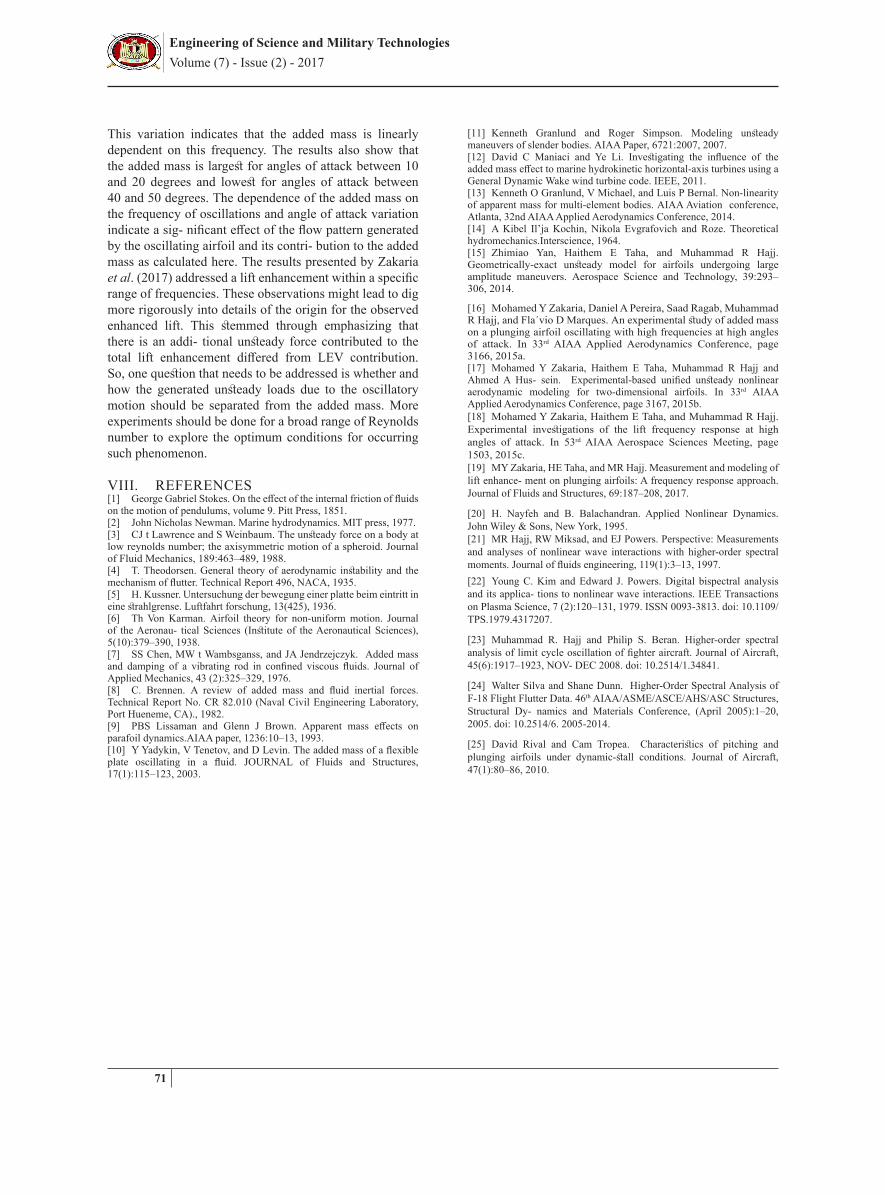
that reflected from a patch bonded on the wing tip. Figures 23, 24, 25, 26 show a sequence of images recorded at 0◦, 10◦, 20◦ and 30◦ angles of attack for 34/ of full stroke period. The trailing edge region was taken to be the region of interest for 0◦ and 10◦ as there is no evidence for any flow changes at the leading edge region. In Figure 23 (a), the wing is at its highest position creating a strong TEV in a clockwise direction. In (b) and (c), the wing start to move downwards results in decreasing the TEV strength generated in the previous time instant and start to generate another counter rotating vortex (coun- terclockwise) while being shed away from the trailing edge. In (d), (e) and (f), the asymmetric wake behind the airfoil was observed.
Fig. 23: Flow visualization of one period for the NACA-0012 captured for the trailing edge at αo =0◦ and plunging frequency 0.4 Hz.
Fig. 24: Flow visualization of one period for the NACA-0012 captured for the trailing edge at αo =10◦ and plunging frequency 0.4 Hz.
The formed vortex structure called the mushroom type observed in flow visualization of a purly heaving foils in a free stream by Rival and Tropea (2010). However the mechanism is different from the vortex structure observed by Rival et al., where the observed one here is genesis from the trailing edge only due to the high frequency of the plunging airfoil as well as the slow excursion of the formed
Fig. 25: Flow visualization of one period for the NACA-0012 captured for the trailing edge at αo =20◦ and plunging frequency 0.4 Hz.
Fig. 26: Flow visualization of one period for the NACA-0012 captured for the trailing edge at αo =30◦ and plunging frequency 0.4 Hz.
VII. CONCLUSIONS AND FUTURE RECOMMENDATIONS
The results presented in this work provide measured data of forces associated with the added mass on an airfoil undergoing plunging oscillations at high fre- quencies and high angles of attack. The results show a cubic variation of these forces with the frequency of the oscillations.
vorticies constrained such for- mation. On the other hand, the mushroom type mechanism observed by Rival et al. is based on the leading edge vortex emanated from the leading edge and con- vected downstream to reach another TEV, then form such type. One should note that, the asymmetric pattern results in the inclined path the generated vorticies could be attributed to the free surface of the water channel.
Figures 25 and 26 show the two regions of interest as illustrated in Figure 22. The same vortex structure was observed as in the cases of 0◦ and 10◦. An attached LEV was observed of particular interest, Figure. 25 (d) and Figure. 26 (e). The evidence of a attached LEV formation as well as the shedding of a TEV contributes to the added forces associated with the motion.
Engineering of Science and Military TechnologiesVolume (7) - Issue (2) - 2017
71
This variation indicates that the added mass is linearly dependent on this frequency. The results also show that the added mass is largest for angles of attack between 10 and 20 degrees and lowest for angles of attack between 40 and 50 degrees. The dependence of the added mass on the frequency of oscillations and angle of attack variation indicate a sig- nificant effect of the flow pattern generated by the oscillating airfoil and its contri- bution to the added mass as calculated here. The results presented by Zakaria et al. (2017) addressed a lift enhancement within a specific range of frequencies. These observations might lead to dig more rigorously into details of the origin for the observed enhanced lift. This stemmed through emphasizing that there is an addi- tional unsteady force contributed to the total lift enhancement differed from LEV contribution. So, one question that needs to be addressed is whether and how the generated unsteady loads due to the oscillatory motion should be separated from the added mass. More experiments should be done for a broad range of Reynolds number to explore the optimum conditions for occurring such phenomenon.
VIII. REFERENCES[1] George Gabriel Stokes. On the effect of the internal friction of fluids on the motion of pendulums, volume 9. Pitt Press, 1851.[2] John Nicholas Newman. Marine hydrodynamics. MIT press, 1977.[3] CJ t Lawrence and S Weinbaum. The unsteady force on a body at low reynolds number; the axisymmetric motion of a spheroid. Journal of Fluid Mechanics, 189:463–489, 1988.[4] T. Theodorsen. General theory of aerodynamic instability and the mechanism of flutter. Technical Report 496, NACA, 1935.[5] H. Kussner. Untersuchung der bewegung einer platte beim eintritt in eine strahlgrense. Luftfahrt forschung, 13(425), 1936.[6] Th Von Karman. Airfoil theory for non-uniform motion. Journal of the Aeronau- tical Sciences (Institute of the Aeronautical Sciences), 5(10):379–390, 1938.[7] SS Chen, MW t Wambsganss, and JA Jendrzejczyk. Added mass and damping of a vibrating rod in confined viscous fluids. Journal of Applied Mechanics, 43 (2):325–329, 1976.[8] C. Brennen. A review of added mass and fluid inertial forces. Technical Report No. CR 82.010 (Naval Civil Engineering Laboratory, Port Hueneme, CA)., 1982.[9] PBS Lissaman and Glenn J Brown. Apparent mass effects on parafoil dynamics.AIAA paper, 1236:10–13, 1993.[10] Y Yadykin, V Tenetov, and D Levin. The added mass of a flexible plate oscillating in a fluid. JOURNAL of Fluids and Structures, 17(1):115–123, 2003.
[11] Kenneth Granlund and Roger Simpson. Modeling unsteady maneuvers of slender bodies. AIAA Paper, 6721:2007, 2007.[12] David C Maniaci and Ye Li. Investigating the influence of the added mass effect to marine hydrokinetic horizontal-axis turbines using a General Dynamic Wake wind turbine code. IEEE, 2011.[13] Kenneth O Granlund, V Michael, and Luis P Bernal. Non-linearity of apparent mass for multi-element bodies. AIAA Aviation conference, Atlanta, 32nd AIAA Applied Aerodynamics Conference, 2014.[14] A Kibel Il’ja Kochin, Nikola Evgrafovich and Roze. Theoretical hydromechanics.Interscience, 1964.[15] Zhimiao Yan, Haithem E Taha, and Muhammad R Hajj. Geometrically-exact unsteady model for airfoils undergoing large amplitude maneuvers. Aerospace Science and Technology, 39:293–306, 2014.
[16] Mohamed Y Zakaria, Daniel A Pereira, Saad Ragab, Muhammad R Hajj, and Fla´vio D Marques. An experimental study of added mass on a plunging airfoil oscillating with high frequencies at high angles of attack. In 33rd AIAA Applied Aerodynamics Conference, page 3166, 2015a.[17] Mohamed Y Zakaria, Haithem E Taha, Muhammad R Hajj and Ahmed A Hus- sein. Experimental-based unified unsteady nonlinear aerodynamic modeling for two-dimensional airfoils. In 33rd AIAA Applied Aerodynamics Conference, page 3167, 2015b.[18] Mohamed Y Zakaria, Haithem E Taha, and Muhammad R Hajj. Experimental investigations of the lift frequency response at high angles of attack. In 53rd AIAA Aerospace Sciences Meeting, page 1503, 2015c.[19] MY Zakaria, HE Taha, and MR Hajj. Measurement and modeling of lift enhance- ment on plunging airfoils: A frequency response approach. Journal of Fluids and Structures, 69:187–208, 2017.
[20] H. Nayfeh and B. Balachandran. Applied Nonlinear Dynamics. John Wiley & Sons, New York, 1995.[21] MR Hajj, RW Miksad, and EJ Powers. Perspective: Measurements and analyses of nonlinear wave interactions with higher-order spectral moments. Journal of fluids engineering, 119(1):3–13, 1997.[22] Young C. Kim and Edward J. Powers. Digital bispectral analysis and its applica- tions to nonlinear wave interactions. IEEE Transactions on Plasma Science, 7 (2):120–131, 1979. ISSN 0093-3813. doi: 10.1109/TPS.1979.4317207.
[23] Muhammad R. Hajj and Philip S. Beran. Higher-order spectral analysis of limit cycle oscillation of fighter aircraft. Journal of Aircraft, 45(6):1917–1923, NOV- DEC 2008. doi: 10.2514/1.34841.
[24] Walter Silva and Shane Dunn. Higher-Order Spectral Analysis of F-18 Flight Flutter Data. 46th AIAA/ASME/ASCE/AHS/ASC Structures, Structural Dy- namics and Materials Conference, (April 2005):1–20, 2005. doi: 10.2514/6. 2005-2014.
[25] David Rival and Cam Tropea. Characteristics of pitching and plunging airfoils under dynamic-stall conditions. Journal of Aircraft, 47(1):80–86, 2010.
Top Related