


γλώσσες
Σελίδες
Νομικός

EPJ manuscript No.(will be inserted by the editor)
A precise measurement of the direct CP violationparameter Re(ε′/ε)
NA48 Collaboration
A. Lai, D. MarrasDipartimento di Fisica dell’Universita e Sezione dell’INFN di Cagliari, I-09100 Cagliari, Italy.
A. Bevana, R.S. Dosanjh, T.J. Gershonb, B. Hayc, G.E. Kalmus, C. Lazzeroni, D.J. Munday, M.D. Needhamd, E. Olaiya,M.A. Parker, T.O. White, S.A. Wotton
Cavendish Laboratory, University of Cambridge, Cambridge, CB3 0HE, U.K.e.
G. Barr, G. Bocquet, A. Ceccucci, T. Cuhadar, D. Cundy, G. D’Agostini, N. Doble, V. Falaleev, W. Funk, L. Gatignon,A. Gonidec, B. Gorini, G. Govi, P. Grafstrom, W. Kubischta, A. Lacourt, M. Lentif , S. Luitzg, J.P. Matheys, I. Mikulech,
A. Norton, S. Palestini, B. Panzer-Steindel, D. Schinzel, G. Tatishvilii, H. Taureg, M. Velasco, O. Vossnack, H. WahlCERN, CH-1211 Geneve 23, Switzerland.
C. Cheshkov, A. Gaponenkoj, P. Hristov, V. Kekelidze, D. Madigojine, N. Molokanova, Yu. Potrebenikov, A. Tkatchev,A. Zinchenko
Joint Institute for Nuclear Research, Dubna, Russian Federation.
I. Knowles, V. Martin, H. Parsons, R. Sacco, A. WalkerDepartment of Physics and Astronomy, University of Edinburgh, Edinburgh, EH9 3JZ, U.K.e.
M. Contalbrigo, P. Dalpiaz, J. Duclos, P.L. Frabettik, A. Gianoli, M. Martini, F. Petrucci, M. Savrie, M. ScarpaDipartimento di Fisica dell’Universita e Sezione dell’INFN di Ferrara, I-44100 Ferrara, Italy.
A. Bizzetil, M. Calvetti, G. Collazuol, G. Graziani, E. Iacopini, F. Martellim, M. Veltrim
Dipartimento di Fisica dell’Universita e Sezione dell’INFN di Firenze, I-50125 Firenze, Italy.
H.G. Becker, H. Blumer, D. Coward, M. Eppard, H. Fox, A. Hirstius, K. Holtz, A. Kalter, K. Kleinknecht, U. Koch, L. Kopke,P. Lopes da Silva, P. Marouelli, I. Pellmann, A. Peters, S.A. Schmidt, V. Schonharting, Y. Schue, R. Wanke, A. Winhart,
M. WittgenInstitut fur Physik, Universitat Mainz, D-55099 Mainz, Germanyn.
J.C. Chollet, S. Crepe, L. Fayard, L. Iconomidou-Fayard, J. Ocariz, G. Unal, I. Wingerter-SeezLaboratoire de l’Accelerateur Lineaire, IN2P3-CNRS,Universite de Paris-Sud, 91898 Orsay, Franceo.
G. Anzivino, P. Cenci, E. Imbergamo, P. Lubrano, A. Mestvirishvili, A. Nappi, M. Pepe, M. PicciniDipartimento di Fisica dell’Universita e Sezione dell’INFN di Perugia, I-06100 Perugia, Italy.
L. Bertanza, P. Calafiura, R. Carosi, R. Casali, C. Cerri, M. Cirillip, F. Costantini, R. Fantechi, S. Giudici, I. Mannelli,V. Marzulli, G. Pierazzini, M. Sozzi
Dipartimento di Fisica, Scuola Normale Superiore e SezioneINFN di Pisa, I-56100 Pisa, Italy.
J.B. Cheze, J. Cogan, M. De Beer, P. Debu, F. Derue, A. Formica, R. Granier de Cassagnac, E. Mazzucato, B. Peyaud,R. Turlay, B. Vallage
DSM/DAPNIA - CEA Saclay, F-91191 Gif-sur-Yvette, France.
I. Augustin, M. Bender, M. Holder, A. Maier, M. ZiolkowskiFachbereich Physik, Universitat Siegen, D-57068 Siegen, Germanyq.
R. Arcidiacono, C. Biino, N. Cartiglia, R. Guida, F. Marchetto, E. Menichetti, N. PastroneDipartimento di Fisica Sperimentale dell’Universita e Sezione dell’INFN di Torino, I-10125 Torino, Italy.
J. Nassalski, E. Rondio, M. Szleper, W. Wislicki, S. WronkaSoltan Institute for Nuclear Studies, Laboratory for High Energy Physics, PL-00-681 Warsaw, Polandr.
H. Dibon, G. Fischer, M. Jeitler, M. Markytan, G. Neuhofer, M. Pernicka, A. Taurok, L. WidhalmOsterreichische Akademie der Wissenschaften, Institut fur Hochenergiephysik, A-1050 Wien, Austrias.
Received: date / Revised version: date
Abstract. The direct CP violation parameter Re(ε′/ε) has been measured from the decay rates of neutralkaons into two pions using the NA48 detector at the CERN SPS. With 3.3 million KL → π0π0 eventscollected during the 1998 and 1999 running periods, a result of Re(ε′/ε) = (15.0 ± 2.7)×10−4 has beenobtained. The result combined with the published 1997 sample is Re(ε′/ε) = (15.3 ± 2.6)×10−4.
PACS. PACS-key describing text of that key – PACS-key describing text of that key
2 NA48 Collaboration: A precise measurement of the direct CP violation parameter Re(ε′/ε)
1 Introduction
The violation of CP symmetry was first reported in 1964by J.H. Christenson, J.W. Cronin, V. Fitch and R. Turlay,who detected a clean signal of KL → π+π− decays [1]. CPconservation implies that the KS and KL particles arepure CP eigenstates and that KL decays only into CP=−1and KS into CP=+1 final states. The observed signal ofthe forbidden KL → 2π decays (CP=+1) indicates thatCP is not a conserved symmetry.
CP violation can occur via the mixing of CP eigen-states, called indirect CP violation, represented by theparameter ε. CP violation can also occur in the decayprocess itself, through the interference of final states withdifferent isospins. This is represented by the parameter ε′
and is called direct CP violation. L. Wolfenstein in 1964 [2]proposed a super-weak force responsible for ∆S=2 transi-
a Present address: Oliver Lodge Laboratory, University ofLiverpool, Liverpool L69 7ZE, U.K.
b Present address: High Energy Accelerator Research Orga-nization (KEK), Tsukuba, Ibaraki, 305-0801, Japan.
c Present address: EP Division, CERN, 1211 Geneve 23,Switzerland.
d Present address: NIKHEF, PO Box 41882, 1009 DB Ams-terdam, The Netherlands.
e Funded by the U.K. Particle Physics and Astronomy Re-search Council.
f On leave from Sezione dell’INFN di Firenze, I-50125Firenze, Italy.
g Present address: SLAC, Stanford, CA., 94309, USA.h On leave from Osterreichische Akademie der Wis-
senschaften, Institut fur Hochenergiephysik, A-1050 Wien,Austria.
i On leave from Joint Institute for Nuclear Research, Dubna,141980, Russian Federation.
j Present address: University of Alberta, Edmonton AlbertaT6G 2J1, Canada.
k Dipartimento di Fisica e INFN Bologna, viale Berti-Pichat6/2, I-40127 Bologna, Italy.
l Dipartimento di Fisica dell’Universita’ di Modena e ReggioEmilia, via G. Campi 213/A I-41100, Modena, Italy.m Instituto di Fisica Universita di Urbinon Funded by the German Federal Minister for Research and
Technology (BMBF) under contract 7MZ18P(4)-TP2.o Funded by Institut National de Physique des Particules et
de Physique Nucleaire (IN2P3), Francep Present address: Dipartimento di Fisica dell’Universita di
Roma “La Sapienza” e Sezione INFN di Roma, I-00185 Roma,Italy.
q Funded by the German Federal Minister for Research andTechnology (BMBF) under contract 056SI74.
r Supported by the Committee for Scientific Re-search grants 5P03B10120, 2P03B11719 and SPUB-M/CERN/P03/DZ210/2000 and using computing resourcesof the Interdisciplinary Center for Mathematical and Compu-tational Modelling of the University of Warsaw.
s Funded by the Austrian Ministry of Education, Science andCulture under contract GZ 616.360/2-IV GZ 616.363/2-VIII,and by the Fund for Promotion of Scientific Research in Austria(FWF) under contract P08929-PHY.
tions, so that all observed CP violation phenomena comefrom mixing and ε′=0. In 1973, Kobayashi and Maskawaproposed a matrix representation of the coupling betweenfermion families [3]. In the case of three fermion genera-tions, both direct and indirect CP violation are naturallyaccommodated in their model, via an irreducible phase.
The parameters ε and ε′ are related to the amplituderatios
η+− =A(KL → π+π−)
A(KS → π+π−)= ε + ε′
and
η00 =A(KL → π0π0)
A(KS → π0π0)= ε − 2ε′
which represent the strength of the CP violating amplitudewith respect to the CP conserving one, in each mode. Ex-perimentally, it is convenient to measure the double ratioR which is related to the ratio ε′/ε:
R =Γ(KL → π0π0)
Γ(KS → π0π0)/Γ(KL → π+π−)
Γ(KS → π+π−)≈ 1 − 6 × Re(ε′/ε)
(1)By the mid-1970s, experiments had demonstrated thatCP violation in the neutral kaon system is dominated bymixing, with the limit Re(ε′/ε) ≤ 10−2[4]. On the otherhand, theoretical work showed that direct CP violationin the Standard Model could be large enough to be mea-surable [5]. This stimulated experimental effort with so-phisticated detectors to measure Re(ε′/ε). The first evi-dence for the existence of a direct component of CP viola-tion was published in 1988 [6]. In 1993, two experimentspublished their final results without a conclusive answeron the existence of this component. NA31 [7] measuredRe(ε′/ε) = (23.0 ± 6.5)×10−4, indicating a 3.5σ effect.The result of E731 [8], Re(ε′/ε) = (7.4 ± 5.9)×10−4, wascompatible with no effect. Recently, a new more precisegeneration of experiments announced results from samplesof their total statistics. The KTeV collaboration measuredan effect of Re(ε′/ε) = (28.0 ± 4.1)×10−4 [9] and NA48published a first result of Re(ε′/ε)=(18.5±7.3)×10−4 [10].These observations confirmed the existence of a direct CPviolation component. Current theoretical predictions arein the range up to ∼30×10−4 [11].
This paper reports a measurement of Re(ε′/ε) withincreased precision, performed by the NA48 experiment,using data samples recorded in 1998 and 1999. The cor-responding statistics is seven times larger than that usedfor the published 1997 result [10].
2 The method
Measuring Re(ε′/ε) to a precision of ∼10−4 requires se-veral million KL and KS → ππ decays. A sufficiently lar-ge flux of kaons is produced by the high intensity protonbeam from the SPS accelerator. Data are accumulatedusing a fast and efficient data acquisition system, including
NA48 Collaboration: A precise measurement of the direct CP violation parameter Re(ε′/ε) 3
a trigger with high rejection power and a large capacitydata storage system.
The design of the experiment and the analysis methodfocus on making the inevitable systematic biases in theevent counting symmetric between at least two of the fourcomponents of the double ratio. In this way, most of theimportant systematic effects cancel to first order, and onlythe differences between two components need to be con-sidered in detail in the analysis. This allows the systematicuncertainties to be kept sufficiently low.
In order to exploit the cancellations, all four modesare collected at the same time and from the same decayvolume. To achieve this, simultaneous KS and KL beamsare produced in two targets situated at different distancesfrom the decay volume. The intensity ratio is such that theππ decay rates from the two beams are comparable. Thekaon production angles are tuned to minimise the diffe-rence in the KL → ππ and KS → ππ decay spectra overa large range of kaon energies. The beam axes are almostcollinear, both pointing to the centre of the detector, sothat the decay products illuminate the detector in a simi-lar way. The similarity is further enhanced by weightingeach KL decay by a function of its proper time, suchthat the KL decay distribution becomes almost identi-cal to that of KS. The small remaining differences inbeam divergences and beam geometries are corrected us-ing Monte Carlo simulation. The small difference betweenKS and KL slow beam intensity variations are eliminatedby weighting the KS events by the KL/KS intensity ratio.
As a consequence of simultaneous data collection alllosses associated with the detector, trigger and reconstruc-tion efficiencies, and with the beam activity, cancel to alarge extent between KL and KS. The ratio of π0π0 andπ+π− decays in each beam is independent of the absoluteflux.
KS decays are distinguished from KL decays by meansof tagging. Protons directed to the KS target pass througha high-rate tagging station (see section 4.1). KS events canbe identified by comparing the registered proton time tothe event time. Since this method is used for both theπ0π0 and the π+π− samples, the double ratio dependsonly on the difference in the KS misidentification prob-abilities between the two decay modes, and not on theirabsolute values.
Backgrounds affect differently each of the four modesin the double ratio. High resolution detectors are employedto achieve an efficient background rejection. Small remain-ing impurities due to three body KL decays are carefullysubtracted.
After applying selection criteria, the four K → ππ de-cay modes are counted in a common 70 to 170 GeV kaonenergy interval. In this interval, the KS and KL decayspectra are similar to within ±15% (Fig. 24). In orderto reduce the influence of the residual spectrum differ-ences on the result, the events are separated into twentybins of kaon energy, each 5 GeV wide. The event countsin both the π+π− and π0π0 modes are corrected for the∼10% probability of misassigning a KL decay to the KS
beam due to the high proton rate in the tagging station.
After applying all corrections bin by bin, the result is ob-tained by averaging the twenty double ratios. Remaininguncertainties from the reconstruction, mainly due to un-certainties in the detector calibration and the geometry,are evaluated using several independent methods.
3 Beams
The NA48 experiment is installed at CERN and uses the450 GeV proton beam delivered by the SPS. KL and KS
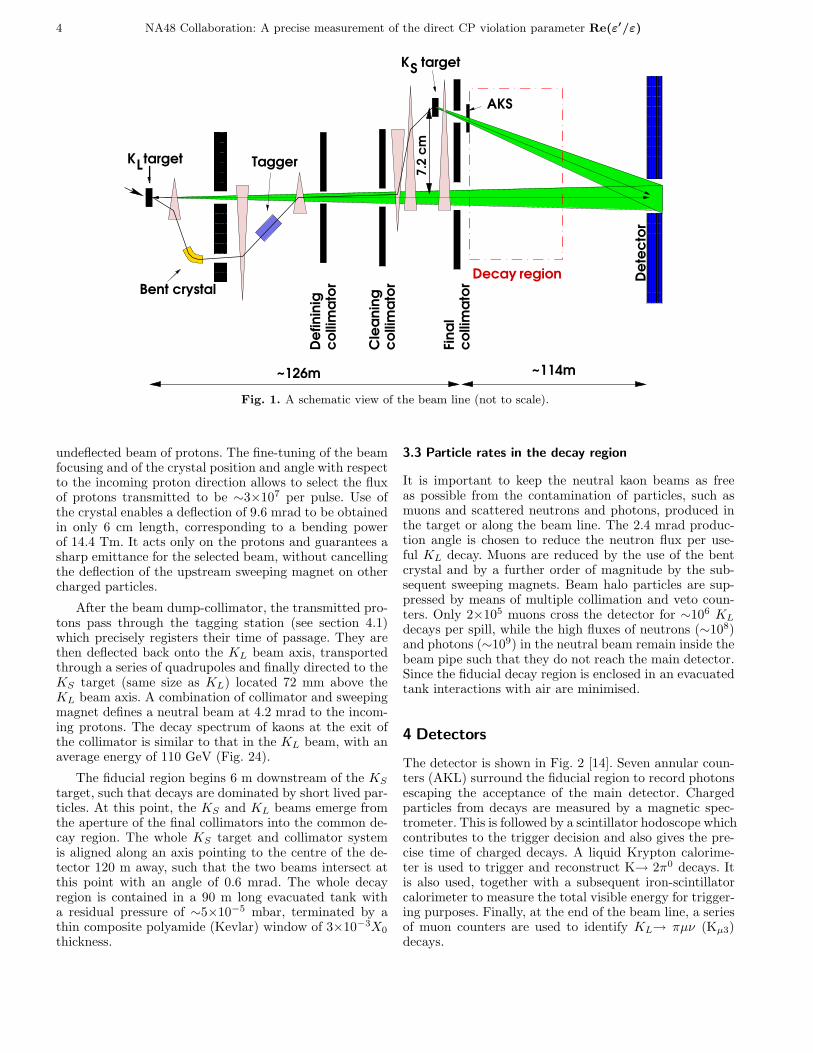
beams [12] are produced in different targets located 126 mand 6 m upstream of the decay fiducial region, respectively(Fig. 1).
The SPS has a cycle time of 14.4 s. It is filled withprotons in two batches, each 11.5 µs long. The beam isaccelerated to a momentum of 450 GeV/c with a 200 MHzradio-frequency system. It is then allowed to debunch, andis extracted by means of a slow excitation with 69 µs pe-riodicity (3 SPS revolutions) over a spill length of 2.38 s.The small remnants of the typical frequencies (200 MHz,100 MHz, 87 kHz and harmonics of 50 Hz) surviving thefiltering and debunching, together with burst-to-burst fluc-tuations of the extraction, result in an effective spill lengthof ∼1.7 s. Since the KS and KL beams are produced con-currently, the KS/KL ratio is maintained stable through-out the burst to within ±10%. This ensures that bothbeams are nearly equal in their sensitivity to intensityvariations of the proton beam.
3.1 The KL beam
The primary high-flux proton beam (∼1.5×10¹² protonsper pulse) impinges on a target (a 400 mm long, 2 mmdiameter rod of beryllium), with an incidence angle of2.4 mrad relative to the KL beam axis. The charged com-ponent of the outgoing particles is swept away by bendingmagnets. The neutral beam passes through three stages ofcollimation. The first “defining” collimator, placed 41 mafter the target, limits the opening angle of the beam. It isfollowed, 63 m further downstream, by a second “cleaning”collimator, which prevents particles scattered or producedon the aperture of the defining collimator from reachingthe detectors. The fiducial region starts at the exit of the“final” collimator, 126 m downstream of the target. Atthis point, the neutral beam is dominated by long-livedkaons, neutrons and photons. Only a small fraction of themost energetic of the short-lived component (KS and Λ)survives.
3.2 The KS beam
The non-interacting protons from the KL target are di-rected onto a mechanically bent mono-crystal of silicon [13].A small fraction of protons satisfy the conditions for chan-nelling and are deflected following the crystalline planes.This component passes through a small aperture collima-tor incorporated in a beam dump, which absorbs the main,
4 NA48 Collaboration: A precise measurement of the direct CP violation parameter Re(ε′/ε)
��������������������������������������������
��������������������������������������������
������������������������������������������������
������������������������������������������������
��������������
��������������
������������
������������
������
������
TaggerLK target
S
~126m ~114m
Bent crystal
AKS
K target
De
tec
tor
Decay
7.2
cm
region
De
fin
inig
Cle
an
ing
co
llim
ato
r
Fin
al
co
llim
ato
r
co
llim
ato
r
Fig. 1. A schematic view of the beam line (not to scale).
undeflected beam of protons. The fine-tuning of the beamfocusing and of the crystal position and angle with respectto the incoming proton direction allows to select the fluxof protons transmitted to be ∼3×10⁷ per pulse. Use ofthe crystal enables a deflection of 9.6 mrad to be obtainedin only 6 cm length, corresponding to a bending powerof 14.4 Tm. It acts only on the protons and guarantees asharp emittance for the selected beam, without cancellingthe deflection of the upstream sweeping magnet on othercharged particles.
After the beam dump-collimator, the transmitted pro-tons pass through the tagging station (see section 4.1)which precisely registers their time of passage. They arethen deflected back onto the KL beam axis, transportedthrough a series of quadrupoles and finally directed to theKS target (same size as KL) located 72 mm above theKL beam axis. A combination of collimator and sweepingmagnet defines a neutral beam at 4.2 mrad to the incom-ing protons. The decay spectrum of kaons at the exit ofthe collimator is similar to that in the KL beam, with anaverage energy of 110 GeV (Fig. 24).
The fiducial region begins 6 m downstream of the KS
target, such that decays are dominated by short lived par-ticles. At this point, the KS and KL beams emerge fromthe aperture of the final collimators into the common de-cay region. The whole KS target and collimator systemis aligned along an axis pointing to the centre of the de-tector 120 m away, such that the two beams intersect atthis point with an angle of 0.6 mrad. The whole decayregion is contained in a 90 m long evacuated tank witha residual pressure of ∼5×10⁻⁵ mbar, terminated by athin composite polyamide (Kevlar) window of 3×10−3X0
thickness.
3.3 Particle rates in the decay region
It is important to keep the neutral kaon beams as freeas possible from the contamination of particles, such asmuons and scattered neutrons and photons, produced inthe target or along the beam line. The 2.4 mrad produc-tion angle is chosen to reduce the neutron flux per use-ful KL decay. Muons are reduced by the use of the bentcrystal and by a further order of magnitude by the sub-sequent sweeping magnets. Beam halo particles are sup-pressed by means of multiple collimation and veto coun-ters. Only 2×10⁵ muons cross the detector for ∼106 KL
decays per spill, while the high fluxes of neutrons (∼108)and photons (∼109) in the neutral beam remain inside thebeam pipe such that they do not reach the main detector.Since the fiducial decay region is enclosed in an evacuatedtank interactions with air are minimised.
4 Detectors
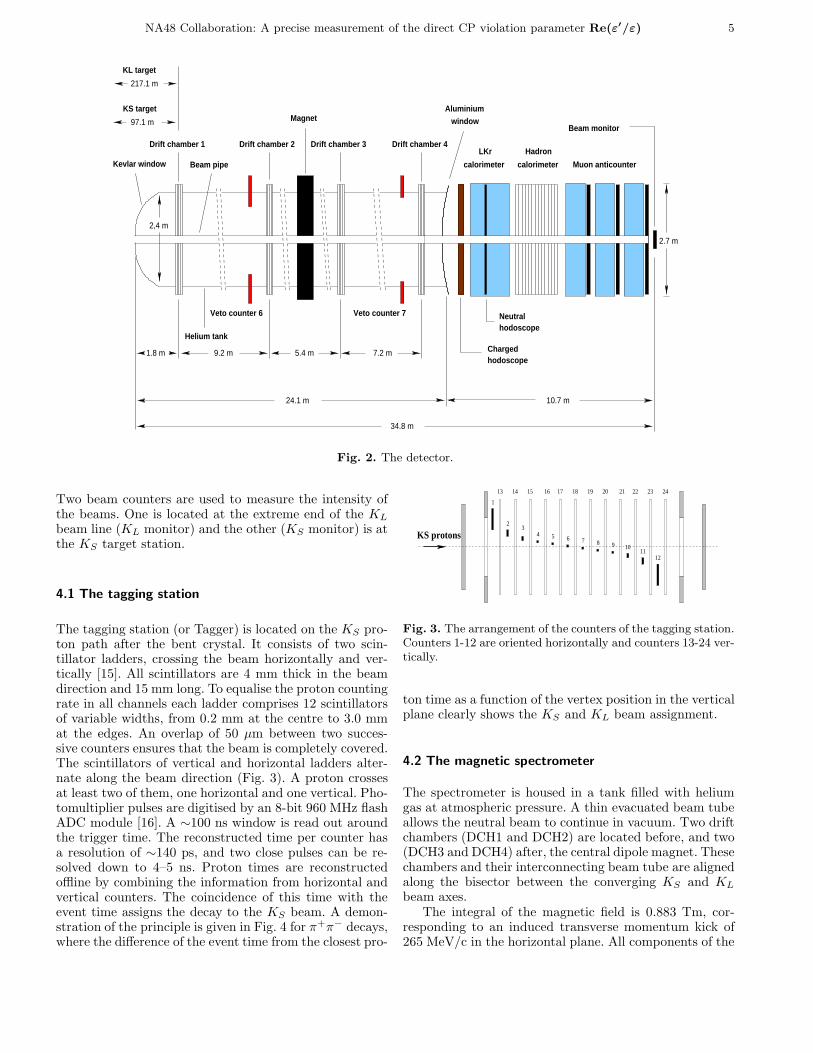
The detector is shown in Fig. 2 [14]. Seven annular coun-ters (AKL) surround the fiducial region to record photonsescaping the acceptance of the main detector. Chargedparticles from decays are measured by a magnetic spec-trometer. This is followed by a scintillator hodoscope whichcontributes to the trigger decision and also gives the pre-cise time of charged decays. A liquid Krypton calorime-ter is used to trigger and reconstruct K→ 2π0 decays. Itis also used, together with a subsequent iron-scintillatorcalorimeter to measure the total visible energy for trigger-ing purposes. Finally, at the end of the beam line, a seriesof muon counters are used to identify KL→ πµν (Kµ3)decays.
NA48 Collaboration: A precise measurement of the direct CP violation parameter Re(ε′/ε) 5
Drift chamber 3Drift chamber 2Drift chamber 1 Drift chamber 4Hadron
Muon anticounter
hodoscopeNeutral
hodoscopeCharged
Kevlar window
Magnet
Beam pipe
window
Helium tank
9.2 m 5.4 m 7.2 m
Beam monitor
10.7 m
Aluminium
2,4 m
24.1 m
34.8 m
KL target
KS target
97.1 m
217.1 m
Veto counter 6 Veto counter 7
2.7 m
LKr
calorimetercalorimeter
1.8 m
Fig. 2. The detector.
Two beam counters are used to measure the intensity ofthe beams. One is located at the extreme end of the KL
beam line (KL monitor) and the other (KS monitor) is atthe KS target station.
4.1 The tagging station
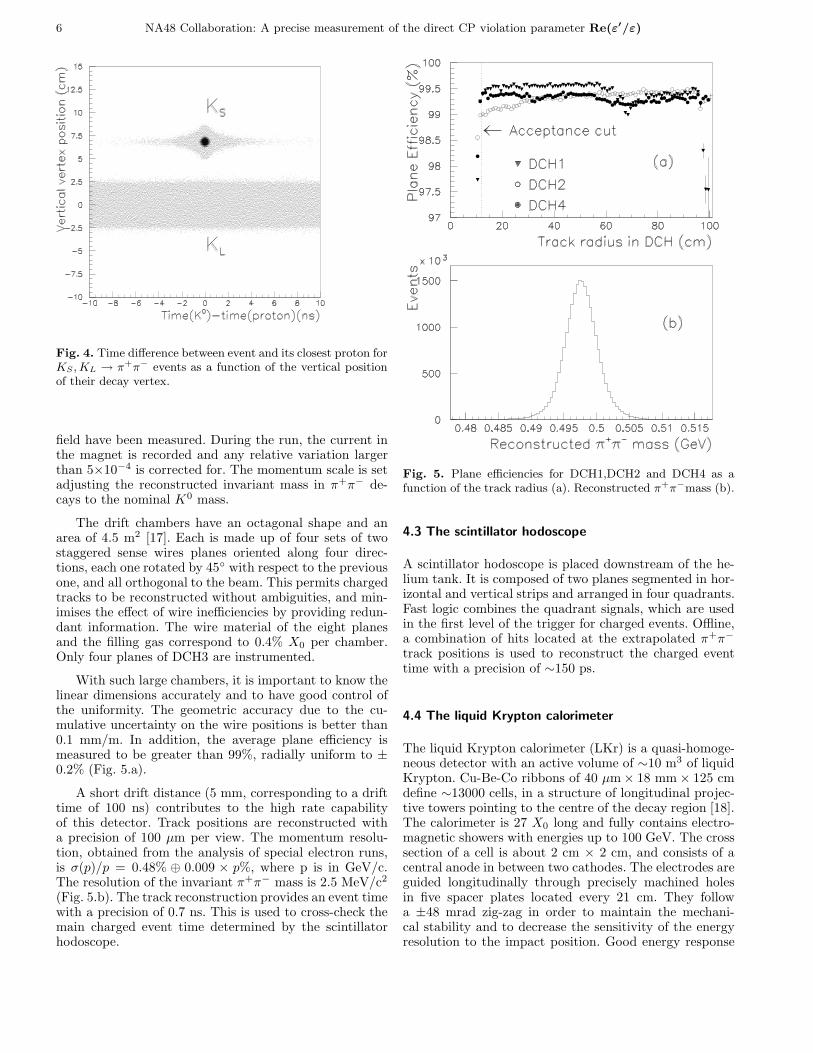
The tagging station (or Tagger) is located on the KS pro-ton path after the bent crystal. It consists of two scin-tillator ladders, crossing the beam horizontally and ver-tically [15]. All scintillators are 4 mm thick in the beamdirection and 15 mm long. To equalise the proton countingrate in all channels each ladder comprises 12 scintillatorsof variable widths, from 0.2 mm at the centre to 3.0 mmat the edges. An overlap of 50 µm between two succes-sive counters ensures that the beam is completely covered.The scintillators of vertical and horizontal ladders alter-nate along the beam direction (Fig. 3). A proton crossesat least two of them, one horizontal and one vertical. Pho-tomultiplier pulses are digitised by an 8-bit 960 MHz flashADC module [16]. A ∼100 ns window is read out aroundthe trigger time. The reconstructed time per counter hasa resolution of ∼140 ps, and two close pulses can be re-solved down to 4–5 ns. Proton times are reconstructedoffline by combining the information from horizontal andvertical counters. The coincidence of this time with theevent time assigns the decay to the KS beam. A demon-stration of the principle is given in Fig. 4 for π+π− decays,where the difference of the event time from the closest pro-
KS protons 9
12
14
1
23
4 5 6 7 810
11
13 15 16 18 19 20 21 22 2317 24
Fig. 3. The arrangement of the counters of the tagging station.Counters 1-12 are oriented horizontally and counters 13-24 ver-tically.
ton time as a function of the vertex position in the verticalplane clearly shows the KS and KL beam assignment.
4.2 The magnetic spectrometer
The spectrometer is housed in a tank filled with heliumgas at atmospheric pressure. A thin evacuated beam tubeallows the neutral beam to continue in vacuum. Two driftchambers (DCH1 and DCH2) are located before, and two(DCH3 and DCH4) after, the central dipole magnet. Thesechambers and their interconnecting beam tube are alignedalong the bisector between the converging KS and KL
beam axes.The integral of the magnetic field is 0.883 Tm, cor-
responding to an induced transverse momentum kick of265 MeV/c in the horizontal plane. All components of the
6 NA48 Collaboration: A precise measurement of the direct CP violation parameter Re(ε′/ε)
Fig. 4. Time difference between event and its closest proton forKS, KL → π+π− events as a function of the vertical positionof their decay vertex.
field have been measured. During the run, the current inthe magnet is recorded and any relative variation largerthan 5×10⁻⁴ is corrected for. The momentum scale is setadjusting the reconstructed invariant mass in π+π− de-cays to the nominal K0 mass.
The drift chambers have an octagonal shape and anarea of 4.5 m2 [17]. Each is made up of four sets of twostaggered sense wires planes oriented along four direc-tions, each one rotated by 45◦ with respect to the previousone, and all orthogonal to the beam. This permits chargedtracks to be reconstructed without ambiguities, and min-imises the effect of wire inefficiencies by providing redun-dant information. The wire material of the eight planesand the filling gas correspond to 0.4% X0 per chamber.Only four planes of DCH3 are instrumented.
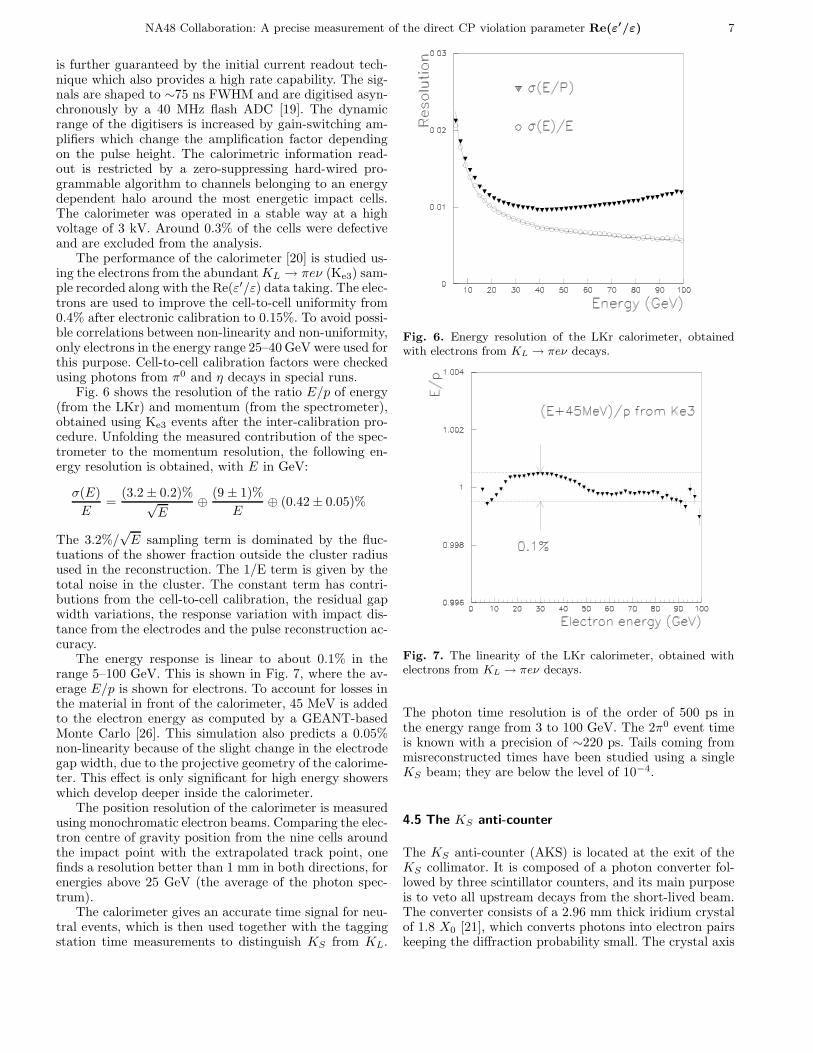
With such large chambers, it is important to know thelinear dimensions accurately and to have good control ofthe uniformity. The geometric accuracy due to the cu-mulative uncertainty on the wire positions is better than0.1 mm/m. In addition, the average plane efficiency ismeasured to be greater than 99%, radially uniform to ±0.2% (Fig. 5.a).
A short drift distance (5 mm, corresponding to a drifttime of 100 ns) contributes to the high rate capabilityof this detector. Track positions are reconstructed witha precision of 100 µm per view. The momentum resolu-tion, obtained from the analysis of special electron runs,is σ(p)/p = 0.48% ⊕ 0.009 × p%, where p is in GeV/c.The resolution of the invariant π+π− mass is 2.5 MeV/c2
(Fig. 5.b). The track reconstruction provides an event timewith a precision of 0.7 ns. This is used to cross-check themain charged event time determined by the scintillatorhodoscope.
Fig. 5. Plane efficiencies for DCH1,DCH2 and DCH4 as afunction of the track radius (a). Reconstructed π+π−mass (b).
4.3 The scintillator hodoscope
A scintillator hodoscope is placed downstream of the he-lium tank. It is composed of two planes segmented in hor-izontal and vertical strips and arranged in four quadrants.Fast logic combines the quadrant signals, which are usedin the first level of the trigger for charged events. Offline,a combination of hits located at the extrapolated π+π−
track positions is used to reconstruct the charged eventtime with a precision of ∼150 ps.
4.4 The liquid Krypton calorimeter
The liquid Krypton calorimeter (LKr) is a quasi-homoge-neous detector with an active volume of ∼10 m3 of liquidKrypton. Cu-Be-Co ribbons of 40 µm × 18 mm × 125 cmdefine ∼13000 cells, in a structure of longitudinal projec-tive towers pointing to the centre of the decay region [18].The calorimeter is 27 X0 long and fully contains electro-magnetic showers with energies up to 100 GeV. The crosssection of a cell is about 2 cm × 2 cm, and consists of acentral anode in between two cathodes. The electrodes areguided longitudinally through precisely machined holesin five spacer plates located every 21 cm. They followa ±48 mrad zig-zag in order to maintain the mechani-cal stability and to decrease the sensitivity of the energyresolution to the impact position. Good energy response
NA48 Collaboration: A precise measurement of the direct CP violation parameter Re(ε′/ε) 7
is further guaranteed by the initial current readout tech-nique which also provides a high rate capability. The sig-nals are shaped to ∼75 ns FWHM and are digitised asyn-chronously by a 40 MHz flash ADC [19]. The dynamicrange of the digitisers is increased by gain-switching am-plifiers which change the amplification factor dependingon the pulse height. The calorimetric information read-out is restricted by a zero-suppressing hard-wired pro-grammable algorithm to channels belonging to an energydependent halo around the most energetic impact cells.The calorimeter was operated in a stable way at a highvoltage of 3 kV. Around 0.3% of the cells were defectiveand are excluded from the analysis.
The performance of the calorimeter [20] is studied us-ing the electrons from the abundant KL → πeν (Ke3) sam-ple recorded along with the Re(ε′/ε) data taking. The elec-trons are used to improve the cell-to-cell uniformity from0.4% after electronic calibration to 0.15%. To avoid possi-ble correlations between non-linearity and non-uniformity,only electrons in the energy range 25–40 GeV were used forthis purpose. Cell-to-cell calibration factors were checkedusing photons from π0 and η decays in special runs.
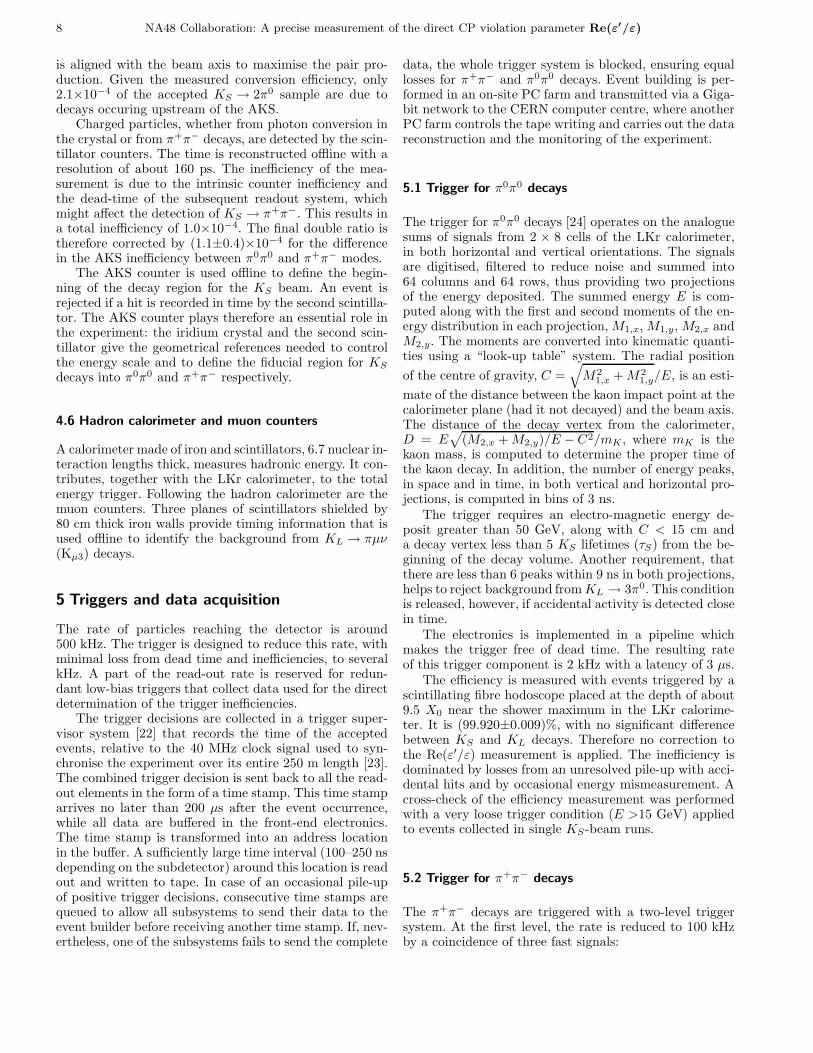
Fig. 6 shows the resolution of the ratio E/p of energy(from the LKr) and momentum (from the spectrometer),obtained using Ke3 events after the inter-calibration pro-cedure. Unfolding the measured contribution of the spec-trometer to the momentum resolution, the following en-ergy resolution is obtained, with E in GeV:
σ(E)
E=
(3.2 ± 0.2)%√E
⊕ (9 ± 1)%
E⊕ (0.42 ± 0.05)%
The 3.2%/√
E sampling term is dominated by the fluc-tuations of the shower fraction outside the cluster radiusused in the reconstruction. The 1/E term is given by thetotal noise in the cluster. The constant term has contri-butions from the cell-to-cell calibration, the residual gapwidth variations, the response variation with impact dis-tance from the electrodes and the pulse reconstruction ac-curacy.
The energy response is linear to about 0.1% in therange 5–100 GeV. This is shown in Fig. 7, where the av-erage E/p is shown for electrons. To account for losses inthe material in front of the calorimeter, 45 MeV is addedto the electron energy as computed by a GEANT-basedMonte Carlo [26]. This simulation also predicts a 0.05%non-linearity because of the slight change in the electrodegap width, due to the projective geometry of the calorime-ter. This effect is only significant for high energy showerswhich develop deeper inside the calorimeter.
The position resolution of the calorimeter is measuredusing monochromatic electron beams. Comparing the elec-tron centre of gravity position from the nine cells aroundthe impact point with the extrapolated track point, onefinds a resolution better than 1 mm in both directions, forenergies above 25 GeV (the average of the photon spec-trum).
The calorimeter gives an accurate time signal for neu-tral events, which is then used together with the taggingstation time measurements to distinguish KS from KL.
Fig. 6. Energy resolution of the LKr calorimeter, obtainedwith electrons from KL → πeν decays.
Fig. 7. The linearity of the LKr calorimeter, obtained withelectrons from KL → πeν decays.
The photon time resolution is of the order of 500 ps inthe energy range from 3 to 100 GeV. The 2π0 event timeis known with a precision of ∼220 ps. Tails coming frommisreconstructed times have been studied using a singleKS beam; they are below the level of 10−4.
4.5 The KS anti-counter
The KS anti-counter (AKS) is located at the exit of theKS collimator. It is composed of a photon converter fol-lowed by three scintillator counters, and its main purposeis to veto all upstream decays from the short-lived beam.The converter consists of a 2.96 mm thick iridium crystalof 1.8 X0 [21], which converts photons into electron pairskeeping the diffraction probability small. The crystal axis
8 NA48 Collaboration: A precise measurement of the direct CP violation parameter Re(ε′/ε)
is aligned with the beam axis to maximise the pair pro-duction. Given the measured conversion efficiency, only2.1×10−4 of the accepted KS → 2π0 sample are due todecays occuring upstream of the AKS.
Charged particles, whether from photon conversion inthe crystal or from π+π− decays, are detected by the scin-tillator counters. The time is reconstructed offline with aresolution of about 160 ps. The inefficiency of the mea-surement is due to the intrinsic counter inefficiency andthe dead-time of the subsequent readout system, whichmight affect the detection of KS → π+π−. This results ina total inefficiency of 1.0×10⁻⁴. The final double ratio istherefore corrected by (1.1±0.4)×10−4 for the differencein the AKS inefficiency between π0π0 and π+π− modes.
The AKS counter is used offline to define the begin-ning of the decay region for the KS beam. An event isrejected if a hit is recorded in time by the second scintilla-tor. The AKS counter plays therefore an essential role inthe experiment: the iridium crystal and the second scin-tillator give the geometrical references needed to controlthe energy scale and to define the fiducial region for KS
decays into π0π0 and π+π− respectively.
4.6 Hadron calorimeter and muon counters
A calorimeter made of iron and scintillators, 6.7 nuclear in-teraction lengths thick, measures hadronic energy. It con-tributes, together with the LKr calorimeter, to the totalenergy trigger. Following the hadron calorimeter are themuon counters. Three planes of scintillators shielded by80 cm thick iron walls provide timing information that isused offline to identify the background from KL → πµν(Kµ3) decays.
5 Triggers and data acquisition
The rate of particles reaching the detector is around500 kHz. The trigger is designed to reduce this rate, withminimal loss from dead time and inefficiencies, to severalkHz. A part of the read-out rate is reserved for redun-dant low-bias triggers that collect data used for the directdetermination of the trigger inefficiencies.
The trigger decisions are collected in a trigger super-visor system [22] that records the time of the acceptedevents, relative to the 40 MHz clock signal used to syn-chronise the experiment over its entire 250 m length [23].The combined trigger decision is sent back to all the read-out elements in the form of a time stamp. This time stamparrives no later than 200 µs after the event occurrence,while all data are buffered in the front-end electronics.The time stamp is transformed into an address locationin the buffer. A sufficiently large time interval (100–250 nsdepending on the subdetector) around this location is readout and written to tape. In case of an occasional pile-upof positive trigger decisions, consecutive time stamps arequeued to allow all subsystems to send their data to theevent builder before receiving another time stamp. If, nev-ertheless, one of the subsystems fails to send the complete
data, the whole trigger system is blocked, ensuring equallosses for π+π− and π0π0 decays. Event building is per-formed in an on-site PC farm and transmitted via a Giga-bit network to the CERN computer centre, where anotherPC farm controls the tape writing and carries out the datareconstruction and the monitoring of the experiment.
5.1 Trigger for π0π0 decays
The trigger for π0π0 decays [24] operates on the analoguesums of signals from 2 × 8 cells of the LKr calorimeter,in both horizontal and vertical orientations. The signalsare digitised, filtered to reduce noise and summed into64 columns and 64 rows, thus providing two projectionsof the energy deposited. The summed energy E is com-puted along with the first and second moments of the en-ergy distribution in each projection, M1,x, M1,y, M2,x andM2,y. The moments are converted into kinematic quanti-ties using a “look-up table” system. The radial position
of the centre of gravity, C =√
M21,x + M2
1,y/E, is an esti-
mate of the distance between the kaon impact point at thecalorimeter plane (had it not decayed) and the beam axis.The distance of the decay vertex from the calorimeter,D = E
√
(M2,x + M2,y)/E − C2/mK , where mK is thekaon mass, is computed to determine the proper time ofthe kaon decay. In addition, the number of energy peaks,in space and in time, in both vertical and horizontal pro-jections, is computed in bins of 3 ns.
The trigger requires an electro-magnetic energy de-posit greater than 50 GeV, along with C < 15 cm anda decay vertex less than 5 KS lifetimes (τS) from the be-ginning of the decay volume. Another requirement, thatthere are less than 6 peaks within 9 ns in both projections,helps to reject background from KL → 3π0. This conditionis released, however, if accidental activity is detected closein time.
The electronics is implemented in a pipeline whichmakes the trigger free of dead time. The resulting rateof this trigger component is 2 kHz with a latency of 3 µs.
The efficiency is measured with events triggered by ascintillating fibre hodoscope placed at the depth of about9.5 X0 near the shower maximum in the LKr calorime-ter. It is (99.920±0.009)%, with no significant differencebetween KS and KL decays. Therefore no correction tothe Re(ε′/ε) measurement is applied. The inefficiency isdominated by losses from an unresolved pile-up with acci-dental hits and by occasional energy mismeasurement. Across-check of the efficiency measurement was performedwith a very loose trigger condition (E >15 GeV) appliedto events collected in single KS-beam runs.
5.2 Trigger for π+π− decays
The π+π− decays are triggered with a two-level triggersystem. At the first level, the rate is reduced to 100 kHzby a coincidence of three fast signals:
NA48 Collaboration: A precise measurement of the direct CP violation parameter Re(ε′/ε) 9
1. Opposite quadrant coincidence in the scintillator ho-doscope (Qx), where the quadrants are defined withsome overlap in order to avoid geometric inefficiencies.The remaining inefficiency (0.05%) is due to electron-ics and scintillator geometry, and is equal for KS andKL decays. However, a Qx signal cannot be producedin two consecutive 25 ns clock periods, which leads toa dead time of 0.5%. Signals in a sufficiently large timewindow are recorded to allow the dead time to be ap-plied (offline) on an event-by-event basis also to theπ0π0 sample.
2. Hit multiplicity in DCH1 integrated over 200 ns, re-quiring at least 3 wires hit in at least 3 views (2track).This has an inefficiency smaller than 10−4.
3. Total calorimetric energy (Etot), made by summing theelectro-magnetic energy from the π0π0 trigger with thehadron calorimeter energy, is required to be more than35 GeV. Owing to the low resolution in the time andsize of the hadronic energy measurement, some goodevents fail to pass the energy threshold or the timecoincidence with the Qx and 2track signals. The Etot
efficiency is (99.542 ± 0.018)% for KL events (proper-time weighted) and (99.535 ± 0.011)% for KS events.The correction for the efficiency difference is appliedin bins of energy and amounts to (0.9± 2.2)×10−4 onthe average double ratio.
A signal composed of Qx × 2track × Etot + Qx/D issent to the second level trigger with a latency of 5 µs. TheQx/D component, where D denotes a down-scaling factor,is added in order to measure the efficiencies of the 2trackand Etot components. An additional down-scaled 2track×Etot trigger signal by-passes the second level trigger toallow efficiency measurements of the Qx signal and of thesecond level trigger.
The second level of the π+π− trigger [25] consists ofhardware coordinate builders and a farm of asynchronousmicroprocessors that reconstruct tracks using data fromDCH1, 2 and 4. Triggers are selected if the tracks con-verge to within 5 cm, their opening angle is smaller than15 mrad, the reconstructed proper decay time is smallerthan 4.5 τS , and the reconstructed ππ mass is larger than0.95 mK . The latency is variable but does not exceed100 µs and the output rate is 2 kHz. The efficiency is(98.319±0.038)% for KL (proper-time weighted) and(98.353±0.022)% for KS decays. The inefficiencies are duemainly to DCH wire inefficiencies (1.2%) with a contri-bution from algorithm imprecision (0.3%) and misrecon-structions from accidental hits (0.2%). The correction forthe second level trigger efficiency difference is applied inbins of energy with an average of (−4.5 ± 4.7)×10−4 onR.
The time available to extract the data from the spec-trometer read-out ring buffers to the second level trig-ger is limited. This leads to a 1.1% dead time. The samedead time condition is applied to π0π0 candidates eventby event, to ensure that the principle of collecting π+π−
and π0π0 decays concurrently is respected.In order to avoid recording events with high hit mul-
tiplicity, an overflow condition is generated in the drift
chamber readout whenever more than seven hits in a planeare detected within 100 ns. In this case the front end read-out buffers of this plane are cleared and the time of theoverflow is recorded. Both the second level trigger and thereconstruction of events are affected by this condition.
Overflows are mainly due to showers induced by inter-actions of electrons or photons in the material surroundingthe beam pipe in the region of the spectrometer and byδ-rays coming from interactions of charged particles withthe drift chamber gas. Occasionally they are also gener-ated by noisy amplifiers operated with low thresholds. Inthis case at most two neighbouring planes are affected.
In the offline reconstruction, a window of ±312 nsaround the event time is required to be free of overflows,both for π+π− and π0π0 decays. This time window islarger than the sum of maximum drift time and reset time.In the π0π0 sample 21.5% of events are removed by theoverflow condition which reduces the sensitivity to KS/KL
intensity variations by an order of magnitude.
5.3 Other triggers
Several other triggers were collected continuously duringdata taking for systematic studies:
– A trigger for 3π0 decays, given by the down-scaledπ0π0 trigger without the peak condition, used for KS
tagging studies.– A trigger for π0π0
D (where π0D stands for the Dalitz
decay π0D → eeγ) decays, combining the information
from the LKr calorimeter and the spectrometer, usedto test KS tagging and the energy scale.
– Beam monitor triggers used to record the accidentalactivity, with rates proportional to KL and KS decayrates. Beam monitor signals are down-scaled and de-layed by 69 µs which corresponds to the periodicity ofthe slow proton extraction (3 SPS revolutions).
– Calibration triggers used to monitor and calibrate theLKr calorimeter, the tagging station and the scintilla-tor hodoscope.
6 Data samples
The NA48 experiment collected data for the Re(ε′/ε) mea-surement in SPS running periods during the summer ofthree consecutive years: 1997–1999. The data from thefirst running period yielded 0.49 million KL → 2π0 events.The result was published in [10].
In the year 1998, the total number of KL → 2π0 eventscollected during 135 days of running was 1.1 million. In theyear 1999, an upgrade of the trigger and the event builderPC farm, as well as an increase in the operational stabilityof the detectors and electronics, contributed to obtainingsmaller dead time and higher data taking efficiency. Inaddition, the SPS spill length was increased by 10%. Thisallowed the experiment to collect 2.2 million KL → 2π0
events in 128 days. In all run periods the polarity of themagnetic field was regularly inverted to allow systematicchecks on π+π− decay reconstruction.
10 NA48 Collaboration: A precise measurement of the direct CP violation parameter Re(ε′/ε)
In the year 2000, a special run took place to cross-checkthe KS tagging systematics. In this run, the NA48 detec-tor operated with vacuum in place of the spectrometer,and with the KS-protons swept away after their passagethrough the tagging station. This allowed a direct mea-surement of the accidental coincidence rate between theKL → 2π0, 3π0 decays and the protons passing throughthe Tagger.
Along with simultaneous KL and KS beam runs, sev-eral auxiliary runs were dedicated to various systematicchecks. Data with muon or with KL beams without thespectrometer magnetic field were taken for alignment pur-poses. Scans with a monochromatic collimated electronbeam were used for spectrometer and calorimeter calibra-tion and alignment. Runs with either KS or KL beam onlywere taken on a regular basis to verify the KS taggingperformance and to check the data quality in single beamconditions. Tests of the LKr calorimeter calibration werecarried out using data from runs with two thin polyethy-lene targets exposed to a π− beam producing π0 → γγ,η → γγ and η → 3π0 decays at precisely defined vertexpositions.
7 Decay identification
The raw data amount to 170 TBytes. After decoding andhit reconstruction, the data were filtered and compactedin several steps to allow for the iterative improvement ofcalibrations, alignment and corrections. The last step, be-fore the final event selection, was sufficiently fast that itcould be repeated several times following the refinementsof the corrections.
7.1 Reconstruction and selection of π0π0 events
The reconstruction of π0π0 events is based entirely on datafrom the LKr calorimeter. The time and height of thepulses are measured using a digital filter technique. Thefirst calibration is performed using a calibration pulsersystem. The cell response is inter-calibrated comparingenergy and momentum (E/p) of electrons from Ke3 data.Further checks and fine tuning of the inter-calibration by∼0.1% were performed with π0s produced in a π− beamby adjusting the reconstructed vertex of the photon pairsto the target position.
Small drifts of the pedestal due to temperature effectsare monitored and corrected. A pile up of signals within3 µs causes the pedestal to shift. These shifts are detectedby comparing ADC samples, stored in a buffer before thetrigger, with the average pedestal level. If there is a signif-icant difference between the two, then the stored samplesare used; otherwise, the average pedestal is taken. Thisprocedure minimises the influence of noise on the pulseheight measurement.
Photon showers are found by looking for maxima inthe digitised pulses from individual cells in both spaceand time, and accumulating the energy within a radiusof 11 cm. The shower position is derived from the centre
of gravity of 3 × 3 central cells. Both energy and positionmeasurements are corrected for a dependence on the dis-tance of the impact point to the electrodes using data fromelectron beam scans. The transverse scale of the calorime-ter is checked using Ke3-electron tracks and residuals of∼200 µm are applied as a correction to cluster positions.In order to account for deviations from the projectivity ofthe calorimeter, the cluster positions are recomputed atthe shower maximum depth. The expected shower depthis estimated from Ke3 data comparing reconstructed andextrapolated electron shower positions and extrapolatedto photons using Monte Carlo simulations.
Overlapping showers are separated using expected sho-wer shapes from a GEANT Monte Carlo simulation. Thequality of the shower shapes is tested with data from elec-tron beam scans. Based on these data, an additional cor-rection is applied at the reconstructed shower level. En-ergy losses at the borders of the calorimeter are also ac-counted for, using information from Monte Carlo simula-tions and electron beam scans. Zero-suppression bias inshowers with energy smaller than 5 GeV is reduced byparametrising the ratio of the energies deposited in a welldefined 7 × 7 cell shower box and the total reconstructedshower energy, as a function of the photon energy andthe number of cells read out. A small decrease of mea-sured energy due to space charge accumulation during thespill, in average around 1.5× 10⁻⁴, is corrected using Ke3
data [27]. The average energy loss of photons in the mate-rial before the calorimeter was determined with GEANTMonte Carlo to be 15 MeV. Shower energies are increasedby this amount. A correction for residual nonlinearity ofthe energy measurement is derived from the parametrisedE/p distribution of Ke3-electrons (Fig. 7).
Correct shower reconstruction is ensured by acceptingonly showers with energies between 3 and 100 GeV, andpositions more than 15 cm from the calorimeter centre,11 cm from its outside borders and 2 cm from any defectivecell.
Any group of four showers, each reconstructed within5 ns of their average time, is examined for the π0π0 signa-ture. A minimum distance of 10 cm between the showersis required to resolve correctly the overlapping energy de-posits. The event time is computed from an energy-weigh-ted average of time measurements in individual cells, us-ing the two cells with the largest energy deposits in eachshower. Cells with signals more than 5 ns from the averagetime are excluded from the time computation.
The distance dvertex of the decay vertex from the LKrcalorimeter is computed from the energies Ei and posi-tions (xi, yi) of the four showers, with the assumption thatthey come from the decay of a particle with the kaon massmK moving along the beam axis:
dvertex =
√
4∑
i
4∑
j>i
EiEj ((xi − xj)2 + (yi − yj)2)
mK(2)
A resolution of ∼50 cm is obtained on dvertex. The vertexposition zvertex is equal to zLKr − dvertex. The invariant
NA48 Collaboration: A precise measurement of the direct CP violation parameter Re(ε′/ε) 11
mass of two photons mγγ is then computed as
mγγ =
√
E1E2 ((x1 − x2)2 + (y1 − y2)2)
dvertex(3)
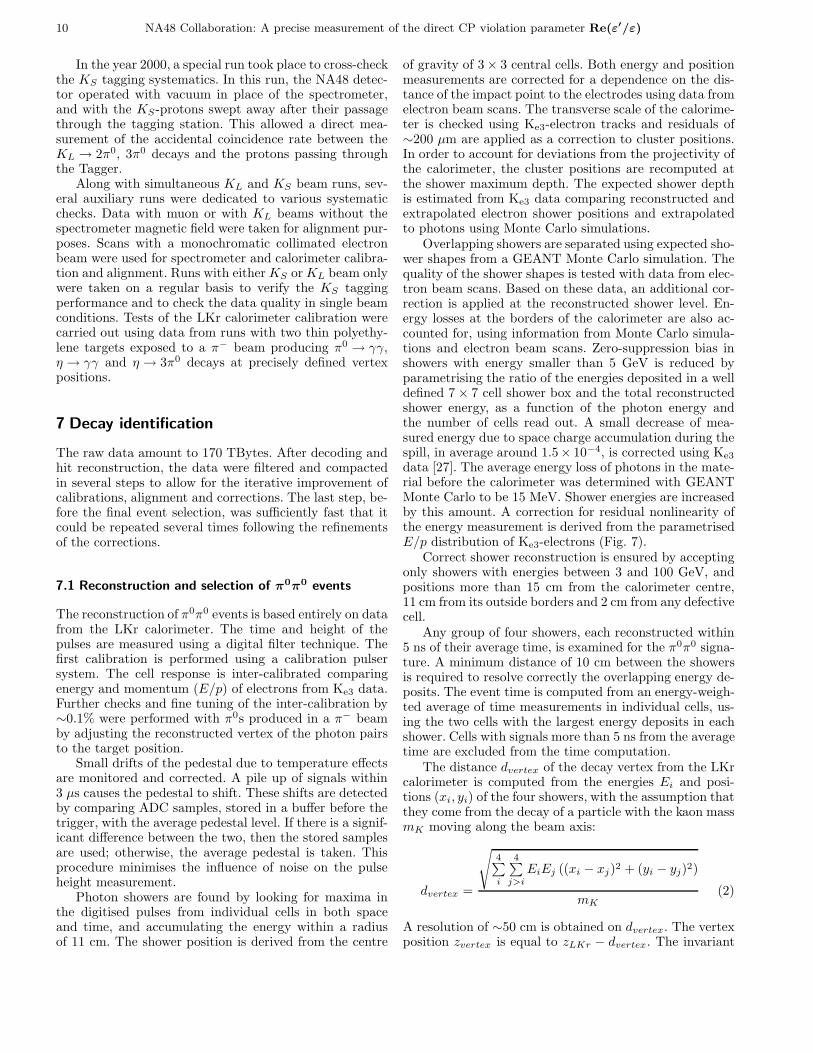
The two mγγ masses (m1 and m2) are anti-correlated(Fig. 8) because dvertex contains information from all fourshowers. In order to find the best shower pairing, a χ2 vari-able is constructed. In this variable, m1 and m2 values arecombined in order to remove the anti-correlation.
χ2 =
[
(m1+m2)2 − mπ0
σ+
]2
+
[
(m1−m2)2
σ−
]2
(4)
where σ+ and σ− are the corresponding resolutions, para-metrised as functions of the energy of the least-energeticphoton. The average values of σ+ and σ− are 0.42 MeV/c2
and 0.83 MeV/c2, respectively.
Fig. 8. Distribution of KS → 2π0 candidates in the spaceof two reconstructed mγγ masses, m1 and m2. The contourscorrespond to increments by one standard deviation.
As electrons and photons have different energy losses,the final adjustment of the energy scale is done with pho-tons. The energy scale is directly coupled to the distancescale (Eq. 2). It is adjusted by comparing the average ver-tex position of KS → 2π0 candidates at the AKS edgewith that produced by the Monte Carlo (Fig. 9), with anaccuracy of 3 cm. The adjustment of the energy scale isapplied as a function of the run period.
The sensitivity of the double ratio to the energy scale isminimised by the choice of both the kaon energy range andthe fiducial decay volume. At the chosen energy bound-aries, 70 to 170 GeV, the shape of the decay spectrumfavours a cancellation of the losses and gains in case of anenergy scale shift.
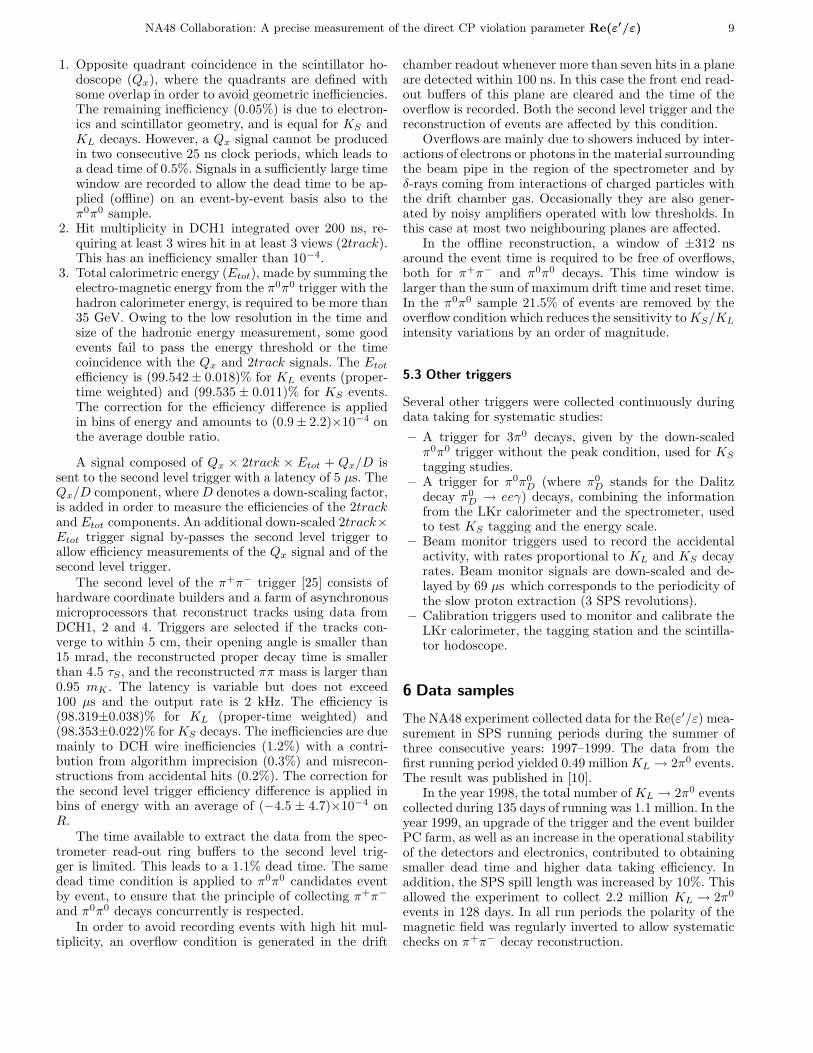
Fig. 9. Distribution of the reconstructed vertex positionzvertex of the KS → π0π0 candidates at the beginning of thedecay volume. The origin of the zvertex axis is set to the nom-inal AKS position.
The total number of selected KL decays is nearly in-dependent of the distance scale because the acceptanceis only weakly dependent on the longitudinal vertex po-sition. For KS decays the beginning of the decay volumeis defined by the AKS counter. The end of the decay vol-ume is chosen to be 3.5τS downstream of the AKS. A3 cm shift in this cut, corresponding to the accuracy ofthe energy scale adjustment, together with the effects ofenergy boundaries and acceptance, would lead to an errorof 2×10⁻⁴ in the decay rates.
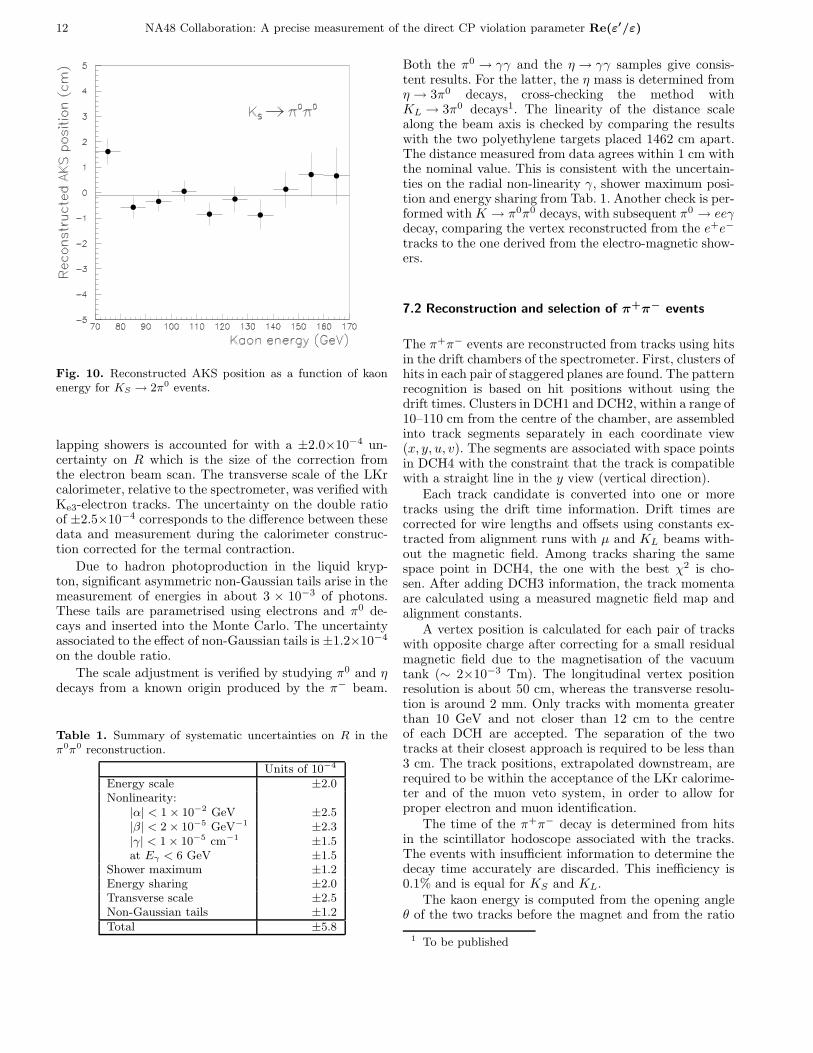
All systematic uncertainties in the π0π0 reconstructionare summarised in Tab. 1. The residual deviation fromlinearity in the photon energy measurement was parame-trised as:
∆E = α + βE2 + γrE (5)
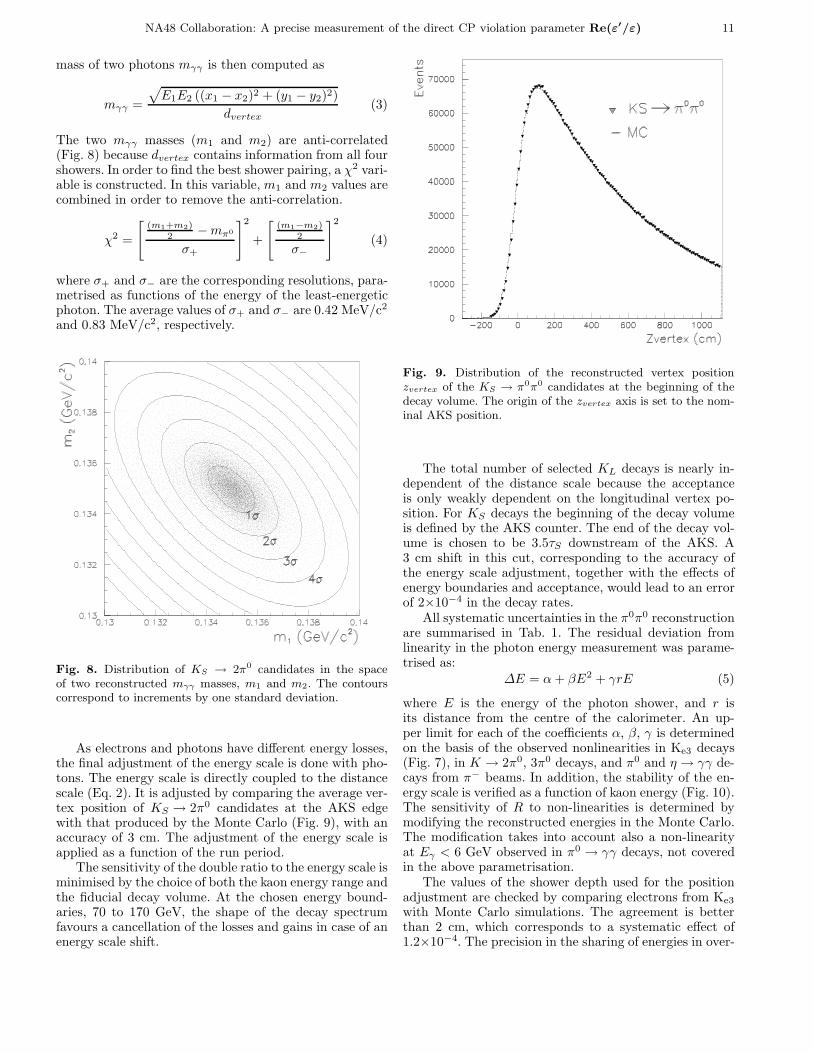
where E is the energy of the photon shower, and r isits distance from the centre of the calorimeter. An up-per limit for each of the coefficients α, β, γ is determinedon the basis of the observed nonlinearities in Ke3 decays(Fig. 7), in K → 2π0, 3π0 decays, and π0 and η → γγ de-cays from π− beams. In addition, the stability of the en-ergy scale is verified as a function of kaon energy (Fig. 10).The sensitivity of R to non-linearities is determined bymodifying the reconstructed energies in the Monte Carlo.The modification takes into account also a non-linearityat Eγ < 6 GeV observed in π0 → γγ decays, not coveredin the above parametrisation.
The values of the shower depth used for the positionadjustment are checked by comparing electrons from Ke3
with Monte Carlo simulations. The agreement is betterthan 2 cm, which corresponds to a systematic effect of1.2×10−4. The precision in the sharing of energies in over-
12 NA48 Collaboration: A precise measurement of the direct CP violation parameter Re(ε′/ε)
Fig. 10. Reconstructed AKS position as a function of kaonenergy for KS → 2π0 events.
lapping showers is accounted for with a ±2.0×10⁻⁴ un-certainty on R which is the size of the correction fromthe electron beam scan. The transverse scale of the LKrcalorimeter, relative to the spectrometer, was verified withKe3-electron tracks. The uncertainty on the double ratioof ±2.5×10⁻⁴ corresponds to the difference between thesedata and measurement during the calorimeter construc-tion corrected for the termal contraction.
Due to hadron photoproduction in the liquid kryp-ton, significant asymmetric non-Gaussian tails arise in themeasurement of energies in about 3 × 10⁻³ of photons.These tails are parametrised using electrons and π0 de-cays and inserted into the Monte Carlo. The uncertaintyassociated to the effect of non-Gaussian tails is ±1.2×10⁻⁴
on the double ratio.
The scale adjustment is verified by studying π0 and ηdecays from a known origin produced by the π− beam.
Table 1. Summary of systematic uncertainties on R in theπ0π0 reconstruction.
Units of 10−4
Energy scale ±2.0Nonlinearity:
|α| < 1 × 10⁻² GeV ±2.5|β| < 2 × 10⁻⁵ GeV−1 ±2.3|γ| < 1 × 10⁻⁵ cm−1 ±1.5at Eγ < 6 GeV ±1.5
Shower maximum ±1.2Energy sharing ±2.0Transverse scale ±2.5Non-Gaussian tails ±1.2Total ±5.8
Both the π0 → γγ and the η → γγ samples give consis-tent results. For the latter, the η mass is determined fromη → 3π0 decays, cross-checking the method withKL → 3π0 decays1. The linearity of the distance scalealong the beam axis is checked by comparing the resultswith the two polyethylene targets placed 1462 cm apart.The distance measured from data agrees within 1 cm withthe nominal value. This is consistent with the uncertain-ties on the radial non-linearity γ, shower maximum posi-tion and energy sharing from Tab. 1. Another check is per-formed with K → π0π0 decays, with subsequent π0 → eeγdecay, comparing the vertex reconstructed from the e+e−
tracks to the one derived from the electro-magnetic show-ers.
7.2 Reconstruction and selection of π+π− events
The π+π− events are reconstructed from tracks using hitsin the drift chambers of the spectrometer. First, clusters ofhits in each pair of staggered planes are found. The patternrecognition is based on hit positions without using thedrift times. Clusters in DCH1 and DCH2, within a range of10–110 cm from the centre of the chamber, are assembledinto track segments separately in each coordinate view(x, y, u, v). The segments are associated with space pointsin DCH4 with the constraint that the track is compatiblewith a straight line in the y view (vertical direction).
Each track candidate is converted into one or moretracks using the drift time information. Drift times arecorrected for wire lengths and offsets using constants ex-tracted from alignment runs with µ and KL beams with-out the magnetic field. Among tracks sharing the samespace point in DCH4, the one with the best χ2 is cho-sen. After adding DCH3 information, the track momentaare calculated using a measured magnetic field map andalignment constants.
A vertex position is calculated for each pair of trackswith opposite charge after correcting for a small residualmagnetic field due to the magnetisation of the vacuumtank (∼ 2×10⁻³ Tm). The longitudinal vertex positionresolution is about 50 cm, whereas the transverse resolu-tion is around 2 mm. Only tracks with momenta greaterthan 10 GeV and not closer than 12 cm to the centreof each DCH are accepted. The separation of the twotracks at their closest approach is required to be less than3 cm. The track positions, extrapolated downstream, arerequired to be within the acceptance of the LKr calorime-ter and of the muon veto system, in order to allow forproper electron and muon identification.
The time of the π+π− decay is determined from hitsin the scintillator hodoscope associated with the tracks.The events with insufficient information to determine thedecay time accurately are discarded. This inefficiency is0.1% and is equal for KS and KL.
The kaon energy is computed from the opening angleθ of the two tracks before the magnet and from the ratio
1 To be published
NA48 Collaboration: A precise measurement of the direct CP violation parameter Re(ε′/ε) 13
of their momenta p1 and p2 assuming a K → π+π− decay:
EK =
√
Aθ2
(m2K −Am2
π) (6)
whereA =
p1
p2+
p2
p1+ 2 (7)
The energy range and the decay volume are defined to bethe same as in the π0π0 mode. The small distance betweenthe effective positions of the AKS converter and the AKScounter, (2.2 ± 0.1) cm is taken into account.
In the π+π− mode, the distance scale depends only onthe knowledge of the relative geometry of DCH1 and 2.Likewise, the uncertainty of the energy scale depends onthe geometry, because the influence of the magnetic fielduncertainty cancels in Eq. 6. The distance scale in theπ+π− event reconstruction can be checked, as in π0π0 de-cays, by comparing the position of the edge of theKS → π+π− decay vertex distribution with the nominalposition of the AKS counter. A small mismatch of 2.5 cmis found in the data corresponding to a shift in the dis-tance of the two chambers of 2 mm or to a 20 µm relativetransverse scale mismatch. Neither of the two can be ex-cluded. A correction of (2 ± 2)×10−4, corresponding toa 2.5 cm distance scale change, is applied to the doubleratio.
7.3 Background rejection and subtraction in the π0π0
sample
The background to the π0π0 signal comes uniquely fromKL → 3π0 decays. It is largely suppressed by requiring noadditional showers within ±3 ns around the event time.In order to avoid possible losses due to noise, only showerswith reconstructed energy higher than 1.5 GeV are con-sidered for this cut. This does not affect the suppressionof 3π0 decays since, for kinematic reasons, very few pho-tons with energy below 1.5 GeV coming from such decayscan reach the LKr calorimeter. The remaining backgroundconsists of events with escaping or overlapping photons,resulting in only four reconstructed showers.
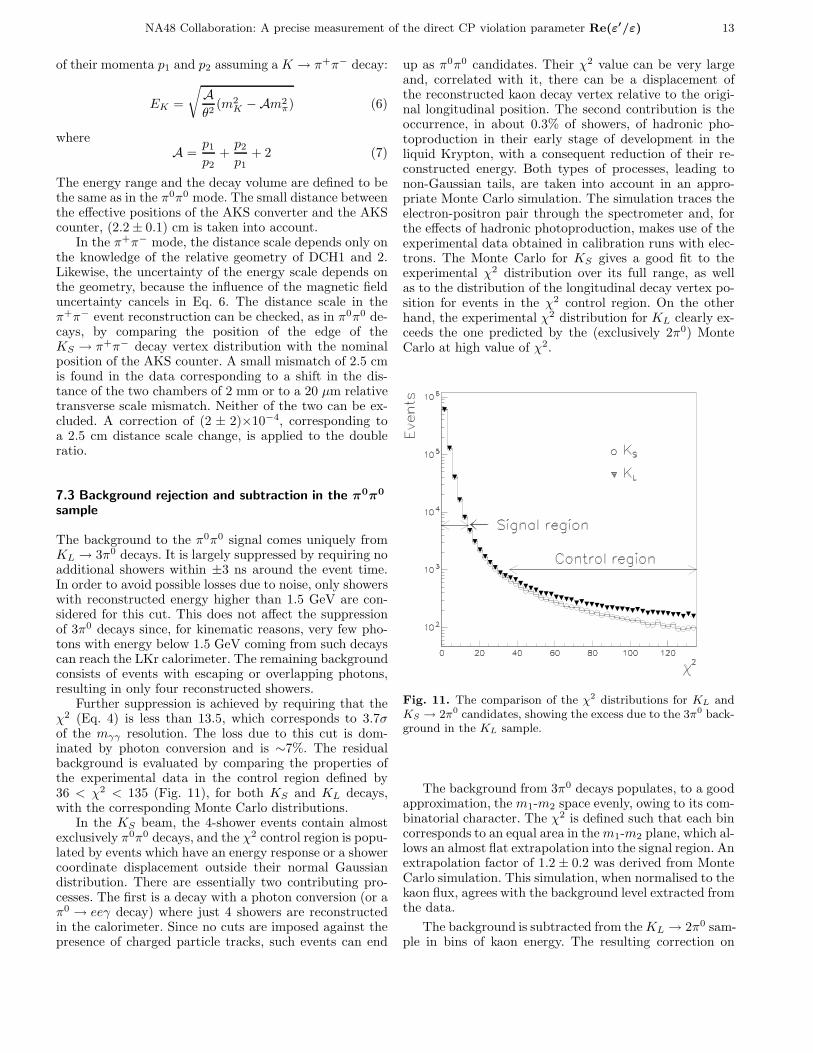
Further suppression is achieved by requiring that theχ2 (Eq. 4) is less than 13.5, which corresponds to 3.7σof the mγγ resolution. The loss due to this cut is dom-inated by photon conversion and is ∼7%. The residualbackground is evaluated by comparing the properties ofthe experimental data in the control region defined by36 < χ2 < 135 (Fig. 11), for both KS and KL decays,with the corresponding Monte Carlo distributions.
In the KS beam, the 4-shower events contain almostexclusively π0π0 decays, and the χ2 control region is popu-lated by events which have an energy response or a showercoordinate displacement outside their normal Gaussiandistribution. There are essentially two contributing pro-cesses. The first is a decay with a photon conversion (or aπ0 → eeγ decay) where just 4 showers are reconstructedin the calorimeter. Since no cuts are imposed against thepresence of charged particle tracks, such events can end
up as π0π0 candidates. Their χ2 value can be very largeand, correlated with it, there can be a displacement ofthe reconstructed kaon decay vertex relative to the origi-nal longitudinal position. The second contribution is theoccurrence, in about 0.3% of showers, of hadronic pho-toproduction in their early stage of development in theliquid Krypton, with a consequent reduction of their re-constructed energy. Both types of processes, leading tonon-Gaussian tails, are taken into account in an appro-priate Monte Carlo simulation. The simulation traces theelectron-positron pair through the spectrometer and, forthe effects of hadronic photoproduction, makes use of theexperimental data obtained in calibration runs with elec-trons. The Monte Carlo for KS gives a good fit to theexperimental χ2 distribution over its full range, as wellas to the distribution of the longitudinal decay vertex po-sition for events in the χ2 control region. On the otherhand, the experimental χ2 distribution for KL clearly ex-ceeds the one predicted by the (exclusively 2π0) MonteCarlo at high value of χ2.
Fig. 11. The comparison of the χ2 distributions for KL andKS → 2π0 candidates, showing the excess due to the 3π0 back-ground in the KL sample.
The background from 3π0 decays populates, to a goodapproximation, the m1-m2 space evenly, owing to its com-binatorial character. The χ2 is defined such that each bincorresponds to an equal area in the m1-m2 plane, which al-lows an almost flat extrapolation into the signal region. Anextrapolation factor of 1.2 ± 0.2 was derived from MonteCarlo simulation. This simulation, when normalised to thekaon flux, agrees with the background level extracted fromthe data.
The background is subtracted from the KL → 2π0 sam-ple in bins of kaon energy. The resulting correction on
14 NA48 Collaboration: A precise measurement of the direct CP violation parameter Re(ε′/ε)
the double ratio, taking into account all uncertainties, is(−5.9 ± 2.0)×10−4.
7.4 Background rejection and subtraction in theπ+π− sample
7.4.1 KS sample
In order to eliminate the background from Λ → pπ− inthe KS → π+π− sample, a cut is applied on the trackmomentum asymmetry,
|p+ − p−|p+ + p−
< min(0.62, 1.08− 0.0052EK) (8)
where EK is the kaon energy in GeV. This cut is appliedto both the KS and the KL samples, and its choice ismotivated, apart from Λ rejection, by its improvement ofthe detector illumination symmetry. The residual Λ con-tamination was verified to be negligible by comparing theinvariant mpπ mass distributions of KS → π+π− candi-dates, with |mππ−mK | between 3 and 5 sigma of the mππ
resolution, for opposite signs of the momentum asymme-try. Due to the large Λ/Λ production asymmetry (7/1),in case of Λ contamination, the two samples would showa significant difference in the population of this controlregion which is not observed.
7.4.2 KL sample
In the KL → π+π− sample, the two semi-leptonic KL de-cay modes, Ke3 and Kµ3, are the dominant backgroundsources. The Ke3 decays are suppressed by requiring E/pto be less than 0.8. Kµ3 decays are rejected when sig-nals in the muon veto system, associated with the tracks,are found within 4 ns. Both cuts are also applied to KS
candidates in order to symmetrise losses of true π+π− de-cays with a large electro-magnetic energy deposit (5.0%)or with a π → µν decay (1.3%).
Further elimination of the semi-leptonic channels isachieved by requiring the invariant mass mππ to be com-patible with the kaon mass to within 3σ of the resolu-tion, where the resolution is a function of the kaon en-ergy. The cut on mππ also rejects all direct emission ππγdecays [28], present only in the KL beam. Most of theinner Bremsstrahlung decays are accepted; they are, how-ever, KS and KL symmetric. This symmetry was testedby Monte Carlo simulation to hold to better than 10−4.
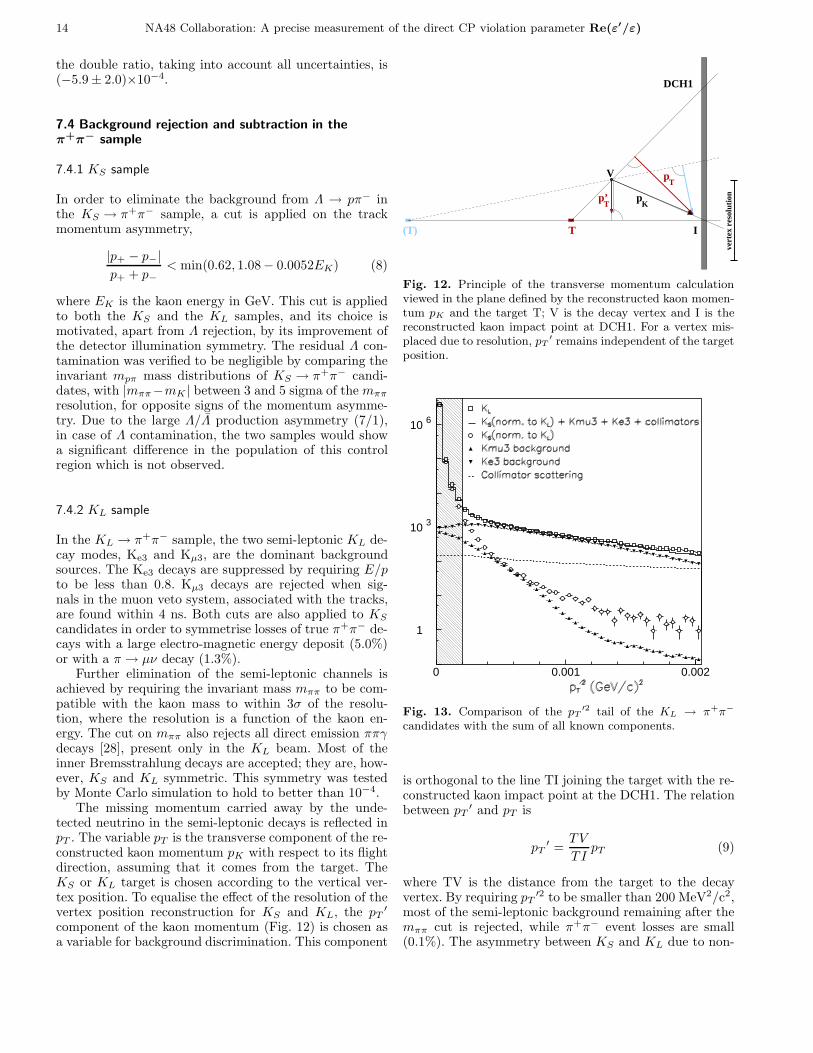
The missing momentum carried away by the unde-tected neutrino in the semi-leptonic decays is reflected inpT . The variable pT is the transverse component of the re-constructed kaon momentum pK with respect to its flightdirection, assuming that it comes from the target. TheKS or KL target is chosen according to the vertical ver-tex position. To equalise the effect of the resolution of thevertex position reconstruction for KS and KL, the pT
′
component of the kaon momentum (Fig. 12) is chosen asa variable for background discrimination. This component
Tp
I
V
pK
p’T
T
vert
ex r
esol
utio
n
DCH1
(T)
Fig. 12. Principle of the transverse momentum calculationviewed in the plane defined by the reconstructed kaon momen-tum pK and the target T; V is the decay vertex and I is thereconstructed kaon impact point at DCH1. For a vertex mis-placed due to resolution, pT
′ remains independent of the targetposition.
1
10 3
10 6
0 0.001 0.002
Fig. 13. Comparison of the pT′2 tail of the KL → π+π−
candidates with the sum of all known components.
is orthogonal to the line TI joining the target with the re-constructed kaon impact point at the DCH1. The relationbetween pT
′ and pT is
pT′ =
TV
TIpT (9)
where TV is the distance from the target to the decayvertex. By requiring pT
′2 to be smaller than 200 MeV2/c2,most of the semi-leptonic background remaining after themππ cut is rejected, while π+π− event losses are small(0.1%). The asymmetry between KS and KL due to non-
NA48 Collaboration: A precise measurement of the direct CP violation parameter Re(ε′/ε) 15
Gaussian tails is smaller than 2×10⁻⁴. This is included inthe reconstruction uncertainty in Tab. 7.
In order to subtract the residual Ke3 and Kµ3 back-ground, two control regions are defined in the mππ-pT
′2
plane. The first region, 9.5 < (mππ −mK) < 19.0 MeV/c2
and 300 < pT′2 < 2000 MeV2/c2, is dominated by Ke3
events, while the second, −17.0 < (mππ − mK) < −12.0MeV/c2 and 300 < pT
′2 < 500 MeV2/c2, contains roughlyequal numbers of Ke3 and Kµ3 events. Both regions arechosen such that they contain neither ππγ events nor col-limator scattered events (see section 7.5), and have suf-ficiently symmetric resolution tails in the KS and KL
beams.To model the background distributions in the control
and signal regions, a Ke3 sample is selected with E/p >0.95, and a Kµ3 sample is obtained by reversing the muonveto requirement. The latter contains also π → µν decayswhich are taken into account by comparison with a simi-larly selected KS sample. The number of true KL → π+π−
decays in these regions is estimated from the KS → π+π−
sample. The KL → π+π− candidates are compared to themodel samples and the scaling factors that best match thetwo background model samples are found. Their extrapo-lation into the signal region gives a background estimateof 10.1×10⁻⁴ for the Ke3 component, and 6.2×10⁻⁴ forKµ3. The independence of the double ratio on the choiceof control regions has been tested, and all results are com-patible within ±2×10⁻⁴.
As a further check, the pT′2 distribution of KL → π+π−
candidates is compared over a large pT′2 interval with the
sum of all contributing components (Fig. 13), taking intoaccount kaon decays from collimator scattering. Devia-tions of around 10% were shown to come from events withhigh hit multiplicity. Their influence on the backgroundestimate is reflected in an increased uncertainty on theamount of subtracted background.
The background subtraction is applied in bins of kaonenergy and the overall correction on the double ratio is(16.9 ± 3.0)×10−4.
7.5 Collimator scattering correction
Both beams are surrounded by halos of particles from scat-tering in the collimators. Since the collimators are close tothe decay region, the scattered particles manifest them-selves through KS → ππ decays.
7.5.1 KS beam
A beam halo in the KS beam is formed by scattering in thecollimator or in the AKS anti-counter. It is cut symmetri-cally in the π0π0 and π+π− decay modes by requiring theradius of the centre of gravity (the distance of the virtual
kaon impact from the beam axis), Cg =√
C2gx + C2
gy, to
be less than 10 cm. Cg is defined at the plane of the LKrcalorimeter, where the two beams cross, and the cut is
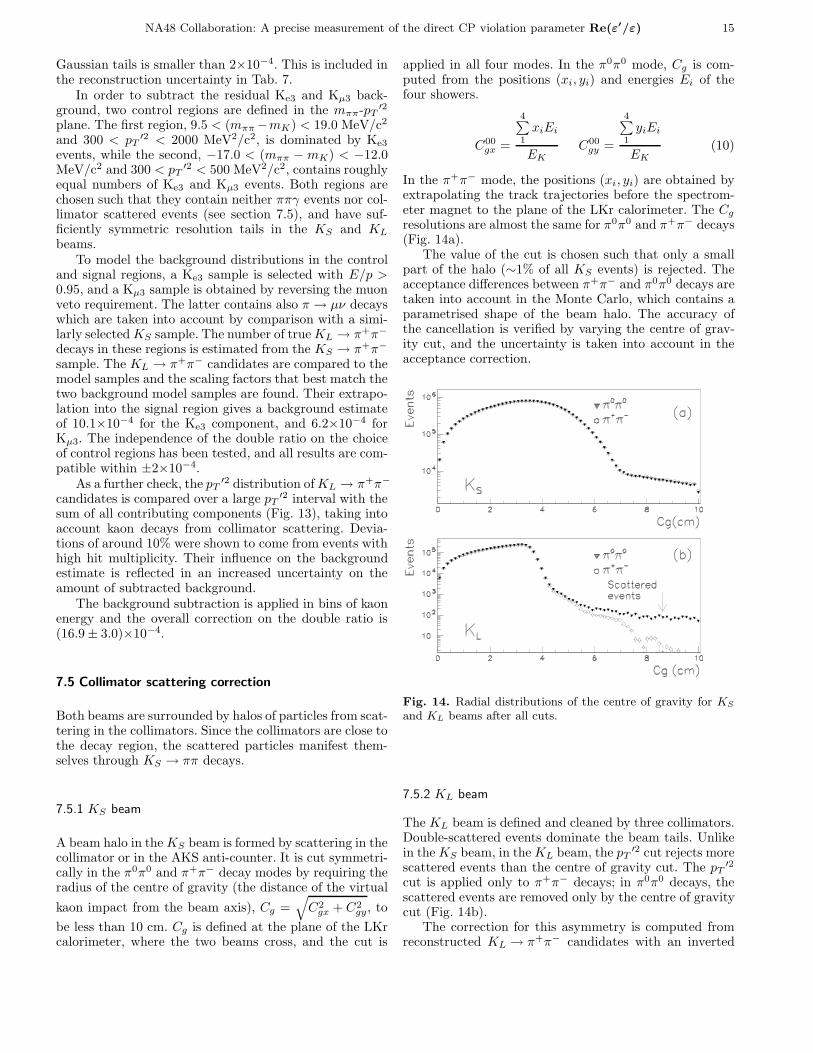
applied in all four modes. In the π0π0 mode, Cg is com-puted from the positions (xi, yi) and energies Ei of thefour showers.
C00gx =
4∑
1xiEi
EKC00
gy =
4∑
1yiEi
EK(10)
In the π+π− mode, the positions (xi, yi) are obtained byextrapolating the track trajectories before the spectrom-eter magnet to the plane of the LKr calorimeter. The Cg
resolutions are almost the same for π0π0 and π+π− decays(Fig. 14a).
The value of the cut is chosen such that only a smallpart of the halo (∼1% of all KS events) is rejected. Theacceptance differences between π+π− and π0π0 decays aretaken into account in the Monte Carlo, which contains aparametrised shape of the beam halo. The accuracy ofthe cancellation is verified by varying the centre of grav-ity cut, and the uncertainty is taken into account in theacceptance correction.
Fig. 14. Radial distributions of the centre of gravity for KS
and KL beams after all cuts.
7.5.2 KL beam
The KL beam is defined and cleaned by three collimators.Double-scattered events dominate the beam tails. Unlikein the KS beam, in the KL beam, the pT
′2 cut rejects morescattered events than the centre of gravity cut. The pT
′2
cut is applied only to π+π− decays; in π0π0 decays, thescattered events are removed only by the centre of gravitycut (Fig. 14b).
The correction for this asymmetry is computed fromreconstructed KL → π+π− candidates with an inverted
16 NA48 Collaboration: A precise measurement of the direct CP violation parameter Re(ε′/ε)
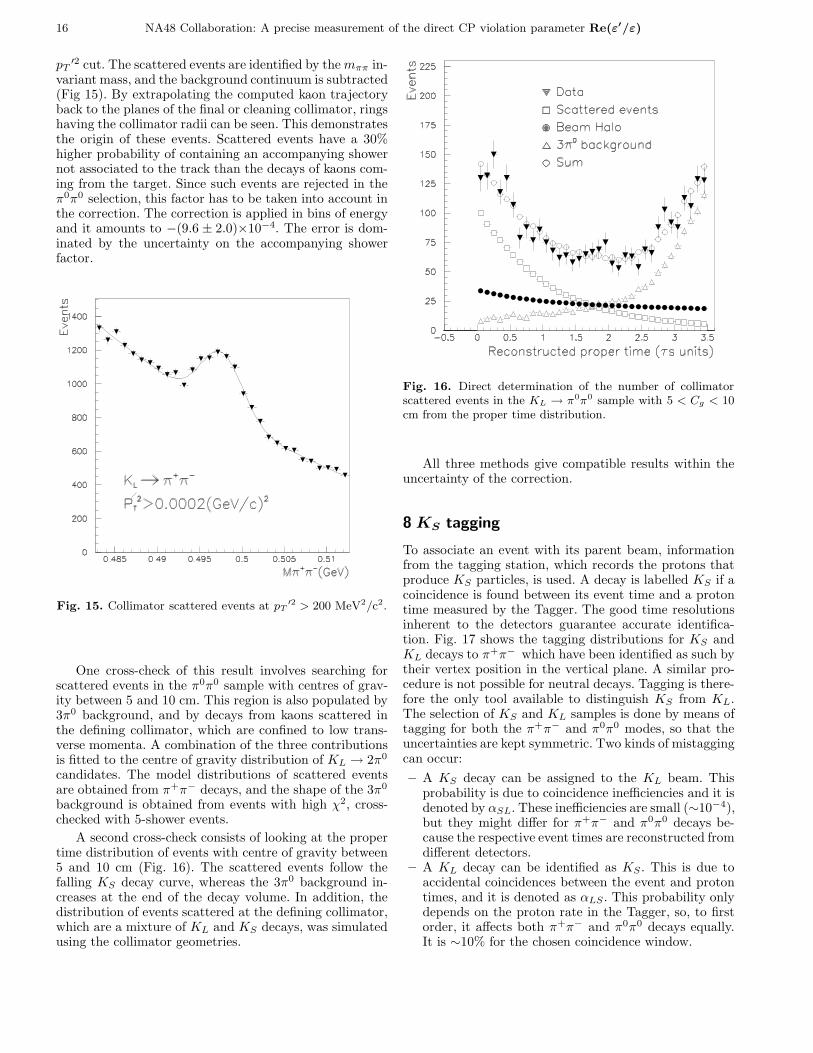
pT′2 cut. The scattered events are identified by the mππ in-
variant mass, and the background continuum is subtracted(Fig 15). By extrapolating the computed kaon trajectoryback to the planes of the final or cleaning collimator, ringshaving the collimator radii can be seen. This demonstratesthe origin of these events. Scattered events have a 30%higher probability of containing an accompanying showernot associated to the track than the decays of kaons com-ing from the target. Since such events are rejected in theπ0π0 selection, this factor has to be taken into account inthe correction. The correction is applied in bins of energyand it amounts to −(9.6 ± 2.0)×10−4. The error is dom-inated by the uncertainty on the accompanying showerfactor.
Fig. 15. Collimator scattered events at pT′2 > 200 MeV2/c2.
One cross-check of this result involves searching forscattered events in the π0π0 sample with centres of grav-ity between 5 and 10 cm. This region is also populated by3π0 background, and by decays from kaons scattered inthe defining collimator, which are confined to low trans-verse momenta. A combination of the three contributionsis fitted to the centre of gravity distribution of KL → 2π0
candidates. The model distributions of scattered eventsare obtained from π+π− decays, and the shape of the 3π0
background is obtained from events with high χ2, cross-checked with 5-shower events.
A second cross-check consists of looking at the propertime distribution of events with centre of gravity between5 and 10 cm (Fig. 16). The scattered events follow thefalling KS decay curve, whereas the 3π0 background in-creases at the end of the decay volume. In addition, thedistribution of events scattered at the defining collimator,which are a mixture of KL and KS decays, was simulatedusing the collimator geometries.
Fig. 16. Direct determination of the number of collimatorscattered events in the KL → π0π0 sample with 5 < Cg < 10cm from the proper time distribution.
All three methods give compatible results within theuncertainty of the correction.
8 KS tagging
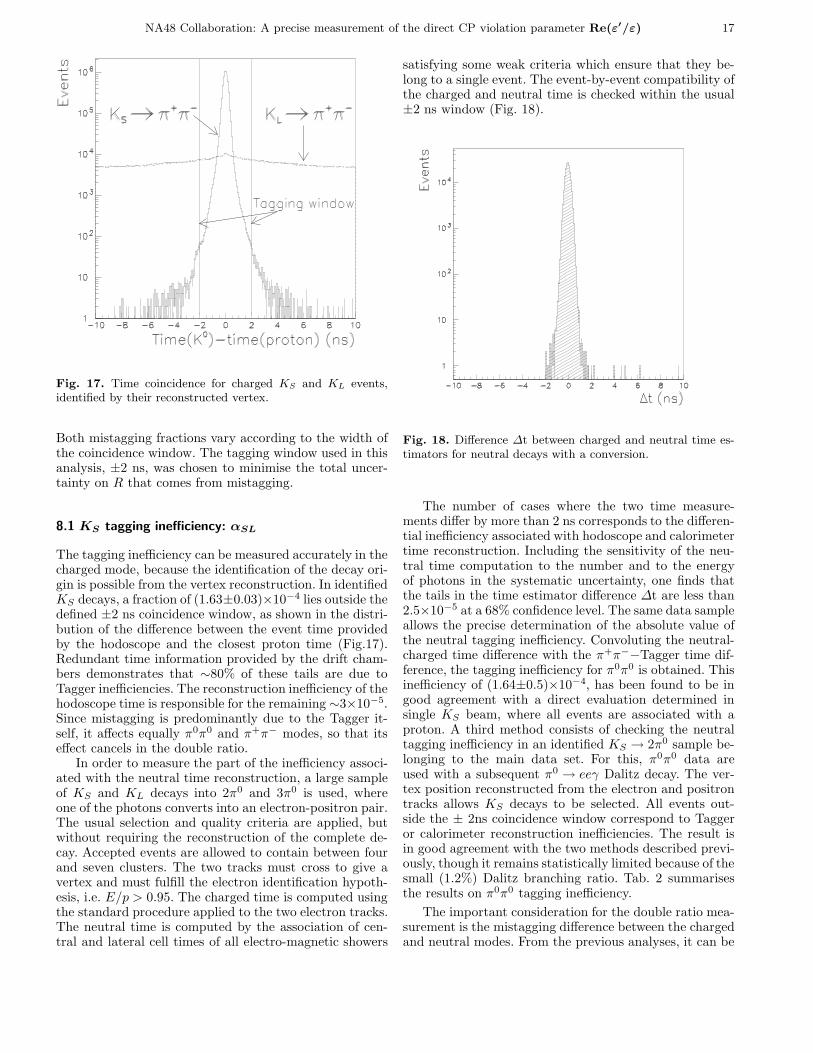
To associate an event with its parent beam, informationfrom the tagging station, which records the protons thatproduce KS particles, is used. A decay is labelled KS if acoincidence is found between its event time and a protontime measured by the Tagger. The good time resolutionsinherent to the detectors guarantee accurate identifica-tion. Fig. 17 shows the tagging distributions for KS andKL decays to π+π− which have been identified as such bytheir vertex position in the vertical plane. A similar pro-cedure is not possible for neutral decays. Tagging is there-fore the only tool available to distinguish KS from KL.The selection of KS and KL samples is done by means oftagging for both the π+π− and π0π0 modes, so that theuncertainties are kept symmetric. Two kinds of mistaggingcan occur:
– A KS decay can be assigned to the KL beam. Thisprobability is due to coincidence inefficiencies and it isdenoted by αSL. These inefficiencies are small (∼10−4),but they might differ for π+π− and π0π0 decays be-cause the respective event times are reconstructed fromdifferent detectors.
– A KL decay can be identified as KS . This is due toaccidental coincidences between the event and protontimes, and it is denoted as αLS . This probability onlydepends on the proton rate in the Tagger, so, to firstorder, it affects both π+π− and π0π0 decays equally.It is ∼10% for the chosen coincidence window.
NA48 Collaboration: A precise measurement of the direct CP violation parameter Re(ε′/ε) 17
Fig. 17. Time coincidence for charged KS and KL events,identified by their reconstructed vertex.
Both mistagging fractions vary according to the width ofthe coincidence window. The tagging window used in thisanalysis, ±2 ns, was chosen to minimise the total uncer-tainty on R that comes from mistagging.
8.1 KS tagging inefficiency: αSL
The tagging inefficiency can be measured accurately in thecharged mode, because the identification of the decay ori-gin is possible from the vertex reconstruction. In identifiedKS decays, a fraction of (1.63±0.03)×10−4 lies outside thedefined ±2 ns coincidence window, as shown in the distri-bution of the difference between the event time providedby the hodoscope and the closest proton time (Fig.17).Redundant time information provided by the drift cham-bers demonstrates that ∼80% of these tails are due toTagger inefficiencies. The reconstruction inefficiency of thehodoscope time is responsible for the remaining ∼3×10⁻⁵.Since mistagging is predominantly due to the Tagger it-self, it affects equally π0π0 and π+π− modes, so that itseffect cancels in the double ratio.
In order to measure the part of the inefficiency associ-ated with the neutral time reconstruction, a large sampleof KS and KL decays into 2π0 and 3π0 is used, whereone of the photons converts into an electron-positron pair.The usual selection and quality criteria are applied, butwithout requiring the reconstruction of the complete de-cay. Accepted events are allowed to contain between fourand seven clusters. The two tracks must cross to give avertex and must fulfill the electron identification hypoth-esis, i.e. E/p > 0.95. The charged time is computed usingthe standard procedure applied to the two electron tracks.The neutral time is computed by the association of cen-tral and lateral cell times of all electro-magnetic showers
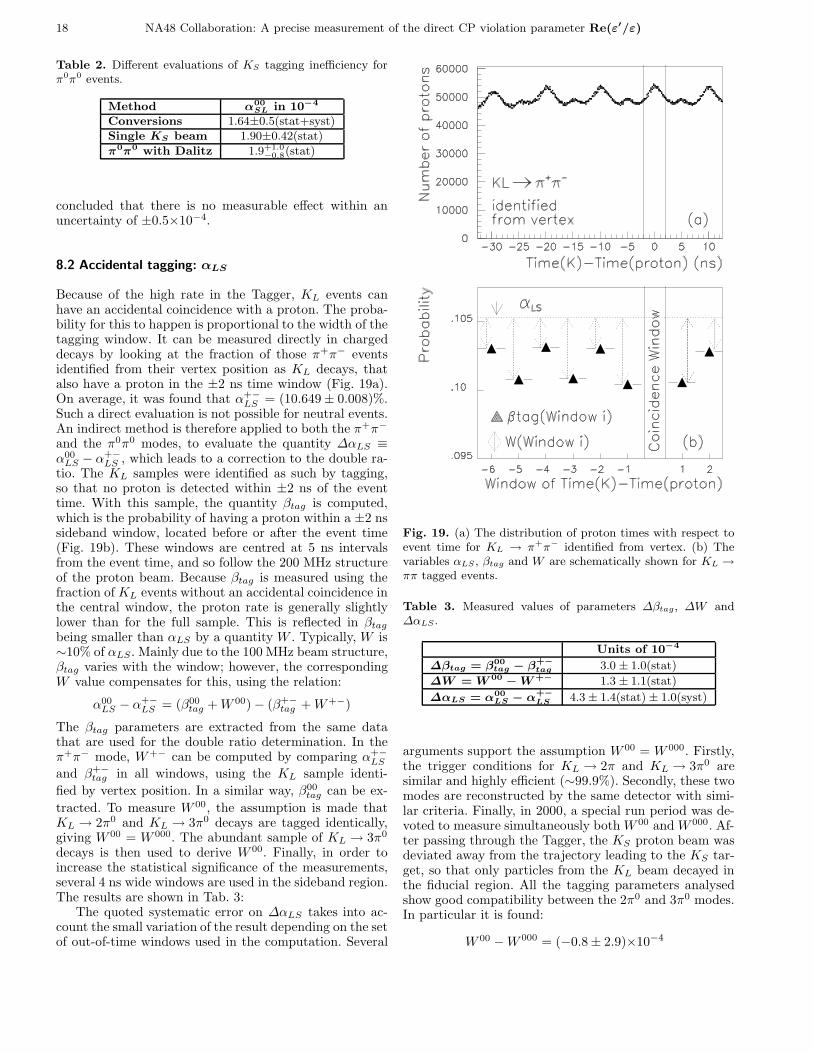
satisfying some weak criteria which ensure that they be-long to a single event. The event-by-event compatibility ofthe charged and neutral time is checked within the usual±2 ns window (Fig. 18).
Fig. 18. Difference ∆t between charged and neutral time es-timators for neutral decays with a conversion.
The number of cases where the two time measure-ments differ by more than 2 ns corresponds to the differen-tial inefficiency associated with hodoscope and calorimetertime reconstruction. Including the sensitivity of the neu-tral time computation to the number and to the energyof photons in the systematic uncertainty, one finds thatthe tails in the time estimator difference ∆t are less than2.5×10−5 at a 68% confidence level. The same data sampleallows the precise determination of the absolute value ofthe neutral tagging inefficiency. Convoluting the neutral-charged time difference with the π+π−−Tagger time dif-ference, the tagging inefficiency for π0π0 is obtained. Thisinefficiency of (1.64±0.5)×10−4, has been found to be ingood agreement with a direct evaluation determined insingle KS beam, where all events are associated with aproton. A third method consists of checking the neutraltagging inefficiency in an identified KS → 2π0 sample be-longing to the main data set. For this, π0π0 data areused with a subsequent π0 → eeγ Dalitz decay. The ver-tex position reconstructed from the electron and positrontracks allows KS decays to be selected. All events out-side the ± 2ns coincidence window correspond to Taggeror calorimeter reconstruction inefficiencies. The result isin good agreement with the two methods described previ-ously, though it remains statistically limited because of thesmall (1.2%) Dalitz branching ratio. Tab. 2 summarisesthe results on π0π0 tagging inefficiency.
The important consideration for the double ratio mea-surement is the mistagging difference between the chargedand neutral modes. From the previous analyses, it can be
18 NA48 Collaboration: A precise measurement of the direct CP violation parameter Re(ε′/ε)
Table 2. Different evaluations of KS tagging inefficiency forπ0π0 events.
Method α00SL in 10−4
Conversions 1.64±0.5(stat+syst)Single KS beam 1.90±0.42(stat)
π0π0 with Dalitz 1.9+1.0−0.8(stat)
concluded that there is no measurable effect within anuncertainty of ±0.5×10⁻⁴.
8.2 Accidental tagging: αLS
Because of the high rate in the Tagger, KL events canhave an accidental coincidence with a proton. The proba-bility for this to happen is proportional to the width of thetagging window. It can be measured directly in chargeddecays by looking at the fraction of those π+π− eventsidentified from their vertex position as KL decays, thatalso have a proton in the ±2 ns time window (Fig. 19a).On average, it was found that α+−
LS = (10.649 ± 0.008)%.Such a direct evaluation is not possible for neutral events.An indirect method is therefore applied to both the π+π−
and the π0π0 modes, to evaluate the quantity ∆αLS ≡α00
LS − α+−
LS , which leads to a correction to the double ra-tio. The KL samples were identified as such by tagging,so that no proton is detected within ±2 ns of the eventtime. With this sample, the quantity βtag is computed,which is the probability of having a proton within a ±2 nssideband window, located before or after the event time(Fig. 19b). These windows are centred at 5 ns intervalsfrom the event time, and so follow the 200 MHz structureof the proton beam. Because βtag is measured using thefraction of KL events without an accidental coincidence inthe central window, the proton rate is generally slightlylower than for the full sample. This is reflected in βtag
being smaller than αLS by a quantity W . Typically, W is∼10% of αLS. Mainly due to the 100 MHz beam structure,βtag varies with the window; however, the correspondingW value compensates for this, using the relation:
α00LS − α+−
LS = (β00tag + W 00) − (β+−
tag + W+−)
The βtag parameters are extracted from the same datathat are used for the double ratio determination. In theπ+π− mode, W+− can be computed by comparing α+−
LS
and β+−
tag in all windows, using the KL sample identi-
fied by vertex position. In a similar way, β00tag can be ex-
tracted. To measure W 00, the assumption is made thatKL → 2π0 and KL → 3π0 decays are tagged identically,giving W 00 = W 000. The abundant sample of KL → 3π0
decays is then used to derive W 00. Finally, in order toincrease the statistical significance of the measurements,several 4 ns wide windows are used in the sideband region.The results are shown in Tab. 3:
The quoted systematic error on ∆αLS takes into ac-count the small variation of the result depending on the setof out-of-time windows used in the computation. Several
Fig. 19. (a) The distribution of proton times with respect toevent time for KL → π+π− identified from vertex. (b) Thevariables αLS , βtag and W are schematically shown for KL →ππ tagged events.
Table 3. Measured values of parameters ∆βtag, ∆W and∆αLS.
Units of 10−4
∆βtag = β00tag − β+−
tag 3.0 ± 1.0(stat)
∆W = W 00− W +− 1.3 ± 1.1(stat)
∆αLS = α00LS − α+−
LS 4.3 ± 1.4(stat) ± 1.0(syst)
arguments support the assumption W 00 = W 000. Firstly,the trigger conditions for KL → 2π and KL → 3π0 aresimilar and highly efficient (∼99.9%). Secondly, these twomodes are reconstructed by the same detector with simi-lar criteria. Finally, in 2000, a special run period was de-voted to measure simultaneously both W 00 and W 000. Af-ter passing through the Tagger, the KS proton beam wasdeviated away from the trajectory leading to the KS tar-get, so that only particles from the KL beam decayed inthe fiducial region. All the tagging parameters analysedshow good compatibility between the 2π0 and 3π0 modes.In particular it is found:
W 00 − W 000 = (−0.8 ± 2.9)×10−4
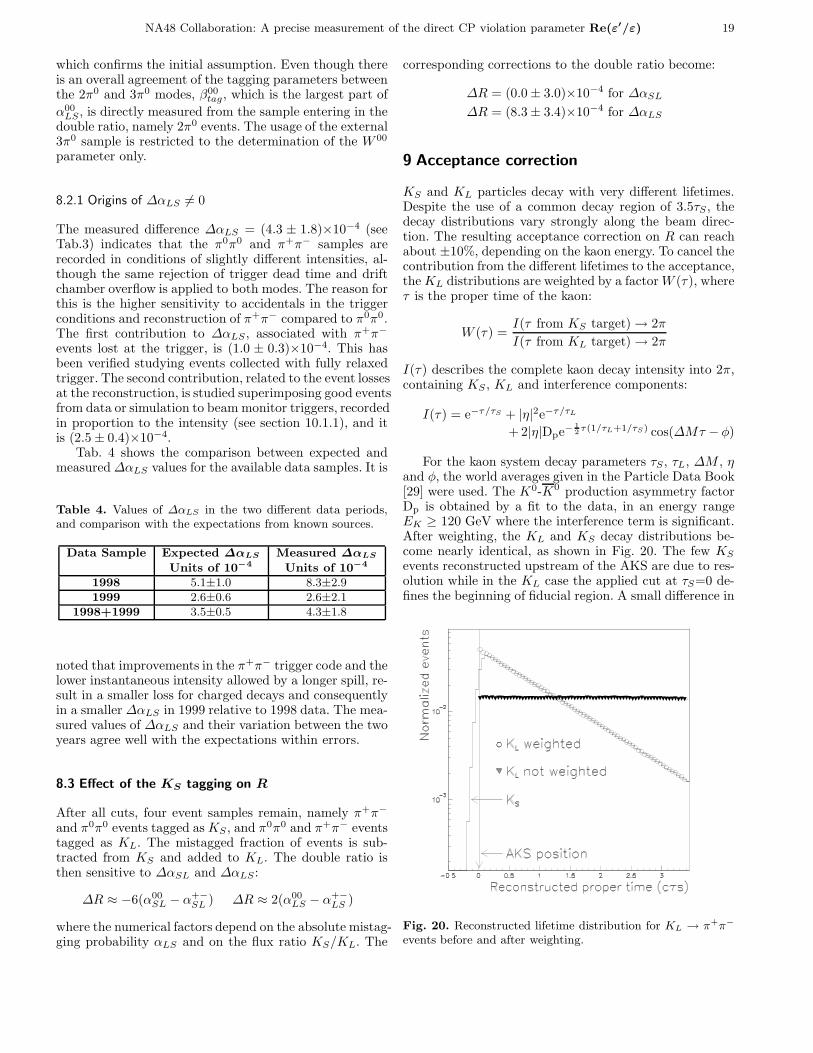
NA48 Collaboration: A precise measurement of the direct CP violation parameter Re(ε′/ε) 19
which confirms the initial assumption. Even though thereis an overall agreement of the tagging parameters betweenthe 2π0 and 3π0 modes, β00
tag, which is the largest part of
α00LS , is directly measured from the sample entering in the
double ratio, namely 2π0 events. The usage of the external3π0 sample is restricted to the determination of the W 00
parameter only.
8.2.1 Origins of ∆αLS 6= 0
The measured difference ∆αLS = (4.3 ± 1.8)×10−4 (seeTab.3) indicates that the π0π0 and π+π− samples arerecorded in conditions of slightly different intensities, al-though the same rejection of trigger dead time and driftchamber overflow is applied to both modes. The reason forthis is the higher sensitivity to accidentals in the triggerconditions and reconstruction of π+π− compared to π0π0.The first contribution to ∆αLS , associated with π+π−
events lost at the trigger, is (1.0 ± 0.3)×10−4. This hasbeen verified studying events collected with fully relaxedtrigger. The second contribution, related to the event lossesat the reconstruction, is studied superimposing good eventsfrom data or simulation to beam monitor triggers, recordedin proportion to the intensity (see section 10.1.1), and itis (2.5 ± 0.4)×10−4.
Tab. 4 shows the comparison between expected andmeasured ∆αLS values for the available data samples. It is
Table 4. Values of ∆αLS in the two different data periods,and comparison with the expectations from known sources.
Data Sample Expected ∆αLS Measured ∆αLS
Units of 10−4 Units of 10−4
1998 5.1±1.0 8.3±2.91999 2.6±0.6 2.6±2.1
1998+1999 3.5±0.5 4.3±1.8
noted that improvements in the π+π− trigger code and thelower instantaneous intensity allowed by a longer spill, re-sult in a smaller loss for charged decays and consequentlyin a smaller ∆αLS in 1999 relative to 1998 data. The mea-sured values of ∆αLS and their variation between the twoyears agree well with the expectations within errors.
8.3 Effect of the KS tagging on R
After all cuts, four event samples remain, namely π+π−
and π0π0 events tagged as KS , and π0π0 and π+π− eventstagged as KL. The mistagged fraction of events is sub-tracted from KS and added to KL. The double ratio isthen sensitive to ∆αSL and ∆αLS :
∆R ≈ −6(α00SL − α+−
SL ) ∆R ≈ 2(α00LS − α+−
LS )
where the numerical factors depend on the absolute mistag-ging probability αLS and on the flux ratio KS/KL. The
corresponding corrections to the double ratio become:
∆R = (0.0 ± 3.0)×10−4 for ∆αSL
∆R = (8.3 ± 3.4)×10−4 for ∆αLS
9 Acceptance correction
KS and KL particles decay with very different lifetimes.Despite the use of a common decay region of 3.5τS, thedecay distributions vary strongly along the beam direc-tion. The resulting acceptance correction on R can reachabout ±10%, depending on the kaon energy. To cancel thecontribution from the different lifetimes to the acceptance,the KL distributions are weighted by a factor W (τ), whereτ is the proper time of the kaon:
W (τ) =I(τ from KS target) → 2π
I(τ from KL target) → 2π
I(τ) describes the complete kaon decay intensity into 2π,containing KS , KL and interference components:
I(τ) = e−τ/τS + |η|2e−τ/τL
+ 2|η|Dpe−1
2τ(1/τL+1/τS) cos(∆Mτ − φ)
For the kaon system decay parameters τS , τL, ∆M , ηand φ, the world averages given in the Particle Data Book[29] were used. The K0-K0 production asymmetry factorDp is obtained by a fit to the data, in an energy rangeEK ≥ 120 GeV where the interference term is significant.After weighting, the KL and KS decay distributions be-come nearly identical, as shown in Fig. 20. The few KS
events reconstructed upstream of the AKS are due to res-olution while in the KL case the applied cut at τS=0 de-fines the beginning of fiducial region. A small difference in
Fig. 20. Reconstructed lifetime distribution for KL → π+π−
events before and after weighting.
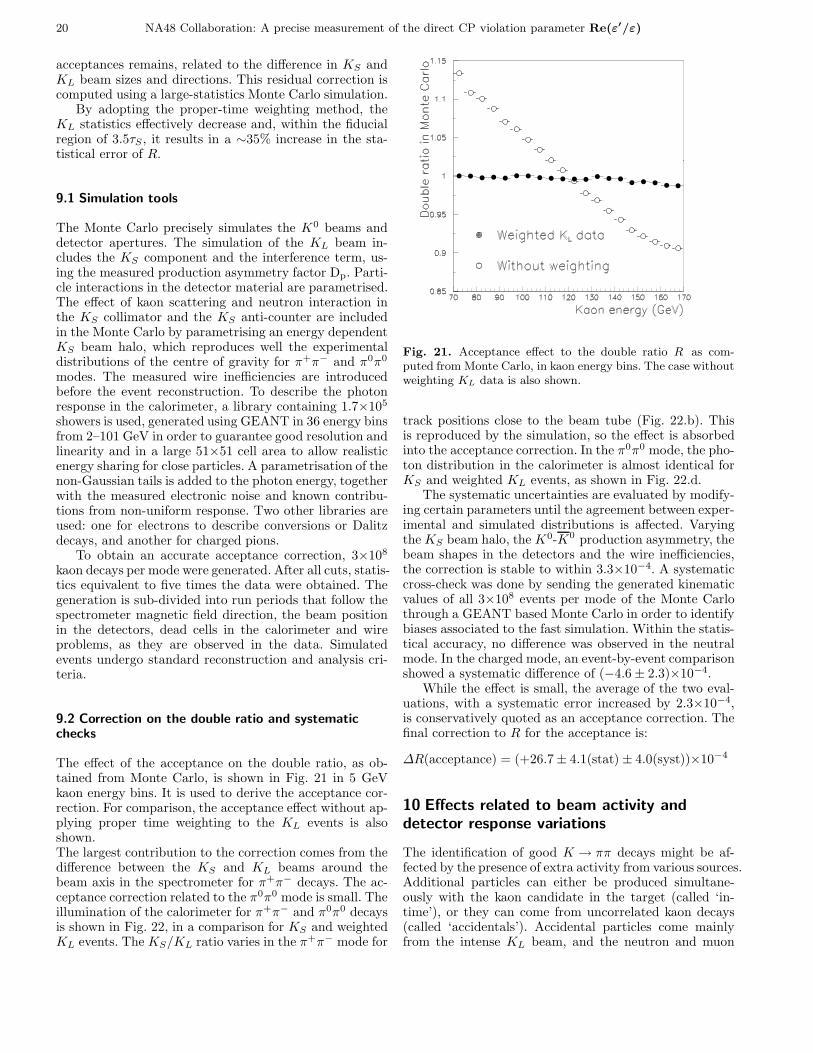
20 NA48 Collaboration: A precise measurement of the direct CP violation parameter Re(ε′/ε)
acceptances remains, related to the difference in KS andKL beam sizes and directions. This residual correction iscomputed using a large-statistics Monte Carlo simulation.
By adopting the proper-time weighting method, theKL statistics effectively decrease and, within the fiducialregion of 3.5τS , it results in a ∼35% increase in the sta-tistical error of R.
9.1 Simulation tools
The Monte Carlo precisely simulates the K0 beams anddetector apertures. The simulation of the KL beam in-cludes the KS component and the interference term, us-ing the measured production asymmetry factor Dp. Parti-cle interactions in the detector material are parametrised.The effect of kaon scattering and neutron interaction inthe KS collimator and the KS anti-counter are includedin the Monte Carlo by parametrising an energy dependentKS beam halo, which reproduces well the experimentaldistributions of the centre of gravity for π+π− and π0π0
modes. The measured wire inefficiencies are introducedbefore the event reconstruction. To describe the photonresponse in the calorimeter, a library containing 1.7×10⁵
showers is used, generated using GEANT in 36 energy binsfrom 2–101 GeV in order to guarantee good resolution andlinearity and in a large 51×51 cell area to allow realisticenergy sharing for close particles. A parametrisation of thenon-Gaussian tails is added to the photon energy, togetherwith the measured electronic noise and known contribu-tions from non-uniform response. Two other libraries areused: one for electrons to describe conversions or Dalitzdecays, and another for charged pions.
To obtain an accurate acceptance correction, 3×10⁸
kaon decays per mode were generated. After all cuts, statis-tics equivalent to five times the data were obtained. Thegeneration is sub-divided into run periods that follow thespectrometer magnetic field direction, the beam positionin the detectors, dead cells in the calorimeter and wireproblems, as they are observed in the data. Simulatedevents undergo standard reconstruction and analysis cri-teria.
9.2 Correction on the double ratio and systematicchecks
The effect of the acceptance on the double ratio, as ob-tained from Monte Carlo, is shown in Fig. 21 in 5 GeVkaon energy bins. It is used to derive the acceptance cor-rection. For comparison, the acceptance effect without ap-plying proper time weighting to the KL events is alsoshown.The largest contribution to the correction comes from thedifference between the KS and KL beams around thebeam axis in the spectrometer for π+π− decays. The ac-ceptance correction related to the π0π0 mode is small. Theillumination of the calorimeter for π+π− and π0π0 decaysis shown in Fig. 22, in a comparison for KS and weightedKL events. The KS/KL ratio varies in the π+π− mode for
Fig. 21. Acceptance effect to the double ratio R as com-puted from Monte Carlo, in kaon energy bins. The case withoutweighting KL data is also shown.
track positions close to the beam tube (Fig. 22.b). Thisis reproduced by the simulation, so the effect is absorbedinto the acceptance correction. In the π0π0 mode, the pho-ton distribution in the calorimeter is almost identical forKS and weighted KL events, as shown in Fig. 22.d.
The systematic uncertainties are evaluated by modify-ing certain parameters until the agreement between exper-imental and simulated distributions is affected. Varyingthe KS beam halo, the K0-K0 production asymmetry, thebeam shapes in the detectors and the wire inefficiencies,the correction is stable to within 3.3×10⁻⁴. A systematiccross-check was done by sending the generated kinematicvalues of all 3×10⁸ events per mode of the Monte Carlothrough a GEANT based Monte Carlo in order to identifybiases associated to the fast simulation. Within the statis-tical accuracy, no difference was observed in the neutralmode. In the charged mode, an event-by-event comparisonshowed a systematic difference of (−4.6 ± 2.3)×10−4.
While the effect is small, the average of the two eval-uations, with a systematic error increased by 2.3×10⁻⁴,is conservatively quoted as an acceptance correction. Thefinal correction to R for the acceptance is:
∆R(acceptance) = (+26.7 ± 4.1(stat) ± 4.0(syst))×10−4
10 Effects related to beam activity and
detector response variations
The identification of good K → ππ decays might be af-fected by the presence of extra activity from various sources.Additional particles can either be produced simultane-ously with the kaon candidate in the target (called ‘in-time’), or they can come from uncorrelated kaon decays(called ‘accidentals’). Accidental particles come mainlyfrom the intense KL beam, and the neutron and muon

NA48 Collaboration: A precise measurement of the direct CP violation parameter Re(ε′/ε) 21
Fig. 22. The calorimeter illumination by π+π− tracks for KS
and KL weighted events is shown in (a), while the KS/KL ratiofor data and MC is shown in (b). Similarly, the calorimeterillumination for photons as a function of the radius for π0π0 isshown in (c), with the KS/KL ratio for data and MC shownin (d). Distributions are shown for events in the kaon energyrange 95-100 GeV.
components accompanying it. In-time background is ef-fectively suppressed for KL decays given the beam colli-mation and the extensive shielding, while in the KS beama possible additional in-time component needs to be con-sidered. Beam intensity variations do not affect the doubleratio, thanks to the concurrent recording of all four modes.However, slow variations of the KS/KL intensity duringthe run that accidentally coincide with unaccounted vari-ations in the charged-to-neutral event ratio (e.g. from achange in the detector response), would lead to a bias. Themeasured variance of the KS/KL intensity ratio is ∼9%,while the π+π−/π0π0 ratio, corrected for trigger ineffi-ciency, varied by 1–2% during the 1998-1999 data period.The potentially resulting effect is taken into account in theanalysis by weighting the KS events by a factor extractedfrom KS/KL intensity variation monitoring. The effect ofthis weighting on R is small (≤ 3×10⁻⁴), indicating thatboth the beams and the detectors were sufficiently stableduring the two years of data taking.
10.1 Accidental activity
The pile-up of extra particles with a good event may resultin an event loss, depending on the time and space sepa-ration in the detector. Owing to the simultaneous datataking, KS and KL events are equally sensitive to the ac-cidental beam activity, to first order. A residual effect on
R can be written as:
∆R = (∆R)intensity + (∆R)geometry (11)
The two terms have the following origins:
1. The intensity term, (∆R)intensity, appears if thereis a decorrelation between the two beams. Describ-ing the KS and KL beam intensity time dependencesas IS,L(t)= 〈IS,L〉×(1+ηS,L(t)), this would mean thatηS(t) and ηL(t) differ. If in addition the mean π+π−
and π0π0 losses (λ+− and λ00 respectively) are notequal an effect on the double ratio can be expected.Assuming that losses depend linearly on the beam in-tensity this effect is given by:
(∆R)intensity = (λ+− − λ00) × 〈ηL(ηL − ηS)〉 (12)
2. The illumination term, (∆R)geometry, is non-zero ifaccidental losses depend on the detector illumination,since the latter is slightly different for the KS and KL
beams. This can influence the double ratio if it is notequal for π0π0 and π+π− events. The correspondingeffect can be expressed as:
(∆R)geometry = (δλ+− − δλ00) × (1 + 〈ηLηL〉) (13)
where δλ represents the difference in losses betweenthe KS and KL beams.
The measurement of event losses induced by extra activ-ity is necessary for evaluating these terms. This is donethrough the overlay method.
10.1.1 Overlay method
Losses from accidental activity can be simulated by over-laying data with special beam monitor (BM) triggers. Beammonitors (see section 5.3) trigger in proportion to the KS
and KL beam intensities, so that the BM triggers give apicture of the ambient activity and noise measured by thedetectors at a given time. Detector information for theevent and the BM trigger are superimposed, and the so-called overlaid event undergoes the usual reconstruction.For this purpose only BM triggers without DCH overflowcondition are used. After applying the standard analysisprocedure, the probability of losing or gaining an event iscomputed by comparing, event-by-event, the original andoverlaid samples. This method allows the effect of the ex-tra activity and noise that was present when the data wasrecorded to be reproduced and measured. However, themethod depends on how well the BM trigger content de-scribes the intensity variations seen by the data. A com-parative study of the extra activity in BM triggers andkaon events showed an agreement that was better than97%.
To overcome the problem of doubling the detector noisein the overlaid event, leading to an overestimation of thelosses, an alternative method is used in parallel: the over-laid Monte Carlo (OMC). This consists of using the BMtriggers to overlay noiseless Monte Carlo events, instead

22 NA48 Collaboration: A precise measurement of the direct CP violation parameter Re(ε′/ε)
of overlaying data. A small fraction of Monte Carlo eventswere overlaid consecutively with two different BM triggers(doubly overlaid Monte Carlo, or DOMC), in order to al-low a direct comparison with the losses computed fromoverlaid data.
With these methods, two sources of losses and gainsfor good events were identified:
– The mortality due to a BM trigger. A BM trigger con-taining extra activity has an enhanced probability ofkilling an event in the overlay procedure. The extraactivity depends on the beam intensity. Because of thedifferent selection criteria, this would affect the π+π−
and π0π0 modes asymmetrically. Examples of cuts sen-sitive to the intensity include the muon veto in π+π−
and the rejection of extra photon clusters in π0π0.– Noise in a detector. An event can be lost or gained after
the overlay owing to migration across cut boundaries.Certain selection criteria are sensitive to noise, like theχ2 distribution in π0π0. Losses caused by noise do notdepend on the beam intensity.
The overall effect of the overlay is dominated by losses.The net effect of the overlay (losses minus gains) is shownin Tab. 5. OMC describes the reconstruction losses due toaccidental activity and noise. Losses in the charged modeare dominated by the DCH multiplicity overflow condi-tion, while in the neutral mode the χ2 cut accounts for thebulk of the losses. Results obtained by comparing DOMCand OMC are directly comparable to those from the over-laid data. The agreement is reasonable in the π0π0 mode.DOMC gives slightly fewer losses in the π+π− mode. Thisis associated with the smaller DCH multiplicity conditionrate in DOMC.
Table 5. Net effect of accidental activity, computed using dataand Monte Carlo events overlaid with BM triggers.The LKrnoise effect is subtracted. The DOMC column represents dif-ferences between first and second overlay.
Losses–Gains OMC DOMC Data overlay
π0π0 0.8% 1.5% 1.4%
π+π− 1.8% 2.5% 2.8%
π+π−− π0π0 1.0% 1.1% 1.4%
In order to explore the losses throughout the entirerange of beam intensity, information from the beam mon-itor, placed at the end of the beam tube, is used. In Fig. 23,the net accidental effect, computed from OMC, is shownfor π+π− and π0π0 events as a function of the recordedintensity at the time of the BM trigger used for the over-lay. Losses increase faster in π+π− than in π0π0 events.The overall behaviour is compatible with the assumptionthat the dependence of accidental losses with the rate islinear.
In what follows, the conservative value computed fromdata overlay is assigned to the difference of the effectof accidental activity on π+π− and π0π0 events, namelyλ+− − λ00 = (1.4 ± 0.7)%.
Fig. 23. Losses as a function of the intensity seen by the BMtrigger, computed by the overlay method. Lines are plotted toguide the eye.
10.1.2 Effect on the Double Ratio
Having measured the accidental losses for π+π− and π0π0
events, the two terms of Eq. 11 can be computed. The in-tensity variation term, (∆R)intensity, depends upon howwell the variations of the two beams (ηS , ηL) mimic oneother, as well as upon the differential losses between theπ+π− and π0π0 modes (λ+−, λ00), according to Eq. 12.Several estimators have been used to study a possible dif-ference in the activity of the two beams, based on acci-dental information in good events. Among these are thenumber of hits in the AKL counters, the number of ac-cidental clusters in the LKr calorimeter, and the numberof extra tracks, all of which have been measured in bothKS and KL events. The corresponding occurrence ratesfor these estimators are similar in the two beams. An in-dependent method to measure the difference involves ex-amining the correlation between the KS and KL beams.All results agree that, to within 1%, there is no inten-sity difference seen by KS and KL events. So from Eq. 12we obtain (∆R)intensity = ±3×10⁻⁴, where an additional,conservative factor of two is used in the uncertainty, to ac-count for a possible non-linear dependence of losses withthe intensity.
The illumination term, (∆R)geometry, is estimated bythe overlay method with data or Monte Carlo events.Both computations agree that there is no significant effectwithin available precision. The interpretation of the resultis that all sources of losses are uniformly distributed inthe acceptance. An upper bound on the illumination termcan be quoted, according to the statistical significance ofthe measurement, namely (∆R)geometry = ±3×10⁻⁴. Fi-nally, the uncertainty on the double ratio from accidentalactivity is:
∆R = (∆R)intensity + (∆R)geometry = ±4.2×10⁻⁴

NA48 Collaboration: A precise measurement of the direct CP violation parameter Re(ε′/ε) 23
Table 6. Number of selected events after accounting formistagging.
Statistics in millions1998 1999 total
KL → π0π0 1.047 2.243 3.290KS → π0π0 1.638 3.571 5.209KL → π+π− 4.541 9.912 14.453KS → π+π− 6.910 15.311 22.221
Statistical error 18.0×10⁻⁴ 12.2×10⁻⁴ 10.1×10⁻⁴
10.2 In-time activity
Particles produced in the KL target, in time with the KL
are well suppressed by the 120 m of collimation and mag-nets. In the KS case, the 6 m collimator occasionally al-lows in-time particles to survive into the decay region, andto be detected together with a good kaon decay.
To put bounds on such effects, the π0π0 sample accu-mulated in single KS runs is used. The low intensity ofthe KS beam ensures the absence of accidental particles.The π0π0 mode was chosen for the clean identification ofthe number of in-time clusters; in the charged mode, theextended and irregular hadronic showers could bias thestudy. By removing the extra (in-time) cluster cut, theπ0π0 signal is enriched with the following events: π0π0
events which have a photon conversion, giving 5-clusterfinal modes and π0π0 events with additional in-time par-ticles. Only in the case of photon conversion is the recon-structed χ2 deteriorated. By comparing the experimentalχ2 distribution of 2π0 events with five clusters to the onepredicted by Monte Carlo solely for conversions, an excessof (0.7 ± 0.4)×10−4 was found. This would correspond tothe in-time activity, and has been cross-checked using var-ious time windows for the extra-activity. Therefore, an up-per bound on the in-time contamination in the KS beamcan be set to 1×10⁻⁴. This is included in the uncertaintyon accidental activity in Tab. 7.
11 Result
The number of events passing all selection criteria, takinginto account KS mistagging, is shown in Tab. 6 and theirenergy distribution in Fig. 24. The final result is com-puted by dividing the data into 20 bins of kaon energyfrom 70 to 170 GeV, and calculating the double ratio foreach bin using proper-time weighted KL samples. All cor-rections are applied to each bin separately, and the resultsare averaged. In order to avoid a statistical bias, instead ofthe simple weighted mean, the bins are averaged using astatistically unbiased logarithmic estimator. The averageeffects of the corrections on the raw double ratio, togetherwith their uncertainties, are summarised in Tab. 7.
After applying all corrections to the double ratio, theresult is
R = (0.99098± 0.00101(stat) ± 0.00126(syst)) (14)
Fig. 24. Energy distribution of selected events after account-ing for mistagging and after proper-time weighting of KL
events.
Table 7. Corrections and systematic uncertainties on the dou-ble ratio. In order to obtain the effect on Re(ε′/ε), the numbersmust be divided by a factor of 6 (Eq. 1).
in 10−4
π+π− trigger inefficiency −3.6 ± 5.2AKS inefficiency +1.1 ± 0.4
Reconstructionof π0π0
of π+π−
—+2.0
± 5.8± 2.8
Backgroundto π0π0
to π+π−
−5.9+16.9
± 2.0± 3.0
Beam scattering −9.6 ± 2.0Accidental tagging +8.3 ± 3.4Tagging inefficiency — ± 3.0
Acceptancestatisticalsystematic
+26.7± 4.1± 4.0
Accidental activity — ± 4.4Long term variations of KS/KL — ± 0.6Total +35.9 ± 12.6
The stability of the result as a function of various measure-ment parameters was studied extensively. The double ratioas a function of the kaon energy is shown in Fig. 25. Thesize of the assigned systematic uncertainties was testedby varying the most important selection cuts. By changingthe background-rejection cuts, even large variations of theamount of subtracted background did not cause any shiftin the result greater than the estimated uncertainty onthe background. Similarly, no excessive deviations of themeasurement were observed by varying cuts related to theacceptance, KS-proton tagging, uncorrelated beam activ-ity, the decay volume and beam scattering (see Fig. 26).
The stability of the result was also tested with respectto the time variation of the measurement conditions. In
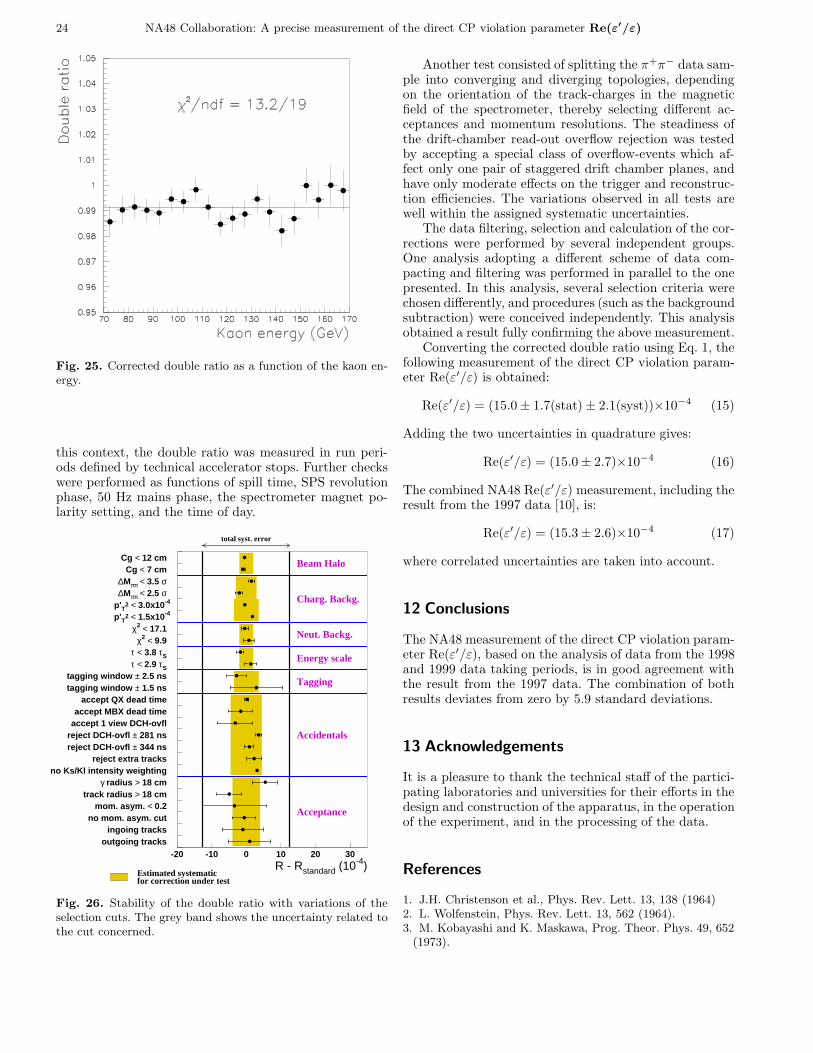
24 NA48 Collaboration: A precise measurement of the direct CP violation parameter Re(ε′/ε)
Fig. 25. Corrected double ratio as a function of the kaon en-ergy.
this context, the double ratio was measured in run peri-ods defined by technical accelerator stops. Further checkswere performed as functions of spill time, SPS revolutionphase, 50 Hz mains phase, the spectrometer magnet po-larity setting, and the time of day.
R - Rstandard (10-4)
Acceptance
Accidentals
Tagging
Energy scale
Neut. Backg.
Charg. Backg.
Beam Halo
total syst. error
Estimated systematicfor correction under test
outgoing tracksingoing tracks
no mom. asym. cutmom. asym. < 0.2
track radius > 18 cmγ radius > 18 cm
no Ks/Kl intensity weightingreject extra tracks
reject DCH-ovfl ± 344 nsreject DCH-ovfl ± 281 nsaccept 1 view DCH-ovflaccept MBX dead time
accept QX dead timetagging window ± 1.5 nstagging window ± 2.5 ns
τ < 2.9 τS
τ < 3.8 τS
χ2 < 9.9χ2 < 17.1
p'T2 < 1.5x10⁻⁴p'T2 < 3.0x10⁻⁴∆Mππ < 2.5 σ∆Mππ < 3.5 σ
Cg < 7 cmCg < 12 cm
-20 -10 0 10 20 30
Fig. 26. Stability of the double ratio with variations of theselection cuts. The grey band shows the uncertainty related tothe cut concerned.
Another test consisted of splitting the π+π− data sam-ple into converging and diverging topologies, dependingon the orientation of the track-charges in the magneticfield of the spectrometer, thereby selecting different ac-ceptances and momentum resolutions. The steadiness ofthe drift-chamber read-out overflow rejection was testedby accepting a special class of overflow-events which af-fect only one pair of staggered drift chamber planes, andhave only moderate effects on the trigger and reconstruc-tion efficiencies. The variations observed in all tests arewell within the assigned systematic uncertainties.
The data filtering, selection and calculation of the cor-rections were performed by several independent groups.One analysis adopting a different scheme of data com-pacting and filtering was performed in parallel to the onepresented. In this analysis, several selection criteria werechosen differently, and procedures (such as the backgroundsubtraction) were conceived independently. This analysisobtained a result fully confirming the above measurement.
Converting the corrected double ratio using Eq. 1, thefollowing measurement of the direct CP violation param-eter Re(ε′/ε) is obtained:
Re(ε′/ε) = (15.0 ± 1.7(stat) ± 2.1(syst))×10−4 (15)
Adding the two uncertainties in quadrature gives:
Re(ε′/ε) = (15.0 ± 2.7)×10−4 (16)
The combined NA48 Re(ε′/ε) measurement, including theresult from the 1997 data [10], is:
Re(ε′/ε) = (15.3 ± 2.6)×10−4 (17)
where correlated uncertainties are taken into account.
12 Conclusions
The NA48 measurement of the direct CP violation param-eter Re(ε′/ε), based on the analysis of data from the 1998and 1999 data taking periods, is in good agreement withthe result from the 1997 data. The combination of bothresults deviates from zero by 5.9 standard deviations.
13 Acknowledgements
It is a pleasure to thank the technical staff of the partici-pating laboratories and universities for their efforts in thedesign and construction of the apparatus, in the operationof the experiment, and in the processing of the data.
References
1. J.H. Christenson et al., Phys. Rev. Lett. 13, 138 (1964)2. L. Wolfenstein, Phys. Rev. Lett. 13, 562 (1964).3. M. Kobayashi and K. Maskawa, Prog. Theor. Phys. 49, 652
(1973).
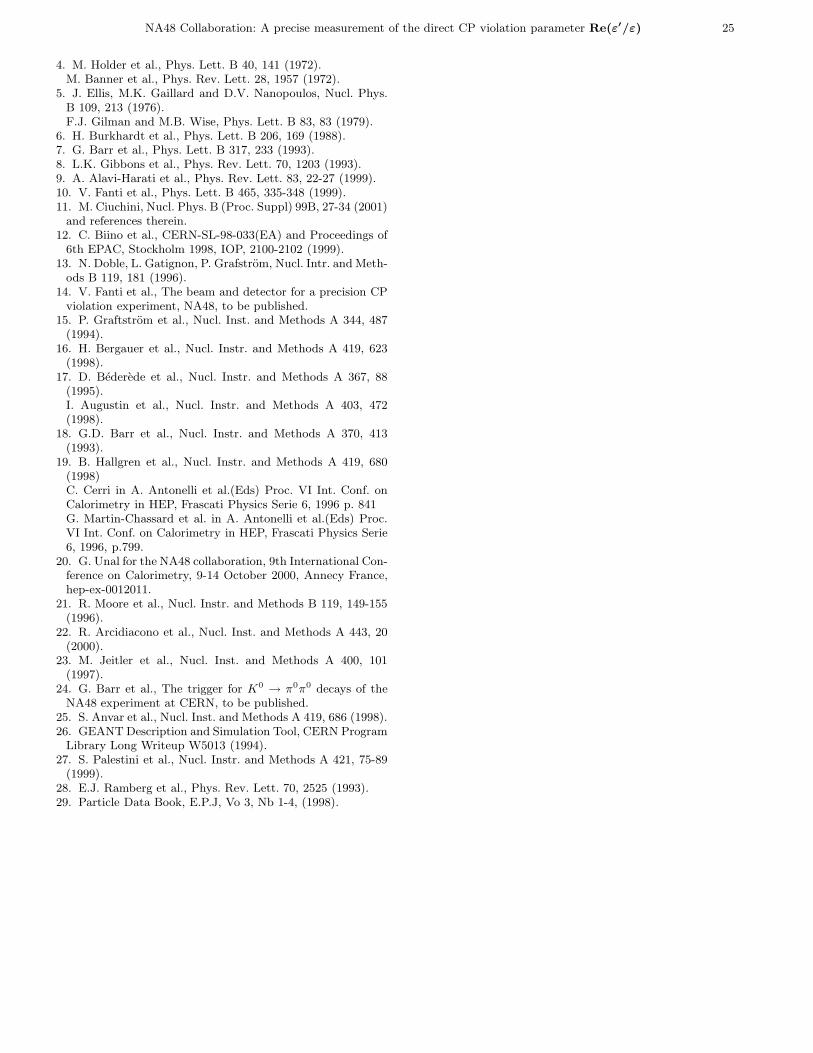
NA48 Collaboration: A precise measurement of the direct CP violation parameter Re(ε′/ε) 25
4. M. Holder et al., Phys. Lett. B 40, 141 (1972).M. Banner et al., Phys. Rev. Lett. 28, 1957 (1972).
5. J. Ellis, M.K. Gaillard and D.V. Nanopoulos, Nucl. Phys.B 109, 213 (1976).F.J. Gilman and M.B. Wise, Phys. Lett. B 83, 83 (1979).
6. H. Burkhardt et al., Phys. Lett. B 206, 169 (1988).7. G. Barr et al., Phys. Lett. B 317, 233 (1993).8. L.K. Gibbons et al., Phys. Rev. Lett. 70, 1203 (1993).9. A. Alavi-Harati et al., Phys. Rev. Lett. 83, 22-27 (1999).10. V. Fanti et al., Phys. Lett. B 465, 335-348 (1999).11. M. Ciuchini, Nucl. Phys. B (Proc. Suppl) 99B, 27-34 (2001)
and references therein.12. C. Biino et al., CERN-SL-98-033(EA) and Proceedings of
6th EPAC, Stockholm 1998, IOP, 2100-2102 (1999).13. N. Doble, L. Gatignon, P. Grafstrom, Nucl. Intr. and Meth-
ods B 119, 181 (1996).14. V. Fanti et al., The beam and detector for a precision CP
violation experiment, NA48, to be published.15. P. Graftstrom et al., Nucl. Inst. and Methods A 344, 487
(1994).16. H. Bergauer et al., Nucl. Instr. and Methods A 419, 623
(1998).17. D. Bederede et al., Nucl. Instr. and Methods A 367, 88
(1995).I. Augustin et al., Nucl. Instr. and Methods A 403, 472(1998).
18. G.D. Barr et al., Nucl. Instr. and Methods A 370, 413(1993).
19. B. Hallgren et al., Nucl. Instr. and Methods A 419, 680(1998)C. Cerri in A. Antonelli et al.(Eds) Proc. VI Int. Conf. onCalorimetry in HEP, Frascati Physics Serie 6, 1996 p. 841G. Martin-Chassard et al. in A. Antonelli et al.(Eds) Proc.VI Int. Conf. on Calorimetry in HEP, Frascati Physics Serie6, 1996, p.799.
20. G. Unal for the NA48 collaboration, 9th International Con-ference on Calorimetry, 9-14 October 2000, Annecy France,hep-ex-0012011.
21. R. Moore et al., Nucl. Instr. and Methods B 119, 149-155(1996).
22. R. Arcidiacono et al., Nucl. Inst. and Methods A 443, 20(2000).
23. M. Jeitler et al., Nucl. Inst. and Methods A 400, 101(1997).
24. G. Barr et al., The trigger for K0 → π0π0 decays of theNA48 experiment at CERN, to be published.
25. S. Anvar et al., Nucl. Inst. and Methods A 419, 686 (1998).26. GEANT Description and Simulation Tool, CERN Program
Library Long Writeup W5013 (1994).27. S. Palestini et al., Nucl. Instr. and Methods A 421, 75-89
(1999).28. E.J. Ramberg et al., Phys. Rev. Lett. 70, 2525 (1993).29. Particle Data Book, E.P.J, Vo 3, Nb 1-4, (1998).
Top Related