
γλώσσες
Σελίδες
Νομικός

Accepted Manuscript
Title: A novel biodegradable �-cyclodextrin-based hydrogelfor the removal of heavy metal ions
Author: Zhanhua Huang Qinling Wu Shouxin Liu Bin Zhang
PII: S0144-8617(13)00400-1DOI: http://dx.doi.org/doi:10.1016/j.carbpol.2013.04.047Reference: CARP 7663
To appear in:
Received date: 22-2-2013Revised date: 8-4-2013Accepted date: 12-4-2013
Please cite this article as: Huang, Z., Wu, Q., Liu, S., & Zhang, B., A novel biodegradable�-cyclodextrin-based hydrogel for the removal of heavy metal ions, CarbohydratePolymers (2013), http://dx.doi.org/10.1016/j.carbpol.2013.04.047
This is a PDF file of an unedited manuscript that has been accepted for publication.As a service to our customers we are providing this early version of the manuscript.The manuscript will undergo copyediting, typesetting, and review of the resulting proofbefore it is published in its final form. Please note that during the production processerrors may be discovered which could affect the content, and all legal disclaimers thatapply to the journal pertain.
Page 1 of 25
Accep
ted
Man
uscr
ipt
1
Highlights
►Novel β-cyclodextrin-based gel (CAM) with three-dimensional network
structure was obtained. ► CAM hydrogel is biodegraded by Gloeophyllum
trabeum. ► The biodegradation efficiency of CAM reached 79.4 % in
Gloeophyllum trabeum. ► CAM exhibited an excellent performance for
Pb2+
and Cu2+
.
Page 2 of 25
Accep
ted
Man
uscr
ipt
1
A novel biodegradable β-cyclodextrin-based hydrogel 1
for the removal of heavy metal ions 2
Zhanhua Huanga,b
*, Qinling Wub, Shouxin Liu
a, Bin Zhang
a 3
4
a Key Laboratory of Bio-based Material Science and Technology of 5
Ministry of Education, Northeast Forestry University, Harbin 150040, 6
China 7
b School of Renewable Natural Resources, Louisiana State University 8
Agricultural Center, Baton Rouge, LA 70803, USA 9
10
*Corresponding author: Zhanhua Huang 11
Key Laboratory of Bio-based Material Science and Technology of 12
Ministry of Education, Northeast Forestry University, Harbin 150040, 13
China 14
15
Tel: 86-451-82192905; Fax: 86-451-2905; 16
E-mail: [email protected] 17
18
19
20
21
22
Page 3 of 25
Accep
ted
Man
uscr
ipt
2
Abstract: A novel biodegradable β-cyclodextrin-based gel (CAM) was 23
prepared and applied to the removal of Cd2+
, Pb2+
and Cu2+
ions from 24
aqueous solutions. CAM hydrogel has a typical three-dimensional 25
network structure, and showed excellent capability for the removal of 26
heavy metal ions. The effect of different experimental parameters, such as 27
initial pH, adsorbent dosage and initial metal ion concentration, were 28
investigated. The adsorption isotherm data fitted well to the Freundlich 29
model. The adsorption capacity was in the order Pb2+
>Cu2+
>Cd2+
under 30
the same experimental conditions. The maximum adsorption capacities 31
for the metal ions in terms of mg/g of dry gel were 210.6 for Pb2+
, 116.41 32
for Cu2+
, and 98.88 for Cd2+
. The biodegradation efficiency of the resin 33
reached 79.4% for Gloeophyllum trabeum. The high adsorption capacity 34
and kinetics results indicate that CAM can be used as an alternative 35
adsorbent to remove heavy metals from aqueous solution. 36
37
38
39
Keywords: β-Cyclodextrin; Adsorbent; Biodegradable; Adsorption; 40
Heavy metal removal 41
42
43
44
Page 4 of 25
Accep
ted
Man
uscr
ipt
3
1. Introduction 45
In recent years, with the development of industrialization, heavy 46
metal ion pollution of water is a serious matter. In the environment, heavy 47
metal ions cannot be degraded naturally and accumulate in living 48
organisms through food chain circulation. Furthermore, excessive heavy 49
metal ion accumulation becomes toxic and directly affects the growth and 50
physiological functions of organisms, leading to disease and even death 51
of organisms (Meral Yurtsever, & Ayhan Sengil, 2009). 52
The typical methods for heavy metal ions removal from industrial 53
wastewater include chemical precipitation, reverse osmosis, membrane 54
systems, solvent extraction, adsorption, electrolytic processes, ion 55
exchange processes, and biological methods. Among these methods, 56
adsorption is one of the most economically favorable and it is technically 57
an easy method (Vismara, et al., 2009). However, many absorbents, as 58
well as being economically expensive, have disadvantages such as low 59
adsorption capacity and non-biodegradability. Thus, considerable 60
attention has been focused on the removal of heavy metal ions from 61
wastewater using biodegradable adsorbents derived from low-cost 62
materials. 63
β-Cyclodextrin (β-CD) has many hydroxyl groups on the outside of 64
the cyclic cavity. These hydroxyl groups can enhance the adsorption of 65
heavy metal ions by strong interactions between the hydroxyl groups and 66
Page 5 of 25
Accep
ted
Man
uscr
ipt
4
metal ions (Chao, et al., 2008). Another β-CD is the cyclic 67
oligosaccharide formed from seven glucose molecules by 68
α-1-4-glucosidase linkages. β-CD and its derivatives are biodegradable 69
(Del Valle, 2004). 70
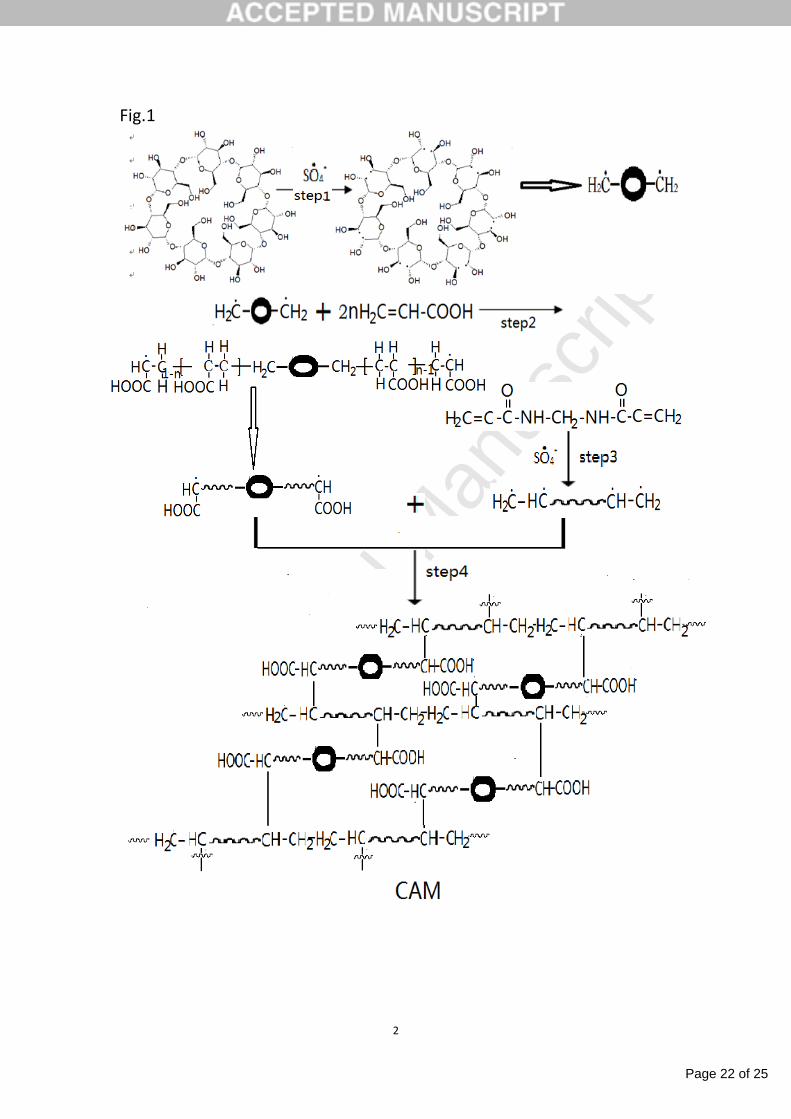
In this paper, a novel biodegradable β-CD based adsorbent (CAM, 71
Fig. 1) was prepared by cross-linking reactions under microwave 72
irradiation. The objective of the study was to search for a biodegradable 73
adsorbent with a high adsorption capacity for heavy metal ions. The 74
chemical structure of CAM was characterized, and the adsorption 75
behavior of CAM for Cd2+
, Pb2+
and Cu2+
was investigated. The possible 76
adsorption mechanisms were also explored by fitting to the isotherm 77
equations. 78
79
Fig. 1. Main structure of CAM resin. 80
81
2. Experimental 82
2.1. Materials 83
β-CD, acrylic acid (AA), N,N’-methylene-bis-acrylamide (MBA), 84
and Ce(NH4)2(NO3)6 were purchased from the chemical reagent 85
development center of Kemiou Engineering (Tianjin, China). Aspergillus 86
niger (A. niger), Penicillium and Gloeophyllum trabeum were obtained 87
from the Laboratory of Forest Protection of the Northeast Forestry 88
Page 6 of 25
Accep
ted
Man
uscr
ipt
5
University. The standard stock solutions (500mg/L) of Cd2+
, Pb2+
and 89
Cu2+
were prepared from their nitrate salts. The pH of the experimental 90
solutions was adjusted using 0.1 M HCl and 0.1 M NaOH. All reagents 91
used were of analytical grade, and all solutions were prepared with 92
distilled water. 93
2.2. Microwave preparation of CAM 94
β-CD, AA, and MBA were mixed in a 250 mL three-neck reaction 95
bottle with a mass ratio of 1:6:3. The resulting mixture was dissolved in 96
0.01 M NaOH solution with stirring to adjust the mixture to a specified 97
degree of neutralization. The mixture was uniformly mixed to dissolve 98
the solid samples. Then, the three-neck reaction bottle was installed on 99
the microwave synthesizer. Nitrogen flowed through for the whole 100
reaction process. 0.01 g Ce(NH4)2(NO3)6 (quantitative initiator) was then 101
added in the three-neck reaction bottle using a funnel at a constant rate of 102
1 d/s to 2 d/s with stirring at 60 °C. After then, the microwave irradiated 103
reaction was maintained 15 min exposure time and at 250 W microwave 104
power. Then, the mixture was passed through a filter, and the filtered cake 105
was extracted for 6-8h by acetone under 50℃, filter again, the filtered 106
cake was washed by alcohol for three times in order to remove unreacted 107
monomer. Finally, the filtered cake was dried at 40 C for 48 h to give 108
CAM. 109
2.3. Characterization 110
Page 7 of 25
Accep
ted
Man
uscr
ipt
6
The Fourier transform-infrared (FTIR) spectra were recorded on a 111
MAGNA 560 FTIR spectrometer (Thermo Nicolet Corporation, USA) 112
using KBr discs in the range 400 cm–1 to 4000 cm
–1. Scanning electron 113
microscope (SEM) images and energy dispersive X-ray analyses (EDX) 114
were obtained using a FEI QUANTA 200 Microscope (FEI Corporation, 115
Netherlands). Solid-state carbon-13 cross-polarization and 116
magnetic-angle spinning nuclear magnetic resonance (13
C CPMAS NMR) 117
spectra were obtained using a Bruker Avance 400 NMR spectrometer 118
(BRUKER Corporation, Germany) with a frequency of 75.47 MHz and a 119
sample spin of 4.0 kHz. 120
2.4. Adsorption experiments 121
Cd2+
, Pb2+
and Cu2+
aqueous solutions were prepared from the 122
corresponding standard stock solutions by diluting with deionized water 123
to give different concentrations (25 mg/L, 50 mg/L, 100 mg/L and 150 124
mg/L). 0.1 g of the CAM was mixed with 200 mL of each salt solution, 125
and the water absorbency was then measured. Buffer solutions with pH 126
values of 2, 4, 6, 8, 10, and 12 were prepared using 0.1 g of the CAM 127
mixed with 200 mL of the buffer solutions of different pH values. After 128
saturation, the solutions were filtered and weighed, the hydrogel 129
characteristics were determined, and the absorbency was calculated. The 130
adsorption capacity (Q) and removal rate (A) were calculated as follows: 131
Q= (1) 132
%10000
00
VC
VCVC ee
m
VCVC ee00
Page 8 of 25
Accep
ted
Man
uscr
ipt
7
A= (2) 133
where C0 and Ce are the initial and equilibrium concentrations of the 134
metal ions, V0 and Ve are the initial and equilibrium volumes of the 135
solution, and m is the dose of CAM. 136
2.5. Determination of biodegradability 137
CAM sheets with size 1 cm × 2 cm were obtained from the CAM 138
products by cutting, and were then weighed and labeled separately. The 139
sheets were placed in 18 PDA plates containing fungi (six plates each of 140
A. niger, Penicillium and Gloeophyllum trabeum), sealed with tape, and 141
incubated at 30 °C. Then, the CAM gels were filtered, dried, weighed, 142
and the biodegradation was observed every 72 h. 143
144
3. Results and discussion 145
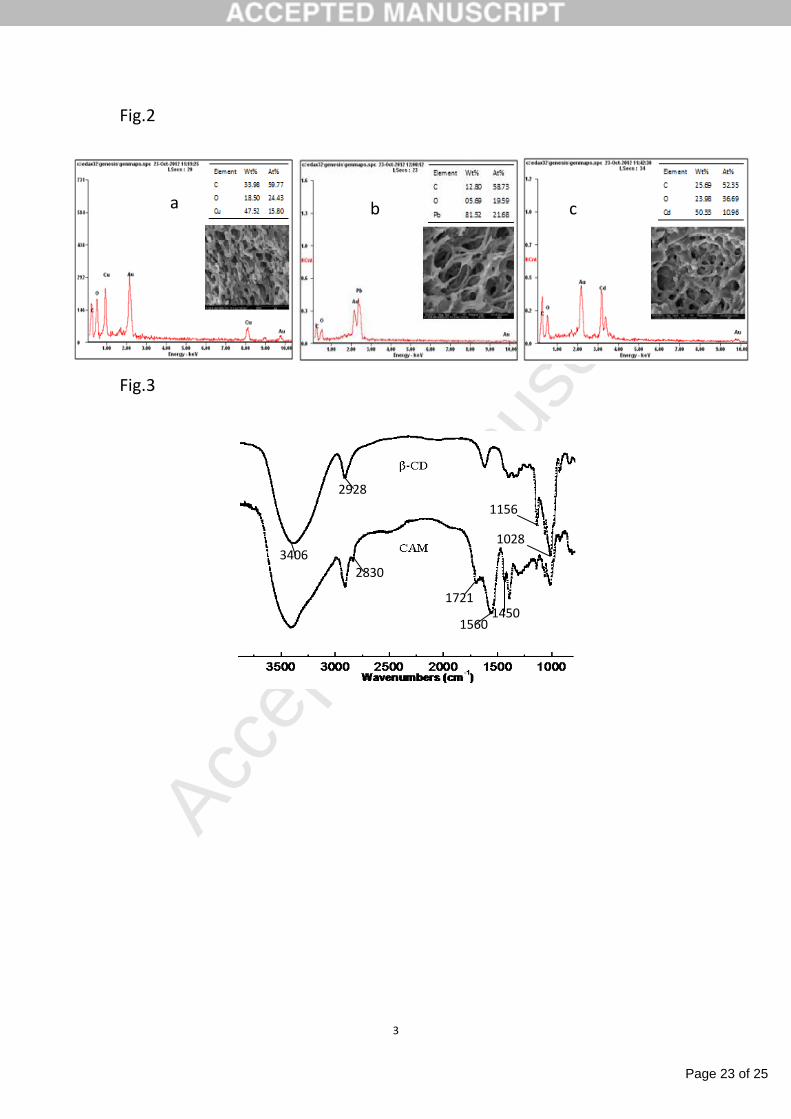
3.1. SEM–EDX analysis 146
0.1 g of CAM was added into saturated solutions of Cd2+
, Pb2+
and 147
Cu2+
. After static adsorption for 6 h, filtering and purifying, three 148
different test samples were obtained. The Cu, Pb and Cd distributions in 149
the samples were studied by SEM–EDX analysis (Jacobson, et al., 2007). 150
Fig. 2a-c shows the mapping of Cu, Pb and Cd and the corresponding 151
scanning image in the samples. The EDX spectra at single regions of the 152
sample (Fig. 2) indicated the relative proportion of the different atoms. 153
As shown in Fig. 2, Cu, Pb and Cd are present in the test samples with 154
Page 9 of 25
Accep
ted
Man
uscr
ipt
8
proportions of 50.55 wt%, 81.52 wt% and 47.52 wt%, respectively. The 155
results indicated that the Pb content was significantly higher than Cu and 156
Cd in the respective solutions. 157
The SEM images of the resin CAM hydrogel in Cd2+
, Pb2+
and Cu2+
158
saturated solutions are shown in Fig. 2a-c. After adsorption, the internal 159
structure of the CAM hydrogel had an obvious three-dimensional 160
network, and the network size increased with increasing adsorption 161
content of the metal to the CAM adsorbent surface. However, in this 162
study, the SEM–EDX technique was not sensitive enough to identify the 163
differences of metal speciation generated during adsorption. 164
165
Fig. 2. SEM–EDX spectra of the adsorbent in the Cd2+
, Pb2+
and Cu2+
166
solutions. 167
168
3.2. FTIR spectra 169
Fig. 3 shows the FTIR spectra of β-CD and CAM. The characteristic 170
absorption peaks of β-CD (3406, 2928, 1156 and 1028 cm-1
), PAA (2830, 171
1721 and 1450 cm-1
) and MBA (1560 and 1450 cm-1
) are observed in the 172
spectra. In the FTIR spectra, the peak for the stretching vibration 173
absorption of -NH2 is 1560 cm-1
(Tripathy, et al., 2009), while the peak at 174
1450 cm-1
corresponds to the C-N stretching vibration of the MBA unit. 175
Moreover, the lack of a characteristic -C=C absorption peak indicates that 176
Page 10 of 25
Accep
ted
Man
uscr
ipt
9
a polymerization reaction occurred. Based on these results, it can be 177
concluded that -C=O and -NH2 were introduced to the CAM. 178
179
Fig. 3. FTIR spectra of β-CD and CAM. 180
181
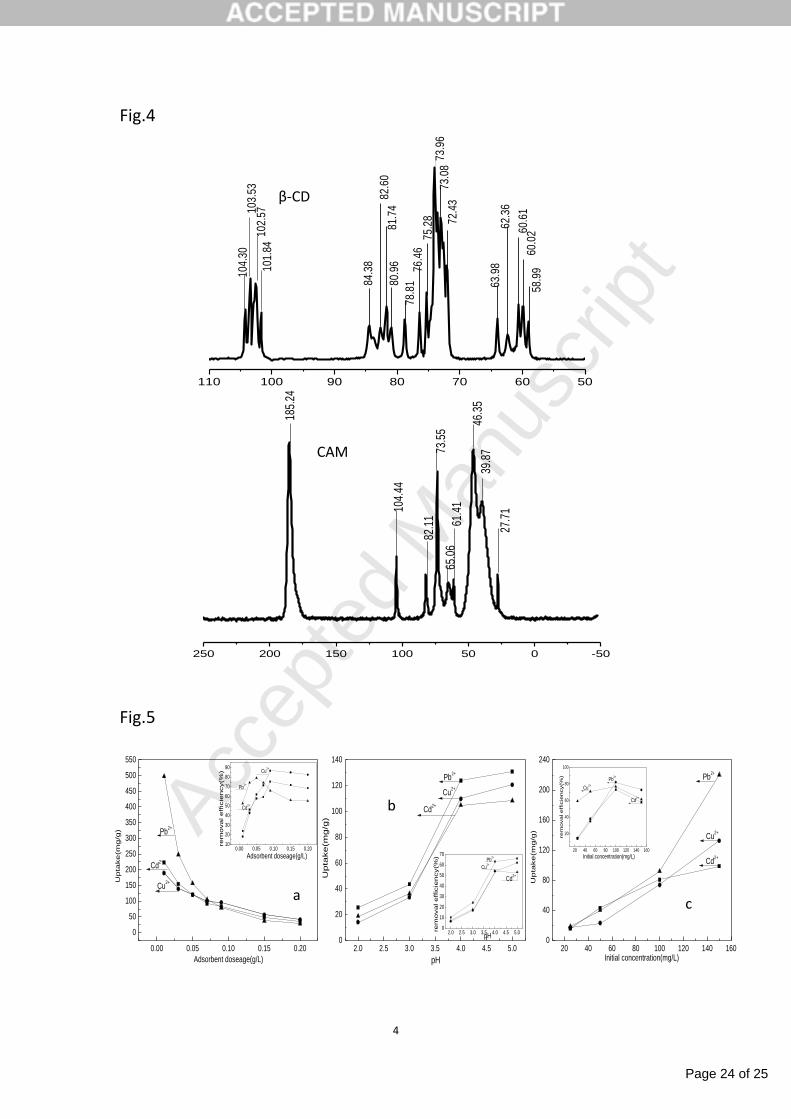
Fig. 4 shows the 13
C NMR spectra of β-CD and CAM. Fig. 3 indicates 182
that there is a dissymmetrical β-CD cavity, because of an obvious signal 183
split of characteristic carbon atoms, with the split peaks at 101–104 ppm 184
being the C1 signal peaks connected to the β-CD vertical glycosidic 185
linkage. The chemical shifts at 80–85 ppm are the characteristic signals 186
for C4; the five split peaks at 58–63 ppm are characteristic of the signal 187
for C6; and the chemical shifts at 72–78 ppm are the cyclic carbons C2, 188
C3, C5, which are not connected to the glycosidic bond but have the same 189
characteristics of the separate peaks (Huang, et al., 2012). 190
It can be seen from the 13
C NMR spectra of CAM that the 191
spectrogram was smooth and split peaks were not observed. The 192
characteristic peak at 185.24 ppm represents the carbon signal from C=O. 193
The peaks at 20–50 ppm are characteristic signal peaks for different alkyl 194
group in the polymer chains. The peaks at 104.44 ppm and 82.11 ppm 195
represent C1 and C4 signals of the glucose residues, and the split peaks at 196
65.06 ppm and 61.41 ppm represent C6 signals of the glucose residues. 197
The peak at 73.55 ppm was identified as the cyclic carbons C2, C3 and 198
Page 11 of 25
Accep
ted
Man
uscr
ipt
10
C5, which are not connected to the glycosidic linkage. In certain 199
environments, the resonance peaks of C2, C3, and C5 tend to overlap to 200
form a single peak (Lu, et al., 2008). The peaks at 20–50 ppm are 201
characteristic signal peaks of alkyl groups in polymer chains. The above 202
results indicate that the cycle cavity of β-CD was open during 203
polymerization. 204
205
Fig. 4. Solid-state 13
CNMR spectra of β-CD and CAM. 206
207
3.3. Effect of different experimental parameters on metal ion adsorption 208
to CAM 209
The effects of adsorbent dosage, initial pH and initial metal ion 210
concentration on the uptake and removal rate of CAM are shown in Fig. 5. 211
As shown in Fig. 5a, the removal rate of Cd2+
, Pb2+
and Cu2+
shows a 212
trend of initially increasing and then decreasing when the CAM dose was 213
increased from 0.01 to 0.2 g/L. In contrast, the uptake of Cd2+
, Pb2+
and 214
Cu2+
gradually decreases from 228.91 to 49.03 mg/g, 505.60 to 63.29 215
mg/g, and 188.25 to 49.86 mg/g, respectively. A possible reason could be 216
that the increase in adsorbent provides excess active groups beyond the 217
capacity to be accepted by the metal ions. Moreover, the competition for 218
adsorption sites on the adsorbent between water and the metal ions leads 219
to an increase in water uptake and a decrease in the removal rate of the 220
Page 12 of 25
Accep
ted
Man
uscr
ipt
11
metal ions (Naiya, et al., 2009). As shown in Fig. 5b, the adsorption 221
capacities increased significantly with an increase in solution pH from 2 222
to 5. At lower solution pH values, H+
competes with metal ions for the 223
adsorption sites, resulting in the surface of the adsorbent occupied by 224
more H+ and reducing the complexation of the metal ions on the surface 225
of the adsorbent (Liang, et al., 2010). At higher solution pH values, the 226
surface of the adsorbent is occupied by more negative charges, which 227
attracts more metal ions. The effect of initial metal ion concentration on 228
the uptake is shown in Fig. 5c. The results indicate that the adsorption 229
capacities increase with increasing initial concentration of metal ions, and 230
the removal rate initially increases and then decreases. When the initial 231
concentration of metal ions increases, the increase in metal ions 232
combining with the active groups on the adsorbent gradually decreases, 233
which results in a gradual increase in the adsorption capacity. In addition, 234
more metal ions are left in solution because of saturation of the 235
adsorption sites (Cao, et al., 2010). Thus, when the concentration of metal 236
ions increase, the increase in metal ions combining with the active groups 237
gradually decreases. 238
239
Fig. 5. Effect of the (a) adsorbent dosage, (b) initial pH, and (c) initial 240
metal ion concentration on the adsorption capacities of Cd2+
, Pb2+
241
and Cu2+
.
242
Page 13 of 25
Accep
ted
Man
uscr
ipt
12
243
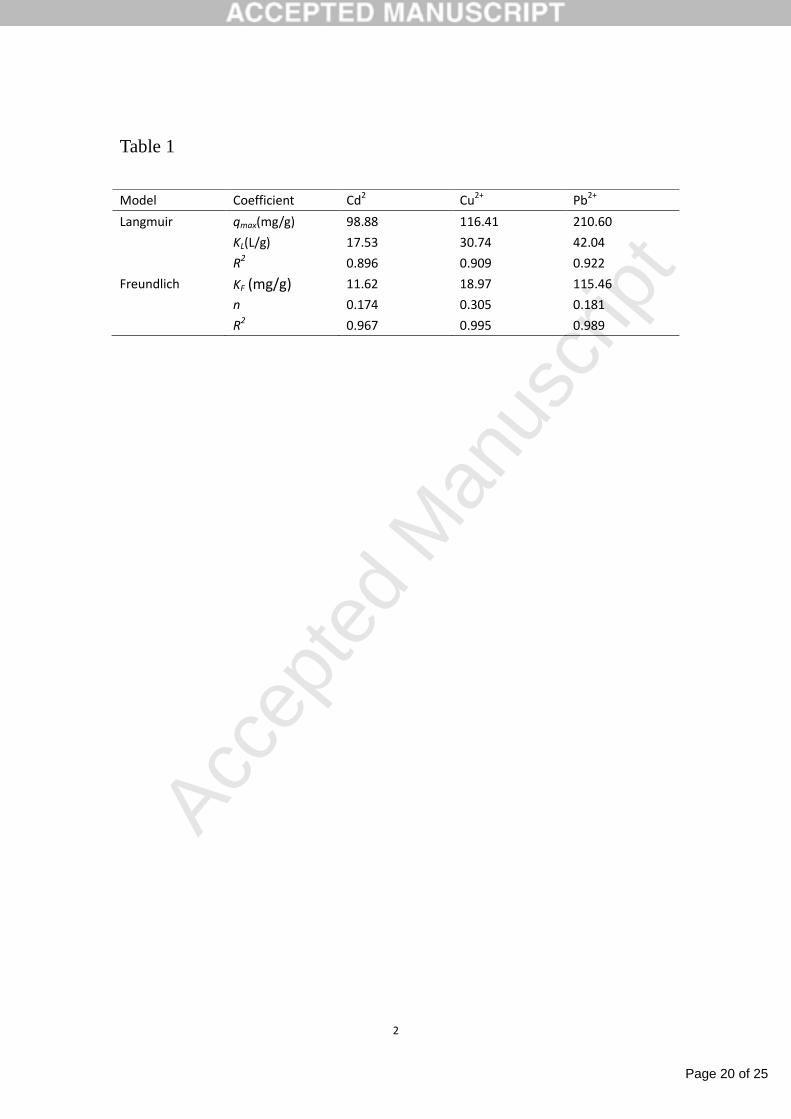
3.4. Adsorption isotherm 244
The adsorption isotherms were evaluated using the Langmuir and 245
Freundlich isotherm models. The Langmuir isotherm model (Sharma, & 246
Mishra, 2010) is given by 247
qe = KLCe/(1+ aLCe), (3) 248
where qe (mg/g) and Ce (mg/L) are the amount of metal ion adsorbed per 249
unit weight of adsorbent and the unadsorbed metal ion concentration in 250
solution at equilibrium, respectively. The empirical constants KL and aL 251
of the Langmuir model are related to the maximum adsorptive capacity of 252
the adsorbent (L/g) and the bonding strength (L/mg), respectively. 253
The Freundlich isotherm model (Dabrowski, 2001) is given by 254
logqe = logKF+1/nlogCe, (4) 255
where qe is the amount adsorbed at equilibrium (mg/g), Ce is the 256
equilibrium concentration of metal ions (mg/L), and KF (mg/g) and n (g/L) 257
are Freundlich constants related to the adsorption capacity and the 258
intensity of adsorption, respectively. 259
The values of the isotherm constants and the correlation coefficients 260
for the isotherm plots of Cd2+
, Pb2+
and Cu2+
are given in Table 1. The 261
highest numerical value of KF (115.46) was obtained for Pb2+
, followed 262
by Cu2+
(18.97) and then Cd2+
(11.62). The results indicate that the 263
equilibrium adsorption data for CAM fits the Freundlich isotherm model 264
Page 14 of 25
Accep
ted
Man
uscr
ipt
13
better than the Langmuir model. Therefore, the adsorption mechanism of 265
metal ions to CAM takes place through an ion exchange process 266
(Homagai, et al., 2010). 267
268
Table 1. Adsorption isotherm constants of the Langmuir and Freundlich 269
models for Cd2+
, Pb2+
and Cu2+
ions adsorbed to CAM. 270
271
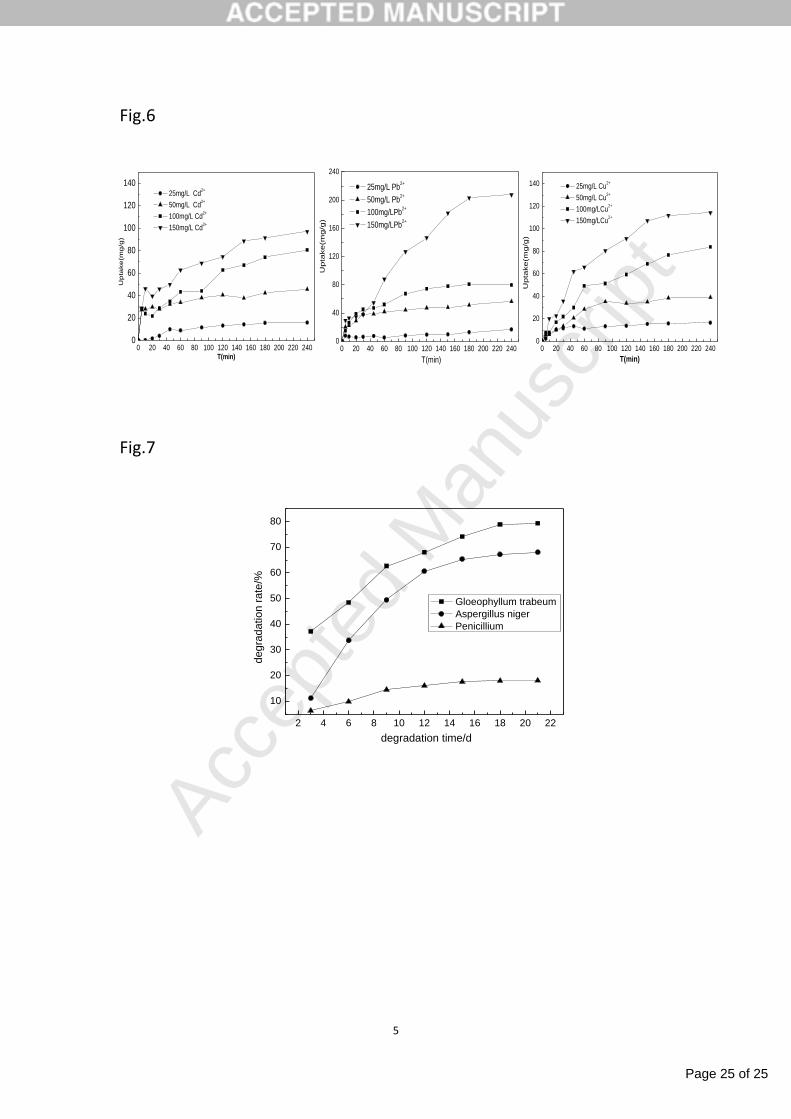
3.5. Adsorption kinetics 272
The adsorption capacities of CAM gel for Cd2+
, Pb2+
and Cu2+
273
solutions are shown in Fig. 6. The adsorption capacities of the metal ions 274
occurred in the order Pb2+
(210.6 mg/g) > Cu2+
(116.41 mg/g) > Cd2+
275
(98.88 mg/g). The results indicate that CAM has excellent adsorption 276
performance for heavy metal ions, and the adsorption rate is fast, 277
reaching equilibrium within 60-90 min. A high correlation between the 278
experimental data and the quasi-second order adsorption rate equation 279
was obtained. The results of R2 for each metal ion are 0.971 (Cd
2+), 0.987 280
(Pb2+
), and 0.983 (Cu2+
). 281
282
Fig. 6. Effect of adsorption time on the adsorption capacities of CAM 283
for Cd2+
, Pb2+
and Cu2+
. 284
285
3.6. Biodegradation of CAM 286
Page 15 of 25
Accep
ted
Man
uscr
ipt
14
The degradation efficiency of CAM resin gel in A. niger, Penicillium 287
and Gloeophyllum trabeum is shown in Fig. 7. The degradation was 288
observed to be very slow with Penicillium, with only 6.31% of the CAM 289
gel degraded after 3 days and the degradation efficiency reaching a 290
maximum of 18.11% after 21 days. In A. niger, the CAM gel degradation 291
efficiency rapidly increased with time. After 3 days, the degradation 292
efficiency was 11.2%, but after 18 days it reached 68.19%. With 293
Gloeophyllum trabeum, the degradation efficiency was 39.26% after 3 294
days, and 79.4% after 21 days. The CAM block samples turned into fluid 295
in 3 days. These results indicate that the CAM gel is biodegradable by 296
Gloeophyllum trabeum. The order of the fungi based on the resin 297
degradation efficiency is as follows: Gloeophyllum trabeum > A. niger > 298
Penicillium. 299
300
Fig. 7. Fungus degradation of CAM 301
302
4. Conclusions 303
A biodegradable β-cyclodextrin-based hydrogel (CAM) was prepared 304
and shown to be an excellent adsorbent for the removal of Pb2+
, Cu2+
and 305
Cd2+
ions from aqueous solution. The adsorption capacities of CAM were 306
in the order: Pb2+
(210.6 mg/g) > Cu2+
(116.41 mg/g) > Cd2+
(98.88 mg/g). 307
After adsorption, the internal structure of CAM hydrogel had an obvious 308
Page 16 of 25
Accep
ted
Man
uscr
ipt
15
three-dimensional network structure. The adsorption mechanism of the 309
metal ions with CAM was through an ion exchange process. CAM 310
hydrogel is biodegradable by Gloeophyllum trabeum, and the degradation 311
efficiency was 79.4% after 21 days. This study shows that CAM is an 312
eco-friendly adsorption material that is effective in removing heavy metal 313
heavy metal ions from aqueous solution. 314
Acknowledgments 315
This work was supported by the Central University Basic Scientific 316
Research Project of China (Grant no. DL11EB01) and the National 317
Natural Science Foundation of China (Grant no. 31000277). We also 318
thank the Ph.D. program of the Foundation of the Ministry of Education 319
of China (Grant no. 20100062120005). 320
321
322
323
324
325
326
327
328
329
330
Page 17 of 25
Accep
ted
Man
uscr
ipt
16
331
332
333
334
335
336
References 337
Cao, J., Tan, Y.B., Che, Y.J., & Xin, H.P. (2010). Novel complex gel beads composed 338
of hydrolyzed polyacrylamide and chitosan: An effective adsorbent for the 339
removal of heavy metal from aqueous solution. Bioresource Technology, 101, 340
2558-2561. 341
Chao, Y., Jin, Z.Y., Xu, X.M, Zhuang, H.N, & Shen, W.Y. (2008). Preparation and 342
stability of the inclusion complex of astaxanthin with 343
hydroxypropyl-β-cyclodextrin. Food Chemistry, 109, 264-268. 344
Del Valle E.M. (2004). Cyclodextrins and their uses: a review. Process Biochemistry, 345
39, 1033-1046. 346
Dabrowski, A. (2001). Adorption-from theory to practice. Advances in Colloid and 347
Interface Science, 93, 135-224. 348
Homagai, P.L., Ghimire, K.N., & Inoue, K. (2010). Adsorption behavior of heavy 349
metals onto chemically modified sugarcane bagasse. Bioresource Technology, 101, 350
2067-2069. 351
Huang, Z.H., Liu, S.X., Zhang, B., Xu, L.L., & Hu, X.F. (2012). Equilibrium and 352
kinetics studies on the adsorption of Cu(II) from the aqueous phase using a 353
β-cyclodextrin-based adsorbent. Carbohydrate. Polymers. 88, 609-617. 354
Jacobson, A.R., Dousset, S., Andreux, F., & Baveye, P.C. (2007). Electron Microprob- 355
e and Synchrotron X-ray Fluorescence Mapping of the Heterogeneous 356
Distribution of Copper in High-Copper Vineyard Soils. Environmental Science & 357
Technology, 41, 6343-6349. 358
Liang, S., Guo, X.Y., Feng, N.C., & Tian, Q.C. (2010). Isotherms, kinetics and 359
thermodynamic studies of adsorption of Cu2+
from aqueous solutions by Mg2+
/K+ 360
type orange peel adsorbents. Journal of Hazardous Materials, 174, 756-762. 361
Lu, D.D., Yang, L.Q., Zhou, T.H., & Lei, Z.Q. (2008). Synthesis, characterization and 362
properties of biodegradable polylactic acid-β-cyclodextrin cross-linked copolymer 363
microgels. European Polymer Journal, 44, 2140-2145. 364
Naiya, T.K., Bhattacharya, A.K., & Das, S.K. (2009). Adsorption of Cd(II) and Pb(II) 365
from aqueous solutions on activated alumina. Journal of Colloid and Interface 366
Science.333, 14-26. 367
Page 18 of 25
Accep
ted
Man
uscr
ipt
17
Ngah, W.S.W., & Hanafiah, M.A.K. (2008). Adsorption of copper on rubber (Hevea 368
brasiliensis) leaf powder: Kinetic, equilibrium and thermodynamic studies. 369
Biochemical Engineering Journal, 39, 521-530. 370
Sharma, A.K., & Mishra, A.K. (2010). Microwave induced β-cyclodextrin 371
modification of chitosan for lead sorption. International Journal of Biological 372
Macromolecules, 47, 410-419. 373
Tripathy, J., Mishra D. K., & Behari, K. (2009). Graft copolymerization of 374
N-vinylformamide onto sodium carboxymethylcellulose and study of its swelling, 375
metal ion sorption and flocculation behavior. Carbohydrate Polymers, 75, 376
604-611. 377
Vismara, E., Melone, L., Gastaldi, G., Cosentino, C., & Torri, G. (2009). Surface 378
functionalization of cotton cellulose with glycidyl methacrylate and its application 379
for the adsorption of aromatic pollutants from wastewaters. Journal of Hazardous 380
materials, 170, 798-808. 381
Yurtsever, M., & Ayhan Sengil, i. (2009). Biosorption of Pb(II) ions by modified 382
quebracho tannin resin. Journal of Hazardous materials, 163, 58-64. 383
Page 19 of 25
Accep
ted
Man
uscr
ipt
1
List of Table
Table 1 Adsorption isotherm constants of Langmuir and Freundlich
models for Cd2+
, Pb2+
and Cu2+
ions adsorbed by CAM
Table(s)
Page 20 of 25
Accep
ted
Man
uscr
ipt
2
Table 1
Model Coefficient Cd2 Cu2+ Pb2+
Langmuir qmax(mg/g) 98.88 116.41 210.60
KL(L/g) 17.53 30.74 42.04
R2 0.896 0.909 0.922
Freundlich KF (mg/g) 11.62 18.97 115.46
n 0.174 0.305 0.181
R2 0.967 0.995 0.989
Page 21 of 25
Accep
ted
Man
uscr
ipt
1
Figure Captions
Fig.1. Main structure of CAM resin
Fig.2. SEM-EDX spectrum of the adsorbent in Cd2+
, Pb2+
and Cu2+
solution
Fig.3. FTIR spectra of β-CD and CAM
Fig.4. Solid-state 13
CNMR spectra of β-CD and CAM
Fig.5. Effect of the adsorbent dosage (a), initial pH (b) and initial metal
concentration (c) on the adsorption capacities of Cd2+
, Pb2+
and
Cu2+
Fig.6. Effect of adsorption time on the adsorption capacities of Cd2+
, Pb2+
and Cu2+
Fig.7. Mycete degradation results of CAM
Figure(s)
Page 22 of 25
Accep
ted
Man
uscr
ipt
2
Fig.1
Page 23 of 25
Accep
ted
Man
uscr
ipt
3
Fig.2
Fig.3
a b c
3406
2928
1156
1450 1721
1028
2830
1560
Page 24 of 25
Accep
ted
Man
uscr
ipt
4
Fig.4
Fig.5
a
b
20 40 60 80 100 120 140 1600
40
80
120
160
200
240
20 40 60 80 100 120 140 160
20
40
60
80
100
re
moval effic
iency(%
)
Initial concentration(mg/L)
Cd2+
Pb2+
Cu2+
20 40 60 80 100 120 140 160
20
40
60
80
100
120
rem
oval effic
iency(%
)
Initial concentration(mg/L)
Cd2+
Pb2+
Cu2+
Cu2+
Cd2+
Pb2+
Up
take
(mg
/g)
Initial concentration(mg/L)
c
0.00 0.05 0.10 0.15 0.20
0
50
100
150
200
250
300
350
400
450
500
550
0.00 0.05 0.10 0.15 0.2010
20
30
40
50
60
70
80
90
Cu2+
Pb2+
Cd2+
Up
take
(mg
/g)
Adsorbent doseage(g/L)
Adsorbent doseage(g/L)
rem
oval effic
iency(%
)
Cd2+
Pb2+
Cu2+
2.0 2.5 3.0 3.5 4.0 4.5 5.00
20
40
60
80
100
120
140
2.0 2.5 3.0 3.5 4.0 4.5 5.00
10
20
30
40
50
60
70
pH
Upta
ke(m
g/g
)
Cd2+
Pb2+
Cu2+
rem
oval effic
iency(%
)
pH
Cd2+
Pb2+
Cu2+
CAM
250 200 150 100 50 0 -50
65.0
6
46.3
5
61.4
1
27.7
1
39.8
7
82.1
173
.55
104.
44
185.
24
110 100 90 80 70 60 50
104.
30
102.
57103.
53
101.
84
73.9
6
80.9
6
78.8
176
.46
75.2
8 72.4
3
60.0
260.6
158
.99
62.3
663
.98
73.0
8
82.6
081
.74
84.3
8
β-CD
Page 25 of 25
Accep
ted
Man
uscr
ipt
5
Fig.6
Fig.7
2 4 6 8 10 12 14 16 18 20 22
10
20
30
40
50
60
70
80
degradation time/d
deg
rad
atio
n r
ate
/%
Gloeophyllum trabeum
Aspergillus niger
Penicillium
0 20 40 60 80 100 120 140 160 180 200 220 2400
40
80
120
160
200
240
Upta
ke(m
g/g
)
T(min)
25mg/L Pb2+
50mg/L Pb2+
100mg/LPb2+
150mg/LPb2+
0 20 40 60 80 100 120 140 160 180 200 220 2400
20
40
60
80
100
120
140
Up
take
(mg
/g)
T(min)
25mg/L Cu2+
50mg/L Cu2+
100mg/LCu2+
150mg/LCu2+
0 20 40 60 80 100 120 140 160 180 200 220 2400
20
40
60
80
100
120
140
Up
take
(mg
/g)
T(min)
25mg/L Cd2+
50mg/L Cd2+
100mg/L Cd2+
150mg/L Cd2+
Top Related