![Shandong University, Qingdao, China · 3. Analysis details γ rich trigger event Purity of direct photon for different trigger E Ttrig bins 8 10 12 14 16 18 20 trig [GeV] E T 10 15](https://static.fdocument.org/doc/165x107/5fa4bfc0f6eb2551d61b8e04/shandong-university-qingdao-china-3-analysis-details-rich-trigger-event-purity.jpg)


γλώσσες
Σελίδες
Νομικός

A data-driven performance evaluation method for CMS RPC trigger system
&Study of Muon trigger efficiencies with
official Tag & Probe package for ICHEP
Archana Sharma, Suman BeriPanjab University,
Chandigarh
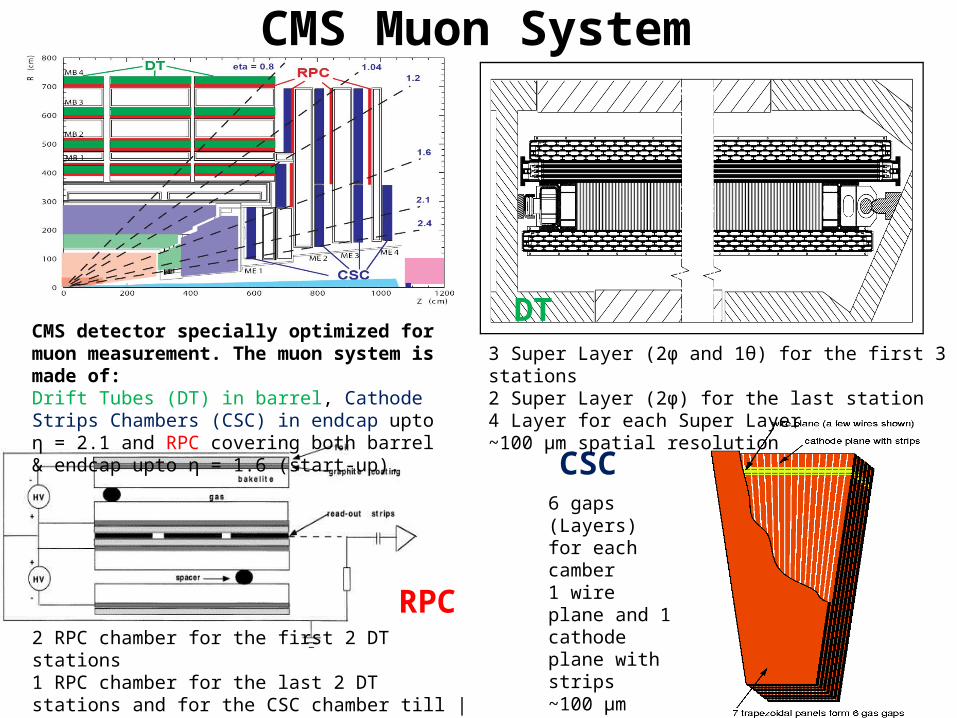
CMS Muon System
2
6 gaps (Layers) for each camber1 wire plane and 1 cathode plane with strips~100 μm spatial resolution
CSC
2 RPC chamber for the first 2 DT stations1 RPC chamber for the last 2 DT stations and for the CSC chamber till |η|<1.6~ ns time resolution
RPC
DT3 Super Layer (2φ and 1θ) for the first 3 stations2 Super Layer (2φ) for the last station4 Layer for each Super Layer~100 μm spatial resolution
CMS detector specially optimized for muon measurement. The muon system is made of:Drift Tubes (DT) in barrel, Cathode Strips Chambers (CSC) in endcap upto η = 2.1 and RPC covering both barrel & endcap upto η = 1.6 (start-up).
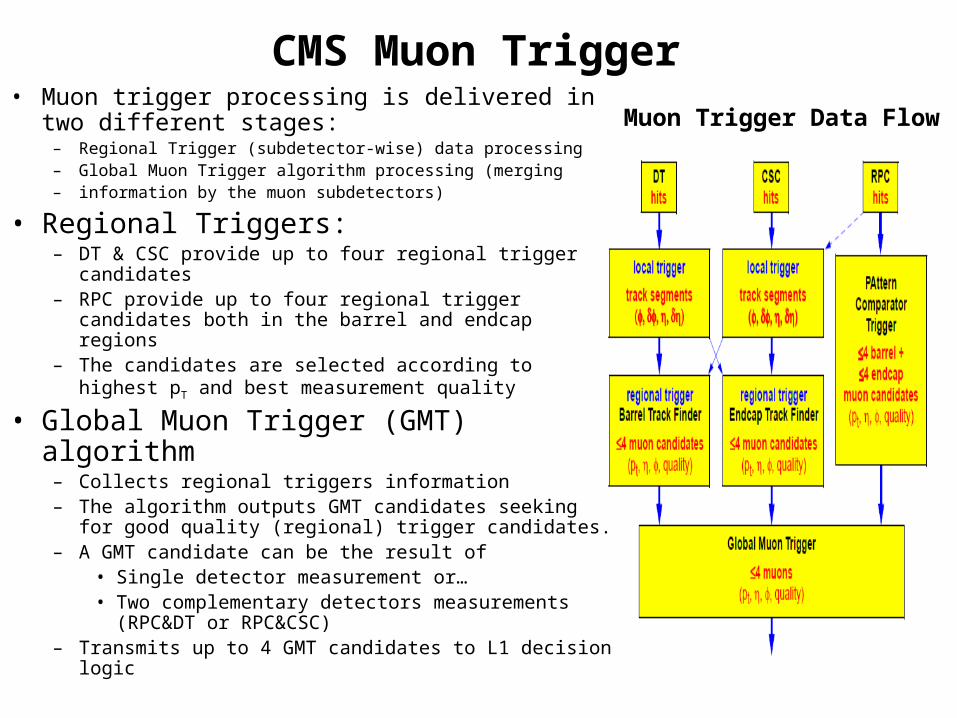
CMS Muon Trigger• Muon trigger processing is delivered in two different
stages:– Regional Trigger (subdetector-wise) data processing– Global Muon Trigger algorithm processing (merging– information by the muon subdetectors)
• Regional Triggers:– DT & CSC provide up to four regional trigger candidates– RPC provide up to four regional trigger candidates both in the
barrel and endcap regions– The candidates are selected according to highest pT and best
measurement quality
• Global Muon Trigger (GMT) algorithm– Collects regional triggers information– The algorithm outputs GMT candidates seeking for good
quality (regional) trigger candidates.– A GMT candidate can be the result of
• Single detector measurement or…• Two complementary detectors measurements (RPC&DT
or RPC&CSC)– Transmits up to 4 GMT candidates to L1 decision logic
Muon Trigger Data Flow
A Data Driven trigger performance evaluation method
• GMT algorithm keeps trace of the muon sub-system which provided the candidates measurement(s)
• Such feature can be exploited for evaluating in a data-driven fashion the trigger performance of each muon sub-system– By considering the trigger candidates provided by a given sub-detector
using its complementary one as reference.
• Motivation– Such method is relevant in cross section calculation scenarios, for
trigger efficiency evaluation unbiased by MC guesses
4
Method implementation
• For RPC trigger performance evaluation– all the events with GMT candidates provided by the DT’s in barrel
or CSC’s in endcaps are selected
– amongst these, the number of events with candidates provided also by RPC is counted up.
• With such approach only RPC regional candidates good enough to be accepted by GMT are accounted for– Thus the method measures the actual contribution of RPC system
trigger to the L1 final decision
– Furthermore GMT candidate is required to fulfill at least one L1 muon paths in the Global Trigger (GT) table.
5
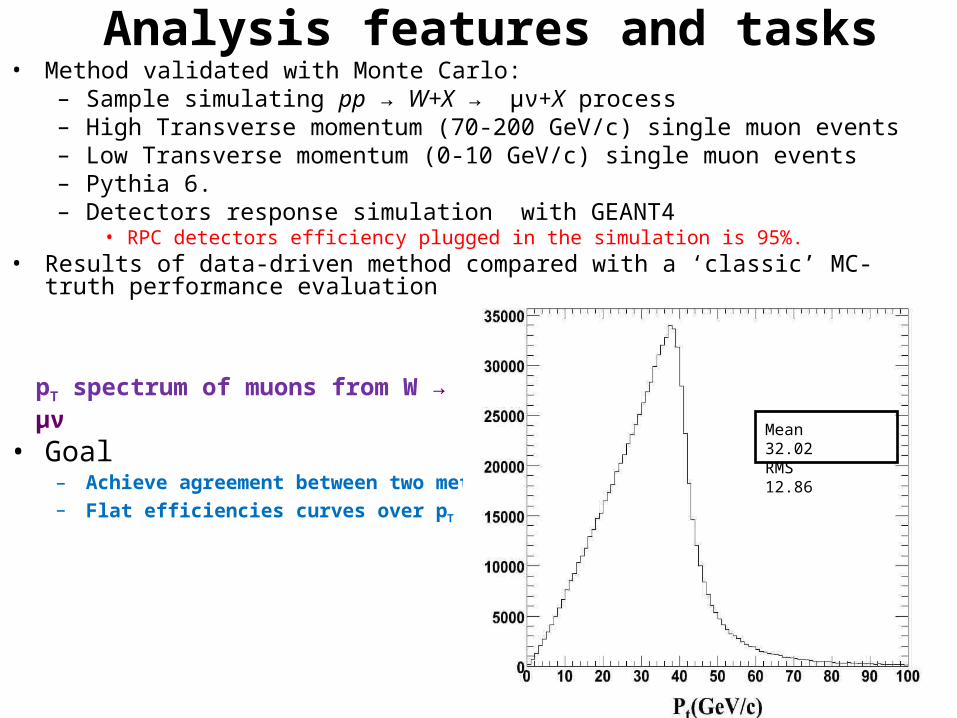
Analysis features and tasks• Method validated with Monte Carlo:
– Sample simulating pp → W+X → μν+X process– High Transverse momentum (70-200 GeV/c) single muon events– Low Transverse momentum (0-10 GeV/c) single muon events– Pythia 6.– Detectors response simulation with GEANT4
• RPC detectors efficiency plugged in the simulation is 95%.• Results of data-driven method compared with a ‘classic’ MC-truth performance
evaluation
• Goal– Achieve agreement between two methods– Flat efficiencies curves over pT range
6
Mean 32.02RMS 12.86
pT spectrum of muons from W → μν
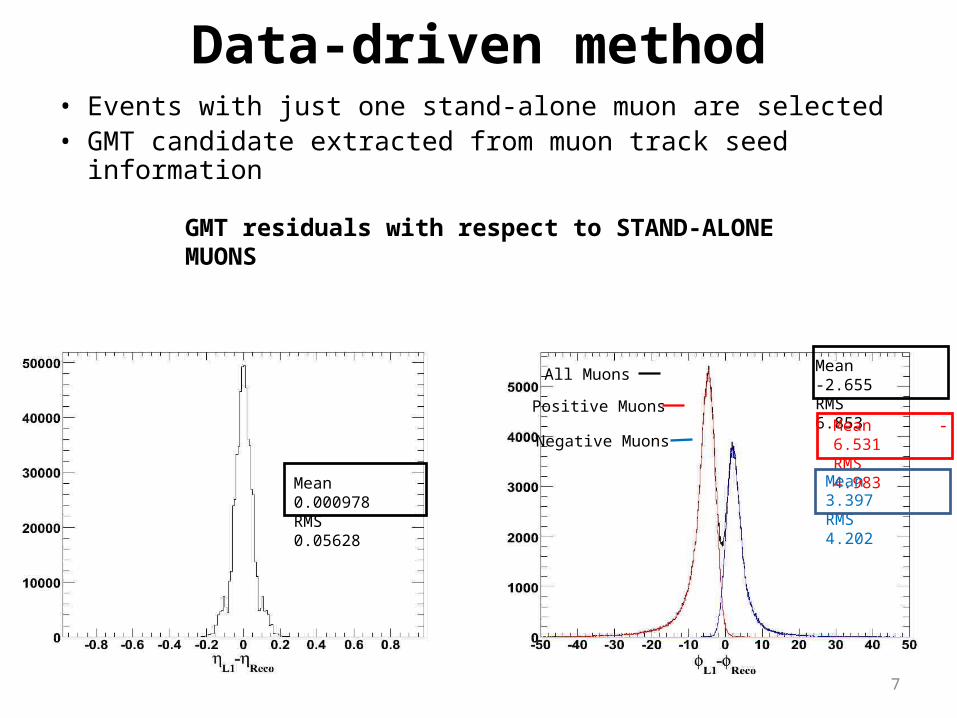
• Events with just one stand-alone muon are selected• GMT candidate extracted from muon track seed information
7
Data-driven method
GMT residuals with respect to STAND-ALONE MUONS
Mean 0.000978RMS 0.05628
Negative Muons
Positive Muons
All Muons Mean -2.655RMS 6.853
Mean -6.531RMS 4.983
Mean 3.397RMS 4.202
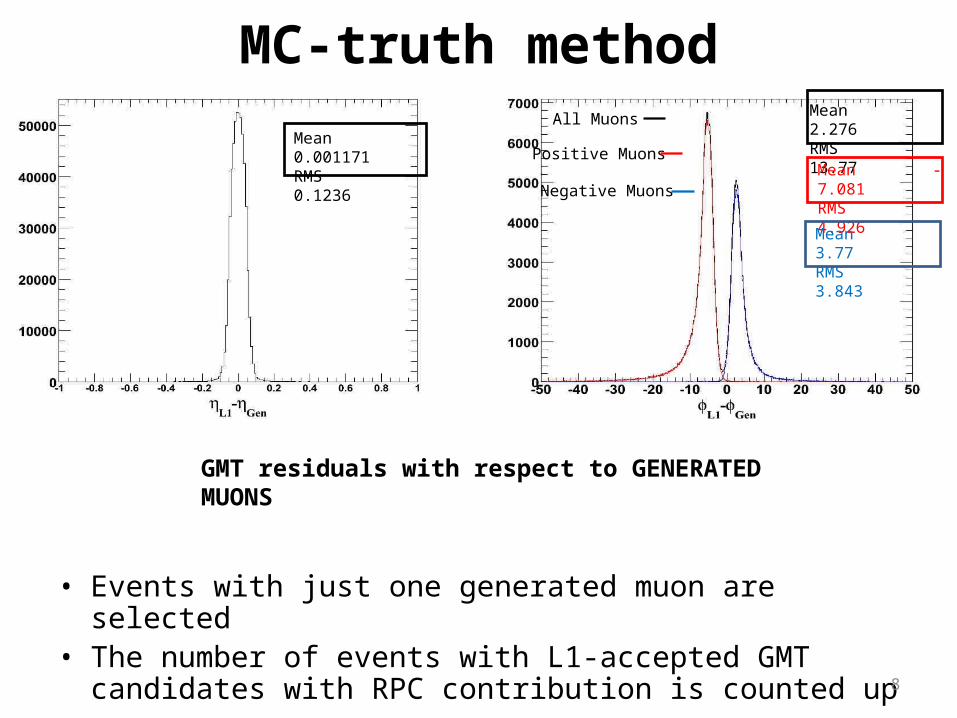
• Events with just one generated muon are selected• The number of events with L1-accepted GMT candidates with
RPC contribution is counted up8
MC-truth method
Negative Muons
All Muons
Positive MuonsMean 0.001171RMS 0.1236
Mean 2.276RMS 13.77
Mean -7.081RMS 4.926
Mean 3.77RMS 3.843
GMT residuals with respect to GENERATED MUONS
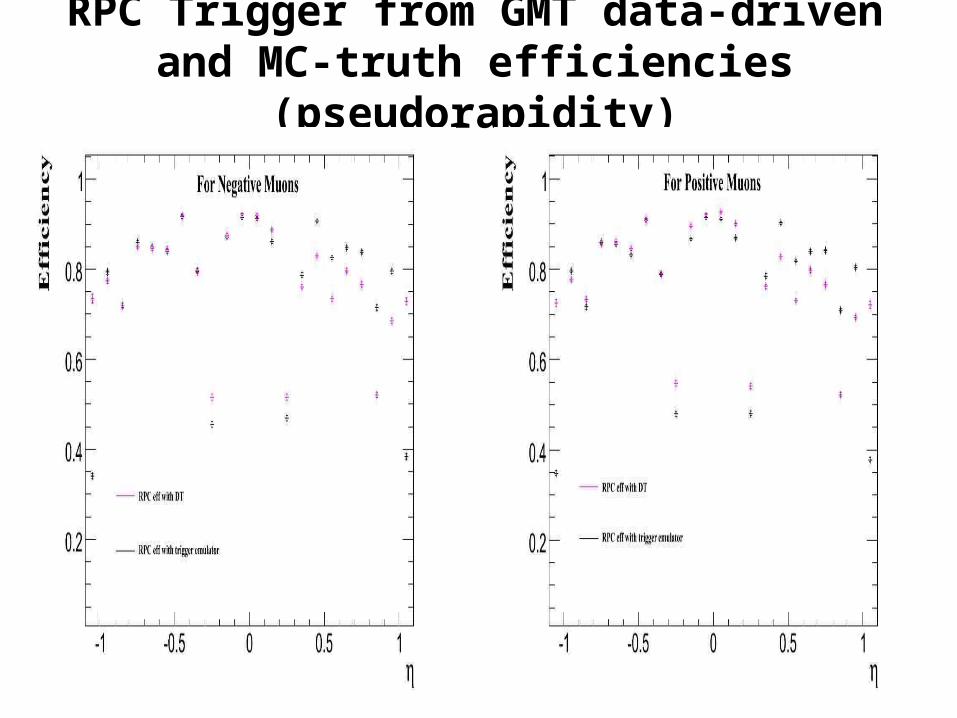
RPC Trigger from GMT data-driven and MC-truth efficiencies (pseudorapidity)
9
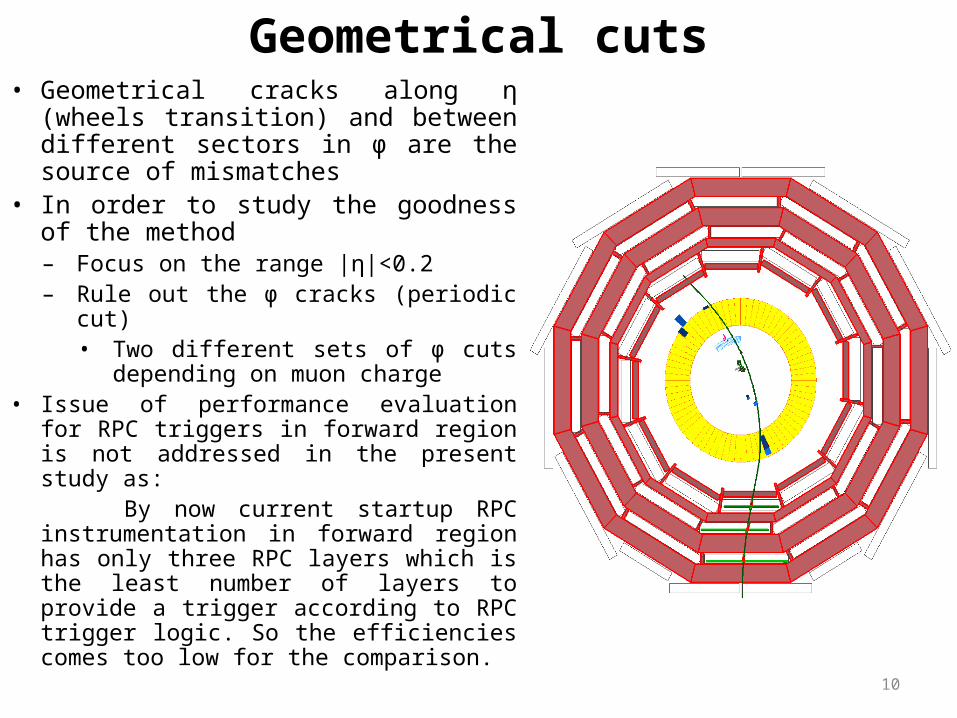
• Geometrical cracks along η (wheels transition) and between different sectors in φ are the source of mismatches
• In order to study the goodness of the method– Focus on the range |η|<0.2– Rule out the φ cracks (periodic cut)
• Two different sets of φ cuts depending on muon charge
• Issue of performance evaluation for RPC triggers in forward region is not addressed in the present study as:
By now current startup RPC instrumentation in forward region has only three RPC layers which is the least number of layers to provide a trigger according to RPC trigger logic. So the efficiencies comes too low for the comparison.
10
Geometrical cuts
11
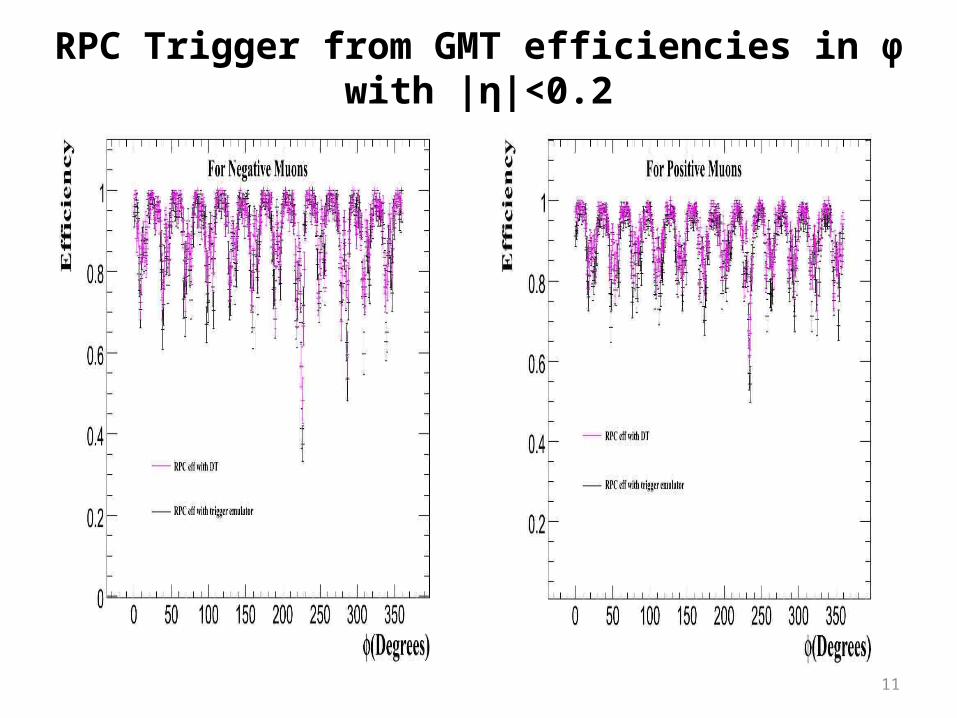
RPC Trigger from GMT efficiencies in φ with |η|<0.2
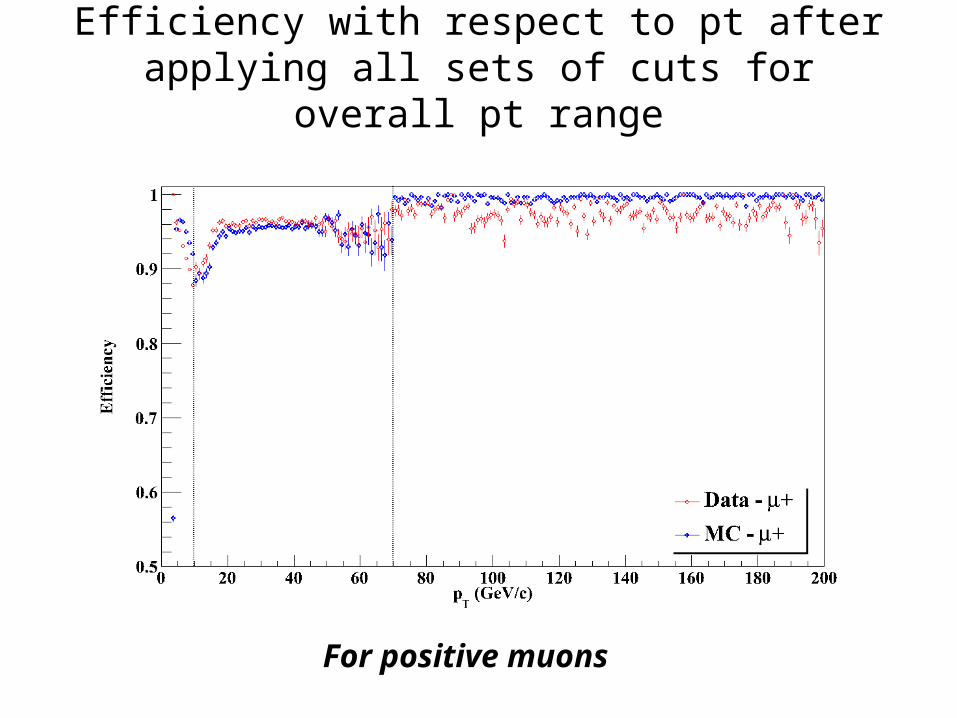
Efficiency with respect to pt after applying all sets of cuts for overall pt range
For positive muons
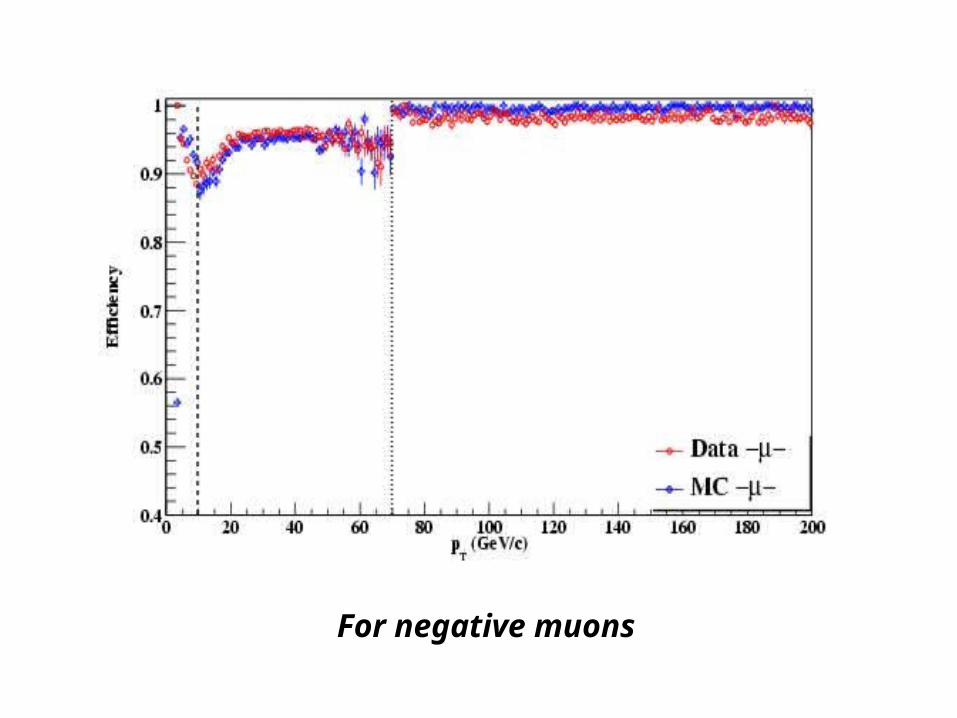
For negative muons
Summary and perspectives• Data-driven method measuring RPC trigger effectiveness in CMS muon
framework– Fulfilling GMT and L1 requirements in trigger stage– Providing information employed in stand-alone reconstruction seeding
• η and φ cuts improve– the matching between the two curves– efficiencies.
• RPC Trigger efficiency curves after cuts show flat behavior with respect to transverse momentum.
• The discrimination between differently charged muons yielded a clearer picture of detector behavior for low pT muons.– Different ‘φ’ ranges are affected by cracks
• For low momentum regions and also on the edges of momenta range for muons from W decay results are effected by the statistical fluctuations and also smaller probability of low momentum muons to hit enough chambers to create a trigger.
• Work in progress…– Use of method for other muon detectors as well and plugging it for physics oriented
performance evaluation analysis– Delivery of the method for real data applications
14

Study of Muon trigger efficiencies with official Tag & Probe package for ICHEP
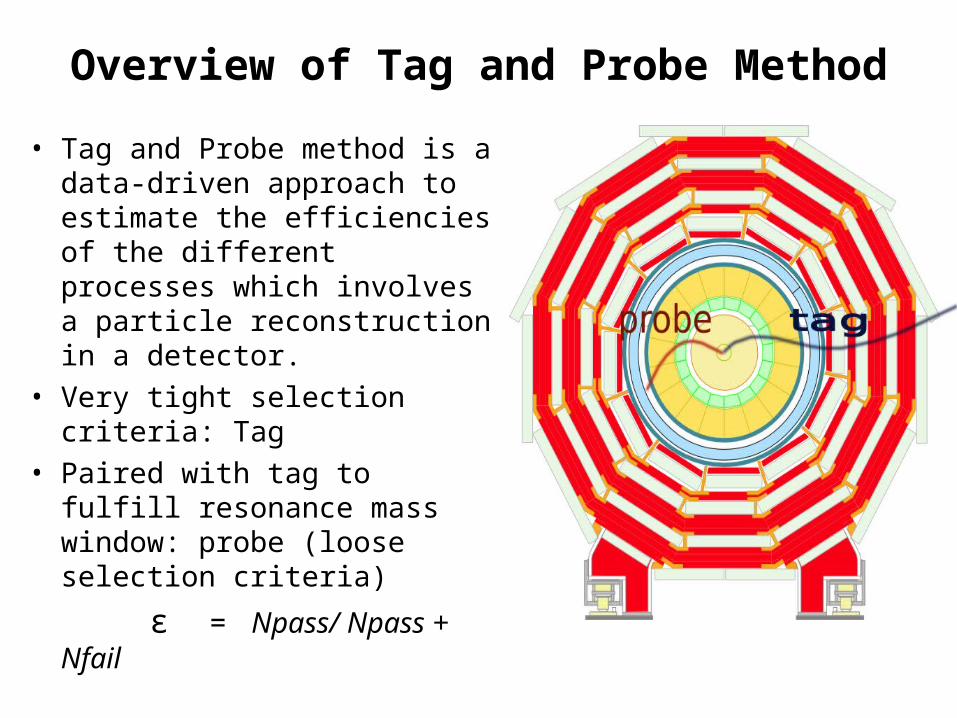
Overview of Tag and Probe Method
• Tag and Probe method is a data-driven approach to estimate the efficiencies of the different processes which involves a particle reconstruction in a detector.
• Very tight selection criteria: Tag
• Paired with tag to fulfill resonance mass window: probe (loose selection criteria)
ε = Npass/ Npass + Nfail
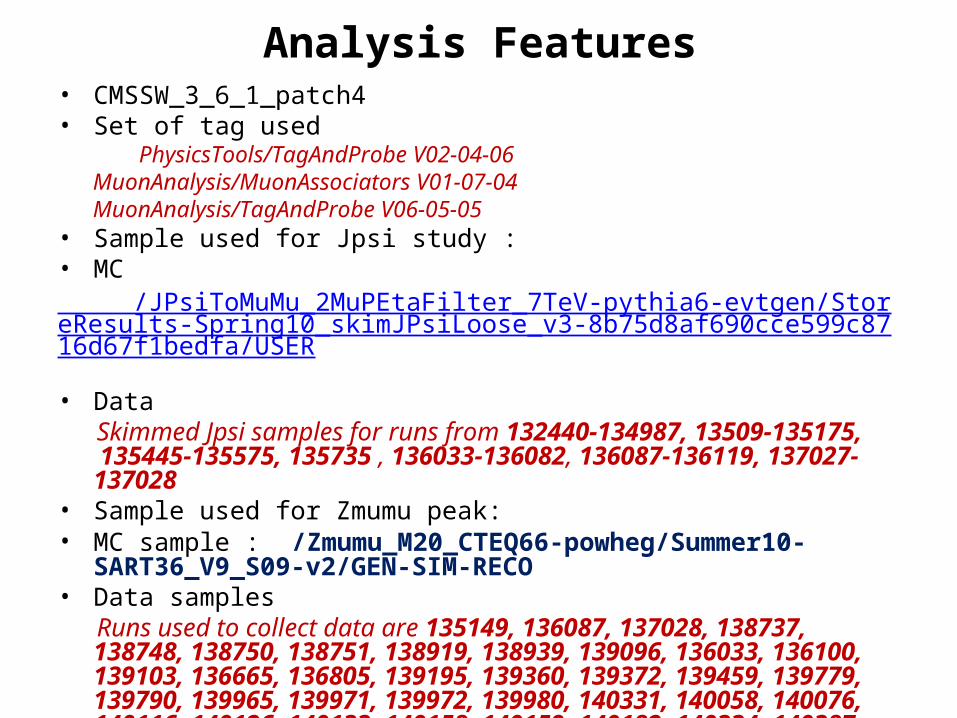
Analysis Features• CMSSW_3_6_1_patch4• Set of tag used PhysicsTools/TagAndProbe V02-04-06 MuonAnalysis/MuonAssociators V01-07-04 MuonAnalysis/TagAndProbe V06-05-05• Sample used for Jpsi study :• MC /JPsiToMuMu_2MuPEtaFilter_7TeV-pythia6-evtgen/StoreResults-Spring10_skimJPsiLoose_v3-8b75d8af690cce599c8716d67f1bedfa/USER
• Data Skimmed Jpsi samples for runs from 132440-134987, 13509-135175, 135445-
135575, 135735 , 136033-136082, 136087-136119, 137027-137028 • Sample used for Zmumu peak:• MC sample : /Zmumu_M20_CTEQ66-powheg/Summer10-
SART36_V9_S09-v2/GEN-SIM-RECO• Data samples Runs used to collect data are 135149, 136087, 137028, 138737, 138748,
138750, 138751, 138919, 138939, 139096, 136033, 136100, 139103, 136665, 136805, 139195, 139360, 139372, 139459, 139779, 139790, 139965, 139971, 139972, 139980, 140331, 140058, 140076, 140116, 140126, 140133, 140158, 140159, 140182, 140334, 140387
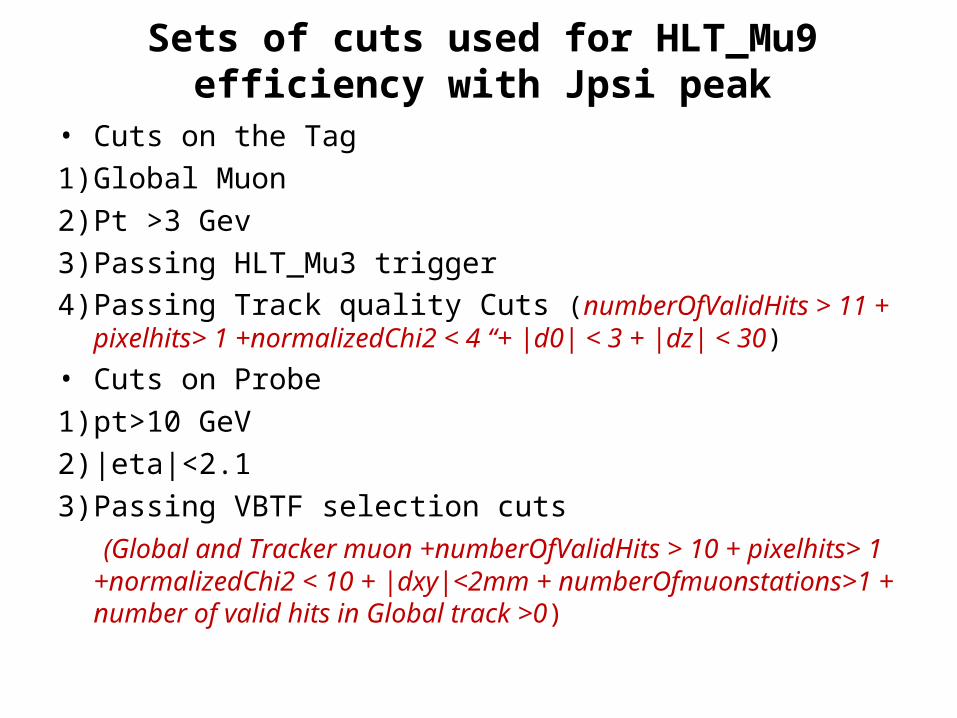
Sets of cuts used for HLT_Mu9 efficiency with Jpsi peak
• Cuts on the Tag
1) Global Muon
2) Pt >3 Gev
3) Passing HLT_Mu3 trigger
4) Passing Track quality Cuts (numberOfValidHits > 11 + pixelhits> 1 +normalizedChi2 < 4 “+ |d0| < 3 + |dz| < 30)
• Cuts on Probe
1) pt>10 GeV
2) |eta|<2.1
3) Passing VBTF selection cuts
(Global and Tracker muon +numberOfValidHits > 10 + pixelhits> 1 +normalizedChi2 < 10 + |dxy|<2mm + numberOfmuonstations>1 + number of valid hits in Global track >0)
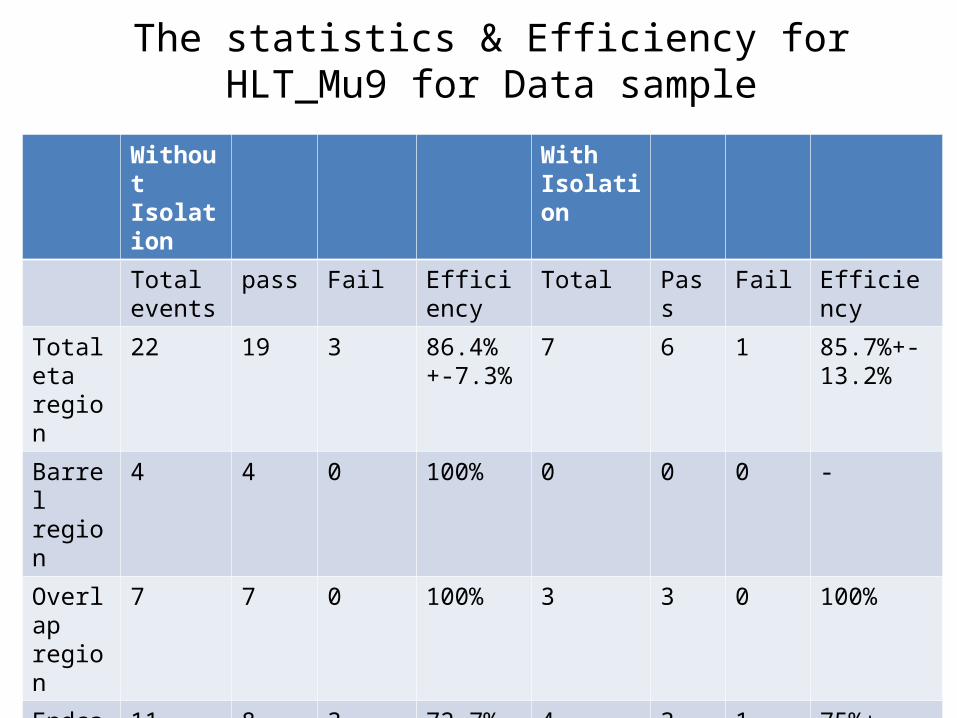
The statistics & Efficiency for HLT_Mu9 for Data sample
Without Isolation
With Isolation
Total events
pass Fail Efficiency Total Pass Fail Efficiency
Total eta region
22 19 3 86.4%+-7.3%
7 6 1 85.7%+-13.2%
Barrel region
4 4 0 100% 0 0 0 -
Overlap region
7 7 0 100% 3 3 0 100%
Endcap region
11 8 3 72.7%+-13.4%
4 3 1 75%+-21.6%
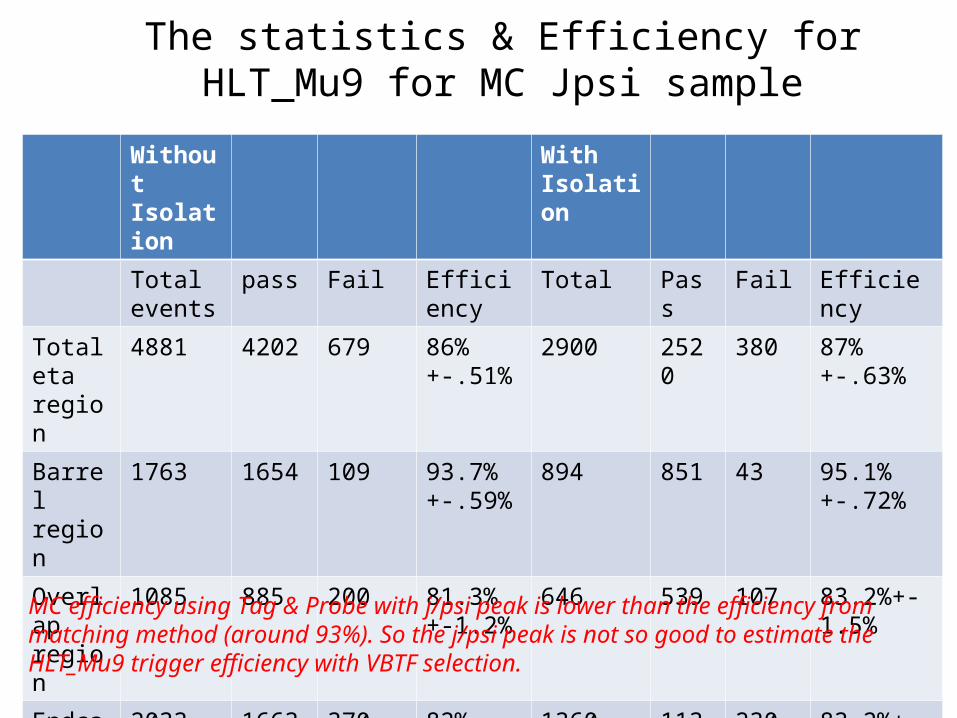
The statistics & Efficiency for HLT_Mu9 for MC Jpsi sample
Without Isolation
With Isolation
Total events
pass Fail Efficiency Total Pass Fail Efficiency
Total eta region
4881 4202 679 86%+-.51%
2900 2520 380 87%+-.63%
Barrel region
1763 1654 109 93.7%+-.59%
894 851 43 95.1%+-.72%
Overlap region
1085 885 200 81.3%+-1.2%
646 539 107 83.2%+-1.5%
Endcap region
2033 1663 370 82%+-.88%
1360 1130 230 83.2%+-1.0%
MC efficiency using Tag & Probe with j/psi peak is lower than the efficiency from matching method (around 93%). So the j/psi peak is not so good to estimate the HLT_Mu9 trigger efficiency with VBTF selection.
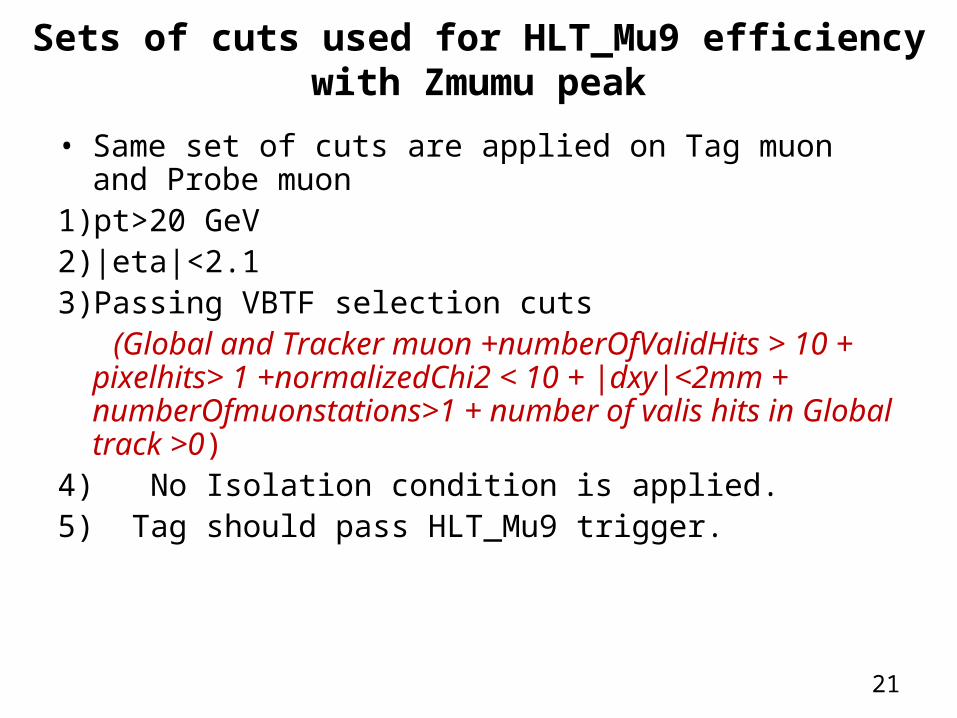
Sets of cuts used for HLT_Mu9 efficiency with Zmumu peak
• Same set of cuts are applied on Tag muon and Probe muon1) pt>20 GeV2) |eta|<2.13) Passing VBTF selection cuts (Global and Tracker muon +numberOfValidHits > 10 +
pixelhits> 1 +normalizedChi2 < 10 + |dxy|<2mm + numberOfmuonstations>1 + number of valis hits in Global track >0)
4) No Isolation condition is applied.5) Tag should pass HLT_Mu9 trigger.
21
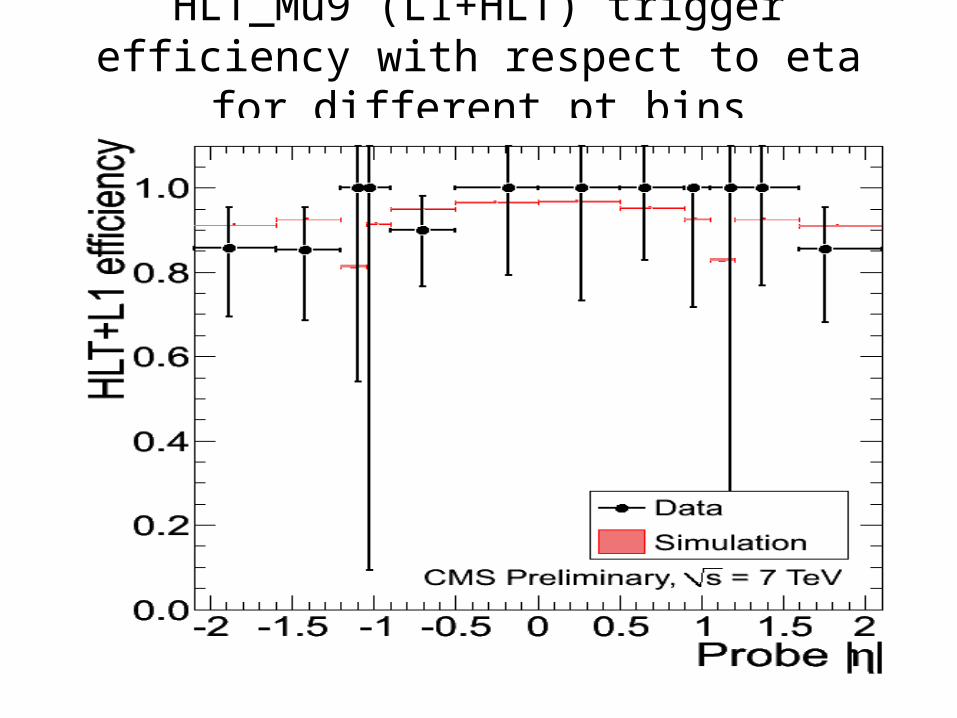
HLT_Mu9 (L1+HLT) trigger efficiency with respect to eta for different pt bins
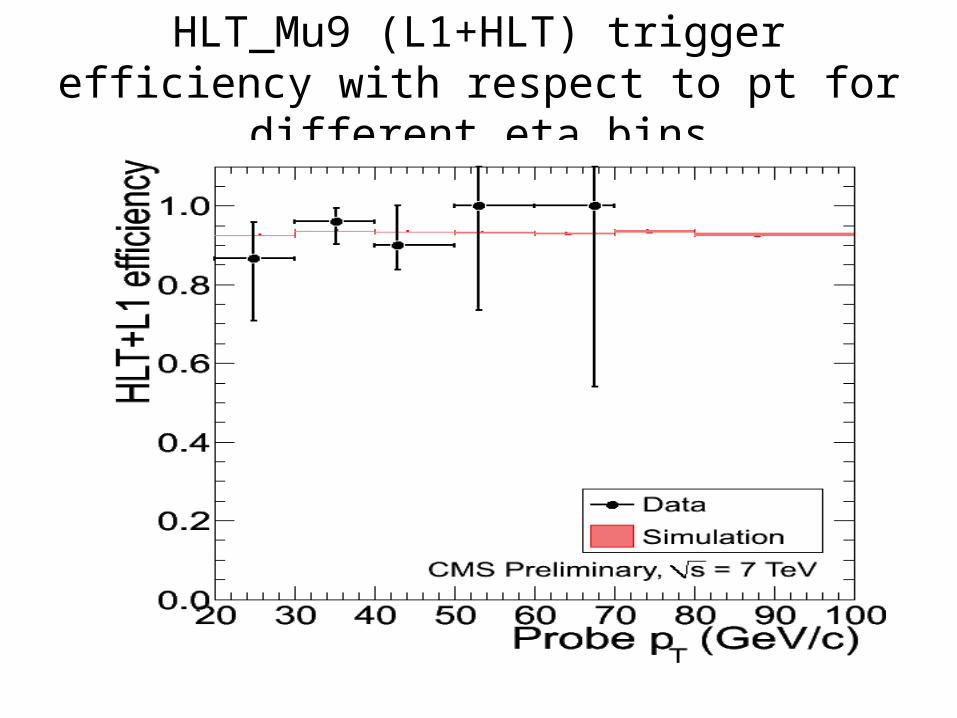
HLT_Mu9 (L1+HLT) trigger efficiency with respect to pt for different eta bins
Summary
• Very few statistics till now for Jpsi so hoping that we can collect more data to make the results better.
• As explained earlier also efficiency with MC sample of Jpsi comes lower then matching method. That's why we have shifted our study to high pt region (Zmumu peak).
• The present study is the first look with real high pt muons from Zmumu candidates . Next step is to update the results with more data.
• The average efficiency of HLT_MU9 trigger with MC Zmumu sample is around 93% which is in agreement with matching method.
• In the barrel part efficiencies with data are MC are in close agreement with matching method. We are investigating the reasons of low efficiencies in endcaps.
Top Related