


γλώσσες
Σελίδες
Νομικός

IntroductionProstate cancer has the highest incidence of any malig-nancy and is the second cause of cancer-related deathsin men in industrialized countries (1). Besides metas-tasis to bone and lymph nodes, the most importantreason for prostate cancer mortality is the progressionfrom androgen-dependent to androgen-independenttumors (2). In the case of metastasis, androgen sup-pression is the leading treatment and currently themost successful. However, as androgen-independentcells are insensitive to this treatment, they continue togrow and prevent cancer regression (3). This insensi-
tivity is a significant problem considering the generalaging of the population in the United States andEurope. As hormonal ablation and chemotherapy arenot always effective, continuing effort is required tofind new targets for therapeutic intervention.
α1-adrenergic receptor (α1-AR) antagonists arealready in use for the clinical treatment of benign pro-static hyperplasia, where they act directly on the α1-ARspresent in prostatic smooth muscle (4). Recent studieshave demonstrated that α1-AR antagonists such as dox-azosin and terazosin induce apoptosis in primaryhuman prostate cancer epithelial (hPCE) cells andsmooth muscle cells without affecting cellular prolifer-ation (5). While this finding is apparently very promis-ing, the mechanism of apoptosis induction in prostatecancer cells by α-antagonists seems to be α1-AR–inde-pendent (5, 6), so whereas prostate epithelial cells seemto express α1-ARs, their functional role in these partic-ular cells has yet to be established.
Among α1-AR subtypes, α1A is believed to be pre-dominant in the fibromuscular stroma of the prostate(7–11). Its stimulation leads principally to the activationof phospholipase C (PLC), ultimately resulting in anincrease in intracellular free Ca2+ via inositol triphos-phate (IP3) and diacylglycerol (DAG) production (12,13). Recent studies in vascular smooth muscles haveshown that α1-ARs may also activate Ca2+-permeablenonselective cationic channels (14) and that TRPC6 —a member of the transient receptor potential (TRP)channel family originally found in Drosophila and thendiscovered in most mammalian tissues (15) — may be anessential component of these channels (16). Enhanced
The Journal of Clinical Investigation | June 2003 | Volume 111 | Number 11 1691
α1-adrenergic receptors activate Ca2+-permeable cationicchannels in prostate cancer epithelial cells
Stephanie Thebault, Morad Roudbaraki, Vadim Sydorenko, Yaroslav Shuba, Loic Lemonnier, Christian Slomianny, Etienne Dewailly, Jean-Louis Bonnal, Brigitte Mauroy, Roman Skryma, and Natalia Prevarskaya
Laboratoire de Physiologie Cellulaire, Institut National de la Santé et de la Recherche Médicale (INSERM) EMI 0228,Villeneuve d’Ascq, France
The prostate gland is a rich source of α1-adrenergic receptors (α1-ARs). α1-AR antagonists are com-monly used in the treatment of benign prostatic hyperplasia symptoms, due to their action onsmooth muscle cells. However, virtually nothing is known about the role of α1-ARs in epithelial cells.Here, by using two human prostate cancer epithelial (hPCE) cell models — primary cells from resec-tion specimens (primary hPCE cells) and an LNCaP (lymph node carcinoma of the prostate) cell line— we identify an α1A subtype of adrenergic receptor (α1A-AR) and show its functional coupling toplasmalemmal cationic channels via direct diacylglycerol (DAG) gating. In both cell types, agonist-mediated stimulation of α1A-ARs and DAG analogues activated similar cationic membrane currentsand Ca2+ influx. These currents were sensitive to the α1A-AR antagonists, prazosin and WB4101, andto transient receptor potential (TRP) channel blockers, 2–aminophenyl borate and SK&F 96365.Chronic activation of α1A-ARs enhanced LNCaP cell proliferation, which could be antagonized byα1A-AR and TRP inhibitors. Collectively, our results suggest that α1-ARs play a role in promotinghPCE cell proliferation via TRP channels.
J. Clin. Invest. 111:1691–1701 (2003). doi:10.1172/JCI200316293.
Received for publication June 26, 2002, and accepted in revised form April 1, 2003.
Address correspondence to: N. Prevarskaya, Laboratoire dePhysiologie Cellulaire, INSERM EMI 0228, Bâtiment SN3,Université des Sciences et Technologies de Lille, 59655 Villeneuved’Ascq Cedex, France. Phone: 33-3-20-33-60-18; Fax: 33-3-20-43-40-66; E-mail: [email protected]. Shuba’s present address is: Bogomoletz Institute of Physiology,Kiev, Ukraine.Conflict of interest: The authors have declared that no conflict ofinterest exists.Nonstandard abbreviations used: α1-adrenergic receptor (α1-AR); human prostate cancer epithelial cell (hPCE cell);phospholipase C (PLC); inositol triphosphate (IP3); diacylglycerol(DAG); transient receptor potential (TRP); α1A subtype of α1-AR (α1A-AR); lymph node carcinoma of the prostate cells (LNCaPcells); intracellular Ca2+ concentration ([Ca2+]i); phenylephrine(Phe); intracellular Ca2+ oscillations (osc); 2–aminophenyl borate(2-APB); store-operated Ca2+-channel (SOC); 1-oleoyl-2-acetyl-sn-glycerol (OAG); 1,2-dioctanoyl-sn-glycerol (DOG); extracellularCa2+ concentration ([Ca2+]out); Phe-activated current (IPhe); current reversal potential (Erev).
Ca2+ entry due to overexpression of one of the TRPs,TRPC1, has been shown to be linked to the proliferationof human pulmonary myocytes (17). Given that, in gen-eral, mitogen-mediated cell growth requires an increasein cytosolic Ca2+ concentration (18), these facts high-light the role of TRP channels in maintaining a highintracellular Ca2+ concentration during proliferation.However, our data on the expression and physiologicalroles of TRPs in the prostate are still incomplete.
This study was designed to identify any store-inde-pendent mechanisms in α1-AR–activated Ca2+ entry inhPCE cells. We show, to our knowledge for the firsttime, that hPCE cells express the α1A subtype of α1-AR(α1A-AR) and demonstrate that the α1-AR antagonistsprazosin and WB4101, as well as SK&F 96365, aninhibitor of receptor-mediated Ca2+ entry, inhibit theproliferative effects of α1-AR agonists. Furthermore,our data on the nature of α1-AR–stimulated trans-membrane Ca2+ entry suggest that it has a substantialstore-independent component that is mediated bymembers of the TRP-channel family.
MethodsCell cultures. Lymph node carcinoma of the prostate(LNCaP) cells from American Type Culture Collection(Rockville, Maryland, USA) were cultivated in RPMI1640 medium (BioWhittaker SA, Verviers, Belgium),supplemented with 5 mM L-glutamine (Sigma-Aldrich,L’Isle d’Abeau, France) and 10% FBS (Applera FranceSA, Courtaboeuf, France). The culture medium alsocontained 50,000 IU/l penicillin and 50 mg/l strepto-mycin. Primary hPCE cells were cultivated in KSF medi-um (Invitrogen SARL, Cergy Pontoise, France) supple-mented with 50 µg/ml bovine pituitary extract and 50ng/ml EGF. Cells were routinely grown in 50-ml flasks(Nunc, Applera France SA) and kept at 37°C in ahumidified incubator in an atmosphere of 5% CO2. Forelectrophysiology and calcium imagery experiments,the cells were subcultured in Petri dishes (Nunc;Dominique Dutscher SA, Issy-les Moulineaux, France)and used after 3–6 days.
Calcium imaging. Intracellular Ca2+ concentration([Ca2+]i) was measured using Fura-2 (the detailed proce-dure has been described previously) (19, 20). The extra-cellular solution contained (in mM): 120 NaCl, 6 KCl, 2CaCl2, 2 MgCl2, 10 HEPES, and 12 glucose. For Ca2+-freeHBSS, CaCl2 was removed and 0.5 mM EGTA was added.
Electrophysiology and solutions. Regular and perforatedwhole-cell patch-clamp techniques were used for cur-rent recording, as detailed elsewhere (21, 22). Theextracellular solution contained (in mM): 130 CsCl, 5KCl, 10 glucose, 2 CaCl2, 2 MgCl2, 10 HEPES, and 20TEA-OH, adjusted to pH 7.3 with HCl. In the whole-cell experiments, the intracellular solution contained(in mM): 50 CsCl, 90 CsOH, 2 MgCl2, 3 CaCl2 (calcu-lated [Ca2+]free = 280 nM), 5 glucose, 10 HEPES, 4EGTA, and 2 Na-ATP, adjusted to pH 7.2 with glu-tamic acid. In the perforated-patch experiments, theintracellular solution contained (in mM): 55 CsCl, 70
Cs2SO4, 7 MgCl2, 1 CaCl2, 5 glucose, and 10 HEPES,adjusted to pH 7.2 with CsOH.
For monovalent cation permeability measurements, weomitted KCl from the extracellular solution and replacedit with 135 mM of either NaCl or CsCl. Divalent cationpermeability was measured in a solution containing 10mM CaCl2, BaCl2, or MgCl2 and 125 mM N-methyl-D-glu-camine replacing CsCl and KCl. The permeability ratioswere calculated on the basis of shifts in reversal potential,using formulas presented in Watanabe et al. (23).
Immunofluorescence staining. The cells were permeabi-lized in acetone at –20°C for 15 minutes. They were thenplaced on slides and blocked with 1.2% gelatin in PBS for30 minutes to avoid nonspecific binding. They were thenincubated overnight at 4°C in 100% humidity, togetherwith the primary antibodies for α1A-AR (Santa CruzBiotechnology Inc., Santa Cruz, California, USA), cytok-eratin 18 (NeoMarkers, Fremont, California, USA), andcytokeratin 14 (Chemicon International, Temecula, Cal-ifornia, USA). After several washes in 1.2% gelatin in PBS,the slides were incubated at 37°C for 1 hour with the sec-ondary antibodies donkey anti-goat IgG labeled withFITC (Chemicon International) and anti-mouse IgGlabeled with Rhodamine Red-X (Jackson Immuno-Research Laboratories Inc., West Grove, Pennsylvania,USA), then washed in PBS and mounted in Mowiol(Mowiol, Aldrich, France). The sections were observedunder a Zeiss Axiophot microscope (Carl Zeiss Inc.,Thornwood, New York, USA) equipped with epifluores-cence (FITC: excitation, 450–490 nm; emission, 520 nm.Rhodamine Red-X: excitation, 570 nm; emission, 590nm). Negative controls consisted of the omission of theprimary antibody.
Western analysis. Western analysis of protein expressionwas carried out as previously described (22). Anti–α1A-ARantibody was from Santa Cruz Biotechnology Inc.
RT-PCR analysis. Total RNA from the LNCaP cell linewas isolated by the guanidium thiocyanate–phenol-chloroform extraction procedure. After treatment with0.1 U/µl deoxyribonuclease I (Invitrogen SARL) for 1hour at 25°C to eliminate genomic DNA, total RNAwas reverse transcribed into cDNA as described byRoudbaraki et al. (24). For the PCR reaction, specificsense and antisense primers were selected, based onGenBank TRP sequences, using GeneJockey II (Biosoft,Cambridge, United Kingdom). Primers were synthe-sized by Invitrogen SARL. Human TRPC1 splice vari-ant TRPC1A–specific sense and antisense primers(GenBank accession no. P19334) were: 5′-TTCCTCTC-CATCCTCTTCCTCG-3′ (nucleotides 795–816) and 5′-CATAGTTGTTACGATGAGCAGC-3′ (nucleotides 1,231–1,252). The predicted size of the PCR-amplified prod-uct was 457 bp for TRPC1 and 355 bp for the TRPC1Asplice variant. Human TRPC3-specific sense and anti-sense primers (GenBank accession no. U47050) were:5′-GGAAAAACATTACCTCCACCTTTCA-3′ (nucleotides2,260–2,284) and 5′-CTCAGTTGCTTGGCTCTTGTCT-TCC-3′ (nucleotides 2,619–2,643). The predicted size ofthe PCR-amplified TRPC3 product was 383 bp.
1692 The Journal of Clinical Investigation | June 2003 | Volume 111 | Number 11
The primers used for amplification were (a) the 625-bp part of the human TRPC6 coding sequence (Gen-Bank accession no. AJ271066): 5′-GAACTTAGCAAT-GAACTGGCAGT-3′ (sense, nucleotides 895–917) and5′-CATATCATGCCTATTACCCAGGA-3′ (antisense, nuc-leotides 1,499–1,521); and (b) the 477-bp part ofhuman TRPC7 cDNA (GenBank accession no.NM020389): 5′-GTCCGAATGCAAGGAAATCT-3′ (sense,nucleotides 1,356–1,375) and 5′-TGGGTTGTATTTG-GCACCTC-3′ (antisense, nucleotides 1,814–1,833).
Each sample was amplified using AmpliTaq GoldDNA Polymerase (Applied Biosystems, Foster City, Cal-ifornia, USA) in an automated thermal cycler (GeneAmp2400; Applied Biosystems). DNA amplification condi-tions included an initial 7-minute denaturation step at95°C (which also activated the AmpliTaq Gold) and 40cycles of 30 seconds at 95°C, 30 seconds at 58°C, 40 sec-onds at 72°C, and a final elongation of 7 minutes at72°C. The RT-PCR samples were electrophoresed on a1.5% agarose gel and stained with ethidium bromide (0.5µg/ml), then photographed under UV light. In order tostudy band identity, the RT-PCR products were subjectedto restriction enzyme analysis.
Proliferation assays. The CellTiter 96 AQueous Non-Radioactive Cell Proliferation Assay (Promega Corp.,Madison, Wisconsin, USA) was used to determine thenumber of viable cells in proliferation assays. This com-mercial assay is composed of MTS (inner salt) and PMS(an electron coupling reagent). MTS is bioreduced bycells into a formazan that is soluble in the tissue cul-ture medium. The absorbance of the formazan at 490nm is measured directly from 96-well assay plates. Thequantity of formazan produced, measured by theamount of 490 nm absorbance, is directly proportion-al to the number of living cells in the culture. The Dun-net test was used for statistical analyses.
Data analysis. Each experiment was repeated severaltimes and the results were expressed as mean ± SEMwhere appropriate. The data were analyzed and graphswere plotted using Origin 5.0 software (Microcal Soft-ware Inc., Northampton, Massachusetts, USA). Charac-teristic times of membrane current or [Ca2+]i responseto any intervention were determined as follows. Thetime intervals from the onset of the intervention untilthe current or [Ca2+]i reached 0.05(Amax – Abase) and0.95(Amax – Abase) were considered as latency and time-to-peak response periods, respectively, where Abase is thebaseline signal amplitude before the intervention andAmax is the maximal signal amplitude. The time intervalbetween 0.05(Amax – Abase) and 0.95(Amax – Abase) was con-sidered to be the response development time.
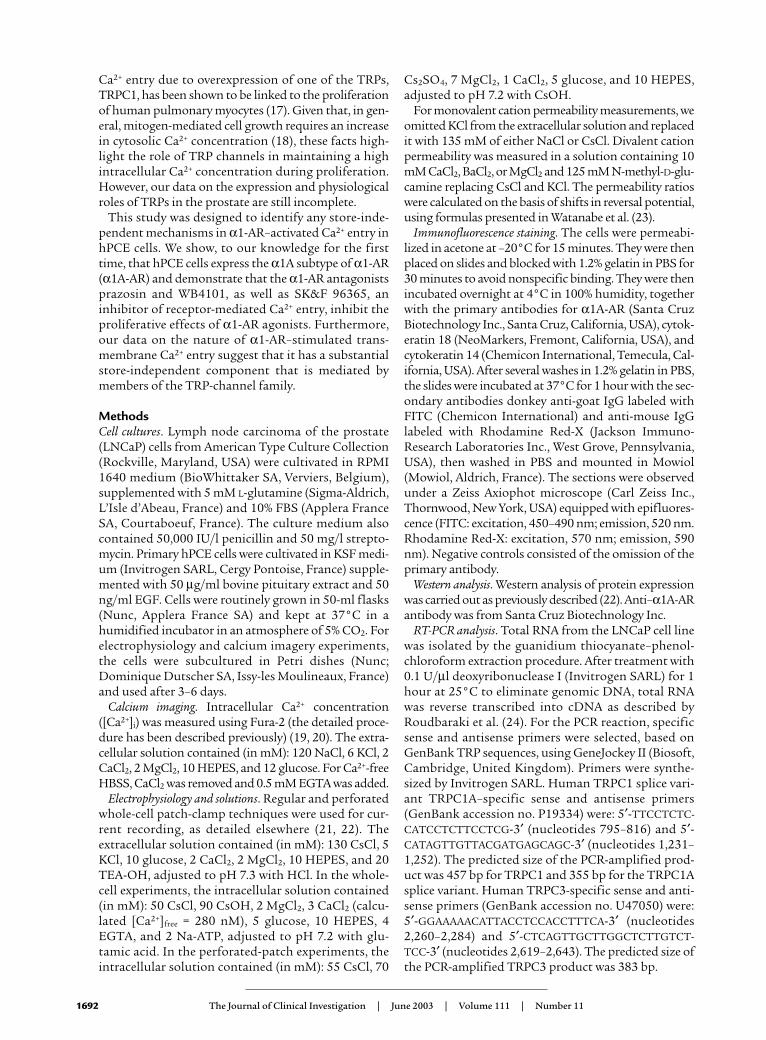
Resultsα1A-AR protein expression in hPCE cells. α1A-ARs are pri-marily distributed in the fibromuscular stroma of theprostate. To demonstrate the expression of α1-ARs in aprimary culture of hPCE cells and in the androgen-dependent LNCaP cell line, we used an immunodetec-tion strategy with a specific antibody for α1A-AR, con-
sidered to be the dominant subtype in the prostate. Fig-ure 1 shows that both primary hPCE cells and LNCaPcells express α1A-AR. With FITC-labeled secondary anti-body alone, no immunoreactivity was detected in eithercell type in response to treatment (data not shown).
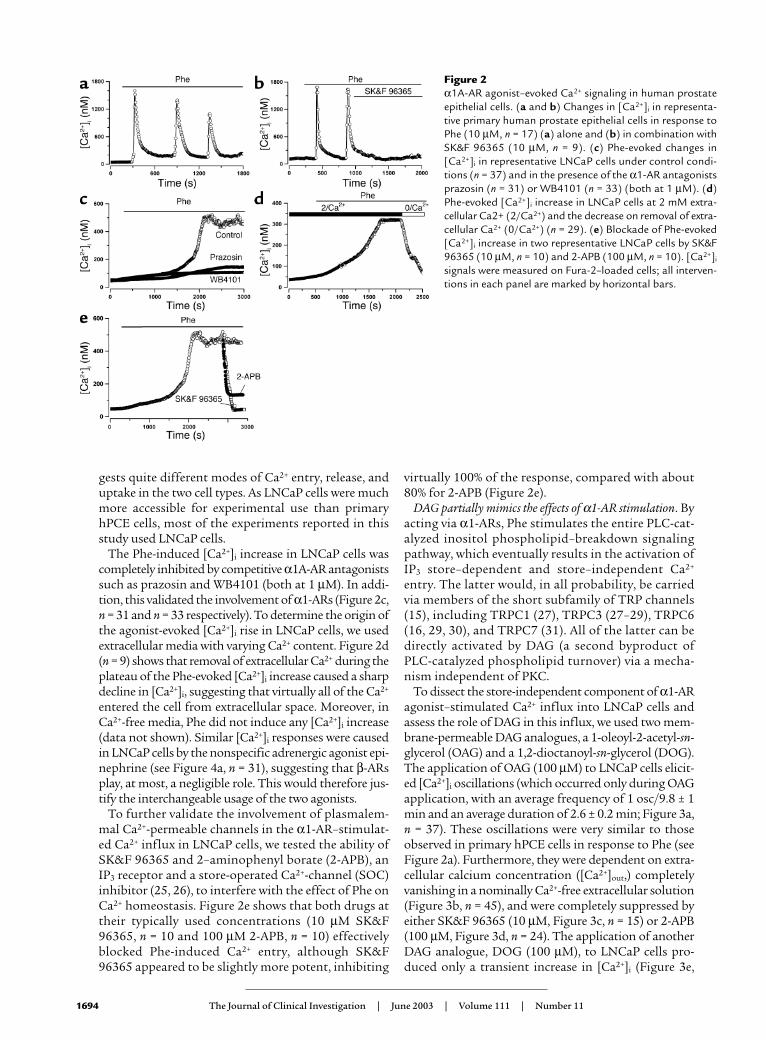
Evidence of functional α1-AR in hPCE cells. Having demon-strated the presence of α1A-AR in hPCE cells, we inves-tigated whether stimulation of this receptor affectedintracellular Ca2+ homeostasis. Figure 2 shows thatapplying the α1-specific agonist phenylephrine (Phe, 10µM) to primary hPCE cells elicited intracellular Ca2+
oscillations (osc), which occurred only during agonistapplication, with an average frequency of 1 osc/8.4 ± 0.6min and an average duration of 2.6 ± 0.2 min (Figure 2a,n = 17). These oscillations were suppressed by SK&F96365, a conventional blocker of receptor-operated Ca2+
entry (25) (10 µM, Figure 2b, n = 9), suggesting that Ca2+
entry is essential to the generation of these oscillations.Exposure of LNCaP cells to 10 µM Phe induced a slow,gradual increase in [Ca2+]i, within 29.0 ± 1.8 min, fol-lowed only by minor oscillations around the [Ca2+]i
plateau (Figure 2c, n = 37), which, however, was also sen-sitive to SK&F 96365 (see Figure 2e). This dramatic dif-ference in [Ca2+]i signal kinetics in response to Phebetween the primary hPCE cells and LNCaP cells sug-
The Journal of Clinical Investigation | June 2003 | Volume 111 | Number 11 1693
Figure 1α1A-AR protein expression in hPCE cells. (a–c) Epifluorescenceimages representing double labeling of the primary culture of hPCEcells with anti–cytokeratin 14 antibody that selectively stains epithe-lial cells (red in a) and with goat anti–α1A-AR antibody (green in b),resulting in an orange interference color (c). (d) Staining of LNCaPcells with goat anti–α1A-AR antibody. (e) Representative Westernblot analysis of α1A-AR in LNCaP cells with goat anti–α1A-AR poly-clonal antibody (see Methods for details). Each experiment wasrepeated several times.
gests quite different modes of Ca2+ entry, release, anduptake in the two cell types. As LNCaP cells were muchmore accessible for experimental use than primaryhPCE cells, most of the experiments reported in thisstudy used LNCaP cells.
The Phe-induced [Ca2+]i increase in LNCaP cells wascompletely inhibited by competitive α1A-AR antagonistssuch as prazosin and WB4101 (both at 1 µM). In addi-tion, this validated the involvement of α1-ARs (Figure 2c,n = 31 and n = 33 respectively). To determine the origin ofthe agonist-evoked [Ca2+]i rise in LNCaP cells, we usedextracellular media with varying Ca2+ content. Figure 2d(n = 9) shows that removal of extracellular Ca2+ during theplateau of the Phe-evoked [Ca2+]i increase caused a sharpdecline in [Ca2+]i, suggesting that virtually all of the Ca2+
entered the cell from extracellular space. Moreover, inCa2+-free media, Phe did not induce any [Ca2+]i increase(data not shown). Similar [Ca2+]i responses were causedin LNCaP cells by the nonspecific adrenergic agonist epi-nephrine (see Figure 4a, n = 31), suggesting that β-ARsplay, at most, a negligible role. This would therefore jus-tify the interchangeable usage of the two agonists.
To further validate the involvement of plasmalem-mal Ca2+-permeable channels in the α1-AR–stimulat-ed Ca2+ influx in LNCaP cells, we tested the ability ofSK&F 96365 and 2–aminophenyl borate (2-APB), anIP3 receptor and a store-operated Ca2+-channel (SOC)inhibitor (25, 26), to interfere with the effect of Phe onCa2+ homeostasis. Figure 2e shows that both drugs attheir typically used concentrations (10 µM SK&F96365, n = 10 and 100 µM 2-APB, n = 10) effectivelyblocked Phe-induced Ca2+ entry, although SK&F96365 appeared to be slightly more potent, inhibiting
virtually 100% of the response, compared with about80% for 2-APB (Figure 2e).
DAG partially mimics the effects of α1-AR stimulation. Byacting via α1-ARs, Phe stimulates the entire PLC-cat-alyzed inositol phospholipid–breakdown signalingpathway, which eventually results in the activation ofIP3 store–dependent and store–independent Ca2+
entry. The latter would, in all probability, be carriedvia members of the short subfamily of TRP channels(15), including TRPC1 (27), TRPC3 (27–29), TRPC6(16, 29, 30), and TRPC7 (31). All of the latter can bedirectly activated by DAG (a second byproduct ofPLC-catalyzed phospholipid turnover) via a mecha-nism independent of PKC.
To dissect the store-independent component of α1-ARagonist–stimulated Ca2+ influx into LNCaP cells andassess the role of DAG in this influx, we used two mem-brane-permeable DAG analogues, a 1-oleoyl-2-acetyl-sn-glycerol (OAG) and a 1,2-dioctanoyl-sn-glycerol (DOG).The application of OAG (100 µM) to LNCaP cells elicit-ed [Ca2+]i oscillations (which occurred only during OAGapplication, with an average frequency of 1 osc/9.8 ± 1min and an average duration of 2.6 ± 0.2 min; Figure 3a,n = 37). These oscillations were very similar to thoseobserved in primary hPCE cells in response to Phe (seeFigure 2a). Furthermore, they were dependent on extra-cellular calcium concentration ([Ca2+]out,) completelyvanishing in a nominally Ca2+-free extracellular solution(Figure 3b, n = 45), and were completely suppressed byeither SK&F 96365 (10 µM, Figure 3c, n = 15) or 2-APB(100 µM, Figure 3d, n = 24). The application of anotherDAG analogue, DOG (100 µM), to LNCaP cells pro-duced only a transient increase in [Ca2+]i (Figure 3e,
1694 The Journal of Clinical Investigation | June 2003 | Volume 111 | Number 11
Figure 2α1A-AR agonist–evoked Ca2+ signaling in human prostateepithelial cells. (a and b) Changes in [Ca2+]i in representa-tive primary human prostate epithelial cells in response toPhe (10 µM, n = 17) (a) alone and (b) in combination withSK&F 96365 (10 µM, n = 9). (c) Phe-evoked changes in[Ca2+]i in representative LNCaP cells under control condi-tions (n = 37) and in the presence of the α1-AR antagonistsprazosin (n = 31) or WB4101 (n = 33) (both at 1 µM). (d)Phe-evoked [Ca2+]i increase in LNCaP cells at 2 mM extra-cellular Ca2+ (2/Ca2+) and the decrease on removal of extra-cellular Ca2+ (0/Ca2+) (n = 29). (e) Blockade of Phe-evoked[Ca2+]i increase in two representative LNCaP cells by SK&F96365 (10 µM, n = 10) and 2-APB (100 µM, n = 10). [Ca2+]i
signals were measured on Fura-2–loaded cells; all interven-tions in each panel are marked by horizontal bars.
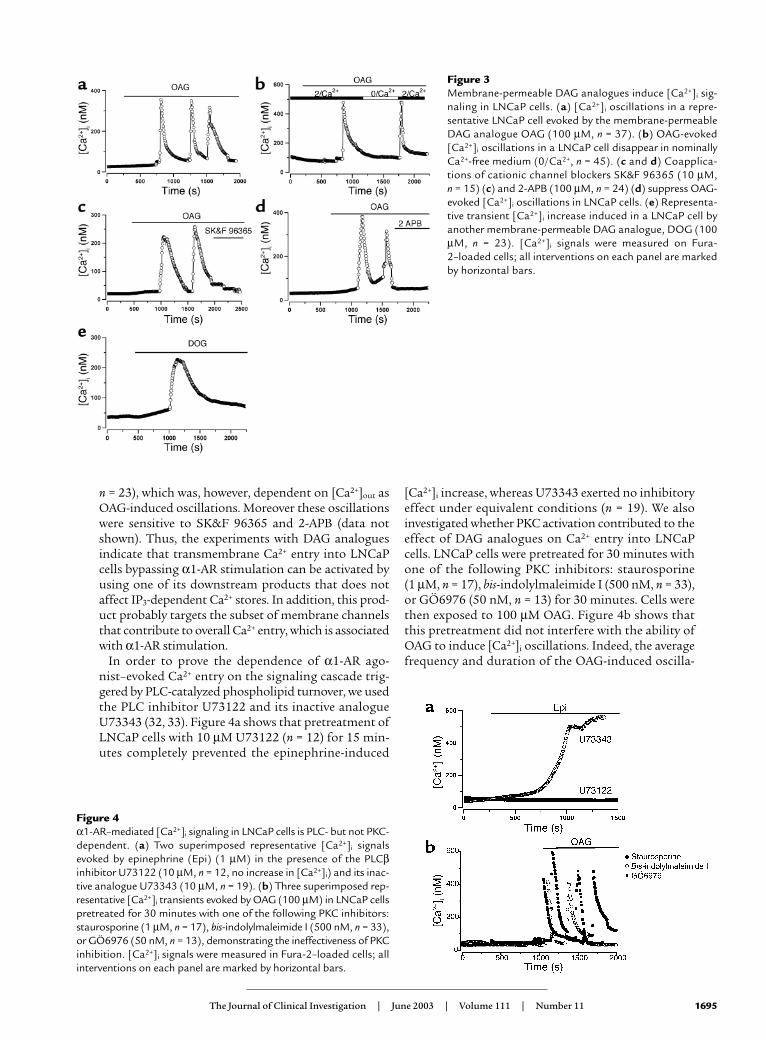
n = 23), which was, however, dependent on [Ca2+]out asOAG-induced oscillations. Moreover these oscillationswere sensitive to SK&F 96365 and 2-APB (data notshown). Thus, the experiments with DAG analoguesindicate that transmembrane Ca2+ entry into LNCaPcells bypassing α1-AR stimulation can be activated byusing one of its downstream products that does notaffect IP3-dependent Ca2+ stores. In addition, this prod-uct probably targets the subset of membrane channelsthat contribute to overall Ca2+ entry, which is associatedwith α1-AR stimulation.
In order to prove the dependence of α1-AR ago-nist–evoked Ca2+ entry on the signaling cascade trig-gered by PLC-catalyzed phospholipid turnover, we usedthe PLC inhibitor U73122 and its inactive analogueU73343 (32, 33). Figure 4a shows that pretreatment ofLNCaP cells with 10 µM U73122 (n = 12) for 15 min-utes completely prevented the epinephrine-induced
[Ca2+]i increase, whereas U73343 exerted no inhibitoryeffect under equivalent conditions (n = 19). We alsoinvestigated whether PKC activation contributed to theeffect of DAG analogues on Ca2+ entry into LNCaPcells. LNCaP cells were pretreated for 30 minutes withone of the following PKC inhibitors: staurosporine (1 µM, n = 17), bis-indolylmaleimide I (500 nM, n = 33),or GÖ6976 (50 nM, n = 13) for 30 minutes. Cells werethen exposed to 100 µM OAG. Figure 4b shows thatthis pretreatment did not interfere with the ability ofOAG to induce [Ca2+]i oscillations. Indeed, the averagefrequency and duration of the OAG-induced oscilla-
The Journal of Clinical Investigation | June 2003 | Volume 111 | Number 11 1695
Figure 3Membrane-permeable DAG analogues induce [Ca2+]i sig-naling in LNCaP cells. (a) [Ca2+]i oscillations in a repre-sentative LNCaP cell evoked by the membrane-permeableDAG analogue OAG (100 µM, n = 37). (b) OAG-evoked[Ca2+]i oscillations in a LNCaP cell disappear in nominallyCa2+-free medium (0/Ca2+, n = 45). (c and d) Coapplica-tions of cationic channel blockers SK&F 96365 (10 µM, n = 15) (c) and 2-APB (100 µM, n = 24) (d) suppress OAG-evoked [Ca2+]i oscillations in LNCaP cells. (e) Representa-tive transient [Ca2+]i increase induced in a LNCaP cell byanother membrane-permeable DAG analogue, DOG (100µM, n = 23). [Ca2+]i signals were measured on Fura-2–loaded cells; all interventions on each panel are markedby horizontal bars.
Figure 4α1-AR–mediated [Ca2+]i signaling in LNCaP cells is PLC- but not PKC-dependent. (a) Two superimposed representative [Ca2+]i signalsevoked by epinephrine (Epi) (1 µM) in the presence of the PLCβinhibitor U73122 (10 µM, n = 12, no increase in [Ca2+]i) and its inac-tive analogue U73343 (10 µM, n = 19). (b) Three superimposed rep-resentative [Ca2+]i transients evoked by OAG (100 µM) in LNCaP cellspretreated for 30 minutes with one of the following PKC inhibitors:staurosporine (1 µM, n = 17), bis-indolylmaleimide I (500 nM, n = 33),or GÖ6976 (50 nM, n = 13), demonstrating the ineffectiveness of PKCinhibition. [Ca2+]i signals were measured in Fura-2–loaded cells; allinterventions on each panel are marked by horizontal bars.
tions in the presence of PKC inhibitors (1 osc/9.5 ± 0.8min, data not shown) was similar to that estimated inthe absence of PKC inhibitors (1 osc/9.8 ± 1.0 min).These results rule out PKC involvement in [Ca2+]i oscil-lations and strongly suggest that OAG may act direct-ly on the channels, underpinning the notion of ago-nist-evoked Ca2+ influx into LNCaP cells.
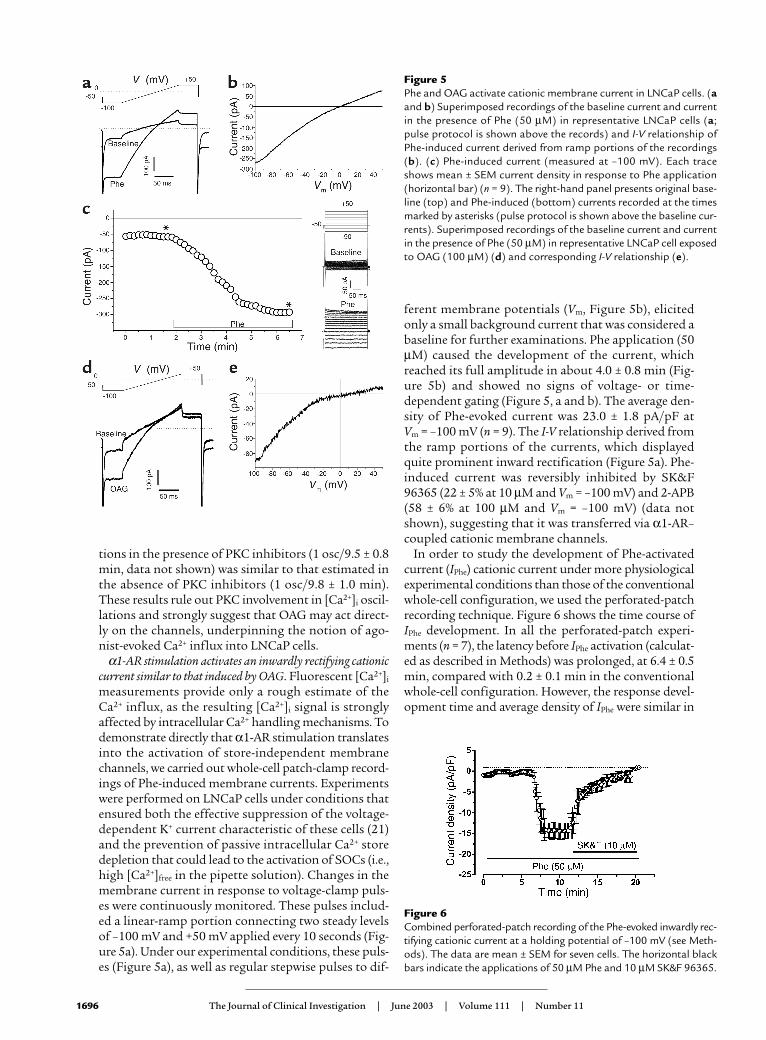
α1-AR stimulation activates an inwardly rectifying cationiccurrent similar to that induced by OAG. Fluorescent [Ca2+]i
measurements provide only a rough estimate of theCa2+ influx, as the resulting [Ca2+]i signal is stronglyaffected by intracellular Ca2+ handling mechanisms. Todemonstrate directly that α1-AR stimulation translatesinto the activation of store-independent membranechannels, we carried out whole-cell patch-clamp record-ings of Phe-induced membrane currents. Experimentswere performed on LNCaP cells under conditions thatensured both the effective suppression of the voltage-dependent K+ current characteristic of these cells (21)and the prevention of passive intracellular Ca2+ storedepletion that could lead to the activation of SOCs (i.e.,high [Ca2+]free in the pipette solution). Changes in themembrane current in response to voltage-clamp puls-es were continuously monitored. These pulses includ-ed a linear-ramp portion connecting two steady levelsof –100 mV and +50 mV applied every 10 seconds (Fig-ure 5a). Under our experimental conditions, these puls-es (Figure 5a), as well as regular stepwise pulses to dif-
ferent membrane potentials (Vm, Figure 5b), elicitedonly a small background current that was considered abaseline for further examinations. Phe application (50µM) caused the development of the current, whichreached its full amplitude in about 4.0 ± 0.8 min (Fig-ure 5b) and showed no signs of voltage- or time-dependent gating (Figure 5, a and b). The average den-sity of Phe-evoked current was 23.0 ± 1.8 pA/pF at Vm = –100 mV (n = 9). The I-V relationship derived fromthe ramp portions of the currents, which displayedquite prominent inward rectification (Figure 5a). Phe-induced current was reversibly inhibited by SK&F96365 (22 ± 5% at 10 µM and Vm = –100 mV) and 2-APB(58 ± 6% at 100 µM and Vm = –100 mV) (data notshown), suggesting that it was transferred via α1-AR–coupled cationic membrane channels.
In order to study the development of Phe-activatedcurrent (IPhe) cationic current under more physiologicalexperimental conditions than those of the conventionalwhole-cell configuration, we used the perforated-patchrecording technique. Figure 6 shows the time course ofIPhe development. In all the perforated-patch experi-ments (n = 7), the latency before IPhe activation (calculat-ed as described in Methods) was prolonged, at 6.4 ± 0.5min, compared with 0.2 ± 0.1 min in the conventionalwhole-cell configuration. However, the response devel-opment time and average density of IPhe were similar in
1696 The Journal of Clinical Investigation | June 2003 | Volume 111 | Number 11
Figure 5Phe and OAG activate cationic membrane current in LNCaP cells. (aand b) Superimposed recordings of the baseline current and currentin the presence of Phe (50 µM) in representative LNCaP cells (a;pulse protocol is shown above the records) and I-V relationship ofPhe-induced current derived from ramp portions of the recordings(b). (c) Phe-induced current (measured at –100 mV). Each traceshows mean ± SEM current density in response to Phe application(horizontal bar) (n = 9). The right-hand panel presents original base-line (top) and Phe-induced (bottom) currents recorded at the timesmarked by asterisks (pulse protocol is shown above the baseline cur-rents). Superimposed recordings of the baseline current and currentin the presence of Phe (50 µM) in representative LNCaP cell exposedto OAG (100 µM) (d) and corresponding I-V relationship (e).
Figure 6Combined perforated-patch recording of the Phe-evoked inwardly rec-tifying cationic current at a holding potential of –100 mV (see Meth-ods). The data are mean ± SEM for seven cells. The horizontal blackbars indicate the applications of 50 µM Phe and 10 µM SK&F 96365.
both perforated (1.45 ± 0.5 min and 15.0 ± 1.9 pA/pF atVm = –100 mV, Figure 6) and conventional whole-cellconfigurations (2.6 ± 0.5 min and 23.0 ± 2.7 pA/pF at Vm = –100 mV, Figure 5b). Phe-induced current was alsoreversibly inhibited by SK&F 96365 (10 µM, n = 4, Figure6) under perforated-patch conditions.
Current with similar properties to that elicited by Phecould also be induced by the membrane-permeable DAGanalogue OAG (100 µM, Figure 5, d and e). This is con-sistent with the hypothesis that IPhe is directly activatedvia the DAG branch of the receptor-bound PLC-catalyzedinositol phospholipid–breakdown signaling pathwayafter stimulation of α1-ARs. The average density of OAG-induced current was 23.0 ± 2.8 pA/pF at Vm = –100 mV (n = 7), with a reversal potential of around 0 mV.
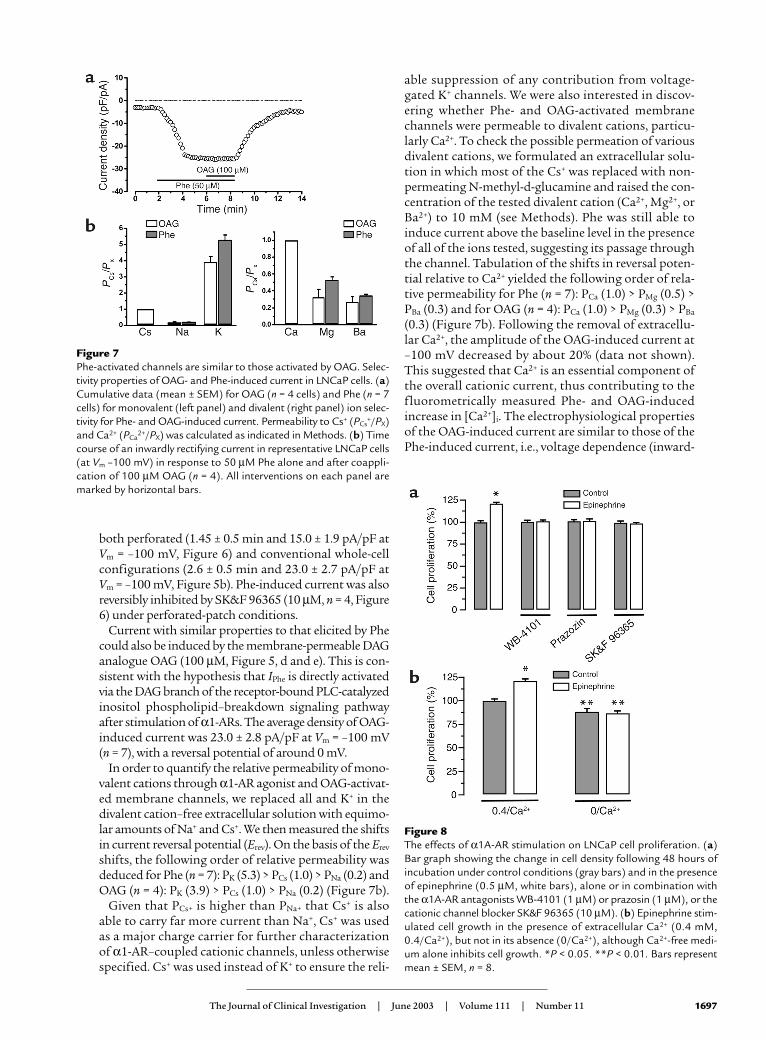
In order to quantify the relative permeability of mono-valent cations through α1-AR agonist and OAG-activat-ed membrane channels, we replaced all and K+ in thedivalent cation–free extracellular solution with equimo-lar amounts of Na+ and Cs+. We then measured the shiftsin current reversal potential (Erev). On the basis of the Erev
shifts, the following order of relative permeability wasdeduced for Phe (n = 7): PK (5.3) > PCs (1.0) > PNa (0.2) andOAG (n = 4): PK (3.9) > PCs (1.0) > PNa (0.2) (Figure 7b).
Given that PCs+ is higher than PNa+ that Cs+ is alsoable to carry far more current than Na+, Cs+ was usedas a major charge carrier for further characterizationof α1-AR–coupled cationic channels, unless otherwisespecified. Cs+ was used instead of K+ to ensure the reli-
able suppression of any contribution from voltage-gated K+ channels. We were also interested in discov-ering whether Phe- and OAG-activated membranechannels were permeable to divalent cations, particu-larly Ca2+. To check the possible permeation of variousdivalent cations, we formulated an extracellular solu-tion in which most of the Cs+ was replaced with non-permeating N-methyl-d-glucamine and raised the con-centration of the tested divalent cation (Ca2+, Mg2+, orBa2+) to 10 mM (see Methods). Phe was still able toinduce current above the baseline level in the presenceof all of the ions tested, suggesting its passage throughthe channel. Tabulation of the shifts in reversal poten-tial relative to Ca2+ yielded the following order of rela-tive permeability for Phe (n = 7): PCa (1.0) > PMg (0.5) >PBa (0.3) and for OAG (n = 4): PCa (1.0) > PMg (0.3) > PBa
(0.3) (Figure 7b). Following the removal of extracellu-lar Ca2+, the amplitude of the OAG-induced current at–100 mV decreased by about 20% (data not shown).This suggested that Ca2+ is an essential component ofthe overall cationic current, thus contributing to thefluorometrically measured Phe- and OAG-inducedincrease in [Ca2+]i. The electrophysiological propertiesof the OAG-induced current are similar to those of thePhe-induced current, i.e., voltage dependence (inward-
The Journal of Clinical Investigation | June 2003 | Volume 111 | Number 11 1697
Figure 7Phe-activated channels are similar to those activated by OAG. Selec-tivity properties of OAG- and Phe-induced current in LNCaP cells. (a)Cumulative data (mean ± SEM) for OAG (n = 4 cells) and Phe (n = 7cells) for monovalent (left panel) and divalent (right panel) ion selec-tivity for Phe- and OAG-induced current. Permeability to Cs+ (PCs
+/PX)and Ca2+ (PCa
2+/PX) was calculated as indicated in Methods. (b) Timecourse of an inwardly rectifying current in representative LNCaP cells(at Vm –100 mV) in response to 50 µM Phe alone and after coappli-cation of 100 µM OAG (n = 4). All interventions on each panel aremarked by horizontal bars.
Figure 8The effects of α1A-AR stimulation on LNCaP cell proliferation. (a)Bar graph showing the change in cell density following 48 hours ofincubation under control conditions (gray bars) and in the presenceof epinephrine (0.5 µM, white bars), alone or in combination withthe α1A-AR antagonists WB-4101 (1 µM) or prazosin (1 µM), or thecationic channel blocker SK&F 96365 (10 µM). (b) Epinephrine stim-ulated cell growth in the presence of extracellular Ca2+ (0.4 mM,0.4/Ca2+), but not in its absence (0/Ca2+), although Ca2+-free medi-um alone inhibits cell growth. *P < 0.05. **P < 0.01. Bars representmean ± SEM, n = 8.
ly rectifying I-V), current density, reversal potential,and ion permeability sequence.
To verify the hypothesis that DAG may be activelyinvolved in Phe-induced cationic current, we investigat-ed the additional application of both agonists, Phe andthe membrane-permeable DAG analogue OAG. Figure7a shows that, in LNCaP cells, the application of Pheelicited a cell membrane current, IPhe, and that the appli-cation of OAG at maximum IPhe (during maximal Phe-induced response) had no additional effect (n = 4). Sim-ilarly, the application of OAG elicited a currentindistinguishable from that evoked by Phe, and theapplication of Phe during maximal OAG-inducedresponse had no additional effect (data not shown). Thecurrent densities (26.5 ± 2.1 pA/pF and 25.0 ± 2.5 pA/pFat Vm = –100 mV, respectively) and reversal potential (∼0mV) were similar in the presence of both agonists. Thesedata strongly suggest that the α1-AR agonist targets thesame channels as OAG. Moreover, pretreatment withPKC inhibitors such as staurosporine modified neitherOAG-induced (n = 4) nor Phe-induced (n = 6) currents.
α1-ARs and LNCaP cell proliferation. To determinewhether α1-ARs are involved in LNCaP cell prolifera-tion, we examined the effect of culturing cells in medi-um supplemented with the agonist epinephrine, eitheralone, in combination with one of the two α1-ARantagonists (prazosin or WB4101), or with a cationicchannel inhibitor, SK&F 96365. Two days of treat-ment with 1 µM epinephrine resulted in about 25% cellgrowth promotion, which was α1-AR–specific, as itwas completely abolished by the competitive α1-ARantagonists prazosin and WB4101 (Figure 8a). Theproliferative action of α1-AR stimulation was appar-ently mediated by Ca2+ influx through plasmalemmalcationic channels, as coincubation of the cells with 10µM SK&F 96365 inhibited epinephrine-evoked prolif-eration (Figure 8a). Interestingly, 10 µM SK&F 96365alone had no effect on LNCaP cell viability, although
a preferential inhibitor of IP3 receptors and SOCs, 2-APB (100 µM), was able to suppress cell proliferation(data not shown).
To demonstrate that Ca2+ influx was required for α1-AR–stimulated proliferation of LNCaP cells, werepeated the experiments with epinephrine (1 µM)incubation at various concentrations of extracellularCa2+. Figure 8b shows that at 0.4 mM [Ca2+]out, epi-nephrine-induced cell proliferation was similar to thatobserved at the normal [Ca2+]out of 2 mM (see Figure8a). However, epinephrine lost its ability to stimulatecell proliferation in nominally Ca2+-free extracellularmedium, which itself inhibited cell growth (Figure 8b).
Collectively, these results suggest that α1-ARs play anessential role in promoting hPCE cell proliferation andhighlight the significance in this process of α1-AR–stimulated transmembrane Ca2+ influx via plasma-lemmal cationic channels.
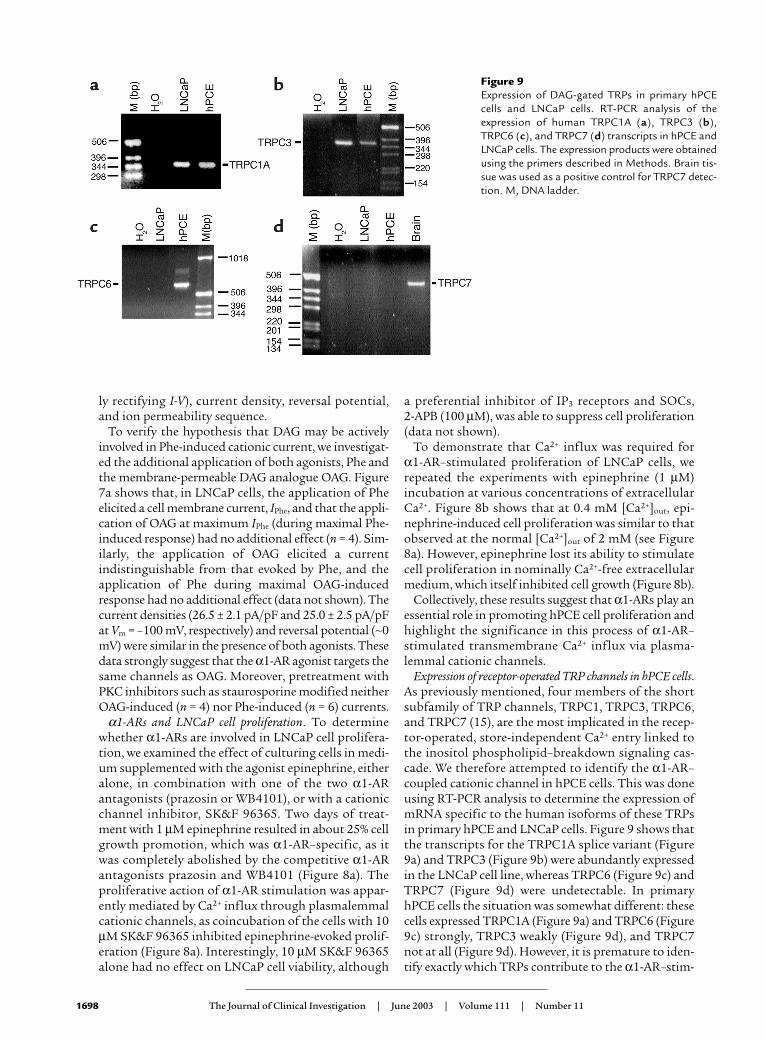
Expression of receptor-operated TRP channels in hPCE cells.As previously mentioned, four members of the shortsubfamily of TRP channels, TRPC1, TRPC3, TRPC6,and TRPC7 (15), are the most implicated in the recep-tor-operated, store-independent Ca2+ entry linked tothe inositol phospholipid–breakdown signaling cas-cade. We therefore attempted to identify the α1-AR–coupled cationic channel in hPCE cells. This was doneusing RT-PCR analysis to determine the expression ofmRNA specific to the human isoforms of these TRPsin primary hPCE and LNCaP cells. Figure 9 shows thatthe transcripts for the TRPC1A splice variant (Figure9a) and TRPC3 (Figure 9b) were abundantly expressedin the LNCaP cell line, whereas TRPC6 (Figure 9c) andTRPC7 (Figure 9d) were undetectable. In primaryhPCE cells the situation was somewhat different: thesecells expressed TRPC1A (Figure 9a) and TRPC6 (Figure9c) strongly, TRPC3 weakly (Figure 9d), and TRPC7not at all (Figure 9d). However, it is premature to iden-tify exactly which TRPs contribute to the α1-AR–stim-
1698 The Journal of Clinical Investigation | June 2003 | Volume 111 | Number 11
Figure 9Expression of DAG-gated TRPs in primary hPCEcells and LNCaP cells. RT-PCR analysis of theexpression of human TRPC1A (a), TRPC3 (b),TRPC6 (c), and TRPC7 (d) transcripts in hPCE andLNCaP cells. The expression products were obtainedusing the primers described in Methods. Brain tis-sue was used as a positive control for TRPC7 detec-tion. M, DNA ladder.
ulated store-independent Ca2+ entry in the two celltypes and in what proportion simply on the basis ofexpression patterns.
DiscussionThis study presents, we believe for the first time, evidenceof the role of α1-ARs in transmembrane Ca2+ signalingin hPCE cells. It also demonstrates the involvement ofthis signaling in the proliferation of these cells. Further-more, it shows that the α1-AR subtype expressed inhPCE cells is α1A, and that α1A-AR–stimulated trans-membrane Ca2+ influx contains an essential cationicstore–independent component, which is probably pro-vided by the members of the TRP-channel family.
α1-ARs in the prostate and cell proliferation. The role ofα1-ARs in agonist-stimulated proliferation has mainlybeen demonstrated for smooth muscle myocytes (34,35), although there is evidence that these receptors mayparticipate in the promotion of proliferation of othercell types as well (36). Moreover, recent studies demon-strate that some of the immediate targets for α1-AR–mediated regulation, at least in smooth muscle cells,are Ca2+-permeable cationic channels in the TRP-chan-nel family (16). These works have shown that thesechannels can be activated directly by DAG, one of theproducts of the α1-AR–coupled inositol phospholipidhydrolysis signaling cascade (29, 30). Enhanced Ca2+
influx mediated by overexpression of the TRP-channelTRPC1 is directly involved in the proliferation of vas-cular smooth muscle cells (17).
Four subtypes of α1-ARs (α1A, α1B, α1C, and α1L)have been identified in human prostate cells (7–11).These receptors are mostly localized in the fibromuscu-lar stroma, where they mediate the contraction ofprostate smooth muscle (8). While the role of α1-ARs inmaintaining the contractile properties of the prostatehas been intensively investigated, and has even receivedwidespread recognition in the clinical treatment ofbenign prostatic hyperplasia, the representation andfunction of these receptors in the glandular epitheliumhave yet to be determined. At the same, there is growingevidence that α1-ARs support the direct mitogeniceffect of catecholamines on prostate growth (37).
Our study is the first to provide direct evidence thatboth primary hPCE cells and LNCaP epithelial cellsexpress the α1A subtype of α1-ARs and that this receptoris functionally coupled to transmembrane Ca2+ entry viathe PLC-catalyzed inositol phospholipid–breakdown sig-naling pathway, presumably through activation of chan-nels in the TRP family. This Ca2+ entry seems to be a dom-inant source of the Ca2+ required to promote theproliferation of LNCaP cells. The specificity of α1-ARagonist–induced proliferation is proven by its completesuppression by α1-AR inhibitors, such as prazosin andWB4101. Moreover, α1-AR agonist–stimulated prolifer-ation of LNCaP cells was also inhibited by the endoge-nous cationic channel and the TRP channel blockers 2-APB and SK&F 96365, suggesting that these channelsare involved in the proliferative effect of α1-AR agonists.
Candidates for α1-AR–coupled channels in prostate cancerepithelial cells. As α1-ARs act via PLC-catalyzed pro-duction of two second-messengers, IP3 and DAG (12),two mechanisms are probably involved in Ca2+ entryin response to the stimulation of these receptors byagonists. The first is related to the IP3-evoked deple-tion of intracellular Ca2+ stores and the subsequentactivation of plasmalemmal SOCs, also thought tobelong to the TRP-channel family (15). The second,however, is related to the direct DAG-mediated acti-vation of other TRP members (15, 29).
Our [Ca2+]i measurements, together with previouswork showing the presence of SOC-mediated Ca2+
entry into LNCaP cells (22, 30), suggest that bothmechanisms are activated in response to α1-AR stimu-lation. Furthermore, the α1-AR agonist Phe, whichactivates the entire inositol phospholipid–breakdownsignaling cascade, and membrane-permeable DAG ana-logues, which affect only the DAG-dependent branchof this cascade (i.e., PKC activation and direct action onTRP channels), produced kinetically distinct [Ca2+]i sig-nals in LNCaP cells.
Both signals, however, were dependent on [Ca2+]out andwere sensitive to SK&F 96365. Thus, [Ca2+]i measure-ments using DAG derivatives, and even more signifi-cantly, direct patch-clamp measurements of Phe- andOAG-induced membrane currents, unequivocallydemonstrated that this subset of Ca2+-permeable mem-brane channels, activated independently of store deple-tion, were present in LNCaP cells. Indeed, this agonist-induced Ca2+ entry and the corresponding currents weremeasured using Fura-2 Ca2+ imaging, conventionalwhole-cell patch-clamping, and perforated-patch tech-niques. The average density and response developmenttime of IPhe were similar in both perforated and conven-tional whole-cell configurations. However, a longer (6-minute) latency period before IPhe activation wasobserved in the perforated-patch recordings. This pro-longed latency may be explained by the wash-out ofsome intracellular factors in conventional whole-cellconfiguration, such as delayers or channel activationmodulators. Indeed, we had previously verified the rateof intracellular perfusion in LNCaP cells (38): it tookabout 3–4 minutes to replace half the cell cytoplasmsolution with pipette solution. In the Fura-2 experi-ments, the [Ca2+]i response latency was even more pro-longed (at least 20 minutes). Although the Ca2+ compo-nent was essential to the overall cationic currentmeasured by patch-clamp recordings, therefore allowingCa2+ ions to enter the cell, we have not yet established thespatiotemporal profile of intracellular calcium signals inepithelial prostate cancer cells. This spatiotemporal pro-file is determined by the flux of calcium ions across sev-eral biological membranes (e.g., endoplasmic reticulumor mitochondrial membranes), as well as by the diffusionmobility of Ca2+ and Ca2+ buffers in the cell (the so-called“buffered diffusion problem”) (39).
As the cytosol may have heterogeneous Ca2+ bufferingproperties and intracellular membrane localization,
The Journal of Clinical Investigation | June 2003 | Volume 111 | Number 11 1699
probably constituting a highly differentiated medium forspatial and temporal Ca2+ signals, it was essential to assessthis property in a spatially resolved manner. Therefore,the different calcium signaling kinetics measured bypatch-clamp and Ca2+ imaging techniques may beexplained by the spatiotemporal properties of Ca2+ diffu-sion in the cytosol of prostate epithelial cells. Indeed, thechannels revealing the agonist-activated cationic currentin LNCaP cells may represent only a first step in the sig-nal transduction pathway leading to [Ca2+]i increase andthe subsequent stimulation of cell proliferation. Furtherstudies using different imaging techniques and dyes arerequired in order to understand this problem.
Our results demonstrate that Phe and OAG activatenearly identical cationic membrane currents inLNCaP cells. This therefore suggests that they may betransferred through the same population of ion chan-nels. Indeed, both Phe- and DAG analogue–evokedcurrents shared the same electrophysiological prop-erties (voltage dependence, preferential permeation ofCa2+ and Cs+ compared with Na+, current density, andreversal potential) and pharmacological properties(sensitivity to 2-APB and SK&F 96365). Moreover,these channels seem to be insensitive to PKC, as PKCinhibitors did not interfere with the ability of OAG toinduce Ca2+ entry, suggesting direct OAG gating. Thestrongest argument that both agonists target thesame channel is the fact that neither of them was ableto elicit additional current when applied during amaximal agonist-induced response. This would implynot only a common origin for the channels, but alsothat, at least under our experimental conditions, theα1-AR agonist Phe activates only those channelsdirectly gated by DAG.
Our RT-PCR analysis of primary hPCE cells fromprostate biopsies and LNCaP cells showed the presenceof specific mRNA’s for three TRP channels (TRPC1,TRPC3, and TRPC6) that may be implicated in bothdirect DAG gating and α1-AR signaling (16, 27–30). Itis important to note that OAG induces exactly thesame oscillatory [Ca2+]i response in LNCaP cells as theα1-AR agonist Phe does in primary hPCE cells. As OAGis apparently capable of activating only store-inde-pendent Ca2+ entry, this strongly suggests that α1-AR–stimulated signaling in primary hPCE cells is preferen-tially coupled to store-independent TRP channels,whereas the major role in this signaling in LNCaP cellsis played by store-operated TRP channels. Consideringalso that, according to our data, the TRPC1A splicevariant and (to a lesser extent) TRPC3 may be DAG-gated channels common to both cell types (rememberthat primary hPCE cells express TRPC1A and TRPC6strongly and TRPC3 weakly, whereas LNCaP cellsexpress TRPC1A and TRPC3), a homo- or heterote-trameric assembly of these TRPs probably forms theendogenous DAG-gated cationic channel in prostatecancer epithelial cells.
Clinical implications. Targeting cell proliferation andapoptosis in an attempt to control prostate growth
emerges as a potentially powerful therapeutic approachfor the effective treatment of prostate cancer (40, 41).
Although α1-ARs are abundantly expressed in theprostate and the expression of some TRPs increasesconsiderably during the progression to prostate cancer(42–44), no functional link between α1-ARs and TRPshas been firmly established, nor has their role inprostate cancer cell proliferation been elucidated. Atthe same time, all members of the signaling cascadefrom α1-ARs to the TRP channel may potentially serveas targets for therapeutic interventions aimed at cellproliferation. In this study, we establish a direct linkbetween α1A-AR stimulation, the activation of TRP-mediated Ca2+ entry, and the proliferation of hPCEcells. Furthermore, we demonstrate that urospecificα1A antagonists such as prazosin and WB4101, as wellas SK&F 96365, a known inhibitor of endogenous plasmalemmal cationic and TRP channels, suppress α1A-AR–induced cell proliferation. All together, ourfindings strongly indicate that the blockade of theα1A-AR–stimulated intracellular signaling pathway,not only at the receptor level, but also at the level of theaffected channel, might be used for the treatment ofprostate cancer. Effective testing of this possibilitymust await the development of potent and isoform-specific inhibitors of TRP channels.
AcknowledgmentsWe thank P. Delcourt and G. Lepage for their excellenttechnical assistance. This work was supported bygrants from INSERM, the Ministère de l’EducationNationale, the Ligue Nationale Contre le Cancer, theAssociation pour la Recherche Contre le Cancer, andINTAS-99-01248. Y. Shuba was supported by INSERMand the Ministère de l’Education Nationale.
1. Woolf, S.H. 1995. Screening for prostate cancer with prostate-specificantigen. An examination of the evidence. N. Engl. J. Med. 333:1401–1405.
2. Isaacs, J.T. 1994. Role of androgens in prostatic cancer. Vitam. Horm.49:433–502.
3. Isaacs, J.T., et al. 1992. Androgen regulation of programmed death ofnormal and malignant prostatic cells. J. Androl. 13:457–464.
4. Caine, M. 1990. Alpha-adrenergic blockers for the treatment of benignprostatic hyperplasia. Urol. Clin. North Am. 17:641–649.
5. Kyprianou, N., and Benning, C.M. 2000. Suppression of human prostatecancer cell growth by alpha1-adrenoceptor antagonists doxazosin andterazosin via induction of apoptosis. Cancer Res. 60:4550–4555.
6. Benning, C.M., and Kyprianou, N. 2002. Quinazoline-derived alpha1-adrenoceptor antagonists induce prostate cancer cell apoptosis via analpha1-adrenoceptor-independent action. Cancer Res. 62:597–602.
7. Price, D.T., et al. 1993. Identification, quantification, and localization ofmRNA for three distinct alpha 1 adrenergic receptor subtypes in humanprostate. J. Urol. 150:546–551.
8. Takeda, M., et al. 1999. alpha1- and alpha2-adrenoceptors in BPH. Eur.Urol. 36(Suppl. 1):31–34.
9. Walden, P.D., Gerardi, C., and Lepor, H. 1999. Localization and expres-sion of the alpha1A-1, alpha1B and alpha1D-adrenoceptors in hyper-plastic and non-hyperplastic human prostate. J. Urol. 161:635–640.
10. Fukasawa, R., et al. 1998. The alpha1L-adrenoceptor subtype in thelower urinary tract: a comparison of human urethra and prostate. Br. J.Urol. 82:733–737.
11. Chapple, C.R., et al. 1994. Alpha 1-adrenoceptor subtypes in the humanprostate. Br. J. Urol. 74:585–589.
12. Marshall, I., Burt, R.P., and Chapple, C.R. 1999. Signal transductionpathways associated with alpha1-adrenoceptor subtypes in cells and tis-sues including human prostate. Eur. Urol. 36(Suppl. 1):42–47.
13. Minneman, K.P. 1988. Alpha 1-adrenergic receptor subtypes, inositolphosphates, and sources of cell Ca2+. Pharmacol. Rev. 40:87–119.
1700 The Journal of Clinical Investigation | June 2003 | Volume 111 | Number 11
14. Kotlikoff, M.I., Herrera, G., and Nelson, M.T. 1999. Calcium permeantion channels in smooth muscle. Rev. Physiol. Biochem. Pharmacol.134:147–199.
15. Clapham, D.E., Runnels, L.W., and Strubing, C. 2001. The TRP ion chan-nel family. Nat. Rev. Neurosci. 2:387–396.
16. Inoue, R., et al. 2001. The transient receptor potential protein homo-logue TRP6 is the essential component of vascular alpha(1)-adrenocep-tor-activated Ca(2+)- permeable cation channel. Circ. Res. 88:325–332.
17. Golovina, V.A., et al. 2001. Upregulated TRP and enhanced capacitativeCa(2+) entry in human pulmonary artery myocytes during proliferation.Am. J. Physiol. Heart Circ. Physiol. 280:H746–H755.
18. Berridge, M.J. 1995. Calcium signalling and cell proliferation. Bioessays.17:491–500.
19. Grynkiewicz, G., Poenie, M., and Tsien, R.Y. 1985. A new generation ofCa2+ indicators with greatly improved fluorescence properties. J. Biol.Chem. 260:3440–3450.
20. Skryma, R., et al. 2000. Store depletion and store-operated Ca2+ currentin human prostate cancer LNCaP cells: involvement in apoptosis. J. Phys-iol. 527:71–83.
21. Skryma, R.N., et al. 1997. Potassium conductance in the androgen-sen-sitive prostate cancer cell line, LNCaP: involvement in cell proliferation.Prostate. 33:112–122.
22. Vanden Abeele, F., et al. 2002. Bcl-2-dependent modulation of Ca2+homeostasis and store-operated channels in prostate cancer cells. Can-cer Cell. 1:169–179.
23. Watanabe, H., et al. 2002. Activation of TRPV4 channels (hVRL-2/mTRP12) by phorbol derivatives. J. Biol. Chem. 277:13569–13577.
24. Roudbaraki, M., et al. 1999. Target cells of gamma3-melanocyte-stimu-lating hormone detected through intracellular Ca2+ responses in imma-ture rat pituitary constitute a fraction of all main pituitary cell types, butmostly express multiple hormone phenotypes at the messenger ribonu-cleic acid level. Refractoriness to melanocortin-3 receptor blockade inthe lacto-somatotroph lineage. Endocrinology. 140:4874–4885.
25. Braun, F.J., Broad, L.M., Armstrong, D.L., and Putney, J.W., Jr. 2001. Sta-ble activation of single Ca2+ release-activated Ca2+ channels in divalentcation-free solutions. J. Biol. Chem. 276:1063–1070.
26. Diver, J.M., Sage, S.O., and Rosado, J.A. 2001. The inositol trisphosphatereceptor antagonist 2-aminoethoxydiphenylborate (2-APB) blocks Ca2+entry channels in human platelets: cautions for its use in studying Ca2+influx. Cell Calcium. 30:323–329.
27. Lintschinger, B., et al. 2000. Coassembly of Trp1 and Trp3 proteins gen-erates diacylglycerol- and Ca2+- sensitive cation channels. J. Biol. Chem.275:27799–27805.
28. Zhu, X., Jiang, M., and Birnbaumer, L. 1998. Receptor-activated Ca2+influx via human Trp3 stably expressed in human embryonic kidney(HEK)293 cells. Evidence for a non-capacitative Ca2+ entry. J. Biol. Chem.273:133–142.
29. Hofmann, T., et al. 1999. Direct activation of human TRPC6 and TRPC3channels by diacylglycerol. Nature. 397:259–263.
30. Tesfai, Y., Brereton, H.M., and Barritt, G.J. 2001. A diacylglycerol-acti-vated Ca2+ channel in PC12 cells (an adrenal chromaffin cell line) cor-relates with expression of the TRP-6 (transient receptor potential) pro-tein. Biochem. J. 358:717–726.
31. Okada, T., et al. 1999. Molecular and functional characterization of anovel mouse transient receptor potential protein homologue TRP7.Ca(2+)-permeable cation channel that is constitutively activated andenhanced by stimulation of G protein-coupled receptor. J. Biol. Chem.274:27359–27370.
32. Smith, R.J., et al. 1990. Receptor-coupled signal transduction in humanpolymorphonuclear neutrophils: effects of a novel inhibitor of phos-pholipase C–dependent processes on cell responsiveness. J. Pharmacol.Exp. Ther. 253:688–697.
33. Berven, L.A., and Barritt, G.J. 1995. Evidence obtained using single hepa-tocytes for inhibition by the phospholipase C inhibitor U73122 of store-operated Ca2+ inflow. Biochem. Pharmacol. 49:1373–1379.
34. Mimura, Y., et al. 1995. Activation by alpha 1-adrenergic agonists of theprogression phase in the proliferation of primary cultures of smoothmuscle cells in mouse and rat aorta. Biol. Pharm. Bull. 18:1373–1376.
35. Noveral, J.P., and Grunstein, M.M. 1994. Adrenergic receptor-mediatedregulation of cultured rabbit airway smooth muscle cell proliferation.Am. J. Physiol. 267:L291–L299.
36. Gao, B.B., Lei, B.L., Zhang, Y.Y., and Han, Q.D. 2000. Cell proliferationand Ca(2+)-calmodulin dependent protein kinase activation mediatedby alpha 1A- and alpha 1B-adrenergic receptor in HEK293 cells. ActaPharmacol. Sin. 21:55–59.
37. McVary, K.T., McKenna, K.E., and Lee, C. 1998. Prostate innervation.Prostate. Suppl. 8:2–13.
38. Rybalchenko, V., et al. 2001. Verapamil inhibits proliferation of LNCaPhuman prostate cancer cells influencing K+ channel gating. Mol. Phar-macol. 59:1376–1387.
39. Naraghi, M., Muller, T.H., Neher, E. 1998. Two-dimensional determina-tion of the cellular Ca2+ binding in bovine chromaffin cells. Biophys. J.75:1635–1647.
40. Plonowski, A., et al. 2002. Inhibition of in vivo proliferation of MDA-PCa-2b human prostate cancer by a targeted cytotoxic analog of luteiniz-ing hormone-releasing hormone AN-207. Cancer Lett. 176:57–63.
41. Crescioli, C., et al. 2002. Vitamin D3 analogue inhibits keratinocytegrowth factor signaling and induces apoptosis in human prostate can-cer cells. Prostate. 50:15–26.
42. Peng, J.B., et al. 2001. CaT1 expression correlates with tumor grade inprostate cancer. Biochem. Biophys. Res. Commun. 282:729–734.
43. Wissenbach, U., et al. 2001. Expression of cat-like, a novel calcium-selec-tive channel, correlates with the malignancy of prostate cancer. J. Biol.Chem. 276:19461–19468.
44. Tsavaler, L., Shapero, M.H., Morkowski, S., and Laus, R. 2001. Trp-p8, anovel prostate-specific gene, is up-regulated in prostate cancer and othermalignancies and shares high homology with transient receptor poten-tial calcium channel proteins. Cancer Res. 61:3760–3769.
The Journal of Clinical Investigation | June 2003 | Volume 111 | Number 11 1701
Top Related