Y.Suzuki Kamioka Observatory Neutrino Heliograph ICRR ... · 2006-07 Experiment will resume...
36
1 Super-Kamiokande Results (Neutrino Oscillations) Outline of the talk: Outline of the talk: • Brief introduction/history • What we have learnt – Atmospheric neutrinos – Solar Neutrinos – (K2K) • Future Prospects Neutrino Heliograph Super-Kamiokande Y.Suzuki Kamioka Observatory ICRR, Univ. of Tokyo 2004-08-19 @ Nobel Symposium
Transcript of Y.Suzuki Kamioka Observatory Neutrino Heliograph ICRR ... · 2006-07 Experiment will resume...
1
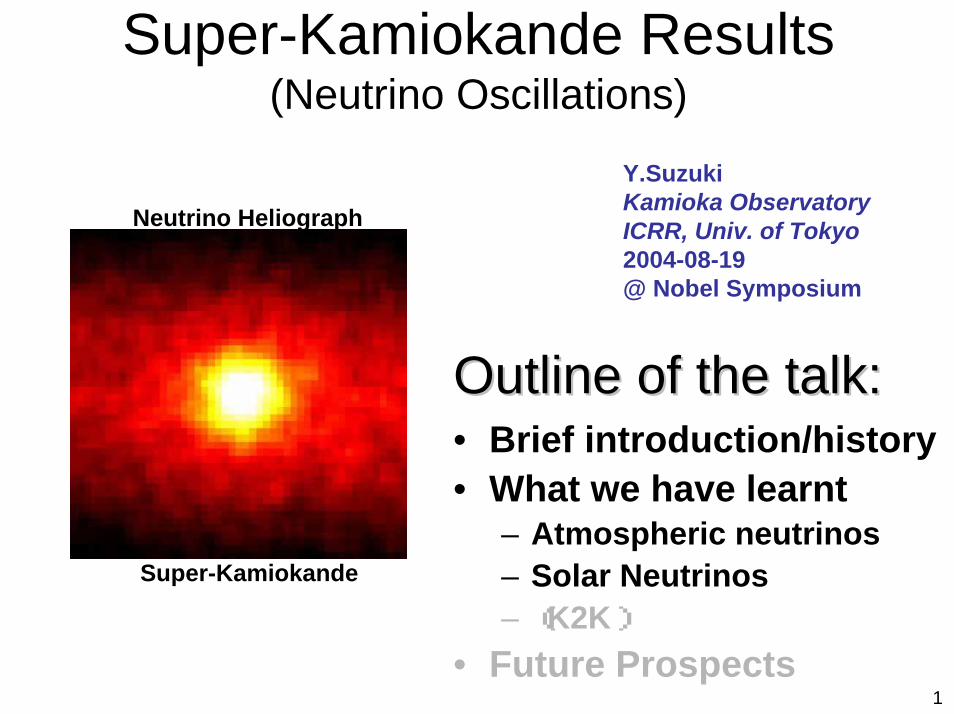
Super-Kamiokande Results(Neutrino Oscillations)
Outline of the talk:Outline of the talk:• Brief introduction/history• What we have learnt
– Atmospheric neutrinos– Solar Neutrinos– (K2K)
• Future Prospects
Neutrino Heliograph
Super-Kamiokande
Y.SuzukiKamioka ObservatoryICRR, Univ. of Tokyo2004-08-19 @ Nobel Symposium

2
42m
39m
ν
C Scientific American
Super-Kamiokande
250km
J-PARC
KEK-PS
• 50,000 tons (22,500 ton fid.) Water Cherenkov Detector• 1,000 m underground• Inner-Detector (ID) : 11,146 50cm photomultiplier tubes
(40% photocathode-coverage) for SK-I (May-96 ~ July-2001)
• Outer-Detector (OD) : 1,885 20cm PMTs

3
SK-Collaboration
• Number of Institutions: 36– 17 Japan– 15 US– 1 Poland– 3 Korea
• 76 Japanese• 62 Foreigners
4
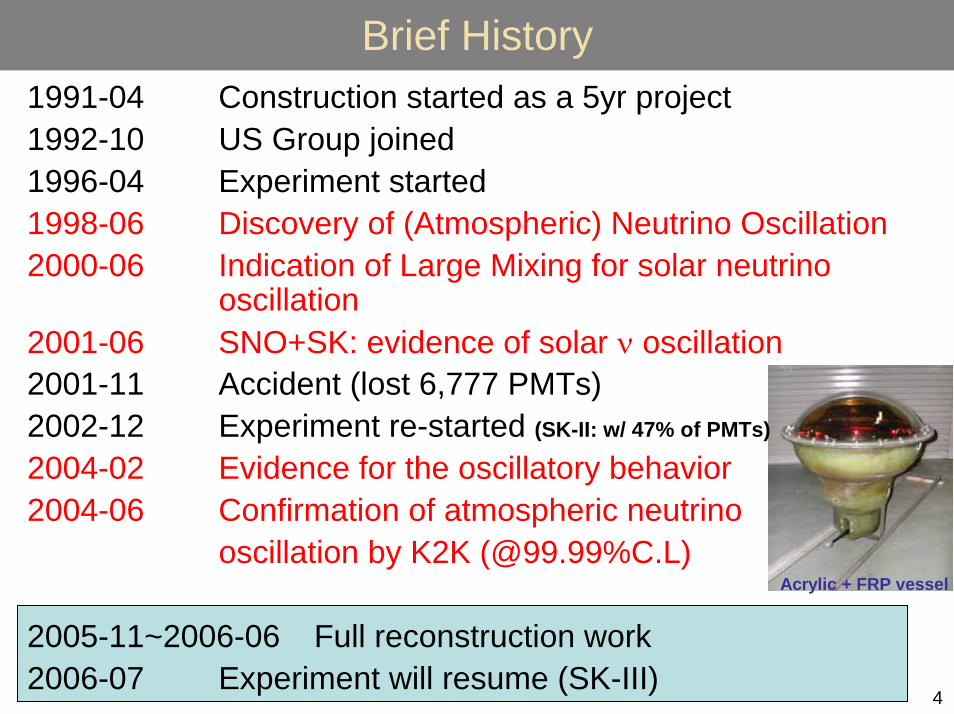
Brief History1991-04 Construction started as a 5yr project1992-10 US Group joined1996-04 Experiment started1998-06 Discovery of (Atmospheric) Neutrino Oscillation2000-06 Indication of Large Mixing for solar neutrino
oscillation2001-06 SNO+SK: evidence of solar ν oscillation2001-11 Accident (lost 6,777 PMTs)2002-12 Experiment re-started (SK-II: w/ 47% of PMTs)
2004-02 Evidence for the oscillatory behavior2004-06 Confirmation of atmospheric neutrino
oscillation by K2K (@99.99%C.L)
2005-11~2006-06 Full reconstruction work2006-07 Experiment will resume (SK-III)
Acrylic + FRP vessel
5
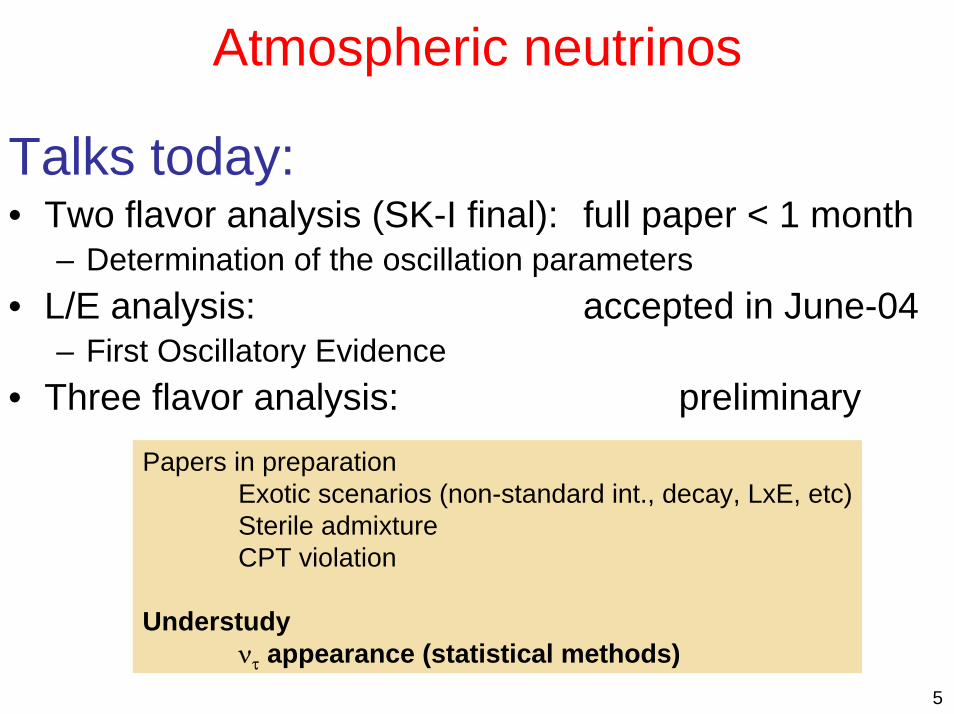
Atmospheric neutrinos
Talks today:• Two flavor analysis (SK-I final): full paper < 1 month
– Determination of the oscillation parameters• L/E analysis: accepted in June-04
– First Oscillatory Evidence• Three flavor analysis: preliminary
Papers in preparationExotic scenarios (non-standard int., decay, LxE, etc)Sterile admixtureCPT violation
Understudyντ appearance (statistical methods)

6
Characteristics and Event Classification
Wide range of path-length (3 orders)and energy (5 orders)
L: ~10~13,000 kmE: ~0.1~10,000 GeVFl
ight
pat
h-le
ngth
(km
)
zenith angle (cosθ)
Eν in GeV
Up Down
Even
ts/1
000d
ays
Parent neutrino energyFully Contained (Eν ~1GeV)
UpwardThrough-going µ (Eν ~100GeV)
UpwardStopping µ (Eν ~10GeV)
Partially Contained (Eν ~10GeV)
subGeV: Evis>1.33GeVMulti-GeV: < 1.33GeV

Zenith angle distribution
7
νµ - ντ
0
20
40
60
80
100
120
140
160
180
200
-1 -0.8 -0.6 -0.4 -0.2 0 0.2 0.4 0.6 0.8 1
Multi-GeV µ-like+P.C.Multi-GeV µ-like+P.C.Multi-GeV µ-like+P.C.cosθ
nu
mb
er o
f ev
ents Super Kamiokande Preliminary
( 1.0, 2.2×10⁻³ )
Super-Kamiokande, 1998
Up-going Down-going
10
10 2
10 3
-1 -0.5 0 0.5 1cosΘ
0.3-0.5 GeV
0.9-1.5 GeV
3.0-5.0 GeV
νe+ν–
e
-1 -0.5 0 0.5 1cosΘ
0.3-0.5 GeV
0.9-1.5 GeV
3.0-5.0 GeV
νµ+ν–
µ
2:1
Up-Down Symmetry at High EnergyMixture of νe, νe, νµ and νµ
Uncertainty in Up/Down: ~1~2% Eν <1GeV~1% in a few GeV region
Hol./Vert (upmu reion): ~2% (from π/K ratio)
~
Key distribution: Uniformity of the Pr. Cosmic ray + beyond the geomagnetic cut off
Discovery of neutrino oscillation

Event SummaryMay`96 ~ July`01(SK-I)1489days (Contained)1678days (Up-muons)~14,000 events
Rsub-GeV=0.658±0.016(stat)±0.032(syst)
Rmulti-GeV=0.702 (stat)±0.099(syst)+0.032
−0.03010-5 10-4 10-3 10-2 10-1 1
∆m2(eV2)
(<1.33GeV)
(>1.33GeV)
R=(µ/e)data/(µ/e)MCUncertainty in R (flux)
3% @ 5GeV15% @100GeV
8

9
Super-Kamiokande1489d (Contained)+ 1678d (Up-µ) (revised)
Zenith Angle Distribution

10
Oscillation Contour
1.5x10⁻³eV2 < ∆m2 < 3.4x10⁻³ eV2
sin22θ > 0.92 (@90%C.L.)Best fit: sin22θ =1.02, ∆m2=2.1x10⁻³ eV2
χ2=174.9/177dof, χ2=465/179dof for null oscill∆χ2=290.1Rather flat

11
L/E Analysis
0
0.2
0.4
0.6
0.8
1
1.2
1.4
1 10 102
103
104
L/E (km/GeV)
Dat
a/P
red
icti
on
(n
ull
osc
illat
ion
)
All the data1489.2days
Aim of the L/E analysis (λ=4πE/∆m2)• To observe oscillation pattern
direct oscillatory evidence • Strong constraint on ∆m2
• Distinguish other exotic hypotheses in L/E
Select events only with good L/E resolution
0
0.2
0.4
0.6
0.8
1
1 10 102
103
104
L/E (km/GeV)
Pro
b.(νµ
νµ
)
decoherence
decay
Dip for oscillation
0
0.2
0.4
0.6
0.8
1
1.2
1.4
1 10 102
103
104
L/E (km/GeV)
Osc
illat
ion
/Nu
ll o
scill
atio
n (
MC
)
100 yr MCw/ selection
Guide line

Aspects of the analysis
12
• Need statistics& need to contain muons
expand fiducial vol. (26.4kt)• Categorize PC by chargeOD
different cuts make the L/E resolution better
Eν Eobserved
Reconstructed from observed energy using relations based on MC simulation
Flight length (L) Zenith angle
Estimated from the zenith angle of the particle direction (vector sum)0
20
40
60
80
100
0 0.2 0.4 0.6 0.8 1 1.2 1.4 1.6 1.8 2
Num
ber
of e
vent
s
observed charge / expectation from through-going
OD stopping
OD through-going
OD through-going MC
OD stopping MC
Preliminary
FC single-ring
Eν /Eobserved Energy0
0.5
1
1.5
2
2.5
1 10log10(Eobserved)
Eν/
Eo
bse
rved
10 2
10 3
10 4
-1 -0.8-0.6-0.4-0.2 0 0.2 0.4 0.6 0.8 1
Zenith angle (cosΘ)
Flig
ht le
ngth
(km
)
Direction
Reconstruction of E and L
13
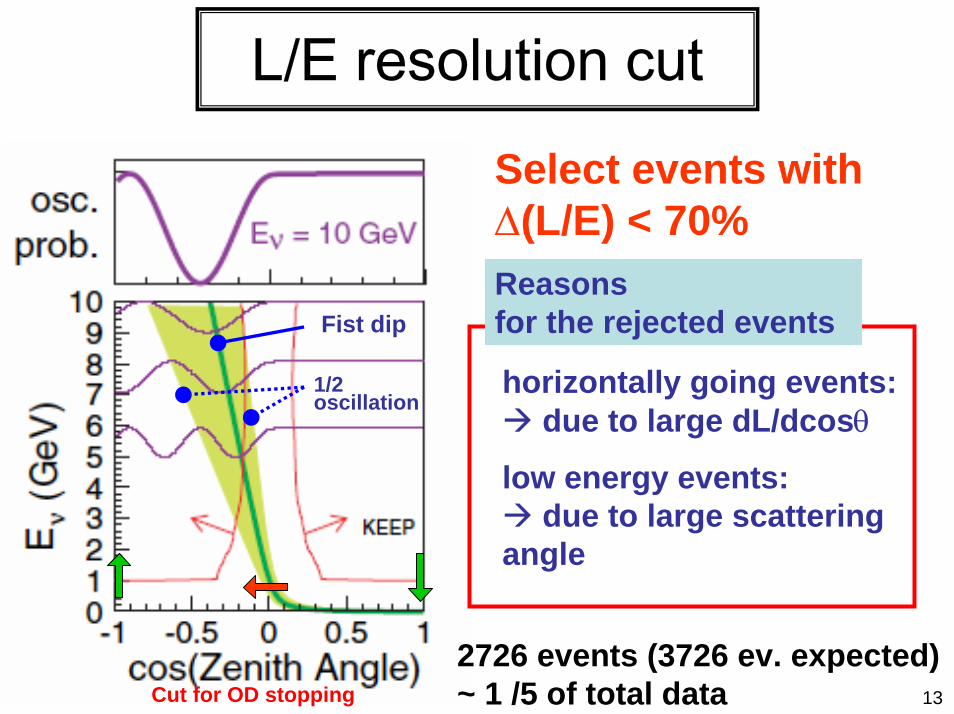
L/E resolution cut
Select events with ∆(L/E) < 70%
horizontally going events: due to large dL/dcosθ
low energy events: due to large scattering
angle
Fist dip
1/2 oscillation
Reasons for the rejected events
2726 events (3726 ev. expected)~ 1 /5 of total dataCut for OD stopping
14
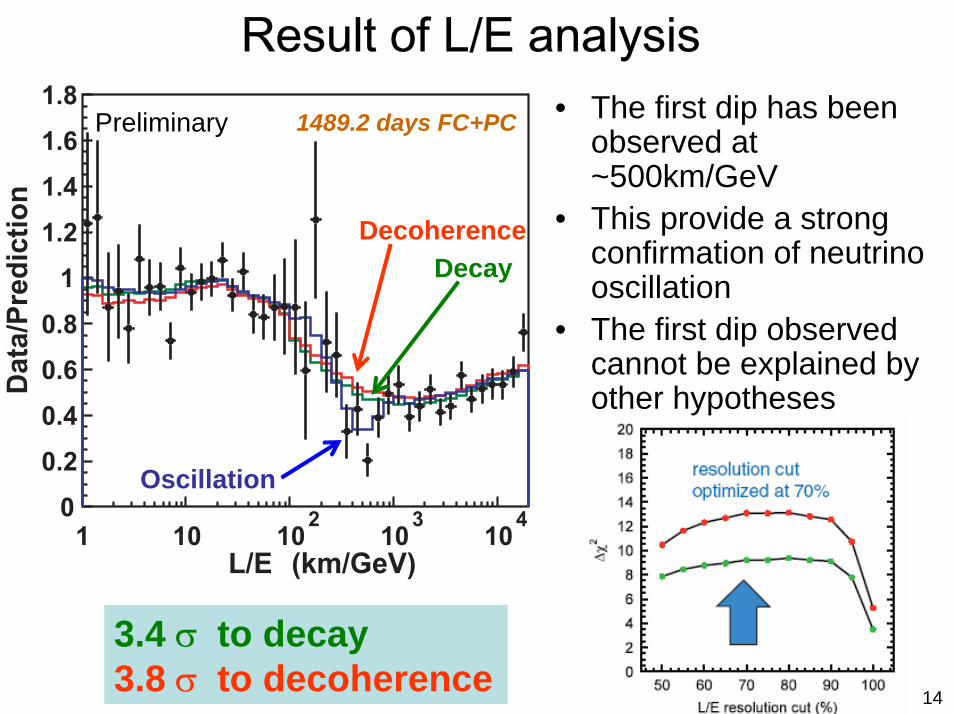
Result of L/E analysis• The first dip has been
observed at ~500km/GeV
• This provide a strong confirmation of neutrino oscillation
• The first dip observed cannot be explained by other hypotheses
3.4 σ to decay3.8 σ to decoherence
0
0.2
0.4
0.6
0.8
1
1.2
1.4
1.6
1.8
1 10 102
103
104
L/E (km/GeV)
Da
ta/P
red
icti
on
Preliminary
Oscillation
DecayDecoherence
1489.2 days FC+PC
15
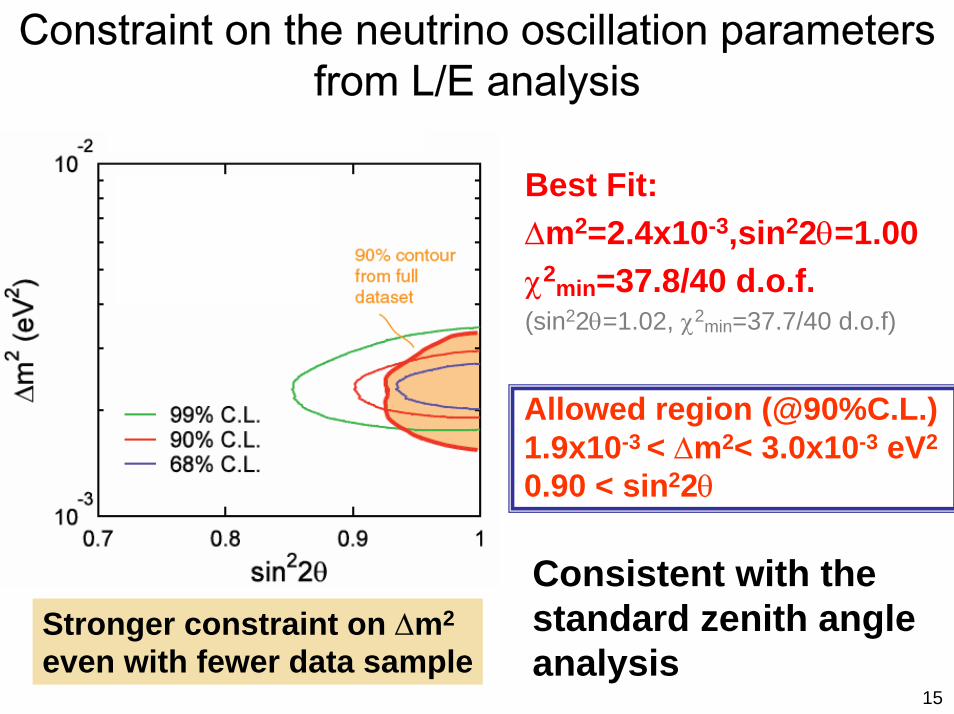
Constraint on the neutrino oscillation parameters from L/E analysis
Best Fit:∆m2=2.4x10⁻³,sin22θ=1.00χ2min=37.8/40 d.o.f.(sin22θ=1.02, χ2min=37.7/40 d.o.f)
Allowed region (@90%C.L.)1.9x10⁻³ < ∆m2< 3.0x10⁻³ eV2
0.90 < sin22θ
Consistent with the standard zenith angle analysis
Stronger constraint on ∆m2
even with fewer data sample

16
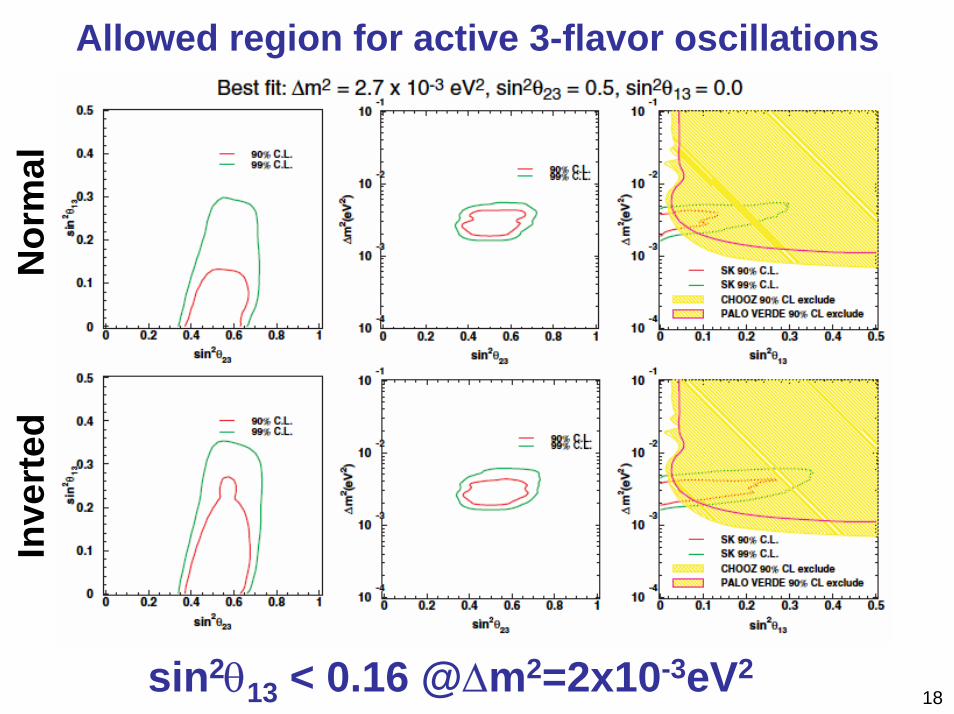
3 flavor analysisRemarks:• Matter effect (νµ<->νe)
– Effect through θ13– Mass heirarchy
• sign of ∆m132
• Effect through ∆m12(larger than what we thought before)– Interference
• Assumed ∆m12=0 (this analysis)– will be included
InverseNormal
mν2
mν3mν2mν1
mν3 mν1Parameters
Δm132, θ23, θ13

17
Effect of ∆msol2 on the atmospheric oscillation
|Ue3|=0.2∆m12
2=7x10⁻⁵eV2
Interference
0.9
0.925
0.95
0.975
1
1.025
1.05
1.075
1.1
-1 -0.8 -0.6 -0.4 -0.2 0 0.2 0.4 0.6 0.8 1cosΘ
Eff
ect
Sub-GeV: Eν < 400 MeV
0.9
0.95
1
1.05
1.1
1.15
1.2
-1 -0.8 -0.6 -0.4 -0.2 0 0.2 0.4 0.6 0.8 1cosΘ
Eff
ect
Multi--GeV
Interference Interference
θ13
Current assumption, ∆m12=0 is marginally OK.
18
Allowed region for active 3-flavor oscillations
sin2θ13 < 0.16 @∆m2=2x10⁻³eV2
Nor
mal
Inve
rted

19
Solar neutrinos8B solar-ν measurement (Ee > 5MeV) by ν+e-→ν+e-
DirectionalityReal time measurementEnergy measurement (Calibration by LINAC and 16N)Sensitive to νe, νµ, ντ: σ(νµ(τ)+e-) ~0.15×σ(νe+e-)
High statistics ~15ev./day
• Original Aim of Super-K Solar Neutrinodetect flux independent evidence• Day/night flux difference, spectrum distortion, seasonal variationexcluded SMA and showed the solution is large mixingin 2000.
• The evidence was obtained by the comparison of SK (ES) & SNO (CC) flux in 2001.
And we still have not seen such flux independent evidence yet.

SK data in 2000
NOW2000/Neutrino2000
• Excluded Small Mixing Angle Solutions
• Only large mixing solutions are allowed
20
21
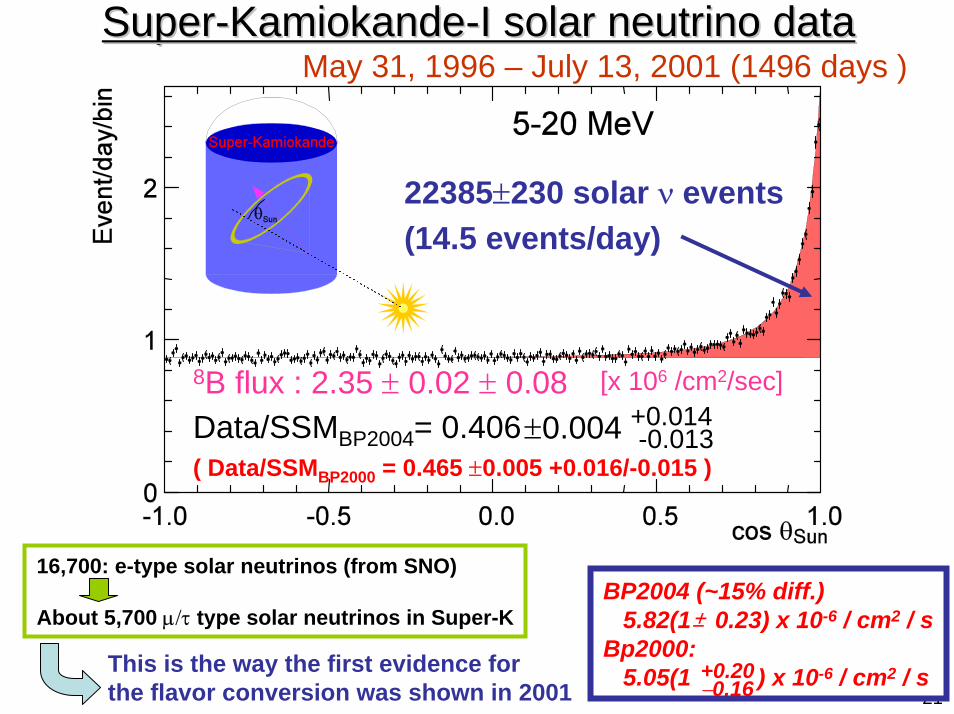
SuperSuper--KamiokandeKamiokande--I solar neutrino data I solar neutrino data
BP2004 (~15% diff.)5.82(1±0.23) x 10-6 / cm2 / s
Bp2000:5.05(1 ) x 10-6 / cm2 / s
May 31, 1996 – July 13, 2001 (1496 days )
8B flux : 2.35 ± 0.02 ± 0.08 [x 106 /cm2/sec]
Data/SSMBP2004= 0.406 +0.014-0.013±0.004
( Data/SSMBP2000 = 0.465 ±0.005 +0.016/-0.015 )
22385±230 solar ν events(14.5 events/day)
+0.20−0.16
16,700: e-type solar neutrinos (from SNO)
About 5,700 µ/τ type solar neutrinos in Super-K
This is the way the first evidence for the flavor conversion was shown in 2001

Seasonal Seasonal variationvariation
22
Consistent with the expectation from the earth’s eccentricity
χ2 = 4.7 / 7dof (eccentricity) ;
χ2 = 10.7 / 7dof (flat)
0.4
0.5
0.6
JAN
FE
B
MA
R
AP
R
MA
Y
JUN
JUL
AU
G
SE
P
OC
T
NO
V
DE
C
Dat
a/S
SM
SK-I 1496day 5.0-20MeV 22.5kt(Preliminary)
χ2 for eccentricity = 4.7 C.L. = 69%χ2 for flat = 10.3 C.L. = 17%(8-1 d.o.f.) (with sys. err.)

Energy spectrum of SK-I
∆m2=6.3x10⁻⁵eV2
tan2θ=0.55
∆m2=7.2x10⁻⁵eV2
tan2θ=0.38
Energy correlated systematic error
χ2(flat)=20.2/20 (44.3% C.L.)23
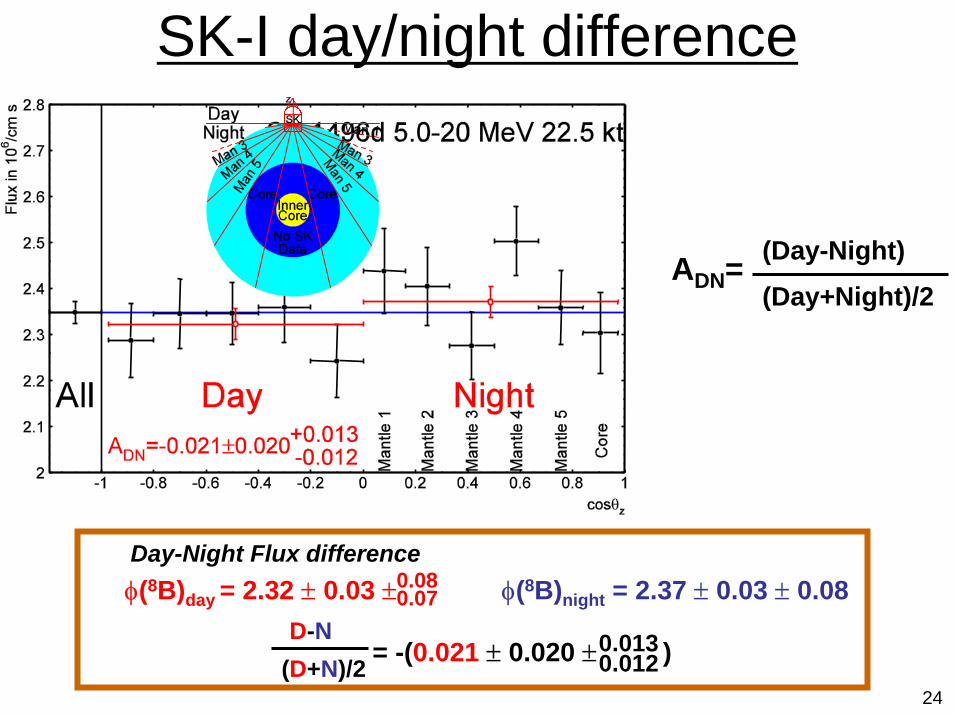
SK-I day/night difference
(Day-Night)ADN=(Day+Night)/2
24
φ(8B)day = 2.32 ± 0.03 ±0.080.07 φ(8B)night = 2.37 ± 0.03 ± 0.08
D-N= -(0.021 ± 0.020 ± )(D+N)/2
0.0130.012
Day-Night Flux difference
25
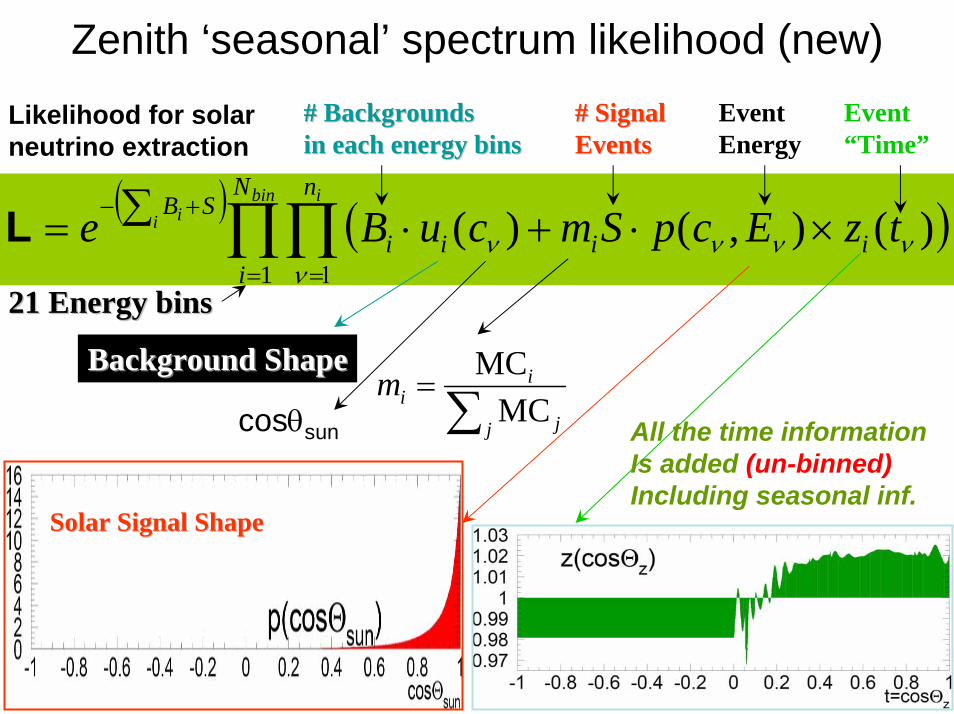
Zenith ‘seasonal’ spectrum likelihood (new)# Backgrounds# Backgroundsin each energy bins
# Signal# SignalEvents
EventEnergy
Event“Time”
Likelihood for solar neutrino extraction Eventsin each energy bins
( ) ( )∏∏= 1=
+−×⋅+⋅∑=
bin ii i
N
i
n
iiiiSB tzEcpSmcuBe
1
)(),()(ν
ννννL
∑=
j j
iim
MCMC
Solar Signal ShapeSolar Signal Shape
Background ShapeBackground Shape
21 Energy bins21 Energy bins
cosθsun All the time informationIs added (un-binned)Including seasonal inf.

26
Oscillation analysis
( ) ( )SSMSSM8
22osc
SSMSSM8
22osc8
Btan, ,
Btan,B
ii
ii
ii
ii hep
mhephhep
mb+
∆=
+∆
=θθ
i
iii
ii
i
fhb
hepηβρ +
=+
= ,B
Datad SSMSSM8i
( )timevar2
2
2
2
2
2
12
22 log2 L∆−+++
−= ∑
= R
R
S
S
B
BN
i i
iibin d
σδ
σδ
σδ
σρχ
Spectrum
( ) ( ) ( ) ( )RR
iSS
iB
iRSi ffff δδδδδδ ××= ΒΒ ,,
Energy correlated systematic error Time variation
8B spec. shape
energy scale
energy resolution
Function for energy correlated systematic errors
27
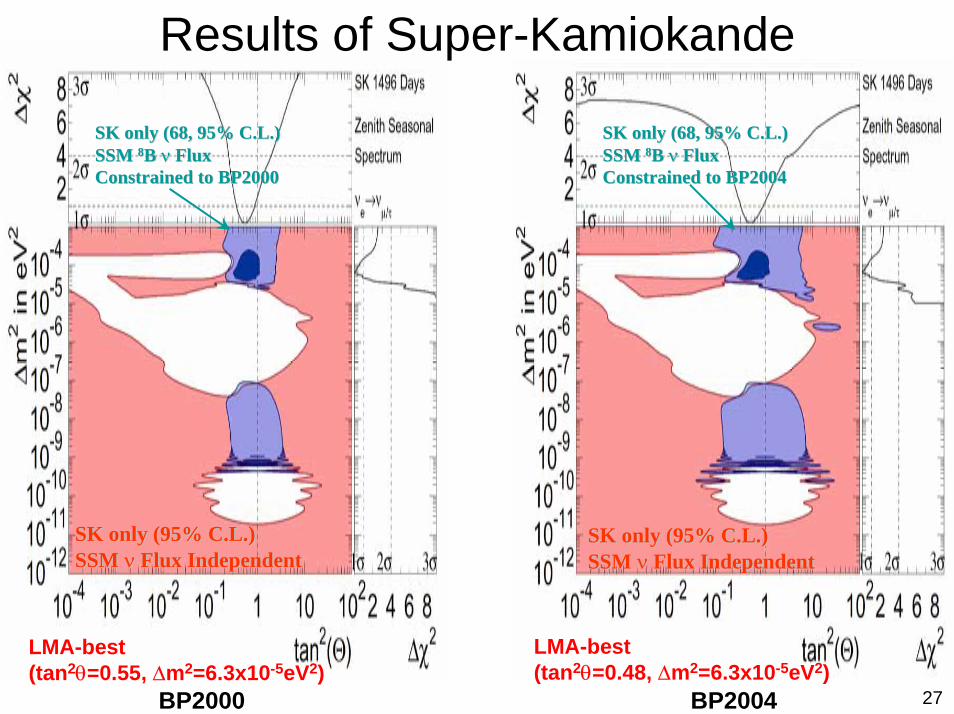
Results of Super-Kamiokande
SK only (68, 95% C.L.)SK only (68, 95% C.L.)SSM SSM 88B B ν ν FluxFluxConstrained to BP2000Constrained to BP2000
SK only (68, 95% C.L.)SK only (68, 95% C.L.)SSM SSM 88B B ν ν FluxFluxConstrained to BP2004Constrained to BP2004
LMA-best(tan2θ=0.55, ∆m2=6.3x10⁻⁵eV2)
LMA-best(tan2θ=0.48, ∆m2=6.3x10⁻⁵eV2)
SK only (95% C.L.)SK only (95% C.L.)SSM SSM ν ν Flux IndependentFlux Independent
SK only (95% C.L.)SK only (95% C.L.)SSM SSM ν ν Flux IndependentFlux Independent
BP2000 BP2004
28
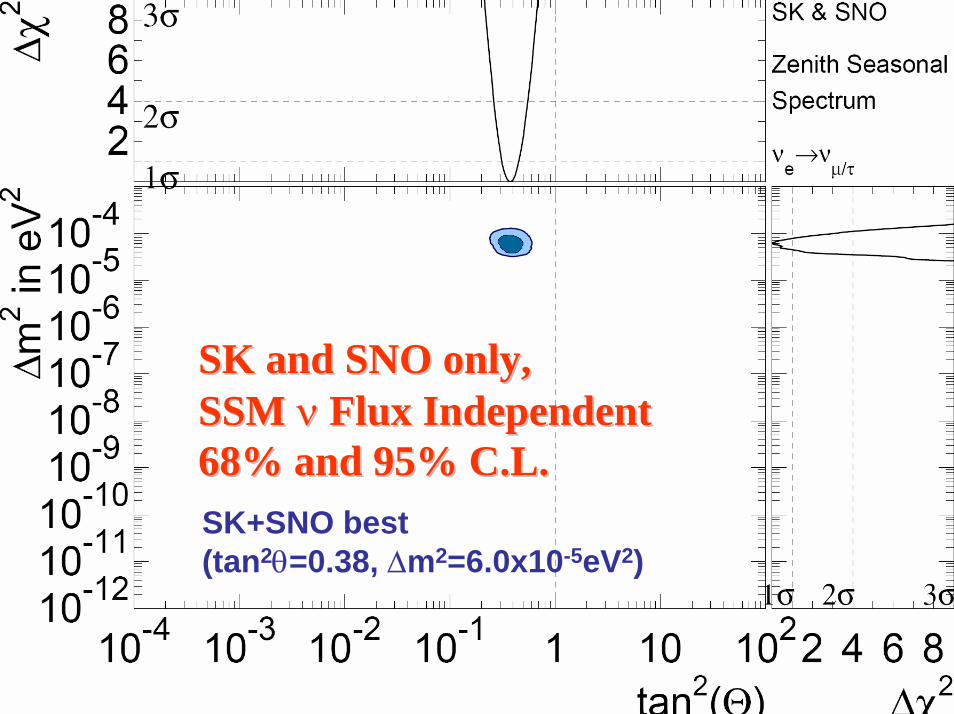
SK and SNO only,SK and SNO only,SSM SSM νν Flux IndependentFlux Independent68% and 95% C.L.68% and 95% C.L.SK+SNO best(tan2θ=0.38, ∆m2=6.0x10⁻⁵eV2)

KEK PS
250 km
SK
K2K Long base line neutrino oscillation experiment
29
Observation Experiment(Atmospheric ν)Experiment started in April, 1999
)27.1(sin2sin.2
22
ν
θE
Lmprob ∆⋅= L=250km (fixed), <Eν> ~ 1.3GeV
∆m2 = 2.5x 10⁻³ eV2, sin22θ=1~ 0.3
Expect ~70% disappearance
4
6
8
10
12
14
16
18
Eνrec
0
2
Entries 56
even
ts/0
.2[G
eV]
Disappearance of νµ 2.92.9σσDistortion of Eν spectrum 2.52.5σσ∆∆mm22<(1.7~3.5)<(1.7~3.5)××1010--33 eVeV22 @sin@sin2222θθ=1.0 =1.0 (90%C.L.)(90%C.L.)
Spectrum8.9×1019 POT
• NSKobs=108
151 for no oscillation• NSK
exp (best fit)=104.8
Best FitKS prob.=52%
0 0.5 1 1.5 2 2.5 3 3.5 4 4.5 5[GeV]
K2K has confirmed neutrino oscillations at K2K has confirmed neutrino oscillations at 3.93.9σσ
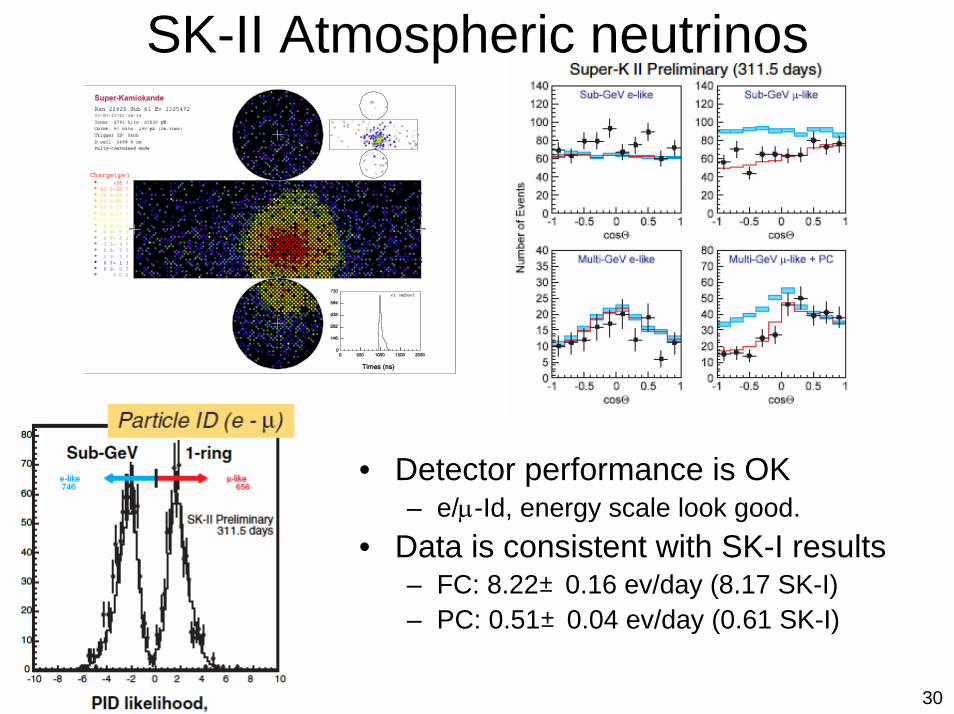
SK-II Atmospheric neutrinos
• Detector performance is OK– e/µ-Id, energy scale look good.
• Data is consistent with SK-I results– FC: 8.22±0.16 ev/day (8.17 SK-I)– PC: 0.51±0.04 ev/day (0.61 SK-I)
30

31
SK-II solar neutrinos
Flux= 2.38 ± 0.09 (stat.)x106/cm2/s
8 – 20 MeV
Dec.24,2002 – March 25, 2004
Solar ν signal = 2161 (stat.) events
325 days
(Systematic error under study)(cf. SK-I result: 2.35 ± 0.02(stat.) ± 0.08(sys.))
+82- 80
• Detector performance is OK• Data is consistent with SK-I results
32
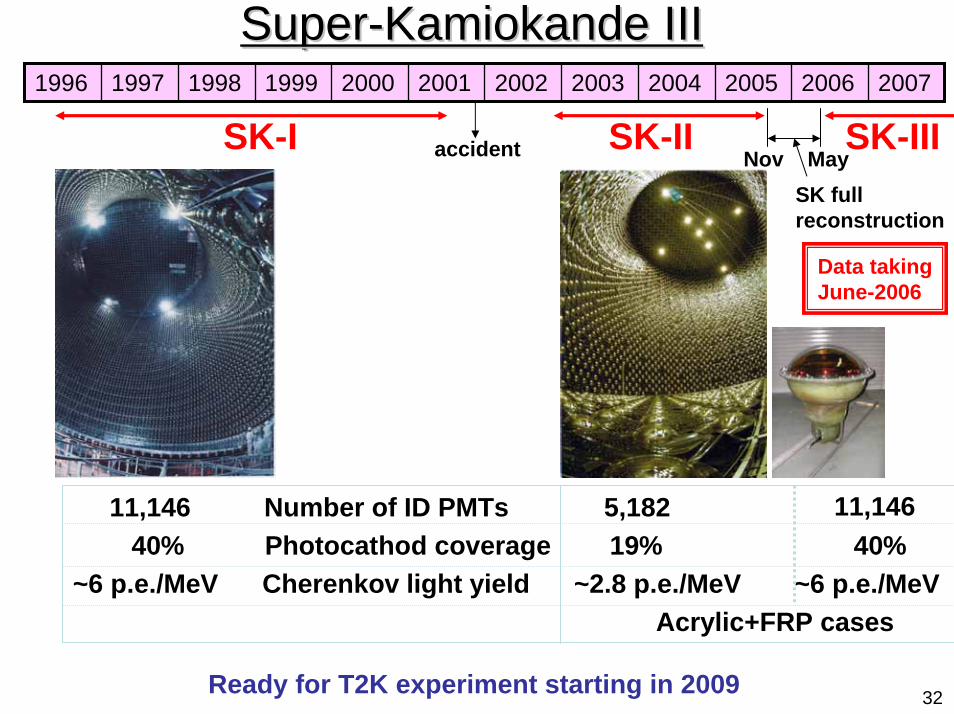
SuperSuper--Kamiokande Kamiokande IIIIII1996 1997 1998 1999 2000 2001 2002 2003 2004 2005 2006 2007
11,146 Number of ID PMTs 5,18240% Photocathod coverage 19% 40%
~6 p.e./MeV Cherenkov light yield ~2.8 p.e./MeV ~6 p.e./MeVAcrylic+FRP cases
SK-IIIaccident
SK full reconstruction
SK-I SK-II
11,146
Nov May
Data takingJune-2006
Ready for T2K experiment starting in 2009
33
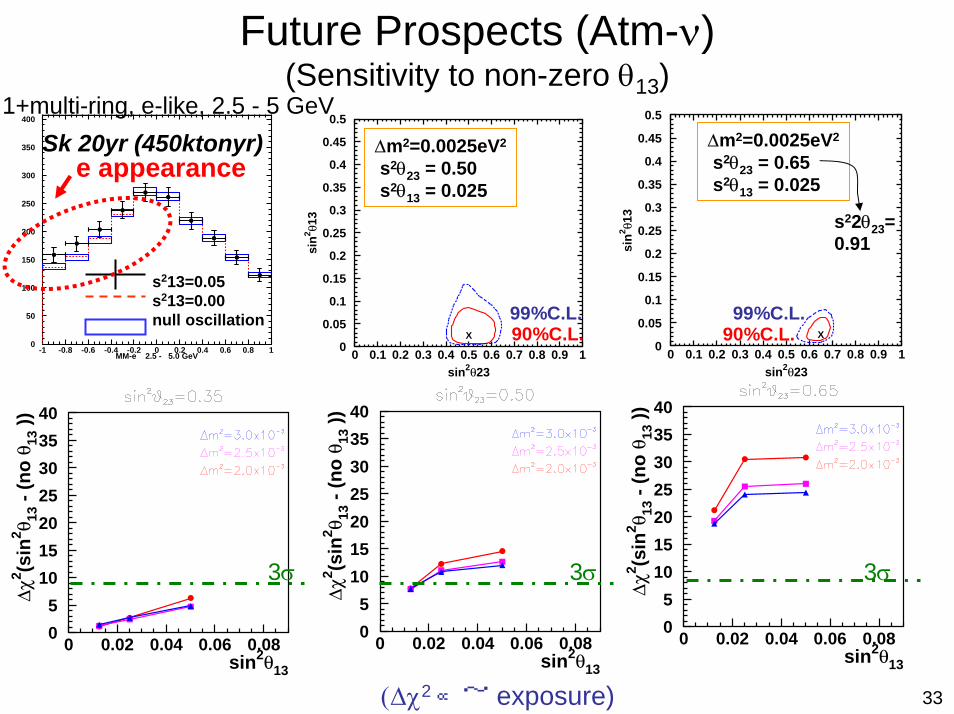
Future Prospects (Atm-ν)(Sensitivity to non-zero θ13)
MM-e 2.5 - 5.0 GeV0
50
100
150
200
250
300
350
400
-1 -0.8 -0.6 -0.4 -0.2 0 0.2 0.4 0.6 0.8 1
s213=0.05s213=0.00null oscillation
e appearance
1+multi-ring, e-like, 2.5 - 5 GeVSk 20yr (450ktonyr)
0
0.05
0.1
0.15
0.2
0.25
0.3
0.35
0.4
0.45
0.5
0 0.1 0.2 0.3 0.4 0.5 0.6 0.7 0.8 0.9 1sin2θ23
sin
2 θ13
X
∆m2=0.0025eV2
s2θ23 = 0.50s2θ13 = 0.025
99%C.L.90%C.L.
0
0.05
0.1
0.15
0.2
0.25
0.3
0.35
0.4
0.45
0.5
0 0.1 0.2 0.3 0.4 0.5 0.6 0.7 0.8 0.9 1sin2θ23
sin
2 θ13
X
∆m2=0.0025eV2
s2θ23 = 0.65s2θ13 = 0.025
99%C.L.
s22θ23=0.91
90%C.L.
0
5
10
15
20
25
30
35
40
0 0.02 0.04 0.06 0.08sin2θ13
∆χ2 (s
in2 θ 13
- (
no
θ13
))
0
5
10
15
20
25
30
35
40
0 0.02 0.04 0.06 0.08sin2θ13
∆χ2 (s
in2 θ 13
- (
no
θ13
))
0
5
10
15
20
25
30
35
40
0 0.02 0.04 0.06 0.08sin2θ13
∆χ2 (s
in2 θ 13
- (
no
θ13
))
3σ 3σ 3σ
(∆χ2 ∝~ exposure)
34
0.35
0.4
0.45
0.5
0.55
5 7.5 10 12.5 20Energy(MeV)
Dat
a/SS
M(B
P200
4)
P(ν e→
ν e)
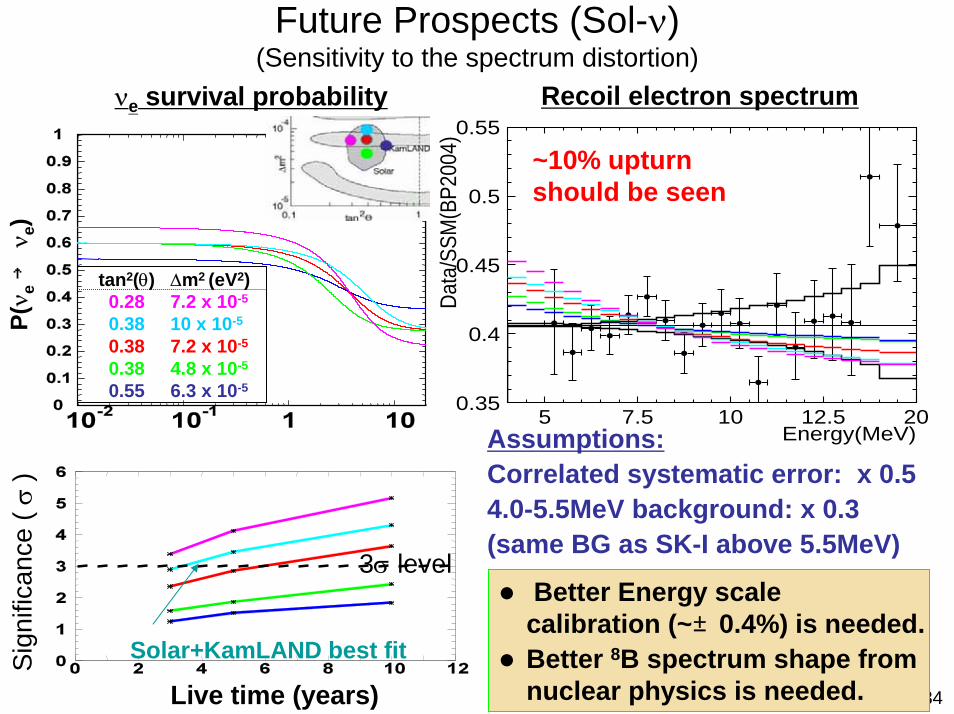
Future Prospects (Sol-ν)(Sensitivity to the spectrum distortion)
νe survival probability Recoil electron spectrum
~10% upturn should be seen
Live time (years)
Sig
nific
ance
( σ
)
3σ level
Assumptions:Correlated systematic error: x 0.54.0-5.5MeV background: x 0.3(same BG as SK-I above 5.5MeV)
Solar+KamLAND best fit
tan2(θ)0.280.380.380.380.55
∆m2 (eV2)7.2 x 10⁻⁵
10 x 10-5
7.2 x 10⁻⁵
4.8 x 10⁻⁵
6.3 x 10⁻⁵
Better Energy scale calibration (~±0.4%) is needed.Better 8B spectrum shape from nuclear physics is needed.
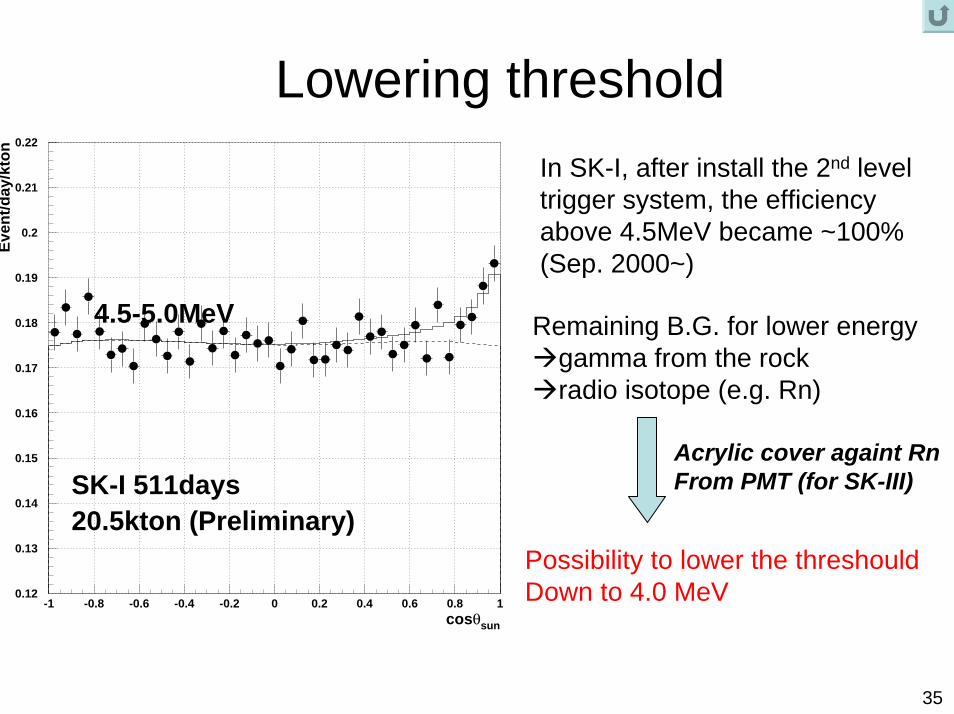
Lowering threshold
Remaining B.G. for lower energygamma from the rockradio isotope (e.g. Rn)
Possibility to lower the threshouldDown to 4.0 MeV0.12
0.13
0.14
0.15
0.16
0.17
0.18
0.19
0.2
0.21
0.22
-1 -0.8 -0.6 -0.4 -0.2 0 0.2 0.4 0.6 0.8 1cosθsun
Eve
nt/
day
/kto
n
SK-I 511days20.5kton (Preliminary)
4.5-5.0MeV
In SK-I, after install the 2nd level trigger system, the efficiency above 4.5MeV became ~100% (Sep. 2000~)
Acrylic cover againt RnFrom PMT (for SK-III)
35

36
Summary• The observation of the direct oscillatory
behavior makes the atmospheric neutrino oscillation more and more solid.
• K2K has confirmed the atmospheric neutrino oscillation at 99.99% C.L. in 2004.
• Although the evidence of the solar ν oscillation has been first shown by SNO(CC) and Super-K(ES) and gets more stronger now, the characteristic behavior of the day-night flux difference and the low energy spectrum upturn have not yet been observed.