XIV Fluidization by lift of 300 circular particles in ...
22
Fluidization by lift of 300 circular particles in plane Poiseuille flow by DNS Printed 03/11/02 185 • Interog-8.doc XIV Fluidization by lift of 300 circular particles in plane Poiseuille flow by DNS DISCARD THIS PAGE (only used to generate table of contents) XIV Fluidization by lift of 300 circular particles in plane Poiseuille flow by DNS ................. 185 § Case 4: : η = 0.05 poise, R G = 9.81/η 2 = 3.92×10 4 ..................................................................................... 186 § Case 5: η = 0.01 poise, R G = 9.81/η 2 = 9.8×10 4 ......................................................................................... 194 § An engineering correlation for the lift-off of circular particle in a plane Poiseuille flow of a Newtonian fluid .............................................................................................. 199 § Inertial mechanism of fluidization .............................................................................................................. 202 page breakà
Transcript of XIV Fluidization by lift of 300 circular particles in ...

Fluidization by lift of 300 circular particles inplane Poiseuille flow by DNS
Printed 03/11/02 185 • Interog-8.doc
XIV Fluidization by lift of 300 circular particles inplane Poiseuille flow by DNS
DISCARD THIS PAGE (only used to generate table of contents)
XIV Fluidization by lift of 300 circular particles in plane Poiseuille flow by DNS .................185 Case 4: : η = 0.05 poise, RG = 9.81/η2 = 3.92×10⁴ ..................................................................................... 186 Case 5: η = 0.01 poise, RG = 9.81/η2 = 9.8×10⁴ ......................................................................................... 194 An engineering correlation for the lift-off of circular particle in
a plane Poiseuille flow of a Newtonian fluid.............................................................................................. 199 Inertial mechanism of fluidization .............................................................................................................. 202
page break
Fluidization by lift of 300 circular particles inplane Poiseuille flow by DNS
Printed 03/11/02 186 • Interog-8.doc
Case 4: : ηηηη = 0.05 poise, RG = 9.81/ηηηη2 = 3.92××××104
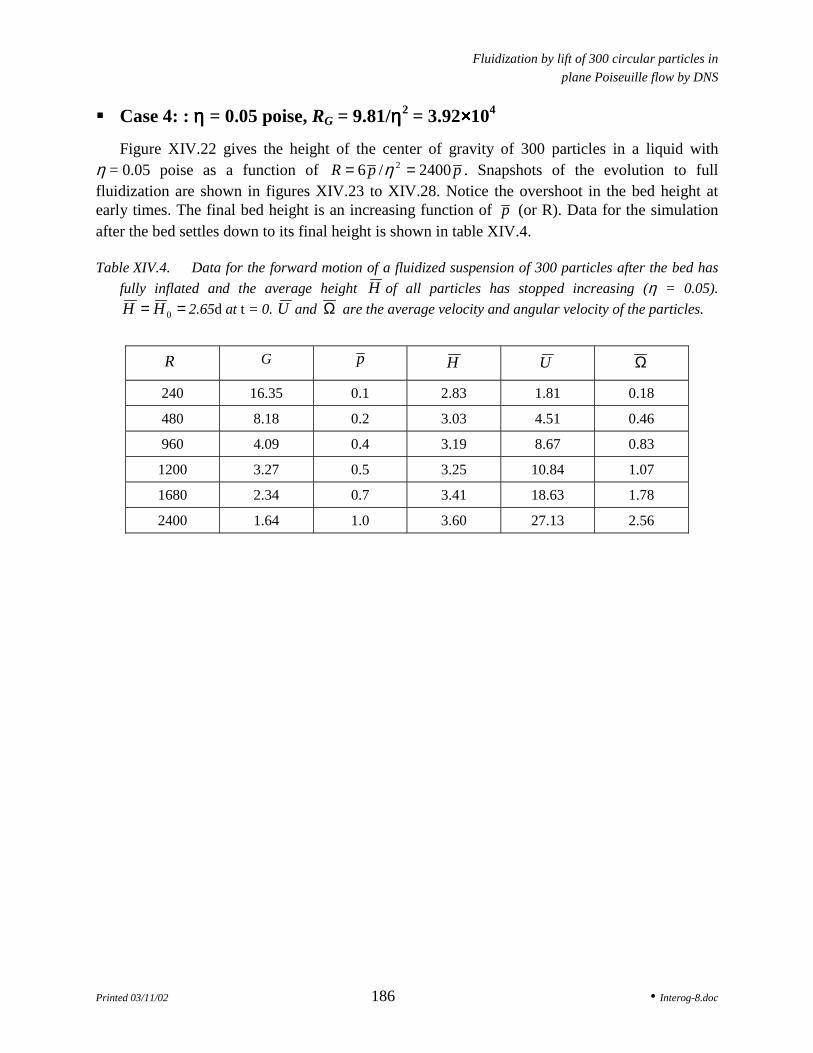
Figure XIV.22 gives the height of the center of gravity of 300 particles in a liquid withη = 0.05 poise as a function of ppR 2400/6 2 == η . Snapshots of the evolution to fullfluidization are shown in figures XIV.23 to XIV.28. Notice the overshoot in the bed height atearly times. The final bed height is an increasing function of p (or R). Data for the simulationafter the bed settles down to its final height is shown in table XIV.4.
Table XIV.4. Data for the forward motion of a fluidized suspension of 300 particles after the bed hasfully inflated and the average height H of all particles has stopped increasing (η = 0.05).
== 0HH 2.65d at t = 0. U and Ω are the average velocity and angular velocity of the particles.
R G p H U Ω
240 16.35 0.1 2.83 1.81 0.18
480 8.18 0.2 3.03 4.51 0.46
960 4.09 0.4 3.19 8.67 0.83
1200 3.27 0.5 3.25 10.84 1.07
1680 2.34 0.7 3.41 18.63 1.78
2400 1.64 1.0 3.60 27.13 2.56

Fluidization by lift of 300 circular particles inplane Poiseuille flow by DNS
Printed 03/11/02 187 • Interog-8.doc
Time (sec)0 50 100
0
0.5
1
1.5
2
2.5
3
3.5
4
4.5
5
5.5
6
(a) (b)(c)
(d)(e) (f)H(t)
2400 1680 1200 960 480 2401.64 2.34 3.27 4.09 8.18 16.351467 719 366 235 59 14.71.0 0.7 0.5 0.4 0.2 0.1
(a) (b) (c) (d) (e) (f)
RG
R/Gp
Figure XIV.22. Rise curves for the center of gravity of 300 circular particles fluidized by lift (fluidviscosity = 0.05 poise, RG = 9.81/η2 =3924, p is in dynes/cm2). Notice the overshoot at early times.The final bed height is an increasing function of p . The bed is fully fluidized when the rise curveslevel off. The time to full fluidization is longer when the Reynolds number is smaller.
Fluidization by lift of 300 circular particles inplane Poiseuille flow by DNS
Printed 03/11/02 188 • Interog-8.doc
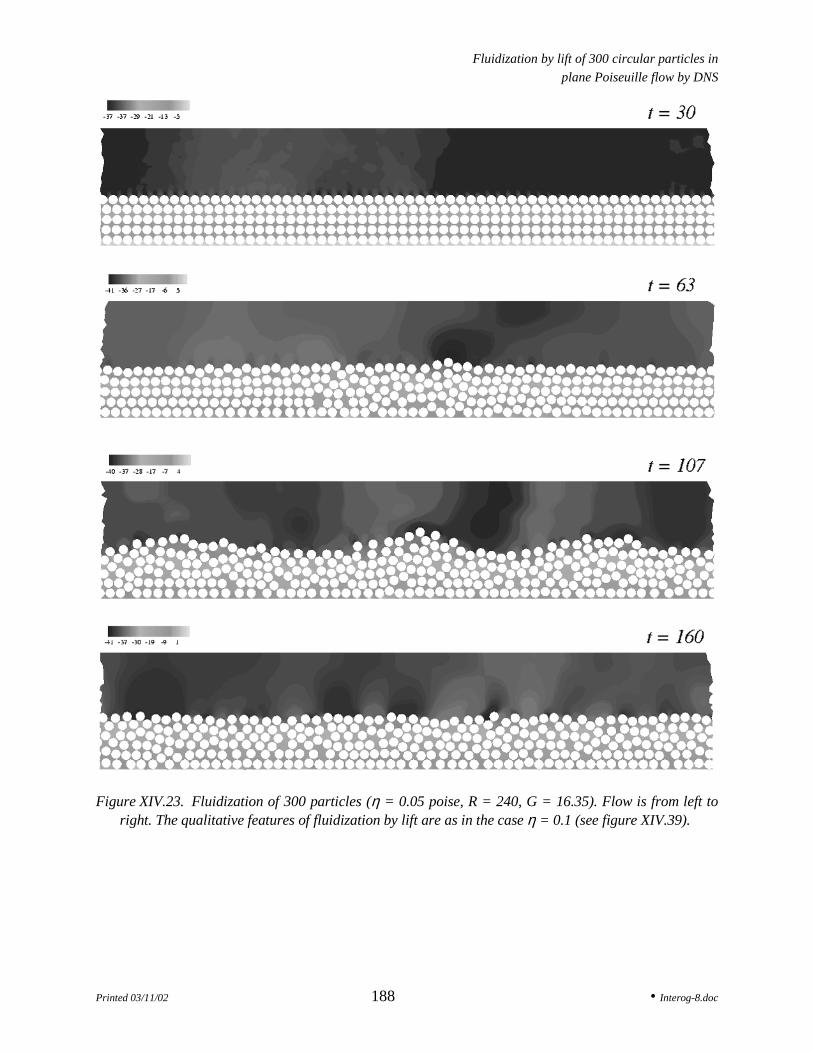
Figure XIV.23. Fluidization of 300 particles (η = 0.05 poise, R = 240, G = 16.35). Flow is from left toright. The qualitative features of fluidization by lift are as in the case η = 0.1 (see figure XIV.39).

Fluidization by lift of 300 circular particles inplane Poiseuille flow by DNS
Printed 03/11/02 189 • Interog-8.doc
Figure XIV.24. Fluidization of 300 particles (η = 0.05 poise, R = 480, G = 8.18).
Fluidization by lift of 300 circular particles inplane Poiseuille flow by DNS
Printed 03/11/02 190 • Interog-8.doc
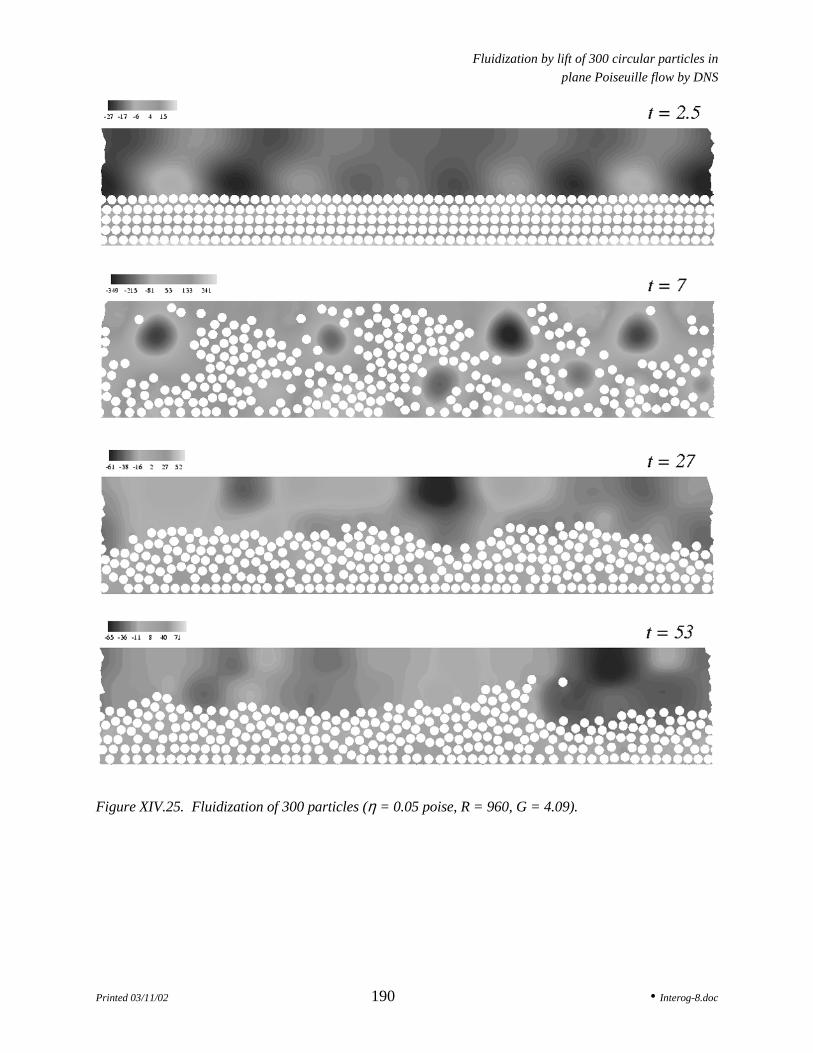
Figure XIV.25. Fluidization of 300 particles (η = 0.05 poise, R = 960, G = 4.09).

Fluidization by lift of 300 circular particles inplane Poiseuille flow by DNS
Printed 03/11/02 191 • Interog-8.doc
Figure XIV.26. Fluidization of 300 particles (η = 0.05 poise, R = 1200, G = 3.27).

Fluidization by lift of 300 circular particles inplane Poiseuille flow by DNS
Printed 03/11/02 192 • Interog-8.doc
Figure XIV.27. Fluidization of 300 particles (η = 0.05 poise, R = 1680, G = 2.34).
Fluidization by lift of 300 circular particles inplane Poiseuille flow by DNS
Printed 03/11/02 193 • Interog-8.doc
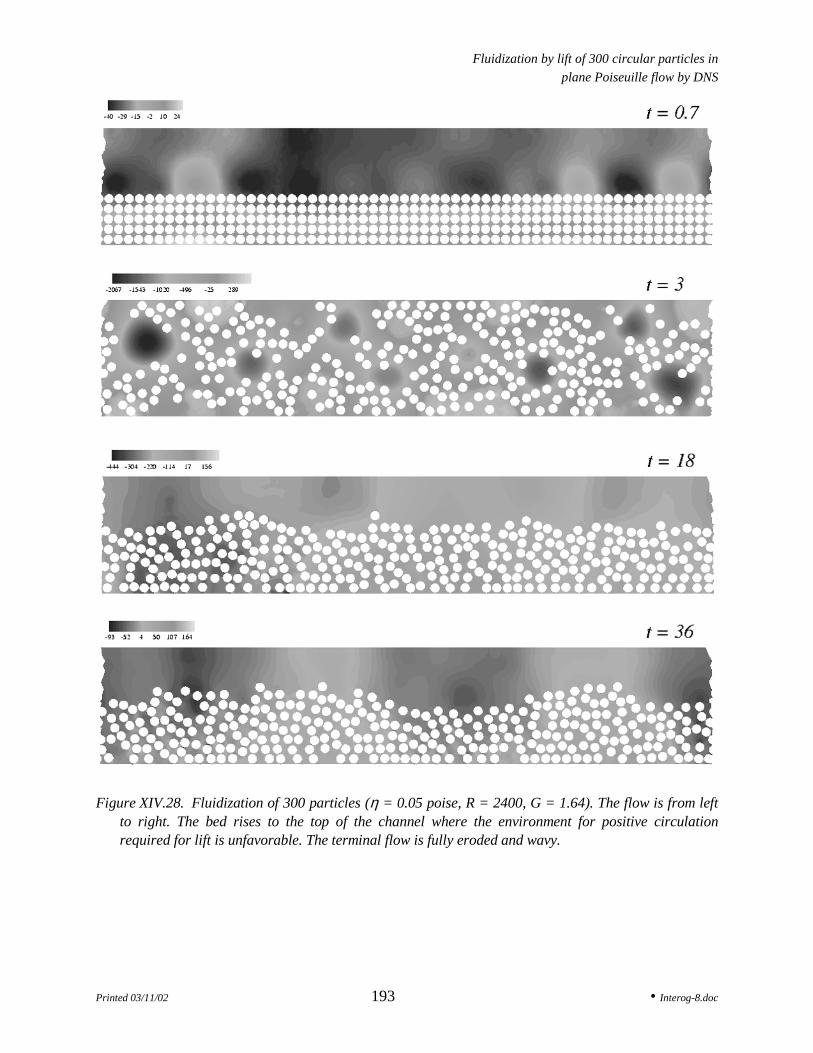
Figure XIV.28. Fluidization of 300 particles (η = 0.05 poise, R = 2400, G = 1.64). The flow is from leftto right. The bed rises to the top of the channel where the environment for positive circulationrequired for lift is unfavorable. The terminal flow is fully eroded and wavy.
Fluidization by lift of 300 circular particles inplane Poiseuille flow by DNS
Printed 03/11/02 194 • Interog-8.doc
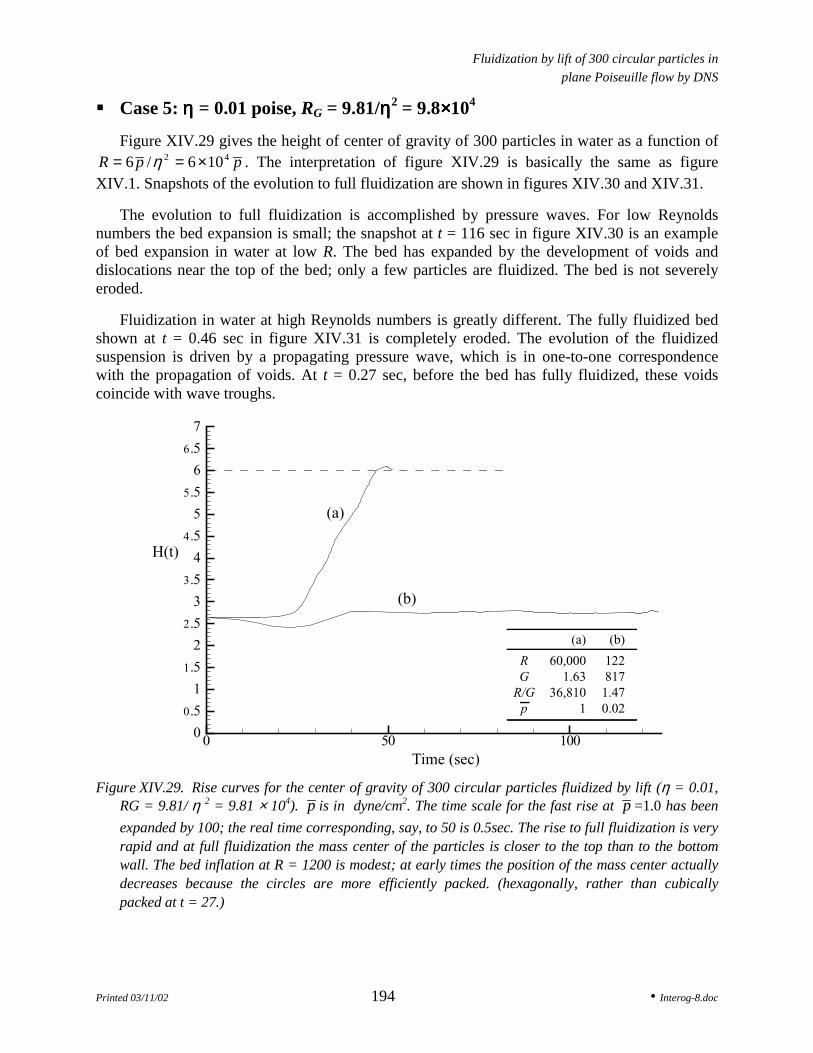
Case 5: η η η η = 0.01 poise, RG = 9.81/ηηηη2 = 9.8××××104
Figure XIV.29 gives the height of center of gravity of 300 particles in water as a function ofppR 42 106/6 ×== η . The interpretation of figure XIV.29 is basically the same as figure
XIV.1. Snapshots of the evolution to full fluidization are shown in figures XIV.30 and XIV.31.
The evolution to full fluidization is accomplished by pressure waves. For low Reynoldsnumbers the bed expansion is small; the snapshot at t = 116 sec in figure XIV.30 is an exampleof bed expansion in water at low R. The bed has expanded by the development of voids anddislocations near the top of the bed; only a few particles are fluidized. The bed is not severelyeroded.
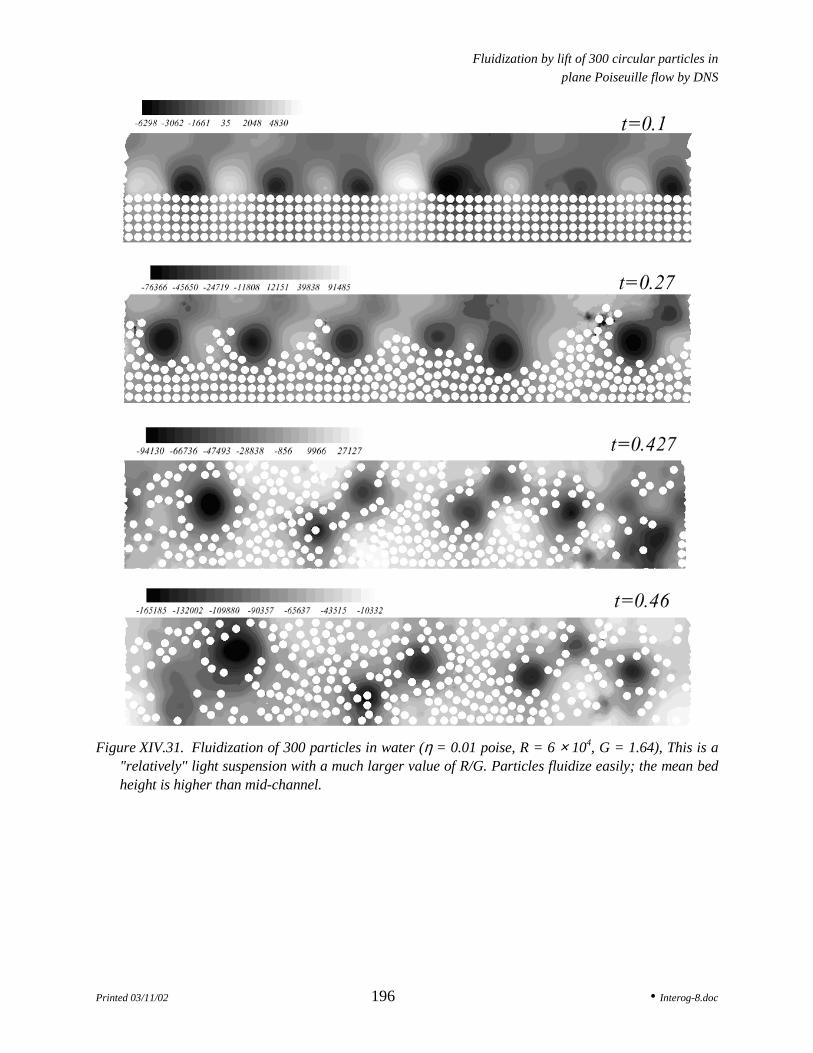
Fluidization in water at high Reynolds numbers is greatly different. The fully fluidized bedshown at t = 0.46 sec in figure XIV.31 is completely eroded. The evolution of the fluidizedsuspension is driven by a propagating pressure wave, which is in one-to-one correspondencewith the propagation of voids. At t = 0.27 sec, before the bed has fully fluidized, these voidscoincide with wave troughs.
0 50 1000
0.5
1
1.5
2
2.5
3
3.5
4
4.5
5
5.5
6
6.5
7
Time (sec)
H(t)
(a)
(b)
RG
R/Gp
(a)
60,000
1.63
36,810
1
(b)
122
817
1.47
0.02
Figure XIV.29. Rise curves for the center of gravity of 300 circular particles fluidized by lift (η = 0.01,RG = 9.81/ η 2 = 9.81 × 10⁴). p is in dyne/cm2. The time scale for the fast rise at p =1.0 has beenexpanded by 100; the real time corresponding, say, to 50 is 0.5sec. The rise to full fluidization is veryrapid and at full fluidization the mass center of the particles is closer to the top than to the bottomwall. The bed inflation at R = 1200 is modest; at early times the position of the mass center actuallydecreases because the circles are more efficiently packed. (hexagonally, rather than cubicallypacked at t = 27.)

Fluidization by lift of 300 circular particles inplane Poiseuille flow by DNS
Printed 03/11/02 195 • Interog-8.doc
Table XIV.5. Data for the forward motion of a fluidized suspension of 300 particles after the bed hasfully inflated and the average height H of all particles has stopped increasing (η = 0.01). H = H0 =2.65d at t = 0. U and Ω are the average velocity and angular velocity of particles.
R G p H U Ω1200 81.75 0.02 2.77 0.63 0.046×10⁴ 1.64 1.0 6.02 116.20 4.50
Figure XIV.30. Fluidization of 300 particles (η = 0.01 poise, R = 1200, G = 81.75). The flow is from leftto right. This is a "relatively" heavy suspension with a smaller value of R/G. At t = 27 the flow packsthe initial cubic array more closely into a hexagonal array and the mean bed height drops. The finalfluid condition for t = 116 is mildly inflated, more closely packed at the bottom than the top.
Fluidization by lift of 300 circular particles inplane Poiseuille flow by DNS
Printed 03/11/02 196 • Interog-8.doc
Figure XIV.31. Fluidization of 300 particles in water (η = 0.01 poise, R = 6 × 10⁴, G = 1.64), This is a"relatively" light suspension with a much larger value of R/G. Particles fluidize easily; the mean bedheight is higher than mid-channel.

Fluidization by lift of 300 circular particles inplane Poiseuille flow by DNS
Printed 03/11/02 197 • Interog-8.doc
p (dyne/cm2)0 5000-5000
0
1
2
3
4
5
6
7
8
9
10
11
12
(a) (b)
(c)
(d)
(e)(f)y
0 100 200
u (cm/sec)300 400 500
1
2
3
4
5
6
7
8
9
10
11
y
(a)
(b)
(c)
Figure XIV.32. Distribution of dynamic pressure p and streamwise velocity u at t = 0.1 sec for thefluidization of 300 particles in water when R = 6 × 10⁴ (see figure XIV.31). In this case t = 0.1 sec isnot an early time; the propagating pressure wave has already developed, but it does not yet have abig effect on the velocity distribution.
Figure XIV.32 and XIV.33 show how the dynamic pressure p develops as the bed evolves tofull fluidization. For this case t = 0.1 sec is not an early time; the periodic pressure pulses whichdrive particles into suspension have already developed.
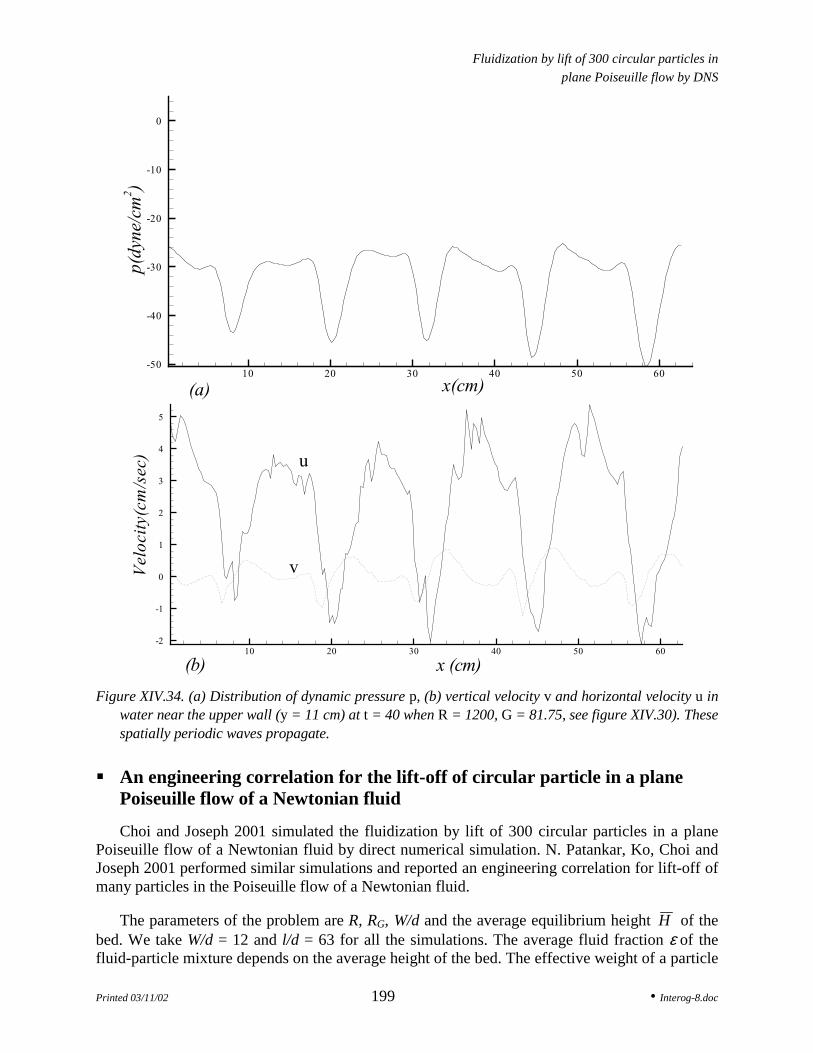
Figure XIV.34 focuses on the wave properties of the evolving fluidization of 300 particles inwater when R = 1200. The t = 40 sec panel of figure XIV.30 shows a propagating and nearlyspatially periodic wave of particles. Wave forms for the dynamic pressure p, the vertical velocityV and the horizontal velocity U are shown.

Fluidization by lift of 300 circular particles inplane Poiseuille flow by DNS
Printed 03/11/02 198 • Interog-8.doc
0 50000
1
2
3
4
5
6
7
8
9
10
11
12
y
p (dyne/cm2)
(a) (b)(c)
(d)(e)
-200 -100
u (cm/sec)0 100 200 300 400
1
2
3
4
5
6
7
8
9
10
11
12
y(a)
(b)
(c)(d)
(e)
Figure XIV.33. Distribution of dynamic pressure p and streamwise velocity u at t = 0.46 sec (see figureXIV.31). The pressure and velocity wave coincides with the propagation of internal waves of voidfractions.
Fluidization by lift of 300 circular particles inplane Poiseuille flow by DNS
Printed 03/11/02 199 • Interog-8.doc
10 20 30 40 50 60-50
-40
-30
-20
-10
0
x(cm)
p(dy
ne/c
m2 )
(a)
10 20 30 40 50 60
-2
-1
0
1
2
3
4
5
Vel
ocit
y(cm
/sec
) u
v
x (cm)(b)
Figure XIV.34. (a) Distribution of dynamic pressure p, (b) vertical velocity v and horizontal velocity u inwater near the upper wall (y = 11 cm) at t = 40 when R = 1200, G = 81.75, see figure XIV.30). Thesespatially periodic waves propagate.
An engineering correlation for the lift-off of circular particle in a planePoiseuille flow of a Newtonian fluid
Choi and Joseph 2001 simulated the fluidization by lift of 300 circular particles in a planePoiseuille flow of a Newtonian fluid by direct numerical simulation. N. Patankar, Ko, Choi andJoseph 2001 performed similar simulations and reported an engineering correlation for lift-off ofmany particles in the Poiseuille flow of a Newtonian fluid.
The parameters of the problem are R, RG, W/d and the average equilibrium height H of thebed. We take W/d = 12 and l/d = 63 for all the simulations. The average fluid fraction ε of thefluid-particle mixture depends on the average height of the bed. The effective weight of a particle
Fluidization by lift of 300 circular particles inplane Poiseuille flow by DNS
Printed 03/11/02 200 • Interog-8.doc
in a suspension is equal to (πd2/4)(ρs - ρc)g = ε (πd2/4)( ρs - ρf)g, Foscolo and Gibilaro 1984,Joseph 1990, where ρc is the effective or composite density of the fluid-particle mixture.Consequently, the net buoyant weight (or lift) Ls on a particle in a suspension is given by
Ls = εL = ε (πd2/4)( ρs - ρf)g (XIV.1)
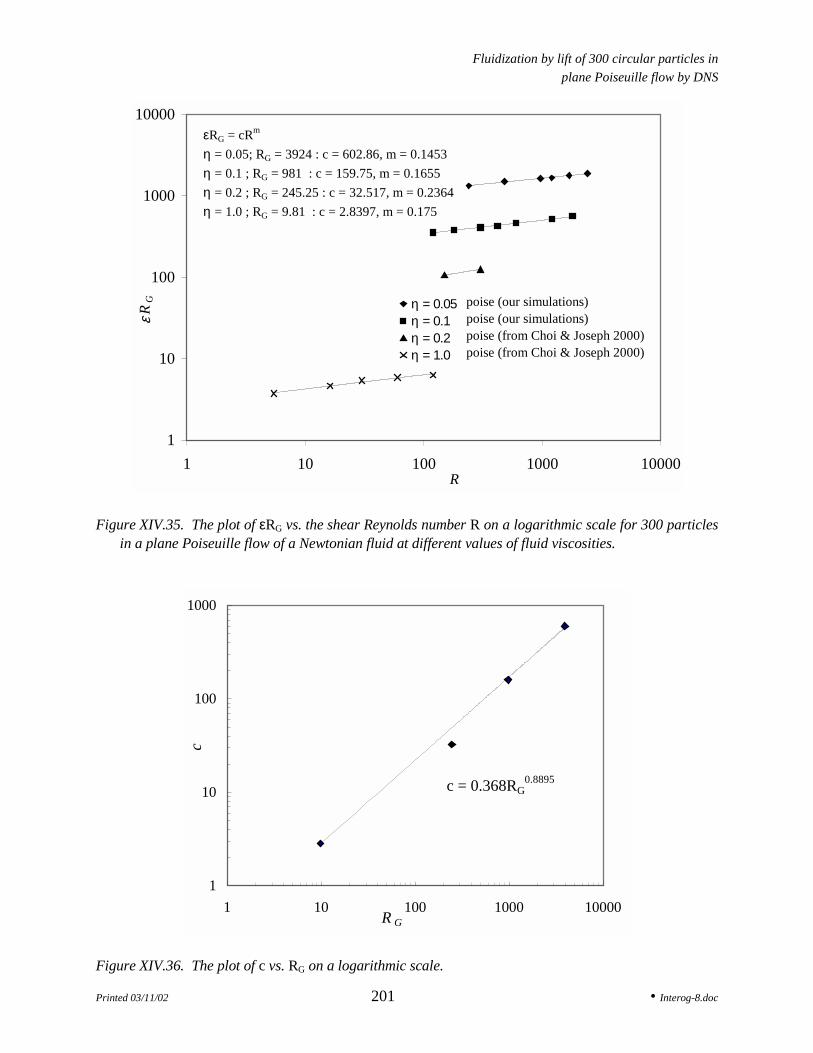
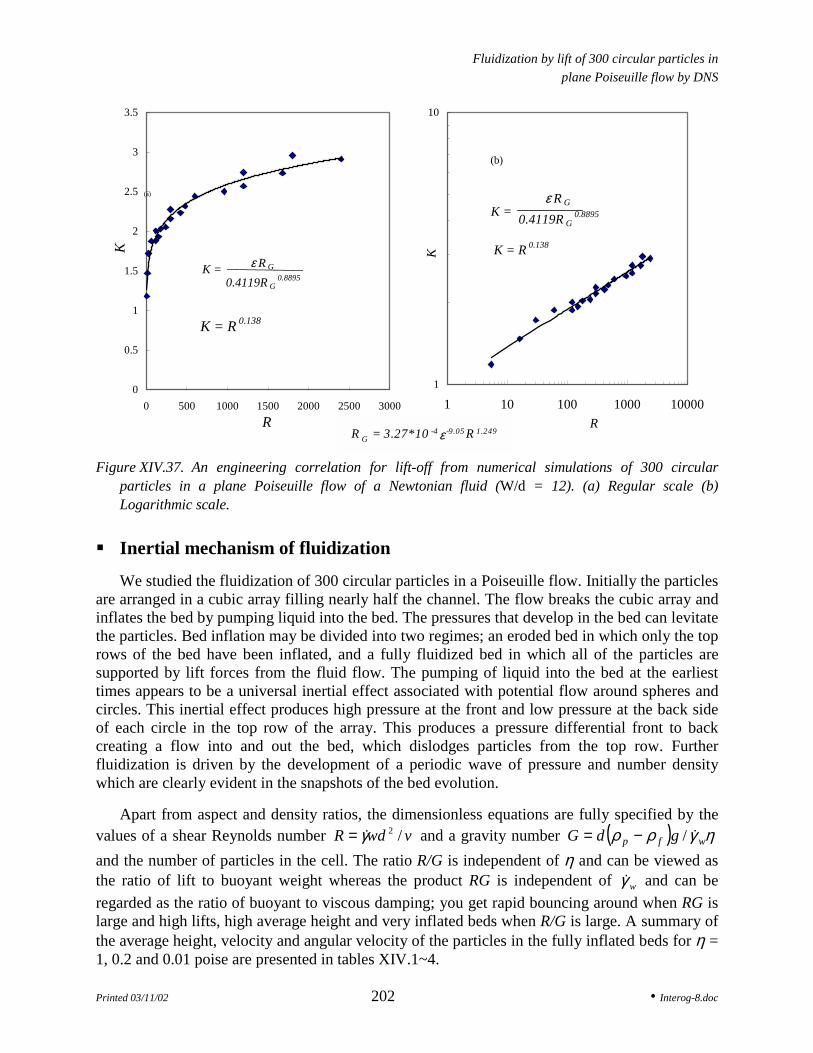
where L is the buoyant weight (or lift) on a particle in the absence of any other particles. Wetherefore plot εRG vs. R in figure XIV.35 at different values of fluid viscosities. At a givenviscosity the value of RG is constant. The fluid fraction or the average equilibrium height of theparticle bed increased as the Reynolds number is increased. Heavier particles are lifted to asmaller average equilibrium height at the same Reynolds number. We observe that the data ateach viscosity can be represented by a power law equation of the form RG = cRm, where thevalues of c and m are given in the figure. The value of c varies significantly with respect to RGwhereas the value of m does not show large variation. Figure XIV.36 shows the plot of c vs. RGon a logarithmic scale. The functional dependence of c on RG is represented in terms of a powerlaw equation. Combining this result with that in figure XIV.35 we can arrive at a correlation forRG as a function of R and ε. In figure XIV.37 we reduce all the data points to a single curve. Theprefactor in the expression for c is changed from 0.368 in figure XIV.36 to 0.4119 in figureXIV.37 for better agreement between the data and the correlation. The average value of theexponent m is also obtained from the curve fit for all the data points. We get the followingcorrelation for RG as a function of R and ε
RG = 3.27 × 10⁻⁴ε-9.05R1.249 (XIV.2)
Fluidization by lift of 300 circular particles inplane Poiseuille flow by DNS
Printed 03/11/02 201 • Interog-8.doc
1
10
100
1000
10000
1 10 100 1000 10000R
εRG η = 0.05
η = 0.1η = 0.2η = 1.0
εRG = cRm
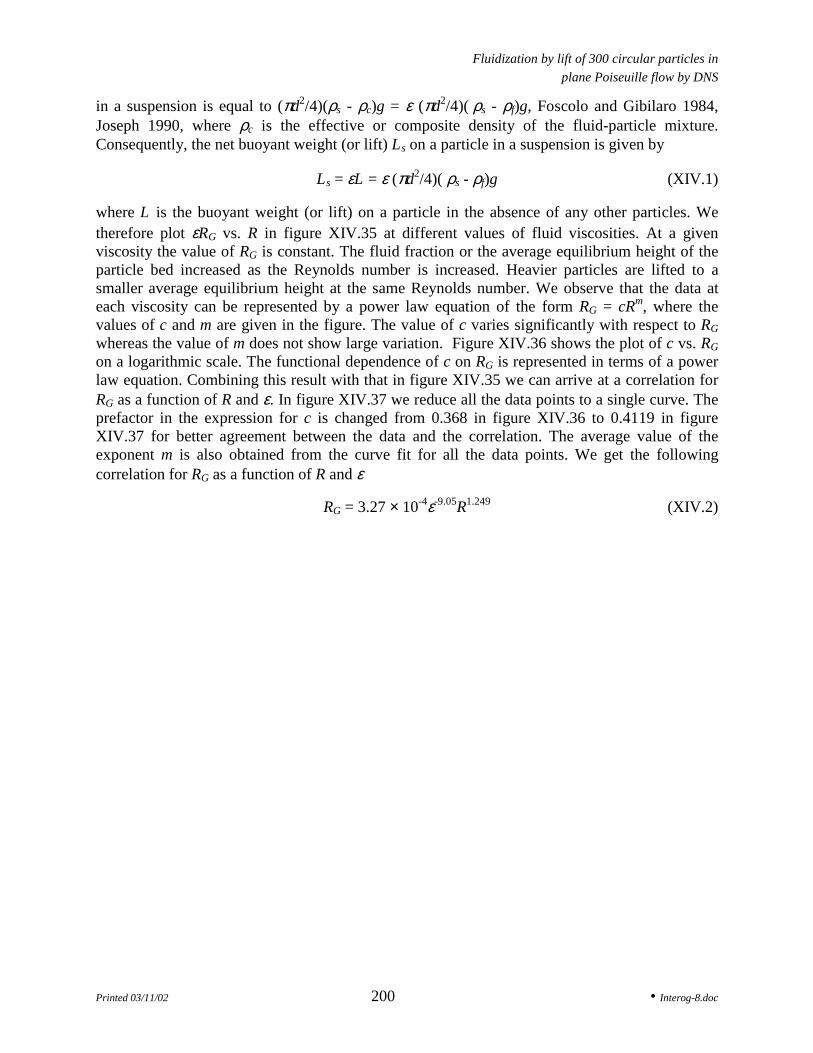
η = 0.05; RG = 3924 : c = 602.86, m = 0.1453η = 0.1 ; RG = 981 : c = 159.75, m = 0.1655η = 0.2 ; RG = 245.25 : c = 32.517, m = 0.2364η = 1.0 ; RG = 9.81 : c = 2.8397, m = 0.175
poise (our simulations)poise (our simulations)poise (from Choi & Joseph 2000)poise (from Choi & Joseph 2000)
Figure XIV.35. The plot of εRG vs. the shear Reynolds number R on a logarithmic scale for 300 particlesin a plane Poiseuille flow of a Newtonian fluid at different values of fluid viscosities.
c = 0.368RG0.8895
1
10
100
1000
1 10 100 1000 10000R G
c
Figure XIV.36. The plot of c vs. RG on a logarithmic scale.
Fluidization by lift of 300 circular particles inplane Poiseuille flow by DNS
Printed 03/11/02 202 • Interog-8.doc
K = R 0.138
0
0.5
1
1.5
2
2.5
3
3.5
0 500 1000 1500 2000 2500 3000R
K
K = ε R G
0.4119R G0.8895
(a)
K = R 0.138
1
10
1 10 100 1000 10000R
K
ε R G
0.4119R G0.8895K =
(b)
Figure XIV.37. An engineering correlation for lift-off from numerical simulations of 300 circularparticles in a plane Poiseuille flow of a Newtonian fluid (W/d = 12). (a) Regular scale (b)Logarithmic scale.
Inertial mechanism of fluidization
We studied the fluidization of 300 circular particles in a Poiseuille flow. Initially the particlesare arranged in a cubic array filling nearly half the channel. The flow breaks the cubic array andinflates the bed by pumping liquid into the bed. The pressures that develop in the bed can levitatethe particles. Bed inflation may be divided into two regimes; an eroded bed in which only the toprows of the bed have been inflated, and a fully fluidized bed in which all of the particles aresupported by lift forces from the fluid flow. The pumping of liquid into the bed at the earliesttimes appears to be a universal inertial effect associated with potential flow around spheres andcircles. This inertial effect produces high pressure at the front and low pressure at the back sideof each circle in the top row of the array. This produces a pressure differential front to backcreating a flow into and out the bed, which dislodges particles from the top row. Furtherfluidization is driven by the development of a periodic wave of pressure and number densitywhich are clearly evident in the snapshots of the bed evolution.
Apart from aspect and density ratios, the dimensionless equations are fully specified by thevalues of a shear Reynolds number vwdR /2γ= and a gravity number ( ) ηγρρ wfp gdG /−=and the number of particles in the cell. The ratio R/G is independent of η and can be viewed asthe ratio of lift to buoyant weight whereas the product RG is independent of wγ and can beregarded as the ratio of buoyant to viscous damping; you get rapid bouncing around when RG islarge and high lifts, high average height and very inflated beds when R/G is large. A summary ofthe average height, velocity and angular velocity of the particles in the fully inflated beds for η =1, 0.2 and 0.01 poise are presented in tables XIV.1~4.
R G = 3.27*10 -4 ε -9.05 R 1.249
Fluidization by lift of 300 circular particles inplane Poiseuille flow by DNS
Printed 03/11/02 203 • Interog-8.doc
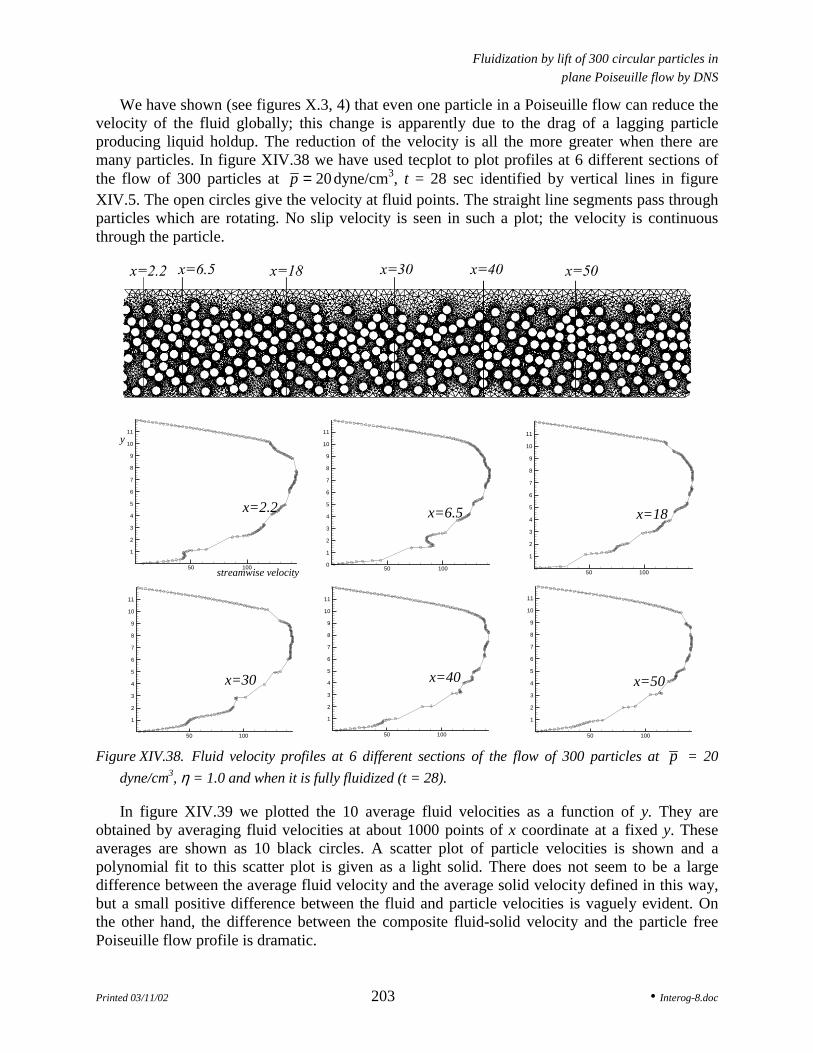
We have shown (see figures X.3, 4) that even one particle in a Poiseuille flow can reduce thevelocity of the fluid globally; this change is apparently due to the drag of a lagging particleproducing liquid holdup. The reduction of the velocity is all the more greater when there aremany particles. In figure XIV.38 we have used tecplot to plot profiles at 6 different sections ofthe flow of 300 particles at 20=p dyne/cm3, t = 28 sec identified by vertical lines in figureXIV.5. The open circles give the velocity at fluid points. The straight line segments pass throughparticles which are rotating. No slip velocity is seen in such a plot; the velocity is continuousthrough the particle.
50 100
1
2
3
4
5
6
7
8
9
10
11
y
streamwise velocity
x=2.2
50 1000
1
2
3
4
5
6
7
8
9
10
11
x=6.5
50 100
1
2
3
4
5
6
7
8
9
10
11
x=18
50 100
1
2
3
4
5
6
7
8
9
10
11
x=40
50 100
1
2
3
4
5
6
7
8
9
10
11
x=50
50 100
1
2
3
4
5
6
7
8
9
10
11
x=30
Figure XIV.38. Fluid velocity profiles at 6 different sections of the flow of 300 particles at p = 20dyne/cm3, η = 1.0 and when it is fully fluidized (t = 28).
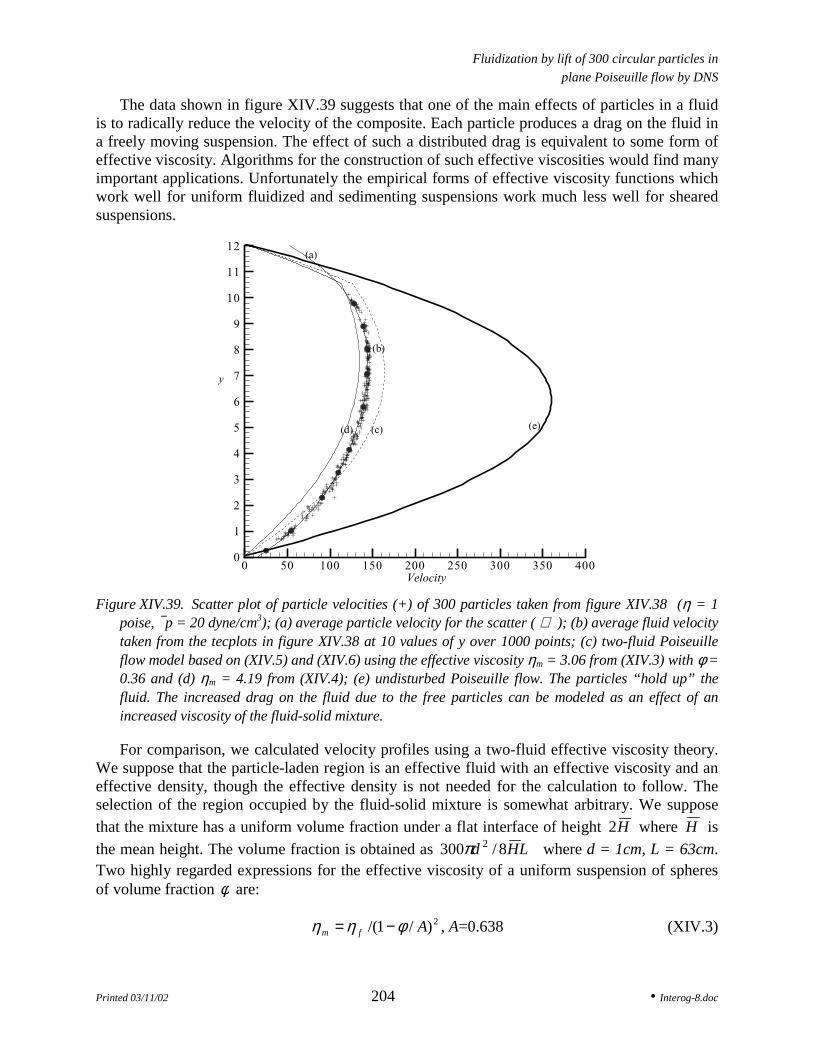
In figure XIV.39 we plotted the 10 average fluid velocities as a function of y. They areobtained by averaging fluid velocities at about 1000 points of x coordinate at a fixed y. Theseaverages are shown as 10 black circles. A scatter plot of particle velocities is shown and apolynomial fit to this scatter plot is given as a light solid. There does not seem to be a largedifference between the average fluid velocity and the average solid velocity defined in this way,but a small positive difference between the fluid and particle velocities is vaguely evident. Onthe other hand, the difference between the composite fluid-solid velocity and the particle freePoiseuille flow profile is dramatic.
Fluidization by lift of 300 circular particles inplane Poiseuille flow by DNS
Printed 03/11/02 204 • Interog-8.doc
The data shown in figure XIV.39 suggests that one of the main effects of particles in a fluidis to radically reduce the velocity of the composite. Each particle produces a drag on the fluid ina freely moving suspension. The effect of such a distributed drag is equivalent to some form ofeffective viscosity. Algorithms for the construction of such effective viscosities would find manyimportant applications. Unfortunately the empirical forms of effective viscosity functions whichwork well for uniform fluidized and sedimenting suspensions work much less well for shearedsuspensions.
+
+
+
+
+
+
+
+
+
+
+
+
+
+
+
+
+
+
+
+
+
+
+
+
++
+
+
+
+
++
+
+
++
+
+
+
+
+
+
+
+
+
+
+
+
+
+
+
+
+
+
+
+
+
+
+
+
+
+
+
+
+
+
+
+
+
+
+
+
++
++
+
+
+
+
+
+
+
+
+
+
+
+
+
+
+
+
+
+
+
+
+
+
+
+
+
+
+
+
+
+
+
+
+
+
+
+
+
+
+
++
+
++
+
+
+
+
+
+
+
+
+
+
+
++
++
++
+
+
+
+
+
++
+
+
+
+
+
+
+
+
+
+
+
+
+
+
+
+
+
+
+
+
+
+
+
+
+
++
+
+
+
+
+
+
+
+ +
+
+
+
+
+
+
+
+
++
++
+
+
+
+
+
+
+
+
+
+
+
+
+
+
+
+
+
+
+
+
++
+
+
+
+
+
+
+
+
+
+
+
+
+
+
+
+
+
+
+
+
+
+
+
+
++
+
+
+
+
+
+
++
+
+
+
+
+
+
+
+
+
+
+
+
+
+
+
+
+
+
+
+
+
+
+
+
+
+
+
+
+
+
+
+
+
+
+
+
+
+
+
+
+
+
+
+
+
+
+
+
+
+
+
+
0 50 100 150 200 250 300 350 4000
1
2
3
4
5
6
7
8
9
10
11
12
y
Velocity
(c)(d)
(a)
( (b)
(e)
Figure XIV.39. Scatter plot of particle velocities (+) of 300 particles taken from figure XIV.38 (η = 1poise, p = 20 dyne/cm3); (a) average particle velocity for the scatter ( ); (b) average fluid velocitytaken from the tecplots in figure XIV.38 at 10 values of y over 1000 points; (c) two-fluid Poiseuilleflow model based on (XIV.5) and (XIV.6) using the effective viscosity ηm = 3.06 from (XIV.3) with φ =0.36 and (d) ηm = 4.19 from (XIV.4); (e) undisturbed Poiseuille flow. The particles “hold up” thefluid. The increased drag on the fluid due to the free particles can be modeled as an effect of anincreased viscosity of the fluid-solid mixture.
For comparison, we calculated velocity profiles using a two-fluid effective viscosity theory.We suppose that the particle-laden region is an effective fluid with an effective viscosity and aneffective density, though the effective density is not needed for the calculation to follow. Theselection of the region occupied by the fluid-solid mixture is somewhat arbitrary. We supposethat the mixture has a uniform volume fraction under a flat interface of height H2 where H isthe mean height. The volume fraction is obtained as LHd 8/300 2π where d = 1cm, L = 63cm.Two highly regarded expressions for the effective viscosity of a uniform suspension of spheresof volume fraction φ are:
2)/1/( Afm φηη −= , A=0.638 (XIV.3)
Fluidization by lift of 300 circular particles inplane Poiseuille flow by DNS
Printed 03/11/02 205 • Interog-8.doc
which is due to Kataoka et al. 1978 into two dimension and
)00273.005.105.21( 6.162 φφφηη efm +++= (XIV.4)
which is due to Thomas 1965. These expressions were obtained from experiments and may notapply in two dimensions. We used 8328.02 == DAA which scales A into two dimension in the
ratio of close packed hexagonal packings in 2 and 3 dimensions DD AA 32 740.0907.0= . The effective
theory is a two-fluid stratified Poiseuille flow satisfying the following equations
hyyuphy
y
up mf
f ≤∂
∂=≥
∂
∂= for ,for 2
2
2
2
ηη (XIV.5)
where Hh 2= is the interface between the pure fluid and the mixture. At the boundary
)()(
;on continuous are stressshear and velocity theand 0.0)0( ,0.0)(
huhuhyuWu
mf
mf
=
===
)()( hy
uh
yu mf
f ∂∂
=∂
∂ηη . (XIV.6)
The comparison of the effective theory corresponding to (XIV.3) and (XIV.4) with thenumerical simulation is exhibited in figure XIV.39. The agreement between the effective theoryand the simulation is far from perfect but there is agreement within a large tolerance. Theeffective theory however has several big defects which must be overcome before it can be usedto model the slurry; first and foremost the theory requires that h be specified; here from thesimulation a second problem is that the effective viscosity for uniform suspension need not be agood representation of sheared suspension. It is certain the effective density of the slurry mustenter into the height of the fluidized slurry in ways we don’t yet understand.
The small difference between the spatially averaged fluid and solid velocities cannot be saidto be clearly evident at all positions on a cross section. It is our position that a positive slipvelocity is required to support the buoyant weight of particles. In fact, we would expect that thedifference between the particle weight and the composite density ρ(φ) = ρpφ + ρf (1- φ) is afactor in the unknown formula for the lift on a particle in a swarm of volume fraction φ. In thepresent case ρp - ρ(φ) = (ρp - ρf )(1- φ) = 0.01(1- φ) is very small and a large slip velocity is notrequired to levitate a particle. The calculation of the slip velocity ought to be defined in terms oftime or ensemble averages at a fixed point, which are not readily calculated with the ALEmethod used here.

Fluidization by lift of 300 circular particles inplane Poiseuille flow by DNS
Printed 03/11/02 206 • Interog-8.doc
+
+
+
+
+
+
+
+
+
++
+
+
+
+
+
+
+
+
+
+
+
+
+
+
+
+
+
+
+
+
+
+
+
+
+
+
+
+
+
+
+
+
+
+
+
+
+
+
+
+
+
++
+
+
+
+
+
+
+
+
+
+
+
+
+
+
+
+
+
+
+
+
+
+
+
+
+
+
+
+
+
+
+
+
+
+
+
+
++
+
+
+
+
+
+
+
+
+
+
+
+
+
+
+
+
+
+
+
+
+
+
+
+
+
+
+
++
+
+
+
+
+
+
+
++
+
+
+
+
+
+
+
+
+
+
+
+
+
+
+
+
+
+
+
+
+
+
+
+
+
+
+
+
+
+
+
+
+
+
+
+
+
+
+
+
+
+
+
+
+
+
+
+
+
+
+
+
+
+
+
+
+
+
+
+
+
+
+
+
+
+
+
+
+
+
+
+
+
+ +
+
+
+
+
+
+
+
+
+
+
+
+
+
+
+
+
+ +
+
+
+
+
+
+
+
+
+
+
+
++
+
+
+
+
+
+
+
+
+
+
+
+
+
+
+
+
+
+
+
+
+
+
+
+
+
+
+
+
+
++
+
+
+
+
+
+
+
+
+
+
+
+
+
+
+
+
+
+
+
+
+
+
+
+
+
+
+
+
+
+
++
+
+
0 500 1000 1500 20000
1
2
3
4
5
6
7
8
9
10
11
12
y (cm)
Velocity (cm/sec)
(a)
(b)
Scatter plot for particle velocity
Average of particle velocity
Undisturbed velocity (c)
Figure XIV.40. Scatter plot for the fluidization of 300 particles in water (η = 0.01 poise) shown in figureXIV.31. In this case, particles fill the whole channel and the scatter is caused by large fluctuations.(a) The average velocity profile ( ) is rather flat as would be expected from turbulent flow. Theblack dots • are average fluid velocities from the tecplots in figure XIV.31. (b) Velocity profile forPoiseuille flow of a fluid with effective viscosity ηm = 0.032 given by (XIV.4) for φ = 0.31. This doesnot agree with the simulation. Perhaps it would be better to create an effective "eddy viscosity"theory for this weakly turbulent flow. (c) Undisturbed Poiseuille flow without particles.
Figure XIV.40 gives a scatter plot for the water flow in figure XIV.31 (η = 0.01 poise,4106 ×=R , G = 164). The results here are what might be expected of turbulent flow and appear
to represent the natural extrapolation of results given in this paper at lower Reynolds numbers.The relevant Reynolds number, based on the average particle velocity ,seccm/200=U theeffective viscosity ηm = 0.032 poise and particle diameter d, is about 6000, a value at which onemight expect weak turbulence. Informed readers will question the validity of our computationusing Choi’s 2000 split method in direct numerical simulation with no artificial viscosity orturbulence model. The natural way to test this result is to do mesh refinement. Our unstructuredmesh is generated automatically from nodes on the surface of the circular particle. Ourcalculation converged, and converged solutions have nearly the same height history for 15 to 30nodes on the circular particle when the time step size ( )t∆ used is about 510− (the correspondingCourant number is about 0.1); the converged solution cannot be obtained when the number ofnodes is less than 12 or sometimes greater than 30. When the number of nodes is greater than 30,the calculation may stop because the mesh generator is unable to generate mesh due to thedistortion of very short elements during motion. Certainly we have not established the validity ofsuch a high Reynolds number computation, but the results do converge to something whichappears reasonable and survives tests of mesh refinement.