WETS D’15 Workshop - Jicable · Organization: Jicable and Prospective 21OO Palais des Congrès de...
13
Evaluation of the XLPE MV lifetime Boris Dardel WETS D’15 Workshop Organization: Jicable and Prospective 21OO Palais des Congrès de Versailles, France Thursday, 25 June 2015 WETS D’15 2.3 Dardel
Transcript of WETS D’15 Workshop - Jicable · Organization: Jicable and Prospective 21OO Palais des Congrès de...

Evaluation of the XLPE MV lifetime Boris Dardel
WETS D’15 Workshop Organization: Jicable and Prospective 21OO
Palais des Congrès de Versailles, France Thursday, 25 June 2015
WETS D’15 2.3 Dardel
60kV cable with vapour crosslinking: 2 samples
Production Cortaillod 1973 Graphite outer semicon
Conductor Copper Tan δ @ 1.5U0 4.5 10-4 1.8 10-4
Tan δ @ 2.0U0 7.2 10-4 3.5 10-4
Breakdown at 90kV 5 min 2 min PD 10 pC 40 pC
Analysis of old cables
Analysis of old cables
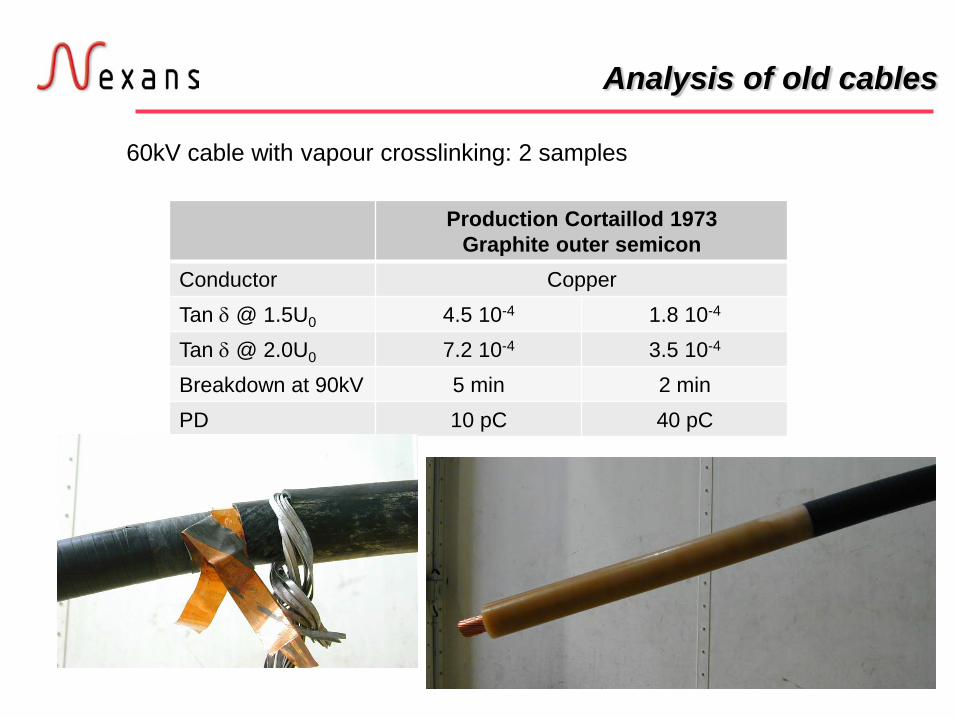
60kV cable with vapour crosslinking:
Production Cortaillod 12/78
Production Cossonay 1978?
Conductor Copper Tinned copper Tan δ @ 1.5U0 4.9 10-4 7.9 10-4
Tan δ @ 2.0U0 6.2 10-4 5.7 10-4
Breakdown at 90kV 10 min 12 min PD 50pC 50pC
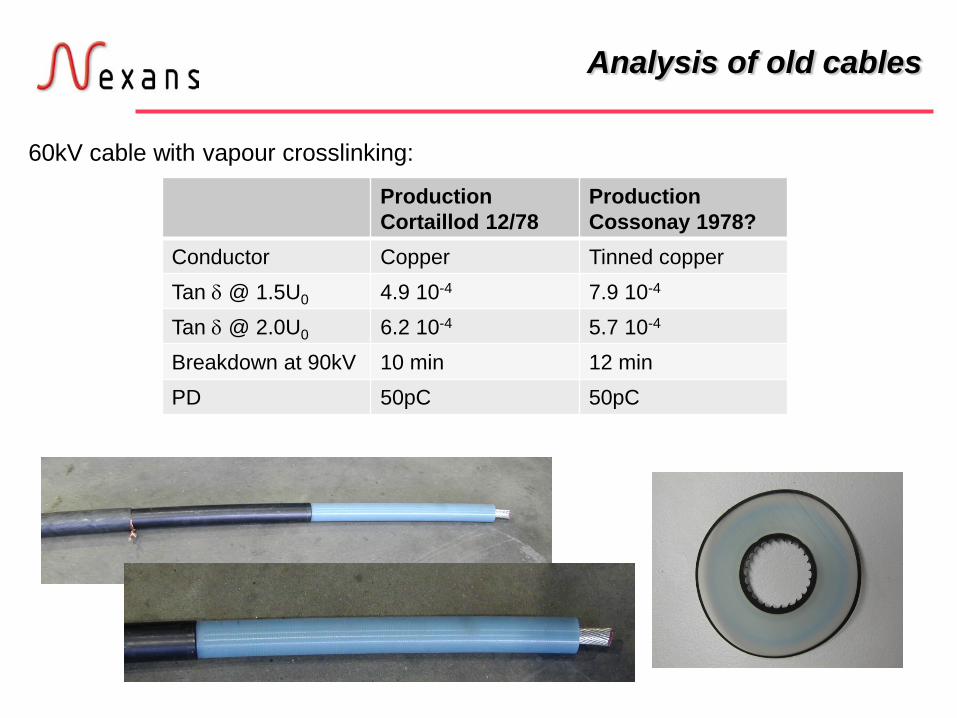
What about first synthetic cables?
0
2
4
6
8
Bre
akdo
wns
(#
/100
km/y
ear)
Year of manufacture
Vapour crosslinking Graphite outer SC
PVC sheath Extruded outer SC Strippable
Dry crosslinking Triple extrusion
Non-strippable SC Laminated sheath
Data in the litterature
Defects in insulation
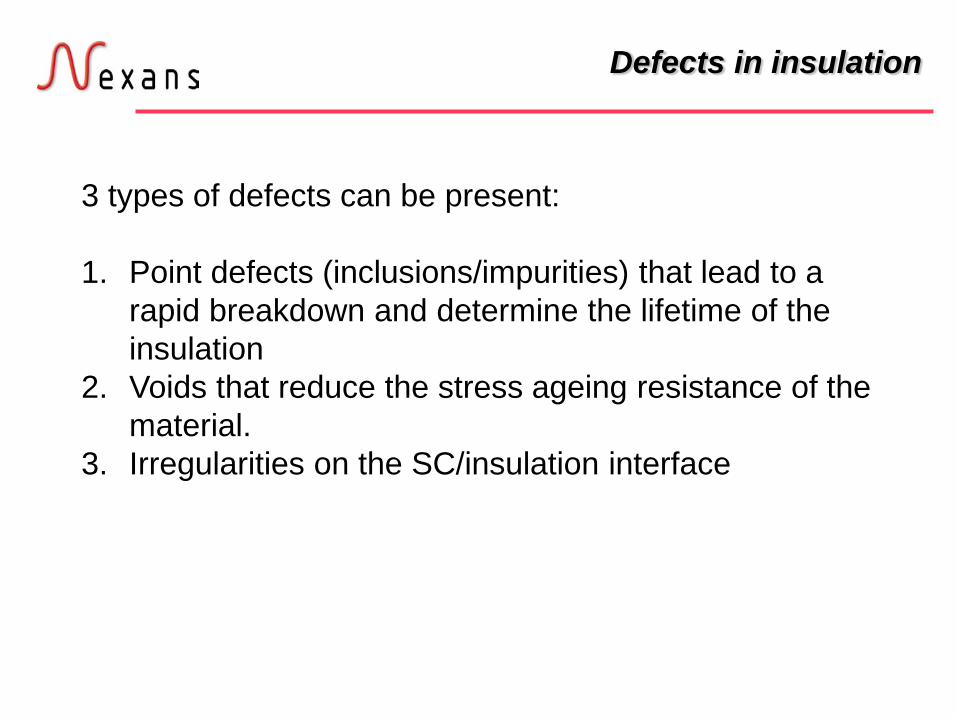
3 types of defects can be present: 1. Point defects (inclusions/impurities) that lead to a
rapid breakdown and determine the lifetime of the insulation
2. Voids that reduce the stress ageing resistance of the material.
3. Irregularities on the SC/insulation interface
Selection criteria for routine test
15 kV/mm voltage test during 30 minutes
• No partial discharges • Breakdowns as well as PD are localized and analyzed for corrective
action
Elimination of point defects
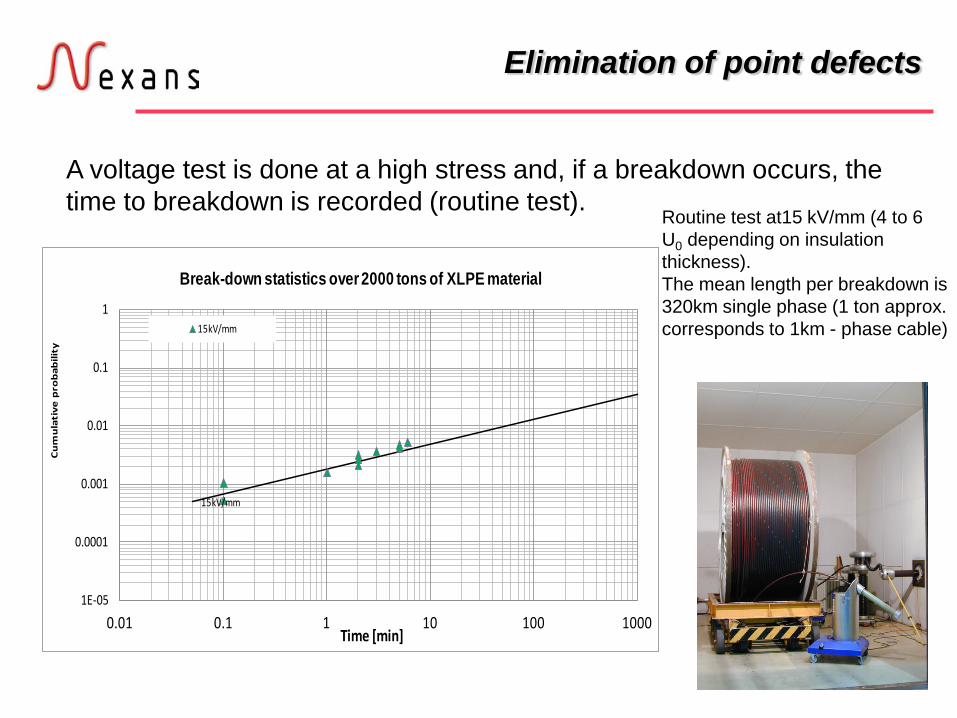
A voltage test is done at a high stress and, if a breakdown occurs, the time to breakdown is recorded (routine test).
15kV/mm
1E-05
0.0001
0.001
0.01
0.1
1
0.01 0.1 1 10 100 1000
Cu
mu
lati
ve p
rob
abili
ty
Time [min]
Break-down statistics over 2000 tons of XLPE material
15kV/mm
Routine test at15 kV/mm (4 to 6 U0 depending on insulation thickness). The mean length per breakdown is 320km single phase (1 ton approx. corresponds to 1km - phase cable)
Determination of n
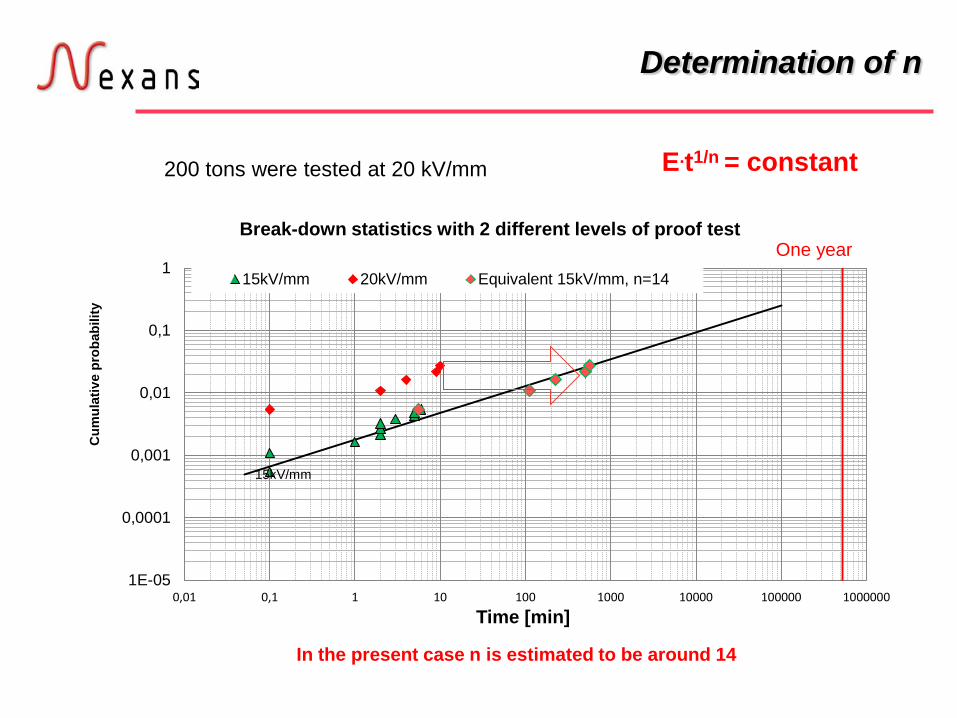
200 tons were tested at 20 kV/mm
15kV/mm
One year
1E-05
0,0001
0,001
0,01
0,1
1
0,01 0,1 1 10 100 1000 10000 100000 1000000
Cum
ulat
ive
prob
abili
ty
Time [min]
Break-down statistics with 2 different levels of proof test
15kV/mm 20kV/mm Equivalent 15kV/mm, n=14
In the present case n is estimated to be around 14
E.t1/n = constant
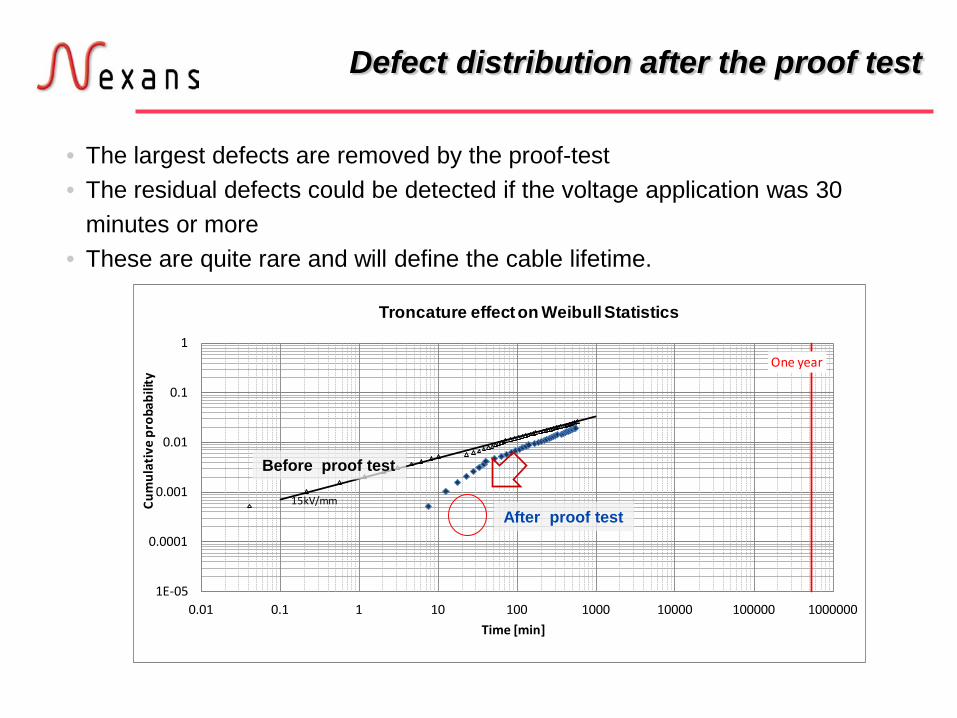
Defect distribution after the proof test
• The largest defects are removed by the proof-test • The residual defects could be detected if the voltage application was 30
minutes or more • These are quite rare and will define the cable lifetime.
One year
15kV/mm
1E-05
0.0001
0.001
0.01
0.1
1
0.01 0.1 1 10 100 1000 10000 100000 1000000
Cum
ulat
ive
prob
abili
ty
Time [min]
Troncature effect on Weibull Statistics
Before proof test
After proof test
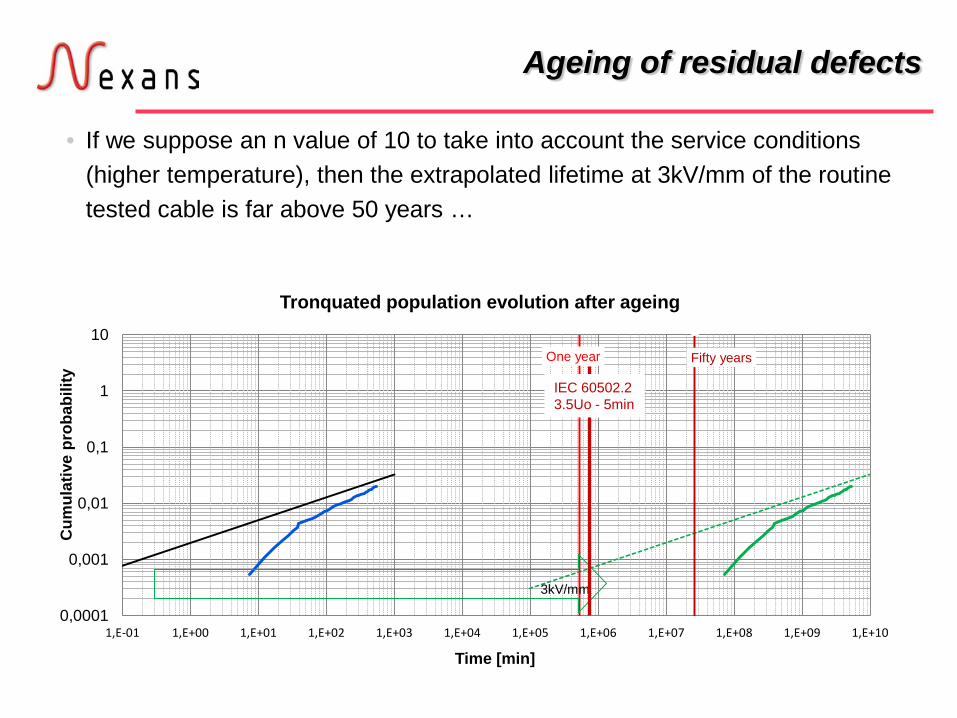
Ageing of residual defects
3kV/mm
One year Fifty years
0,0001
0,001
0,01
0,1
1
10
1,E-01 1,E+00 1,E+01 1,E+02 1,E+03 1,E+04 1,E+05 1,E+06 1,E+07 1,E+08 1,E+09 1,E+10
Cum
ulat
ive
prob
abili
ty
Time [min]
Tronquated population evolution after ageing
• If we suppose an n value of 10 to take into account the service conditions (higher temperature), then the extrapolated lifetime at 3kV/mm of the routine tested cable is far above 50 years …
IEC 60502.2 3.5Uo - 5min
Conclusions
Since the 90’s, actions have been taken to warrant a lifetime of the cable over 50 years.
• Material selection • Processing • Testing
At the conditions that the laying and the accessories installation are done properly, that the accessories are of good quality and that the maintenance are done properly. For cables that are more than 30 years old, we will learn progressively about the existing problematic. A good evaluation of the characteristics (original values, service conditions, …) of the cables that are replaced is then necessary and will require a strong collaboration between the manufacturers and the operators.
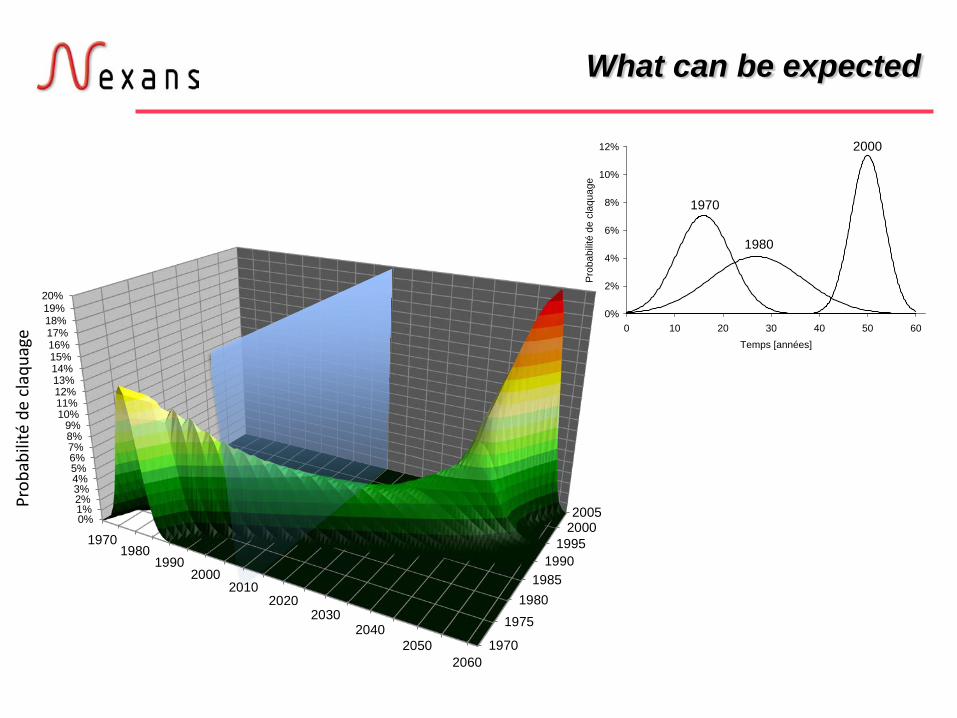
What can be expected
0%
2%
4%
6%
8%
10%
12%
0 10 20 30 40 50 60Temps [années]
Pro
babi
lité
de c
laqu
age
1970
1980
2000
1970
19751980
19851990
1995200020050%
1%2%3%4%5%6%7%8%9%
10%11%12%13%14%15%16%17%18%19%20%
19701980
19902000
20102020
20302040
20502060
Prob
abili
té d
e cl
aqua
ge

Thank you for your attention