Wal-Mart Stores, Inc.s2.q4cdn.com/056532643/files/doc_financials/2017/Q1/Presentation...Wal-Mart...
27
Wal-Mart Stores, Inc.
Transcript of Wal-Mart Stores, Inc.s2.q4cdn.com/056532643/files/doc_financials/2017/Q1/Presentation...Wal-Mart...
Wal-Mart Stores, Inc.
Safe harbor and non-GAAP financial measuresThis presentation contains statements as to Walmart management's guidance regarding the diluted earnings per share from continuing operations attributable to Walmart for the three months ending July. 31, 2016, Walmart U.S.'s comparable store sales and Sam's Club'scomparable club sales, excluding fuel, for the 13 weeks ending July 29, 2016 and the third party FCPA-related expenses expected to be incurred for year ending January 31, 2017. Walmart believes such statements are "forward-looking statements" as defined in, and they areintended to enjoy the protection of the safe harbor for forward-looking statements provided by, the Private Securities Litigation Reform Act of 1995, as amended. Walmart's actual results may differ materially from the guidance provided and the underlying assumptions andmanagement's expectations noted above as a result of changes in circumstances, assumptions not being realized or other risks, uncertainties and factors including:
• economic, geo-political, capital markets and business conditions, trends and events around the world and in the markets in which Walmart operates;• currency exchange rate fluctuations, changes in market interest rates and commodity prices;• unemployment levels;• competitive pressures;• inflation or deflation, generally and in particular product categories;• consumer confidence, disposable income, credit availability, spending levels, shopping patterns, debt levels and demand for certain merchandise;• consumer enrollment in health and drug insurance programs and such programs' reimbursement rates;• the amount of Walmart's net sales denominated in the U.S. dollar and various foreign currencies;• the financial performance of Walmart and each of its segments;• Walmart's effective tax rate for the quarter ending July 31, 2016 and the factors affecting Walmart's effective tax rate, including assessments of certain tax contingencies, valuation allowances, changes in law, administrative audit outcomes, impact of discrete
items and the mix of earnings between the U.S. and Walmart's international operations;• customer traffic and average ticket in Walmart's stores and clubs and on its e-commerce websites;• the mix of merchandise Walmart sells, the cost of goods it sells and the shrinkage it experiences;• the amount of Walmart's total sales and operating expenses in the various markets in which Walmart operates;• transportation, energy and utility costs and the selling prices of gasoline and diesel fuel;• supply chain disruptions and disruptions in seasonal buying patterns;• consumer acceptance of and response to Walmart's stores, clubs, e-commerce websites, mobile apps, initiatives, programs and merchandise offerings;• cyber security events affecting Walmart and related costs;• developments in, outcomes of, and costs incurred in legal proceedings to which Walmart is a party;• casualty and accident-related costs and insurance costs;• the turnover in Walmart's workforce and labor costs, including healthcare and other benefit costs;• changes in accounting estimates or judgments;• changes in existing tax, labor and other laws and changes in tax rates, trade restrictions and tariff rates;• the level of public assistance payments; • natural disasters, public health emergencies, civil disturbances, and terrorist attacks.• Walmart's expenditures for FCPA and compliance related costs; and• outcomes of and costs incurred in legal proceedings to which Walmart is a party.
Such risks, uncertainties and factors also include the risks relating to Walmart's operations and financial performance discussed in Walmart's most recent annual report on Form 10-K filed with the SEC. You should read this release in conjunction with that annual report onForm 10-K and Walmart's quarterly reports on Form 10-Q and current reports on Form 8-K subsequently filed with the SEC. You should consider all of the risks, uncertainties and other factors identified above and in those SEC reports carefully when evaluating the forward-looking statements in this release. Walmart cannot assure you that the future results reflected in or implied by any such forward-looking statement will be realized or, even if substantially realized, will have the forecast or expected consequences and effects for or onWalmart's operations or financial performance. Such forward-looking statements are made as of the date of this release, and Walmart undertakes no obligation to update such statements to reflect subsequent events or circumstances.
This presentation includes certain non-GAAP financial measures as defined under SEC rules, including net sales, revenue, and operating income on a constant currency basis, Sam's Club comp sales excluding fuel , free cash flow, and return on investment. Refer to Appendix -Non-GAAP Financial Measures for more information about the non-GAAP financial measures contained in this presentation. Additional information as required by Regulation G regarding non-GAAP financial measures can be found in our most recent Form 10-K, Form 10-Q,and our Form 8-K filed as of the date of this presentation with the SEC, which are available at www.stock.walmart.com.
2
Totalcompany
WalmartU.S. comps
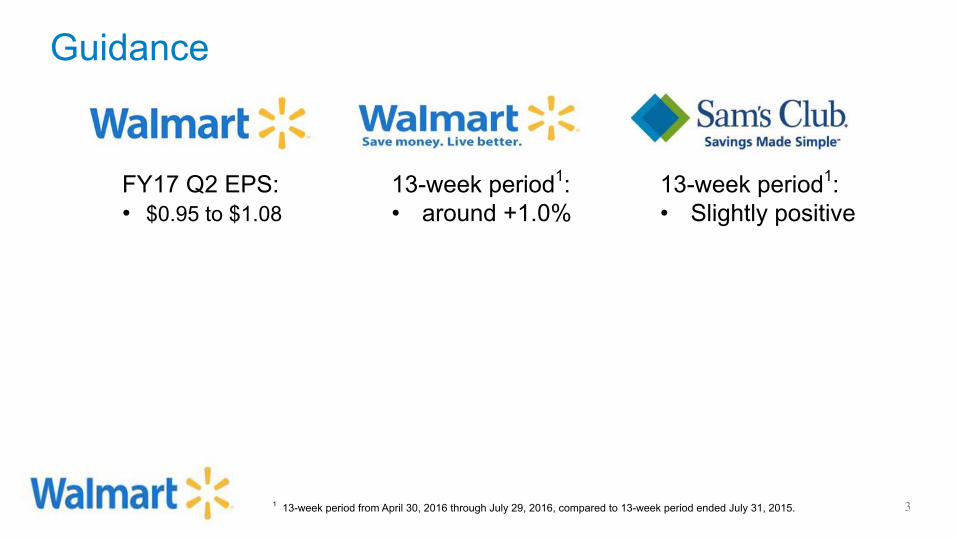
Sam'sClub compsFY17 Q2 EPS:
• $0.95 to $1.08
13-week period1:• around +1.0%
13-week period1:• Slightly positive
1 13-week period from April 30, 2016 through July 29, 2016, compared to 13-week period ended July 31, 2015.
Guidance
3
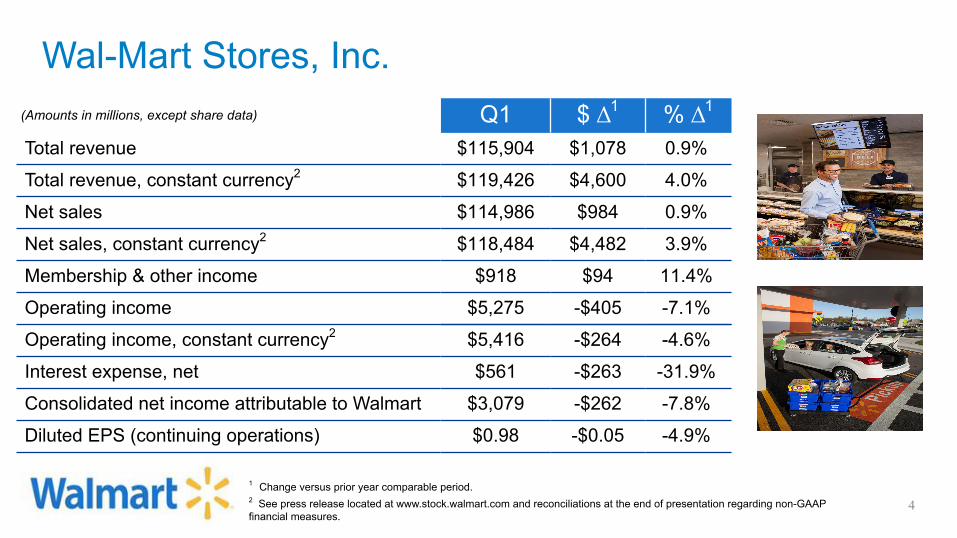
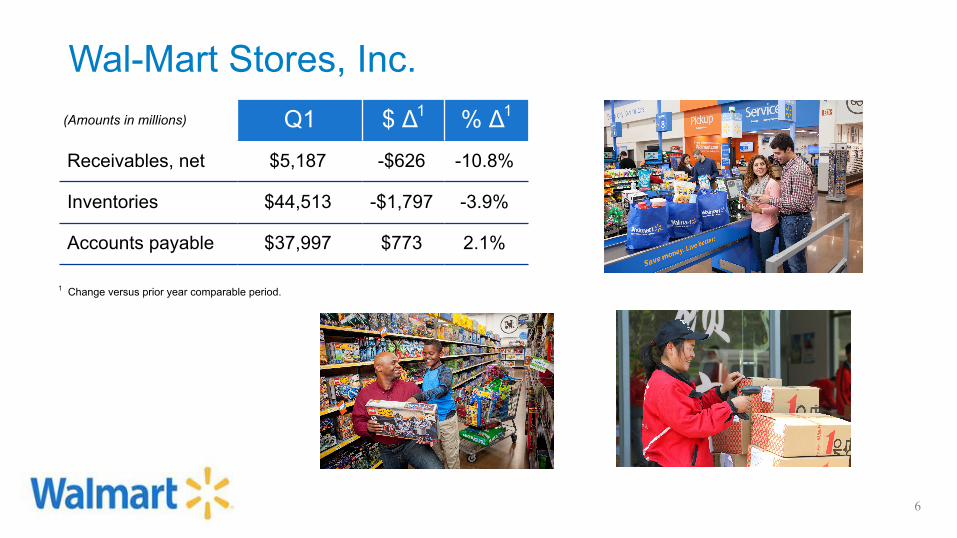
Wal-Mart Stores, Inc.(Amounts in millions, except share data) Q1 $ Δ1 % Δ1
Total revenue $115,904 $1,078 0.9%
Total revenue, constant currency2 $119,426 $4,600 4.0%
Net sales $114,986 $984 0.9%
Net sales, constant currency2 $118,484 $4,482 3.9%
Membership & other income $918 $94 11.4%
Operating income $5,275 -$405 -7.1%
Operating income, constant currency2 $5,416 -$264 -4.6%
Interest expense, net $561 -$263 -31.9%
Consolidated net income attributable to Walmart $3,079 -$262 -7.8%
Diluted EPS (continuing operations) $0.98 -$0.05 -4.9%
1 Change versus prior year comparable period.2 See press release located at www.stock.walmart.com and reconciliations at the end of presentation regarding non-GAAPfinancial measures.
4
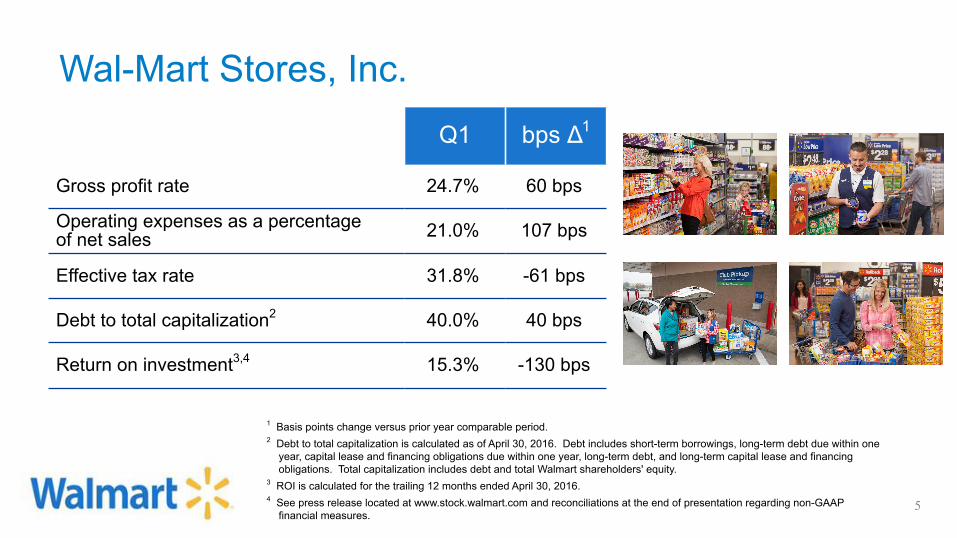
Wal-Mart Stores, Inc.Q1 bps Δ1
Gross profit rate 24.7% 60 bps
Operating expenses as a percentageof net sales 21.0% 107 bps
Effective tax rate 31.8% -61 bps
Debt to total capitalization2 40.0% 40 bps
Return on investment3,4 15.3% -130 bps
1 Basis points change versus prior year comparable period.2 Debt to total capitalization is calculated as of April 30, 2016. Debt includes short-term borrowings, long-term debt due within one
year, capital lease and financing obligations due within one year, long-term debt, and long-term capital lease and financingobligations. Total capitalization includes debt and total Walmart shareholders' equity.
3 ROI is calculated for the trailing 12 months ended April 30, 2016.4 See press release located at www.stock.walmart.com and reconciliations at the end of presentation regarding non-GAAP
financial measures.5
(Amounts in millions) Q1 $ Δ1 % Δ1
Receivables, net $5,187 -$626 -10.8%
Inventories $44,513 -$1,797 -3.9%
Accounts payable $37,997 $773 2.1%
Wal-Mart Stores, Inc.
1 Change versus prior year comparable period.
6
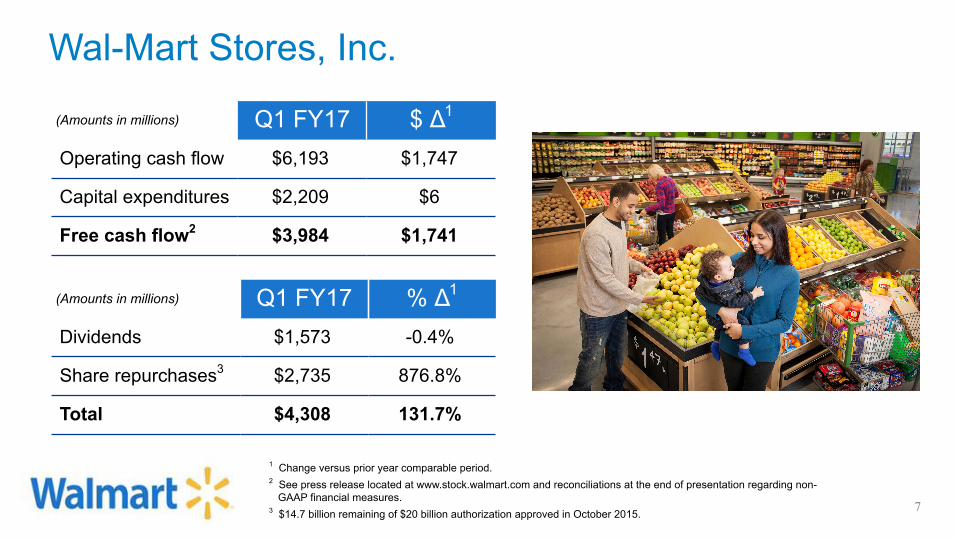
(Amounts in millions) Q1 FY17 $ Δ1
Operating cash flow $6,193 $1,747
Capital expenditures $2,209 $6
Free cash flow2 $3,984 $1,741
(Amounts in millions) Q1 FY17 % Δ1
Dividends $1,573 -0.4%
Share repurchases3 $2,735 876.8%
Total $4,308 131.7%
1 Change versus prior year comparable period. 2 See press release located at www.stock.walmart.com and reconciliations at the end of presentation regarding non-
GAAP financial measures. 3 $14.7 billion remaining of $20 billion authorization approved in October 2015.
Wal-Mart Stores, Inc.
7
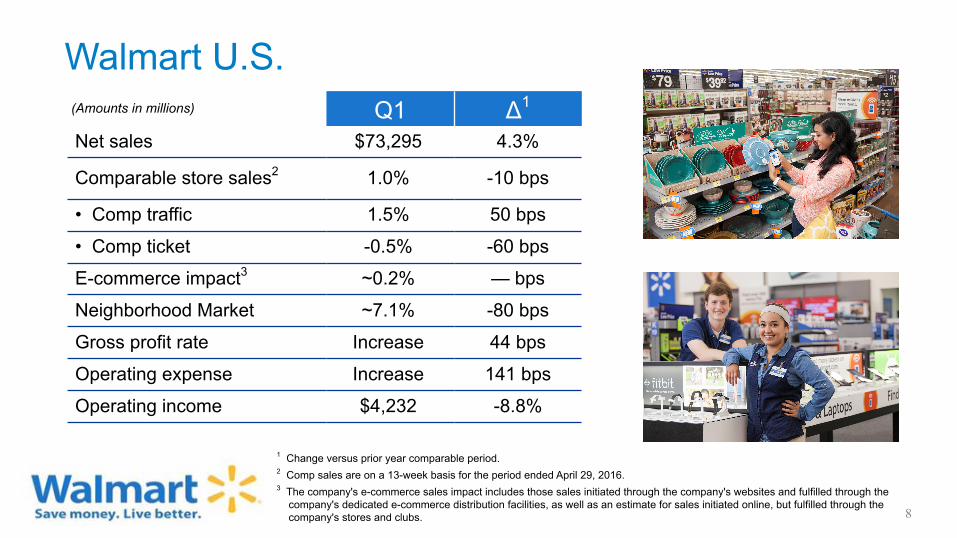
Walmart U.S.(Amounts in millions) Q1 Δ1
Net sales $73,295 4.3%
Comparable store sales2 1.0% -10 bps
• Comp traffic 1.5% 50 bps
• Comp ticket -0.5% -60 bps
E-commerce impact3 ~0.2% — bps
Neighborhood Market ~7.1% -80 bps
Gross profit rate Increase 44 bps
Operating expense Increase 141 bps
Operating income $4,232 -8.8%
1 Change versus prior year comparable period.2 Comp sales are on a 13-week basis for the period ended April 29, 2016. 3 The company's e-commerce sales impact includes those sales initiated through the company's websites and fulfilled through the
company's dedicated e-commerce distribution facilities, as well as an estimate for sales initiated online, but fulfilled through thecompany's stores and clubs. 8
Walmart U.S. - financial highlights
9
Sales• +1% comp sales growth led by comp traffic of +1.5%; 2-year stack basis comp sales +2.1%.• Deflation in food negatively impacted comps by approximately 60 basis points versus last year's Q1 comp.• Strength in health & wellness, apparel, home & seasonal, and hardlines.
Gross Margin• 44 bps growth in gross margin due to improved margin rates in grocery and health & wellness partially offset by a reduced margin
rate in general merchandise, as our continued efforts to improve inventory productivity and drive a better customer experience drovehigher markdowns in the first quarter versus last year.
• Gross margin also benefited from a continued focus on efforts to reduce costs in operating the business and procuring merchandise,improved shrink and lower transportation costs.
Expenses• As expected, expenses increased primarily as a result of initiating the second phase of wage rate increases in February, as well as
investments in technology. Partially offsetting these increases were lower utility & maintenance expenses due to a milder winter.
Inventory• Total inventory declined 3.5%, and comp store inventory declined by 5.7%, while in-stock levels improved.
Format growth• Opened 13 Supercenters (including conversions and relocations) and 20 Neighborhood Markets.• Expanding online grocery to 9 new markets, bringing the total to nearly 40 markets by the end of May.
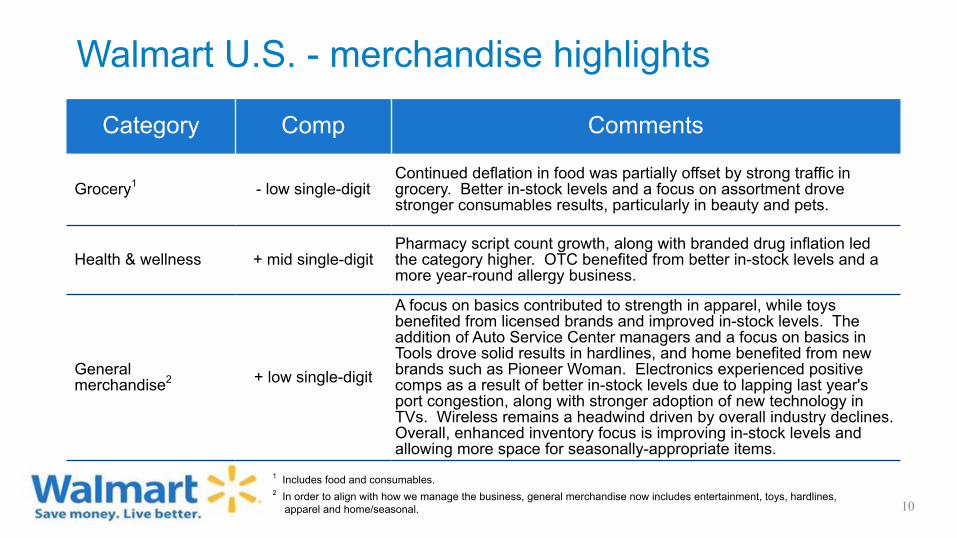
Walmart U.S. - merchandise highlights
Category Comp Comments
Grocery1 - low single-digitContinued deflation in food was partially offset by strong traffic ingrocery. Better in-stock levels and a focus on assortment drovestronger consumables results, particularly in beauty and pets.
Health & wellness + mid single-digitPharmacy script count growth, along with branded drug inflation ledthe category higher. OTC benefited from better in-stock levels and amore year-round allergy business.
Generalmerchandise2 + low single-digit
A focus on basics contributed to strength in apparel, while toysbenefited from licensed brands and improved in-stock levels. Theaddition of Auto Service Center managers and a focus on basics inTools drove solid results in hardlines, and home benefited from newbrands such as Pioneer Woman. Electronics experienced positivecomps as a result of better in-stock levels due to lapping last year'sport congestion, along with stronger adoption of new technology inTVs. Wireless remains a headwind driven by overall industry declines.Overall, enhanced inventory focus is improving in-stock levels andallowing more space for seasonally-appropriate items.
1 Includes food and consumables.2 In order to align with how we manage the business, general merchandise now includes entertainment, toys, hardlines,
apparel and home/seasonal. 10
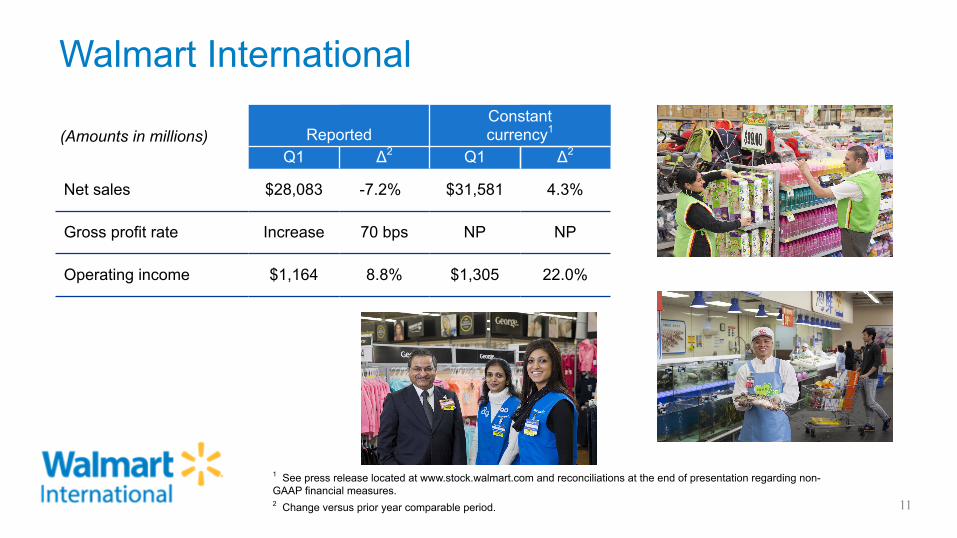
Walmart International
1
(Amounts in millions) ReportedConstantcurrency1
Q1 Δ2 Q1 Δ2
Net sales $28,083 -7.2% $31,581 4.3%
Gross profit rate Increase 70 bps NP NP
Operating income $1,164 8.8% $1,305 22.0%
1 See press release located at www.stock.walmart.com and reconciliations at the end of presentation regarding non-GAAP financial measures.2 Change versus prior year comparable period. 11
Walmart International - financial highlights
12
Sales• Ten of 11 markets had positive comp sales. Nine of 11 markets had comp sales greater than 4%.• Continued strength at Walmex and in Canada.• Currency exchange rate fluctuations negatively impacted net sales by $3.5 billion, but was a bit lower than anticipated.
Operating income• Higher sales, gross profit rate improvement and targeted cost reduction initiatives led to strong growth in operating income
on a constant currency basis, led by Walmex and Canada.
Expenses• We leveraged expenses in the majority of markets as the focus continued on "We Operate for Less" initiatives.
Inventory• A focus on reducing unproductive and obsolete merchandise led to inventory growth that was slower than the growth in net
sales, on a constant currency basis.
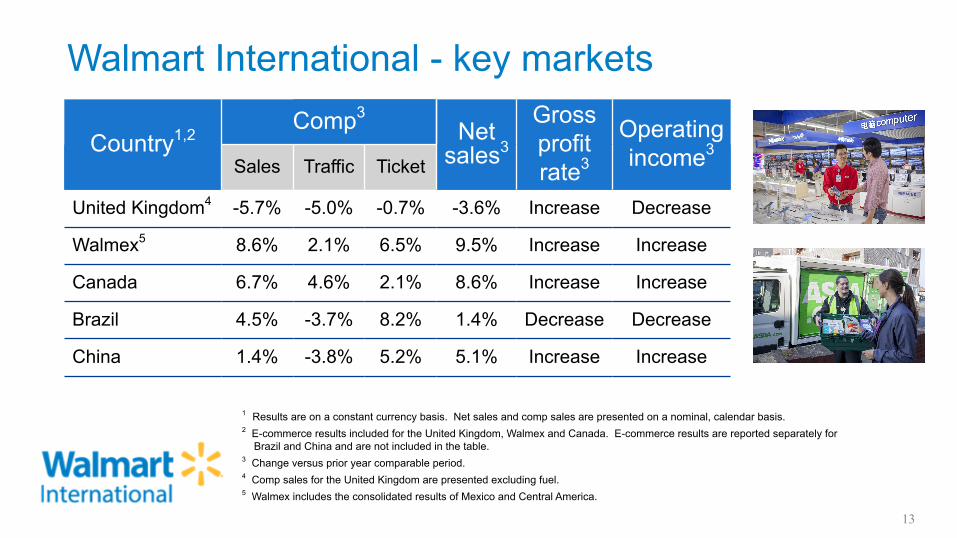
Walmart International - key markets
1 Results are on a constant currency basis. Net sales and comp sales are presented on a nominal, calendar basis.2 E-commerce results included for the United Kingdom, Walmex and Canada. E-commerce results are reported separately for
Brazil and China and are not included in the table.3 Change versus prior year comparable period.4 Comp sales for the United Kingdom are presented excluding fuel.5 Walmex includes the consolidated results of Mexico and Central America.
Country1,2Comp3
Netsales3
Grossprofitrate3
Operatingincome3
Sales Traffic Ticket
United Kingdom4 -5.7% -5.0% -0.7% -3.6% Increase Decrease
Walmex5 8.6% 2.1% 6.5% 9.5% Increase Increase
Canada 6.7% 4.6% 2.1% 8.6% Increase Increase
Brazil 4.5% -3.7% 8.2% 1.4% Decrease Decrease
China 1.4% -3.8% 5.2% 5.1% Increase Increase
13
Walmart International - key market highlights
14
Walmex • Strong sales momentum for Walmex continued across all formats, divisions, countries and regions, led by strong
performances in food and consumables.• Growth in total sales and comp sales significantly outpaced the rest of the self-service market, according to ANTAD.• Sam's Club continued its turnaround with on-going progress in food and consumables, in addition to strong comp sales in
general merchandise and electronics.• Higher gross margins, driven by strong inventory management, reduced clearance and good expense management led to
strong growth in operating income.
Canada• Comp sales were positive for the eighth consecutive quarter. Assortment enhancements led to strong customer traffic. • Gained 100 basis points of market share for the 12-week period ended April 16, according to Nielsen, led by food,
consumables, health & wellness and infant.• E-commerce continues to grow, and the expansion of online grocery to the Toronto metro area is performing well.• Even as e-commerce investments continued, the ability to leverage expenses in the core business led to growth in
operating income that outpaced growth in sales.
Walmart International - key market highlights (cont.)
15
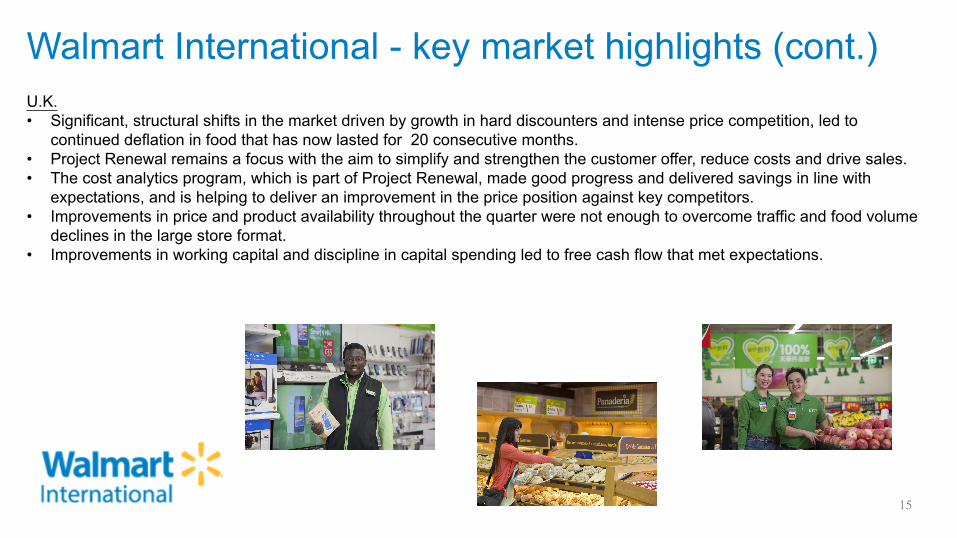
U.K.• Significant, structural shifts in the market driven by growth in hard discounters and intense price competition, led to
continued deflation in food that has now lasted for 20 consecutive months.• Project Renewal remains a focus with the aim to simplify and strengthen the customer offer, reduce costs and drive sales. • The cost analytics program, which is part of Project Renewal, made good progress and delivered savings in line with
expectations, and is helping to deliver an improvement in the price position against key competitors. • Improvements in price and product availability throughout the quarter were not enough to overcome traffic and food volume
declines in the large store format.• Improvements in working capital and discipline in capital spending led to free cash flow that met expectations.
Walmart International - key market highlights (cont.)China• Good overall results despite challenging macro-economic environment.• A strong performance during Chinese New Year, double-digit growth in gift card loading and continued strengthening in the
fresh category led to good sales growth and positive comps.• "We Operate for Less" initiatives continued to deliver results. Through store and DC productivity improvements, expenses
grew at a slower rate than sales.• The online grocery service is now in three additional cities, and the cross border e-commerce pilot "Walmart Global Shop"
expanded and provides customers with access to a limited selection of trusted imported items and brands.
Brazil• High inflation contributed to an economic environment that continues to be challenging.• Strong performance in the wholesale business led to sales growth and the closure of unprofitable stores led to solid comp
sales.
16
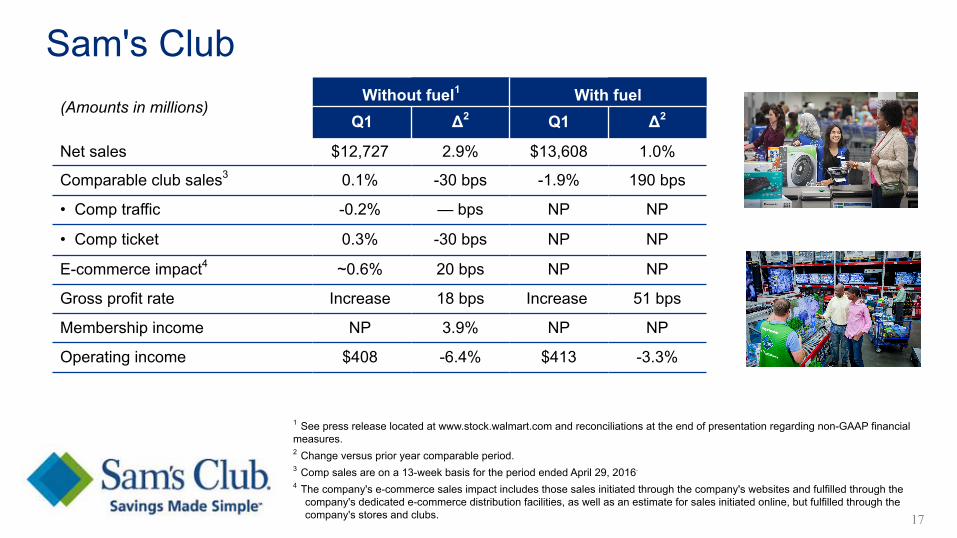
Sam's Club(Amounts in millions)
Without fuel1 With fuelQ1 Δ2 Q1 Δ2
Net sales $12,727 2.9% $13,608 1.0%
Comparable club sales3 0.1% -30 bps -1.9% 190 bps
• Comp traffic -0.2% — bps NP NP
• Comp ticket 0.3% -30 bps NP NP
E-commerce impact4 ~0.6% 20 bps NP NP
Gross profit rate Increase 18 bps Increase 51 bps
Membership income NP 3.9% NP NP
Operating income $408 -6.4% $413 -3.3%
1 See press release located at www.stock.walmart.com and reconciliations at the end of presentation regarding non-GAAP financialmeasures.2 Change versus prior year comparable period.3 Comp sales are on a 13-week basis for the period ended April 29, 2016.
4 The company's e-commerce sales impact includes those sales initiated through the company's websites and fulfilled through thecompany's dedicated e-commerce distribution facilities, as well as an estimate for sales initiated online, but fulfilled through thecompany's stores and clubs. 17
Sam's Club - financial highlights
18
Sales• Comp sales1 were in-line with guidance at +0.1%. Deflation negatively impacted comp sales by approximately 50 basis points
versus last year's Q1 comp. • E-commerce contributed approximately 60 basis points to comp sales.
◦ Club Pickup sales grew more than 30% and represents the fastest growing piece of the business.◦ Continued strong growth in direct-to-home sales.
Gross Margin1
• Investments in membership value continued through price and cash rewards. Despite these investments, gross profit rateincreased 18 basis points over last year.
Expenses1
• Operating expenses deleveraged during the quarter as investments in people and technology continued.
Membership Income• Membership income grew 3.9% over last year. • Plus Member renewals increased more than 30% for the quarter, and Plus penetration was near an all-time high.• Members continued to recognize the value that Sam's Club provides. Member benefits from the 5/3/1 credit card increased more
than 50% over last year.
Inventory• Inventory grew at a rate slower than sales growth at 50 basis points despite strategic purchases in key categories.
1Excluding fuel. See press release located at www.stock.walmart.com and reconciliations at the end of presentationregarding non-GAAP financial measures.
Sam's Club - category highlights
19
Category Comp Comments
Fresh / Freezer / Cooler - low single-digitDeflationary trends continued in fresh meat and dairy. Discipline inassortment changes and slower business member traffic pressured frozenfoods. Improved availability in key items led to strong results in produce.
Grocery and beverage + low single-digitDry grocery was negatively impacted by deflation in key categories. Strongfeature activity and new item launches from the prior year pressuredcomparisons. Improved value from the expansion of private label producedgood results especially in juice, water and sports drinks.
Consumables + low single-digit Product innovation and private label expansion benefited key areasincluding laundry, home care and paper goods.
Home and apparel + low single-digitStrong item merchandising in apparel, especially children's apparel, kitchenelectronics and home improvement delivered good results. Weaknesscontinued in tire and battery.
Technology, office andentertainment - mid single-digit The reallocation of space in music and movies, along with challenges in
wireless installment plans pressured the category.
Health and wellness + mid single-digitRX benefited from growth in script counts and the Free/4/10 Plus benefitprogram. Improved pricing and assortment led to strong performance inOTC.
Third party FCPA and compliance-related expenses
Q1(Amounts in millions) FY17 FY16Ongoing inquiries and investigations $21 $25
Global compliance program and organizational enhancements $4 $8
Total $25 $33
• In fiscal year 2017, we expect our third party FCPA-related expenses to range between $100 and $120 million. Recall that theseare included in our Corporate and support expenses.
20
Non-GAAP measures - ROIManagement believes return on investment (ROI) is a meaningful metric to share with investors because it helps investors assess how effectivelyWalmart is deploying its assets. Trends in ROI can fluctuate over time as management balances long-term potential strategic initiatives withpossible short-term impacts.
ROI was 15.3 percent and 16.6 percent for the trailing 12 months ended April 30, 2016 and 2015, respectively. The decline in ROI was primarilydue to our decrease in operating income.
We define ROI as adjusted operating income (operating income plus interest income, depreciation and amortization, and rent expense) for thetrailing 12 months divided by average invested capital during that period. We consider average invested capital to be the average of ourbeginning and ending total assets, plus average accumulated depreciation and average amortization, less average accounts payable and averageaccrued liabilities for that period, plus a rent factor equal to the rent for the fiscal year or trailing 12 months multiplied by a factor of 8. When wehave discontinued operations, we exclude the impact of the discontinued operations.
Our calculation of ROI is considered a non-GAAP financial measure because we calculate ROI using financial measures that exclude and includeamounts that are included and excluded in the most directly comparable GAAP financial measure. For example, we exclude the impact ofdepreciation and amortization from our reported operating income in calculating the numerator of our calculation of ROI. In addition, we include afactor of 8 for rent expense that estimates the hypothetical capitalization of our operating leases. We consider return on assets (ROA) to be thefinancial measure computed in accordance with generally accepted accounting principles (GAAP) most directly comparable to our calculation ofROI. ROI differs from ROA (which is consolidated net income for the period divided by average total assets for the period) because ROI: adjustsoperating income to exclude certain expense items and adds interest income; adjusts total assets for the impact of accumulated depreciation andamortization, accounts payable and accrued liabilities; and incorporates a factor of rent to arrive at total invested capital. Because of theadjustments mentioned above, we believe ROI more accurately measures how we are deploying our key assets and is more meaningful toinvestors than ROA.
Although ROI is a standard financial metric, numerous methods exist for calculating a company's ROI. As a result, the method used bymanagement to calculate our ROI may differ from the methods used by other companies to calculate their ROI.
21
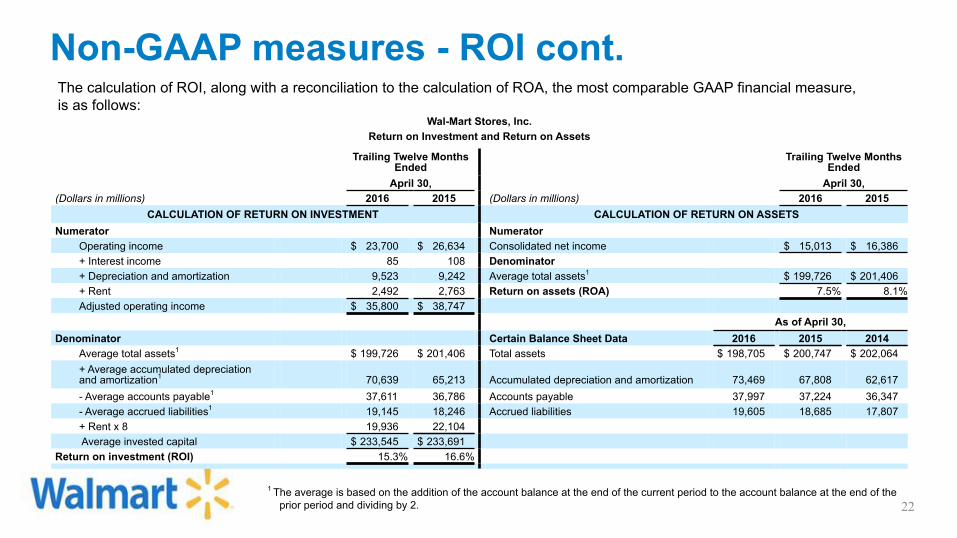
Non-GAAP measures - ROI cont.The calculation of ROI, along with a reconciliation to the calculation of ROA, the most comparable GAAP financial measure,is as follows:
Wal-Mart Stores, Inc.Return on Investment and Return on Assets
Trailing Twelve MonthsEnded
Trailing Twelve MonthsEnded
April 30, April 30,(Dollars in millions) 2016 2015 (Dollars in millions) 2016 2015
CALCULATION OF RETURN ON INVESTMENT CALCULATION OF RETURN ON ASSETSNumerator Numerator
Operating income $ 23,700 $ 26,634 Consolidated net income $ 15,013 $ 16,386+ Interest income 85 108 Denominator+ Depreciation and amortization 9,523 9,242 Average total assets1 $ 199,726 $ 201,406+ Rent 2,492 2,763 Return on assets (ROA) 7.5% 8.1%Adjusted operating income $ 35,800 $ 38,747
As of April 30,Denominator Certain Balance Sheet Data 2016 2015 2014
Average total assets1 $ 199,726 $ 201,406 Total assets $ 198,705 $ 200,747 $ 202,064+ Average accumulated depreciationand amortization1 70,639 65,213 Accumulated depreciation and amortization 73,469 67,808 62,617- Average accounts payable1 37,611 36,786 Accounts payable 37,997 37,224 36,347- Average accrued liabilities1 19,145 18,246 Accrued liabilities 19,605 18,685 17,807+ Rent x 8 19,936 22,104 Average invested capital $ 233,545 $ 233,691
Return on investment (ROI) 15.3% 16.6%
1 The average is based on the addition of the account balance at the end of the current period to the account balance at the end of theprior period and dividing by 2. 22
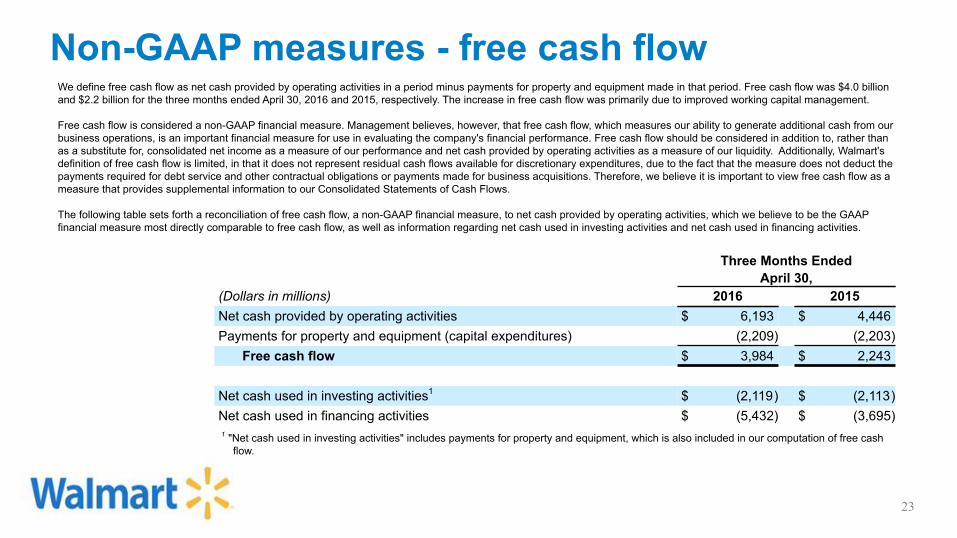
Non-GAAP measures - free cash flowWe define free cash flow as net cash provided by operating activities in a period minus payments for property and equipment made in that period. Free cash flow was $4.0 billionand $2.2 billion for the three months ended April 30, 2016 and 2015, respectively. The increase in free cash flow was primarily due to improved working capital management.
Free cash flow is considered a non-GAAP financial measure. Management believes, however, that free cash flow, which measures our ability to generate additional cash from ourbusiness operations, is an important financial measure for use in evaluating the company's financial performance. Free cash flow should be considered in addition to, rather thanas a substitute for, consolidated net income as a measure of our performance and net cash provided by operating activities as a measure of our liquidity. Additionally, Walmart'sdefinition of free cash flow is limited, in that it does not represent residual cash flows available for discretionary expenditures, due to the fact that the measure does not deduct thepayments required for debt service and other contractual obligations or payments made for business acquisitions. Therefore, we believe it is important to view free cash flow as ameasure that provides supplemental information to our Consolidated Statements of Cash Flows.
The following table sets forth a reconciliation of free cash flow, a non-GAAP financial measure, to net cash provided by operating activities, which we believe to be the GAAPfinancial measure most directly comparable to free cash flow, as well as information regarding net cash used in investing activities and net cash used in financing activities.
Three Months EndedApril 30,
(Dollars in millions) 2016 2015Net cash provided by operating activities $ 6,193 $ 4,446Payments for property and equipment (capital expenditures) (2,209) (2,203)
Free cash flow $ 3,984 $ 2,243
Net cash used in investing activities1 $ (2,119) $ (2,113)Net cash used in financing activities $ (5,432) $ (3,695)1 "Net cash used in investing activities" includes payments for property and equipment, which is also included in our computation of free cash
flow.
23
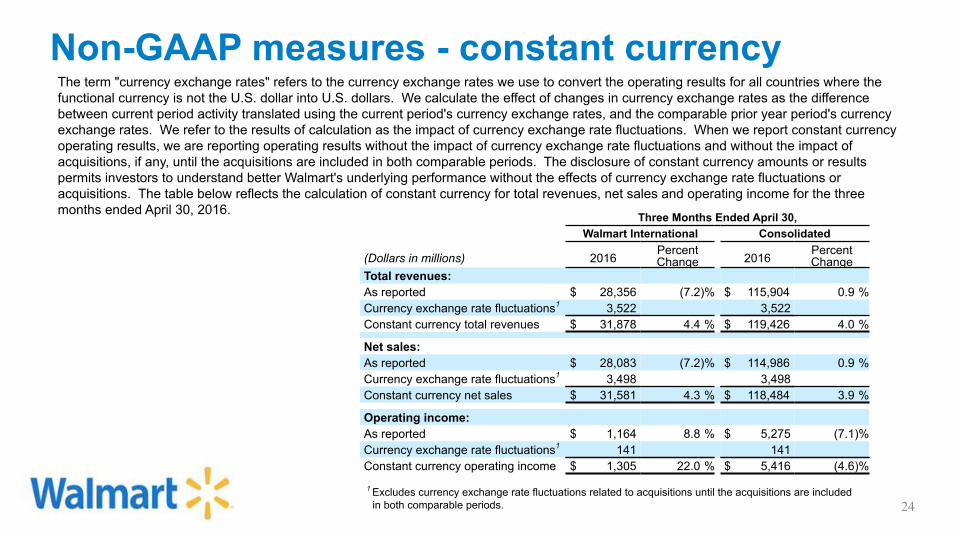
Non-GAAP measures - constant currencyThe term "currency exchange rates" refers to the currency exchange rates we use to convert the operating results for all countries where thefunctional currency is not the U.S. dollar into U.S. dollars. We calculate the effect of changes in currency exchange rates as the differencebetween current period activity translated using the current period's currency exchange rates, and the comparable prior year period's currencyexchange rates. We refer to the results of calculation as the impact of currency exchange rate fluctuations. When we report constant currencyoperating results, we are reporting operating results without the impact of currency exchange rate fluctuations and without the impact ofacquisitions, if any, until the acquisitions are included in both comparable periods. The disclosure of constant currency amounts or resultspermits investors to understand better Walmart's underlying performance without the effects of currency exchange rate fluctuations oracquisitions. The table below reflects the calculation of constant currency for total revenues, net sales and operating income for the threemonths ended April 30, 2016. Three Months Ended April 30,
Walmart International Consolidated
(Dollars in millions) 2016PercentChange 2016
PercentChange
Total revenues:As reported $ 28,356 (7.2)% $ 115,904 0.9 %Currency exchange rate fluctuations1 3,522 3,522Constant currency total revenues $ 31,878 4.4 % $ 119,426 4.0 %
Net sales:As reported $ 28,083 (7.2)% $ 114,986 0.9 %Currency exchange rate fluctuations1 3,498 3,498Constant currency net sales $ 31,581 4.3 % $ 118,484 3.9 %
Operating income:As reported $ 1,164 8.8 % $ 5,275 (7.1)%Currency exchange rate fluctuations1 141 141Constant currency operating income $ 1,305 22.0 % $ 5,416 (4.6)%
1 Excludes currency exchange rate fluctuations related to acquisitions until the acquisitions are includedin both comparable periods. 24
Non-GAAP measures - fuel impact
The net sales and operating income of Sam's Club for the quarter ended April 30, 2016, the percentage changes in thosefinancial measures from the prior year period, Sam’s Club’s comparable club sales for the 13-week period ended April 29,2016 and Sam's Club's projected comparable club sales for the 13-week period ending July 29, 2016, in each casecalculated by excluding Sam's Club's fuel sales for such periods, are non-GAAP financial measures. We believe the Sam'sClub net sales and operating income for the quarter ended April 30, 2016, the percentage changes in those financialmeasures from the prior year period, Sam’s Club’s comparable club sales for the 13-week period ended April 29, 2016, andSam’s Club’s projected fuel sales for the 13-week period ending July 31, 2016, in each case calculated by including Sam’sClub’s fuel sales for such period, are, respectively, the financial measures computed in accordance with GAAP most directlycomparable to the non-GAAP financial measures described above. We believe that the presentation of the non-GAAP financial measures with respect to Sam’s Club described above providesuseful information to investors regarding Walmart’s financial condition and results of operations because that informationpermits investors to understand the effect of the fuel sales of Sam's Club, which are affected by the volatility of fuel prices, onSam's Club's net sales and operating income and on Sam’s Club’s comparable club sales for the periods presented.
25
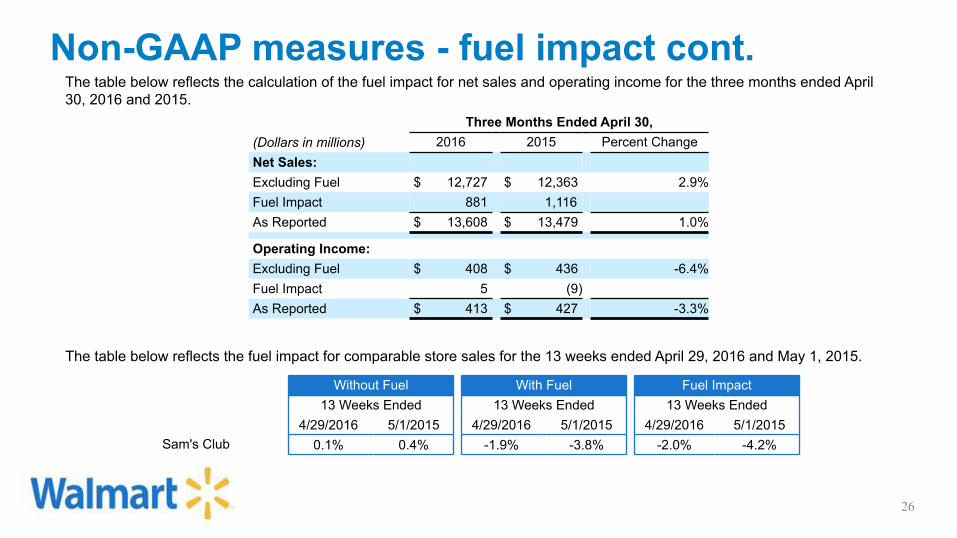
Non-GAAP measures - fuel impact cont.The table below reflects the calculation of the fuel impact for net sales and operating income for the three months ended April30, 2016 and 2015.
Three Months Ended April 30,(Dollars in millions) 2016 2015 Percent ChangeNet Sales:Excluding Fuel $ 12,727 $ 12,363 2.9%Fuel Impact 881 1,116As Reported $ 13,608 $ 13,479 1.0%
Operating Income:Excluding Fuel $ 408 $ 436 -6.4%Fuel Impact 5 (9)As Reported $ 413 $ 427 -3.3%
The table below reflects the fuel impact for comparable store sales for the 13 weeks ended April 29, 2016 and May 1, 2015.
Without Fuel With Fuel Fuel Impact13 Weeks Ended 13 Weeks Ended 13 Weeks Ended
4/29/2016 5/1/2015 4/29/2016 5/1/2015 4/29/2016 5/1/2015Sam's Club 0.1% 0.4% -1.9% -3.8% -2.0% -4.2%
26
• Additional information related to reconciliations for our non-GAAP financial measures (ROI, free cash flow, constantcurrency and Sam’s Club comparable measures)
• Unit counts & square footage• Comparable store sales• Terminology• FY 17 earnings dates
Additional resources at stock.walmart.com
27
![arXivAsymptotics of orthogonal polynomials for a weight with a jump on [ 1;1] A. Foulqui e Moreno, A. Mart nez-Finkelshtein, and V.L. Sousa …](https://static.fdocument.org/doc/165x107/5f7026728d0e116a257fdca0/arxiv-asymptotics-of-orthogonal-polynomials-for-a-weight-with-a-jump-on-11-a.jpg)


![arXiv:1710.05952v1 [math.CV] 16 Oct 2017arXiv:1710.05952v1 [math.CV] 16 Oct 2017 ON THE HARMONIC MOBIUS TRANSFORMATIONS¨ RODRIGO HERNANDEZ AND MAR´ ´IA J. MART´IN Abstract. It](https://static.fdocument.org/doc/165x107/600acf5f4de65952f3589589/arxiv171005952v1-mathcv-16-oct-2017-arxiv171005952v1-mathcv-16-oct-2017.jpg)