Voltage-gated calcium channels: Novel targets for cancer ...
16
ONCOLOGY LETTERS 14: 2059-2074, 2017 Abstract. Voltage-gated calcium channels (VGCCs) comprise five subtypes: The L-type; R-type; N-type; P/Q-type; and T-type, which are encoded by α 1 subunit genes. Calcium ion channels also have confirmed roles in cellular functions, including mitogenesis, proliferation, differentiation, apoptosis and metastasis. An association between VGCCs, a reduction in proliferation and an increase in apoptosis in prostate cancer cells has also been reported. Therefore, in the present study, the online clinical database Oncomine was used to identify the alterations in the mRNA expression level of VGCCs in 19 cancer subtypes. Overall, VGCC family genes exhibited under-expression in numerous types of cancer, including brain, breast, kidney and lung cancers. Notably, the majority of VGCC family members (CACNA1C, CACNA1D, CACNA1A, CACNA1B, CACNA1E, CACNA1H and CACNA1I) exhib- ited low expression in brain tumors, with mRNA expression levels in the top 1-9% of downregulated gene rankings. A total of 5 VGCC family members (CACNA1A, CACNA1B, CACNA1E, CACNA1G and CACNA1I) were under-expressed in breast cancer, with a gene ranking in the top 1-10% of the low-expressed genes compared with normal tissue. In kidney and lung cancers, CACNA1S, CACNA1C, CACNA1D, CACNA1A and CACNA1H exhibited low expression, with gene rankings in the top 1-8% of downregulated genes. In conclusion, the present findings may contribute to the develop- ment of new cancer treatment approaches by identifying target genes involved in specific types of cancer. Introduction Conventional studies on ion channels have primarily focused on the crucial roles these channels perform in excitatory cell types, including neurons, cardiomyocytes and secretory cells (1). The roles of ion channels in various cell functions, including mitogenesis, cell proliferation, differentiation, apoptosis and metastasis are now well recognized (2-4). The expression of ion channel transcripts has been highlighted as a potential biomarker of certain types of cancer, including pros- tate cancer and breast cancer (5-8). Therefore, the investigation of the functional roles of ion channels in cancer development may identify novel approaches for tumor prognosis (9,10). Calcium channels may be generally categorized into two major classes: Voltage-gated calcium channels (VGCCs) and ligand-gated calcium channels (LGCCs). VGCCs may be classified into five subtypes: L‑type ( 10,11); N-Type (12); P-type (13-15); T-type (16-18); and R-type (19,20). These ion channels have been implicated in the progression of numerous cancers. Members of the LGCC class, namely the inositol trisphosphate receptor (21) and ryanodine (22), are also well documented to regulate certain processes occurring during cancer metastasis. The role of calcium has been well documented in numerous cellular processes, including cell proliferation and inhibition and activation of various intracellular enzymes (23-25). The effect of calcium on these processes varies by location, extent and calcium homeostasis stage (26,27). The transcript levels of calcium channels may cause different domino effects on specific cell functions, as well as on cell proliferation, motility or even cell apoptosis (28). The recessive inheritance pattern of tumor suppressor genes presents the greatest challenge in their identification. Another challenge is the diversity of their action mechanisms, which Voltage-gated calcium channels: Novel targets for cancer therapy NAM NHUT PHAN 1* , CHIH-YANG WANG 2-4* , CHIEN-FU CHEN 5 , ZHENGDA SUN 6 , MING-DERG LAI 2,3 and YEN-CHANG LIN 7 1 Faculty of Applied Sciences, Ton Duc Thang University, Tan Phong Ward, Ho Chi Minh 700000, Vietnam; 2 Institute of Basic Medical Sciences; 3 Department of Biochemistry and Molecular Biology, College of Medicine, National Cheng Kung University, Tainan 70101, Taiwan, R.O.C.; 4 Department of Anatomy, University of California, San Francisco, CA 94143, USA; 5 School of Chinese Medicine for Post-Baccalaureate, I-Shou University, Kaohsiung 84001, Taiwan, R.O.C.; 6 Department of Radiology, University of California, San Francisco, CA 94143, USA; 7 Graduate Institute of Biotechnology, Chinese Culture University, Taipei 1114, Taiwan, R.O.C. Received February 14, 2016; Accepted April 13, 2017 DOI: 10.3892/ol.2017.6457 Correspondence to: Dr Ming-Derg Lai, Department of Biochemistry and Molecular Biology, College of Medicine, National Cheng Kung University, 1 Daxue Road, Tainan 70101, Taiwan, R.O.C. E-mail: [email protected] Dr Yen-Chang Lin, Graduate Institute of Biotechnology, Chinese Culture University, 55 Hwa-Kang Road, Taipei 1114, Taiwan, R.O.C E-mail: [email protected] * Contributed equally Key words: voltage-gated calcium channels, cancer, under-expression, potential biomarker, meta-analysis, Oncomine
Transcript of Voltage-gated calcium channels: Novel targets for cancer ...
ONCOLOGY LETTERS 14: 2059-2074, 2017
Abstract. Voltage-gated calcium channels (VGCCs) comprise five subtypes: The L-type; R-type; N-type; P/Q-type; and T-type, which are encoded by α1 subunit genes. Calcium ion channels also have confirmed roles in cellular functions, including mitogenesis, proliferation, differentiation, apoptosis and metastasis. An association between VGCCs, a reduction in proliferation and an increase in apoptosis in prostate cancer cells has also been reported. Therefore, in the present study, the online clinical database Oncomine was used to identify the alterations in the mRNA expression level of VGCCs in 19 cancer subtypes. Overall, VGCC family genes exhibited under-expression in numerous types of cancer, including brain, breast, kidney and lung cancers. Notably, the majority of VGCC family members (CACNA1C, CACNA1D, CACNA1A, CACNA1B, CACNA1E, CACNA1H and CACNA1I) exhib-ited low expression in brain tumors, with mRNA expression levels in the top 1-9% of downregulated gene rankings. A total of 5 VGCC family members (CACNA1A, CACNA1B, CACNA1E, CACNA1G and CACNA1I) were under-expressed in breast cancer, with a gene ranking in the top 1-10% of the low-expressed genes compared with normal tissue. In kidney and lung cancers, CACNA1S, CACNA1C, CACNA1D,
CACNA1A and CACNA1H exhibited low expression, with gene rankings in the top 1-8% of downregulated genes. In conclusion, the present findings may contribute to the develop-ment of new cancer treatment approaches by identifying target genes involved in specific types of cancer.
Introduction
Conventional studies on ion channels have primarily focused on the crucial roles these channels perform in excitatory cell types, including neurons, cardiomyocytes and secretory cells (1). The roles of ion channels in various cell functions, including mitogenesis, cell proliferation, differentiation, apoptosis and metastasis are now well recognized (2-4). The expression of ion channel transcripts has been highlighted as a potential biomarker of certain types of cancer, including pros-tate cancer and breast cancer (5-8). Therefore, the investigation of the functional roles of ion channels in cancer development may identify novel approaches for tumor prognosis (9,10).
Calcium channels may be generally categorized into two major classes: Voltage-gated calcium channels (VGCCs) and ligand-gated calcium channels (LGCCs). VGCCs may be classified into five subtypes: L‑type (10,11); N-Type (12); P-type (13-15); T-type (16-18); and R-type (19,20). These ion channels have been implicated in the progression of numerous cancers. Members of the LGCC class, namely the inositol trisphosphate receptor (21) and ryanodine (22), are also well documented to regulate certain processes occurring during cancer metastasis.
The role of calcium has been well documented in numerous cellular processes, including cell proliferation and inhibition and activation of various intracellular enzymes (23-25). The effect of calcium on these processes varies by location, extent and calcium homeostasis stage (26,27). The transcript levels of calcium channels may cause different domino effects on specific cell functions, as well as on cell proliferation, motility or even cell apoptosis (28).
The recessive inheritance pattern of tumor suppressor genes presents the greatest challenge in their identification. Another challenge is the diversity of their action mechanisms, which
Voltage-gated calcium channels: Novel targets for cancer therapyNAM NHUT PHAN1*, CHIH-YANG WANG2-4*, CHIEN-FU CHEN5,
ZHENGDA SUN6, MING-DERG LAI2,3 and YEN-CHANG LIN7
1Faculty of Applied Sciences, Ton Duc Thang University, Tan Phong Ward, Ho Chi Minh 700000, Vietnam; 2Institute of Basic Medical Sciences; 3Department of Biochemistry and Molecular Biology, College of Medicine, National Cheng
Kung University, Tainan 70101, Taiwan, R.O.C.; 4Department of Anatomy, University of California, San Francisco, CA 94143, USA; 5School of Chinese Medicine for Post-Baccalaureate, I-Shou University, Kaohsiung 84001,
Taiwan, R.O.C.; 6Department of Radiology, University of California, San Francisco, CA 94143, USA; 7Graduate Institute of Biotechnology, Chinese Culture University, Taipei 1114, Taiwan, R.O.C.
Received February 14, 2016; Accepted April 13, 2017
DOI: 10.3892/ol.2017.6457
Correspondence to: Dr Ming-Derg Lai, Department of Biochemistry and Molecular Biology, College of Medicine, National Cheng Kung University, 1 Daxue Road, Tainan 70101, Taiwan, R.O.C.E-mail: [email protected]
Dr Yen-Chang Lin, Graduate Institute of Biotechnology, Chinese Culture University, 55 Hwa-Kang Road, Taipei 1114, Taiwan, R.O.CE-mail: [email protected]
*Contributed equally
Key words: voltage-gated calcium channels, cancer, under-expression, potential biomarker, meta-analysis, Oncomine
PHAN et al: EXPRESSION OF VOLTAGE-GATED CALCIUM CHANNELS IN CANCER2060
range from variations in structure and copy number to epigen-etic changes and single base modifications. In addition, the molecular mechanism of action of a tumor suppressor gene may change depending on the tumor type. These variations affect the abnormal activation of oncogenes and/or the inactivation of tumor suppressor genes, resulting in tumor formation and development.
Expression levels of genes are currently recognized as potential biological markers (29-32). The recent publication of a public database (Oncomine; www.oncomine.org) containing mRNA expression profiles for various cancers has now led to the supply of a prodigious number of datasets, which may improve the identification of critical biomarkers in cancers and assist the development of improved molecular signatures, once in full operation (33,34). However, tumor suppressor genes tend to exhibit low or reduced expression in tumor tissue compared with normal tissue. A previous study specifically evaluated a tumor suppressor gene in breast cancer datasets from the Oncomine database and observed significant down-regulation and low expression of the tumor suppressor gene ADAM metallopeptidase with thrombospondin type 1 motif 1 in breast carcinomas, when compared with normal tissue (35). Another study revealed that the expression of sirtuin-3 (SIRT3), a mitochondria-localized tumor suppressor, was decreased in breast tumors relative to normal type-matched tissue. SIRT3 induced destabilization of hypoxia-inducible factor-1α, whereas knockdown of SIRT3 increased cancer cell growth and angiogenesis (36). The SIRT3 gene also exhibited lower expression in various tumor types, including clear cell hepatocellular, head and neck squamous cell, glioblastoma multiforme, testicular and prostate cancers (37).
VGCCs are likely to be possible targets for future clinical cancer treatments. The blockage of T-type calcium channels in HCT116 cells was shown to inhibit cell development and promote apoptosis (38). The T-type calcium channel also confers anti-proliferative properties in malignant tumor cells (39). Cells that highly express the majority of types of calcium channels are significantly reduced in their prolif-eration capabilities (40). The calcium voltage-gated channel subunit α1 G (CACNA1G; Cav3.1) gene, a T-type α subunit of a calcium channel, has been studied in colorectal cancer for its involvement in methylation and silencing. CACNA1G is also considered a potential tumor suppressor gene, which may reduce the effects of hypermethylation of CpG islands, thereby attenuating cancer development (41). Another study reported an association between the CACNA1G gene, a reduc-tion in proliferation and an increase in apoptosis in prostate cancer cells. However, the molecular mechanisms of the role of calcium channels as tumor suppressors remain unclear and require additional study (42).
The authors of the present study previously performed a meta-analysis on public microarray datasets and demonstrated the existence of voltage-gated calcium gene signatures in patients with cancer (43). However, compared with normal tissue, certain VGCC family genes exhibited low expression in tumor tissue. In addition, at present, the way in which VGCC family genes function as tumor suppressors in cancer develop-ment remains largely unknown. To the best of our knowledge, the present study is the first exploration of the reduced expression of VGCC genes in cancer development, and the
present findings indicated that VGCC genes may be prospec-tive targets for cancer treatment. Based on bioinformatics screening, the under-expression of VGCCs at the mRNA level has raised the question of their possible association with the development and progression of cancer. This potential asso-ciation between VGCCs and cancer was investigated using Oncomine, a clinical online microarray database (44). The aim of the present study was to examine the expression of VGCC genes in various types and subtypes of cancer, and to identify critical indicators supporting prospective research on the role of VGCC channels in cancer onset and progression.
Materials and methods
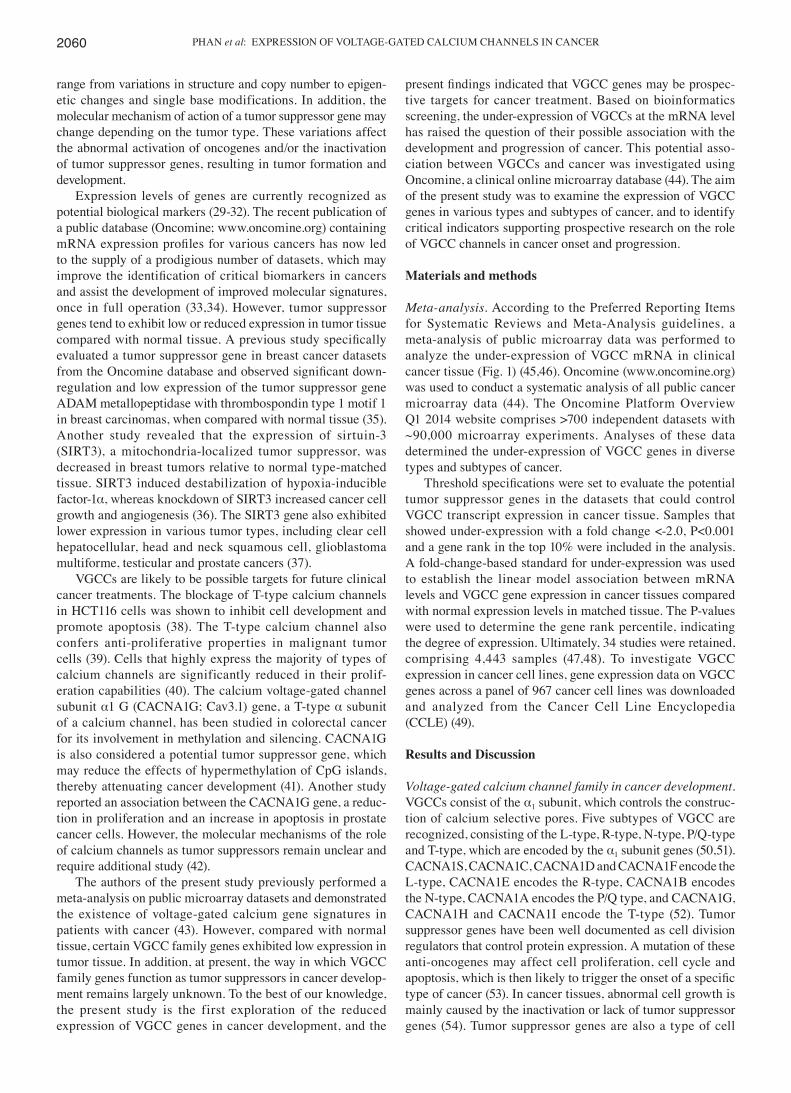
Meta‑analysis. According to the Preferred Reporting Items for Systematic Reviews and Meta-Analysis guidelines, a meta-analysis of public microarray data was performed to analyze the under-expression of VGCC mRNA in clinical cancer tissue (Fig. 1) (45,46). Oncomine (www.oncomine.org) was used to conduct a systematic analysis of all public cancer microarray data (44). The Oncomine Platform Overview Q1 2014 website comprises >700 independent datasets with ~90,000 microarray experiments. Analyses of these data determined the under-expression of VGCC genes in diverse types and subtypes of cancer.
Threshold specifications were set to evaluate the potential tumor suppressor genes in the datasets that could control VGCC transcript expression in cancer tissue. Samples that showed under-expression with a fold change <-2.0, P<0.001 and a gene rank in the top 10% were included in the analysis. A fold-change-based standard for under-expression was used to establish the linear model association between mRNA levels and VGCC gene expression in cancer tissues compared with normal expression levels in matched tissue. The P-values were used to determine the gene rank percentile, indicating the degree of expression. Ultimately, 34 studies were retained, comprising 4,443 samples (47,48). To investigate VGCC expression in cancer cell lines, gene expression data on VGCC genes across a panel of 967 cancer cell lines was downloaded and analyzed from the Cancer Cell Line Encyclopedia (CCLE) (49).
Results and Discussion
Voltage‑gated calcium channel family in cancer development. VGCCs consist of the α1 subunit, which controls the construc-tion of calcium selective pores. Five subtypes of VGCC are recognized, consisting of the L-type, R-type, N-type, P/Q-type and T-type, which are encoded by the α1 subunit genes (50,51). CACNA1S, CACNA1C, CACNA1D and CACNA1F encode the L-type, CACNA1E encodes the R-type, CACNA1B encodes the N-type, CACNA1A encodes the P/Q type, and CACNA1G, CACNA1H and CACNA1I encode the T-type (52). Tumor suppressor genes have been well documented as cell division regulators that control protein expression. A mutation of these anti-oncogenes may affect cell proliferation, cell cycle and apoptosis, which is then likely to trigger the onset of a specific type of cancer (53). In cancer tissues, abnormal cell growth is mainly caused by the inactivation or lack of tumor suppressor genes (54). Tumor suppressor genes are also a type of cell
ONCOLOGY LETTERS 14: 2059-2074, 2017 2061
growth inhibitor and suppress tumor formation genes. Tumor suppressor genes are also under-expressed or downregulated in tumor tissues compared with normal tissue (53).
Previous studies have specifically used the Oncomine database to screen and evaluate tumor suppressor genes. For example, protein tyrosine phosphatase, receptor type D was expressed at significantly lower levels in glioma relative to matched tissue in the brain (55). Another study using the Oncomine database revealed that the level of castor zinc finger 1 (CASZ1) expression was lower in numerous cancer cell types, including gastric intestinal-type adenocarcinoma, head and neck squamous cell carcinoma and clear cell renal cell carcinoma. CASZ1 was also revealed to function as a tumor-suppressor in neuroblastoma (56). A high expression of CASZ1 may interrupt the cancer development process of other types of tissue and play a role in their tumorigenesis (57).
The present bioinformatics analysis revealed that CACNA1S, CACNA1C, CACNA1D and CACNA1A were abundantly expressed in normal tissue but not in cancer tissue; thus, they could serve as tumor suppressor gene markers for specific subtypes of cancer. For these specific types and subtypes of cancer, patients may be supplemented with healthy food or a calcium agonist. This would enable the regulation of CACNA1S, CACNA1C, CACNA1D and CACNA1A signal transduction, thereby offering a method to treat cancer and even cardiovascular disease (58-61), obesity (62) and diabetes (63-65). However, no global method currently exists to screen for the under-expression of VGCCs in diverse types and subtypes of cancers. Therefore, the present study used Oncomine, an online clinical microarray database, to calculate
the changes in mRNA expression levels of VGCCs in 20 types of cancer, and to determine a suitable threshold based on P-values (<0.001), fold change (<-2.0) and gene rank (<top 10%) to select satisfactory datasets. Fig. 1 showed VGCC gene under-expression in 20 cancers, including the corresponding fold changes, P-values and top gene ranks.
A bioinformatics approach was performed in the current study to determine the functions of VGCC genes in the devel-opment of cancer, and to determine whether VGCC genes are potential tumor suppressor genes similar to PTEN (66) or SIRT3. The VGCC genes showed downregulation in 18 of the 20 examined cancer tissues compared with normal tissue (Fig. 1). Overall, VGCC family genes showed under-expres-sion in numerous types of cancers, including brain, breast, kidney and lung cancers. Notably, when compared with their expression in normal tissue, the majority of VGCC family members (CACNA1C, CACNA1D, CACNA1A, CACNA1B, CACNA1E, CACNA1H and CACNA1I) were found to be downregulated in brain tumors, with an mRNA expression level in the top 1-9% of the gene rankings. In total, 5 of the VGCC family members (CACNA1A, CACNA1B, CACNA1E, CACNA1G and CACNA1I) were under-expressed in breast cancer, with a gene ranking in the top 1-10% of the expressed genes relative to normal tissue. In kidney cancer and lung cancer, CACNA1S, CACNA1C, CACNA1D, CACNA1A and CACNA1H had low levels of expression, with a gene ranking in the top 1-8% of the expressed genes. In addition, certain VGCC family genes were under-expressed in other cancer subtypes, including colorectal, lymphoma, ovarian and bladder cancers.
Figure 1. Flow chart describing the process of data identification and accumulation for the quantitative analysis.

PHAN et al: EXPRESSION OF VOLTAGE-GATED CALCIUM CHANNELS IN CANCER2062
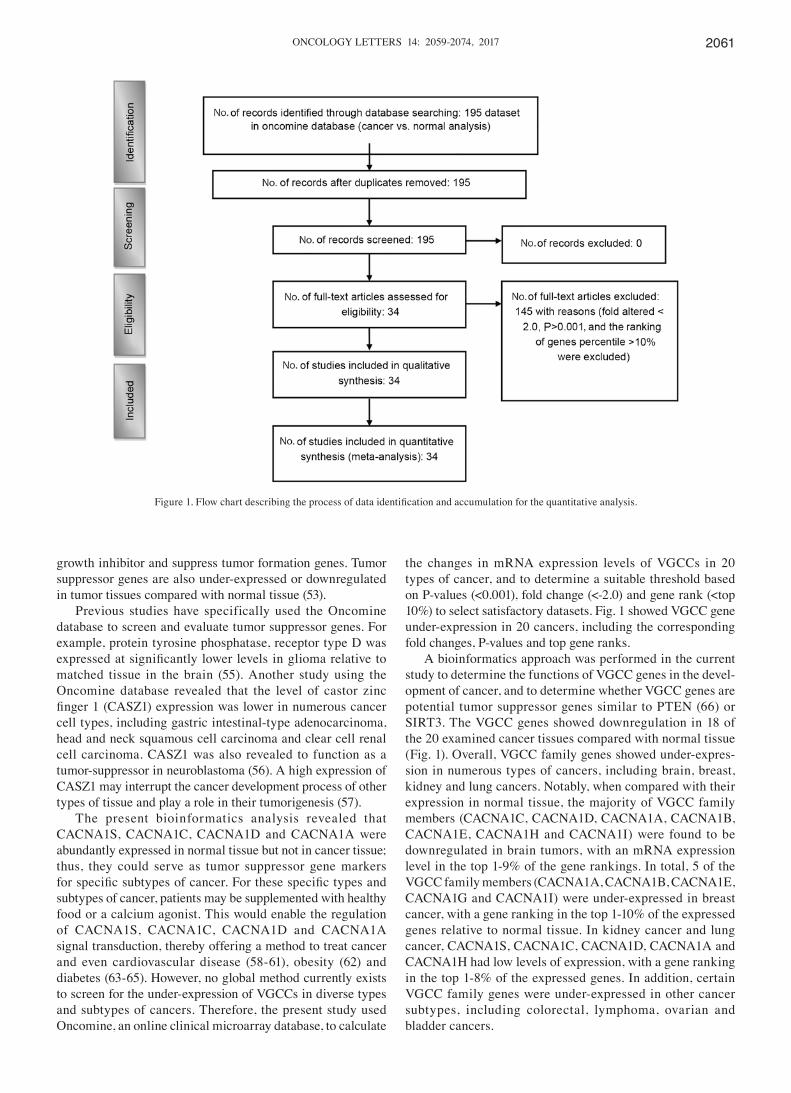
L‑type calcium channel family. The L-type calcium channel is encoded by four genes: Cav1.1 (CACNA1S); Cav1.2 (CACNA1C); Cav1.3 (CACNA1D); and Cav1.4 (CACNA1F). These genes are generally located in different areas, including skeletal muscle, smooth muscle, bone (osteoblasts) and ventricular myocytes. Previous studies explored the role of L-type calcium channels primarily in the physiology and pharmacology fields (67,68). Therefore, their functions are largely unknown in terms of their role in cancer progression. Notably, compared with our previous studies, CACNA1S was overexpressed relative to normal tissue samples in acute myeloid leukemia and brain and central nervous system (CNS) tumors (1). The present data revealed downregulated CACNA1S in renal oncocytoma, with a -3.920-fold change, as well as in head and neck squamous cell carcinoma, (3.670-fold change) and in squamous cell lung carcinoma (-2.038-fold change), compared with matched normal tissue (Table I). In addition, CACNA1S ranked in the top 5% of downregulated genes in head-neck and renal cancer (Fig. 2). Thus, CACNA1S showed increased mRNA expression in a number of cancer tissues but decreased expression in others. These findings indicated that cell context‑specific alterations in CACNA1S expression may play a critical role in cancer biology.
CACNA1C has been revealed to affect the pathophysi-ology of psychiatric disease (69). The present bioinformatics analysis confirmed that CACNA1C exhibited low expressions in the majority of types of cancer, including brain, lymphoma, ovarian, bladder, prostate, renal, salivary gland, cervix and colorectal cancers, compared with normal tissue (Table I). In addition, 9 of the 20 types of cancer showed downregulation in which CACNA1C was ranked in the top 5% of genes that had low expression (Fig. 2). Compared with normal tissue,
CACNA1C was significantly downregulated in the majority of brain tumor types, including diffuse astrocytoma, glio-blastoma, anaplastic astrocytoma and oligodendroglia, with P-values ranging between 1.77x10⁻⁴ and 9.26x10⁻²¹ and a gene ranking between 1 and 6%. Lastly, CACNA1C expres-sion decreased in centroblastic lymphoma, with a -2.381-fold increase, a P-value of 3.77x10⁻¹⁸ and a gene ranking in the top 1% relative to matched normal tissue sections. Compared with our previous study (43), CACNA1C was overexpressed compared with normal tissue samples in gastric, pancreas, brain, colorectal, breast, uterus, skin and prostate cancers and leukemia. Notably, up- and downregulated CACNA1C was observed in brain, prostate and colorectal tumors compared with normal tissue. The conflicting expression profiles of CACNA1C in the same types of cancer may be due to the broad range of categories for each cancer subtype. For example, our previous study (43) indicated that CACNA1C had high expression in prostate carcinoma; however, in the present study, CACNA1C had low expression in prostatic intraepi-thelial neoplasia epithelia relative to normal type-matched tissue. In addition, CACNA1C had high expression in colon and renal adenoma; however, in the present study, CACNA1C had low expression in rectosigmoid adenocarcinoma relative to normal matched tissue. In addition, CACNA1C was up- and downregulated in brain glioblastoma. The small sample size in the original publications (70,71) may explain this discrepancy. Collectively, our data suggested that alterations in CACNA1C expression may have an adverse effect on tissue homeostasis, which may result in tumorigenesis.
CACNA1D regulates cell firing (21) and is associated with prostate cancer; however, the presence of CACNA1D in other cancer subtypes requires confirmation. The present
Figure 2. Under-expression of 10 voltage-gated calcium channel genes in 19 types of cancers. The comparison of cancer vs. normal tissue was shown at different expression levels based on P<0.001, a fold change >2.0 and a gene rank percentile <10%, to screen the microarray datasets. The color alterations represent the changes in level of gene rank percentage.
ONCOLOGY LETTERS 14: 2059-2074, 2017 2063Ta
ble
I. L-
type
cal
cium
cha
nnel
exp
ress
ion
in c
ance
rs.
Pa
tient
P-
valu
e t-t
est
Fold
G
ene
D
atab
ase
Gen
e an
d ca
ncer
type
nu
mbe
r, n
(can
cer/n
orm
al)
(can
cer/n
orm
al)
(can
cer/n
orm
al)
rank
ing,
%
refe
renc
e (R
efs.)
CAC
NA
1S
R
enal
Ren
al o
ncoc
ytom
a 92
1.
77x1
0-16
-26.
050
-3.9
20
303
(top
3)
Clin
Can
cer R
es 2
005/
08/1
5 (9
4) P
apill
ary
rena
l cel
l car
cino
ma
92
4.88
x10-1
5 -2
1.97
8 -2
.934
32
4 (to
p 3)
C
lin C
ance
r Res
200
5/08
/15
(94)
Hea
d-ne
ck
H
ead
and
neck
squa
mou
s cel
l car
cino
ma
54
6.96
x10-9
-7
.318
-3
.670
74
8 (to
p 6)
C
ance
r Res
200
4/01
/01
(95)
Ton
gue
squa
mou
s cel
l car
cino
ma
58
5.26
x10-6
-5
.261
-6
.638
32
4 (to
p 4)
B
MC
Can
cer 2
009/
01/1
2 (9
6)Lu
ng
S
quam
ous c
ell l
ung
carc
inom
a 93
8.
64x1
0-7
-6.0
38
-2.0
38
601
(top
7)
Can
cer R
es 2
005/
04/1
5 (9
7)C
AC
NA
1C
B
rain
Glio
blas
tom
a 18
0 9.
26x1
0-21
-14.
125
-4.4
83
484
(top
3)
Can
cer C
ell 2
006/
04/0
1 (7
0) O
ligod
endr
oglio
ma
180
1.39
x10-1
4 -1
0.04
9 -3
.024
30
4 (to
p 2)
C
ance
r Cel
l 200
6/04
/01
(70)
Ana
plas
tic a
stro
cyto
ma
180
7.46
x10-
11
-8.8
54
-3.1
66
72 (t
op 1
) C
ance
r Cel
l 200
6/04
/01
(70)
Diff
use
astro
cyto
ma
180
4.59
x10-4
-4
.878
-2
.505
61
9 (to
p 4)
C
ance
r Cel
l 200
6/04
/01
(70)
Glio
blas
tom
a 84
1.
77x1
0-4
-11.
513
-2.5
50
1,17
3 (to
p 6)
J C
lin O
ncol
200
8/06
/20
(71)
Lym
phom
a
Cen
trobl
astic
lym
phom
a 33
6 3.
77x1
0-18
-13.
615
-2.3
81
17 (t
op 1
) N
at G
enet
200
5/04
/01
(98)
Ova
rian
O
varia
n se
rous
ade
noca
rcin
oma
53
1.72
x10-1
4 -1
3.25
3 -2
7.22
8 21
8 (to
p 2)
C
ance
r Sci
200
9/08
/01
(99)
Bla
dder
Infi
ltrat
ing
blad
der u
roth
elia
l car
cino
ma
157
9.94
x10-1
2 -7
.365
-3
.364
67
5 (to
p 6)
J C
lin O
ncol
200
6/02
/10
(100
) S
uper
ficia
l bla
dder
can
cer
157
2.00
x10-1
0 -8
.288
-6
.787
75
0 (to
p 6)
J C
lin O
ncol
200
6/02
/10
(100
)Pr
osta
te
P
rost
atic
intra
epith
elia
l neo
plas
ia e
pith
elia
10
1 2.
80x1
0-5
-4.6
35
-3.1
39
134
(top
2)
Nat
Gen
et 2
007/
01/0
1 (1
01)
Pro
stat
e ca
rcin
oma
epith
elia
10
1 7.
53x1
0-4
-3.3
81
-2.1
92
524
(top
5)
Nat
Gen
et 2
007/
01/0
1 (1
01)
Ren
al
P
apill
ary
rena
l cel
l car
cino
ma
67
4.95
x10-6
-5
.711
-2
.297
30
8 (to
p 2)
B
MC
Can
cer 2
009/
05/1
8 (1
02)
Saliv
ary
glan
d
Sal
ivar
y gl
and
aden
oid
cyst
ic c
arci
nom
a 22
5.
15x1
0-6
-5.9
62
-22.
108
257
top
3)
Am
J Pa
thol
200
2/10
/01
(103
)C
ervi
x
Cer
vica
l squ
amou
s cel
l car
cino
ma
45
1.25
x10-4
-8
.154
-2
.377
1,
775
(top
10)
Gyn
ecol
Onc
ol 2
008/
03/0
1 (1
04)
Col
orec
tal
PHAN et al: EXPRESSION OF VOLTAGE-GATED CALCIUM CHANNELS IN CANCER2064
Tabl
e I.
Con
tinue
d.
Pa
tient
P-
valu
e t-t
est
Fold
G
ene
D
atab
ase
Gen
e an
d ca
ncer
type
nu
mbe
r, n
(can
cer/n
orm
al)
(can
cer/n
orm
al)
(can
cer/n
orm
al)
rank
ing,
%
refe
renc
e (R
efs.)
Rec
tosi
gmoi
d ad
enoc
arci
nom
a 23
7 5.
06x1
0-4
-3.8
80
-2.2
73
1861
(top
10)
TC
GA
201
1/09
/08
CA
CN
A1D
Lung
Squ
amou
s cel
l lun
g ca
rcin
oma
156
7.16
x10-3
1 -1
9.44
7 -4
.801
51
(top
1)
PLoS
One
201
0/04
/22
(105
) L
ung
aden
ocar
cino
ma
246
2.15
x10-2
4 -1
3.05
7 -2
.443
45
(top
1)
Can
cer R
es 2
012/
01/0
1 (1
06)
Bra
in
G
liobl
asto
ma
18
0 3.
23x1
0-16
-10.
515
-2.8
50
1,12
2 (to
p 6)
C
ance
r Cel
l 200
6/04
/01
(70)
Ana
plas
tic a
stro
cyto
ma
180
3.49
x10-6
-5
.415
-2
.094
1,
722
(top
9)
Can
cer C
ell 2
006/
04/0
1 (7
0) D
iffus
e as
trocy
tom
a
180
0.00
1 -4
.432
-2
.814
1,
117
(top
6)
Can
cer C
ell 2
006/
04/0
1 (7
0)M
yelo
ma
M
onoc
lona
l gam
mop
athy
of u
ndet
erm
ined
sig
nific
ance
78
3.
65x1
0-6
-4.8
89
-2.5
63
435
(top
3)
Blo
od 2
007/
02/1
5 (1
07)
Sm
olde
ring
mye
lom
a 78
2.
30x1
0-4
-4.5
07
-3.4
87
552
(top
3)
Blo
od 2
007/
02/1
5 (1
07)
Sarc
oma
D
ediff
eren
tiate
d lip
osar
com
a 54
2.
88x1
0-4
-4.6
94
-4.9
80
102
(top
1)
Can
cer R
es 2
005/
07/0
1 (1
08)
Mal
igna
nt fi
brou
s his
tiocy
tom
a 54
6.
13x1
0-4
-3.7
90
-4.2
55
514
(top
5)
Can
cer R
es 2
005/
07/0
1 (1
08)
Ren
al
R
enal
Wilm
s tum
or
67
3.71
x10-4
-6
.265
-2
.958
14
4 (to
p 1)
B
MC
Can
cer 2
009/
05/1
8 (1
02)
CA
CN
A1F
Lym
phom
a
Ana
plas
tic la
rge
cell
lym
phom
a 60
1.
14x1
0-12
-13.
057
-2.0
44
43 (t
op 1
) J C
lin In
vest
200
7/03
/01
(73)
ONCOLOGY LETTERS 14: 2059-2074, 2017 2065
Tabl
e II
. P-ty
pe c
alci
um c
hann
el e
xpre
ssio
n in
can
cers
.
Pa
tient
P-
valu
e t-t
est
Fold
Gen
e an
d ca
ncer
type
nu
mbe
r, n
(can
cer/n
orm
al)
(can
cer/n
orm
al)
(can
cer/n
orm
al)
Gen
e ra
nkin
g, %
D
atab
ase
refe
renc
e (R
efs.)
CA
CN
A1A
Bra
in
G
liobl
asto
ma
180
8.77
x10-1
8 -1
0.65
6 -3
.039
84
1 (to
p 5)
C
ance
r Cel
l 200
6/04
/01
(70)
Ana
plas
tic a
stro
cyto
ma
180
3.02
x10-8
-6
.935
-2
.188
63
7 (to
p 4)
C
ance
r Cel
l 200
6/04
/01
(70)
Bra
in g
liobl
asto
ma
557
2.09
x10-1
3 -2
4.20
1 -6
.900
33
0 (to
p 3)
TC
GA
201
3/06
/03
Glio
blas
tom
a 84
4.
22x1
0-6
-8.9
68
-2.4
24
585
(top
3)
J Clin
Onc
ol 2
008/
06/2
0 (7
1) A
stro
cyto
ma
51
2.54
x10-5
-5
.241
-7
.344
14
8 (to
p 3)
C
ance
r Res
200
1/09
/15
(109
) A
typi
cal t
erat
oid/
rhab
doid
tum
or
85
9.05
x10-5
-7
.761
-5
23.3
35
24 (t
op 1
) N
atur
e 20
02/0
1/24
(1
1) M
alig
nant
glio
ma,
NO
S 85
2.
07x1
0-4
-5.0
12
-139
.970
80
(top
2)
Nat
ure
2002
/01/
24
(11)
Prim
itive
neu
roec
tode
rmal
tum
or, N
OS
85
4.
64x1
0-4
-10.
153
-704
.199
34
(top
1)
Nat
ure
2002
/01/
24
(11)
Cla
ssic
med
ullo
blas
tom
a 85
5.
73x1
0-4
-5.0
11
-51.
831
411
(top
8)
Nat
ure
2002
/01/
24
(11)
Des
mop
last
ic m
edul
lobl
asto
ma
85
8.98
x10-4
-3
.937
-4
9.28
3 19
9 (to
p 4)
N
atur
e 20
02/0
1/24
(1
1) O
ligod
endr
oglio
ma
42
1.09
x10-4
-6
.523
-2
.168
28
9 (to
p 4)
O
ncog
ene
2003
/07/
31
(110
) A
stro
cyto
ma
42
2.84
x10-4
-5
.138
-2
.084
14
1 (to
p 2)
O
ncog
ene
2003
/07/
31
(110
)C
olor
ecta
l
Col
orec
tal c
arci
nom
a 82
5.
25x1
0-6
-5.2
93
-2.8
07
1,83
0 (to
p 10
) C
lin E
xp M
etas
tasi
s 201
0/02
/01
(111
) C
olon
ade
nom
a 64
3.
39x1
0-5
-4.4
02
-3.3
76
1,45
1 (to
p 8)
M
ol C
ance
r Res
200
7/12
/01
(112
)Es
opha
gus
E
soph
agus
48
9.
61x1
0-5
-5.3
68
-2.8
73
146
(top
1)
Gas
troen
tero
logy
200
6/09
/01
(2
0)G
astri
c
Gas
tric
inte
stin
al ty
pe a
deno
carc
inom
a 69
2.
25x1
0-4
-3.7
37
-2.3
70
1,04
0 (to
p 6)
Eu
r J C
ance
r 200
9/02
/01
(113
) G
astri
c m
ixed
ade
noca
rcin
oma
69
3.40
x10-4
-5
.809
-6
.673
42
6 (to
p 3)
Eu
r J C
ance
r 200
9/02
/01
(113
)B
reas
t
Inv
asiv
e du
ctal
bre
ast c
arci
nom
a 30
9.
34x1
0-4
-3.5
36
-2.2
05
189
(top
1)
BM
C C
ance
r 200
7/03
/27
(114
)
NO
S, n
ot o
ther
wis
e sp
ecifi
ed.
PHAN et al: EXPRESSION OF VOLTAGE-GATED CALCIUM CHANNELS IN CANCER2066
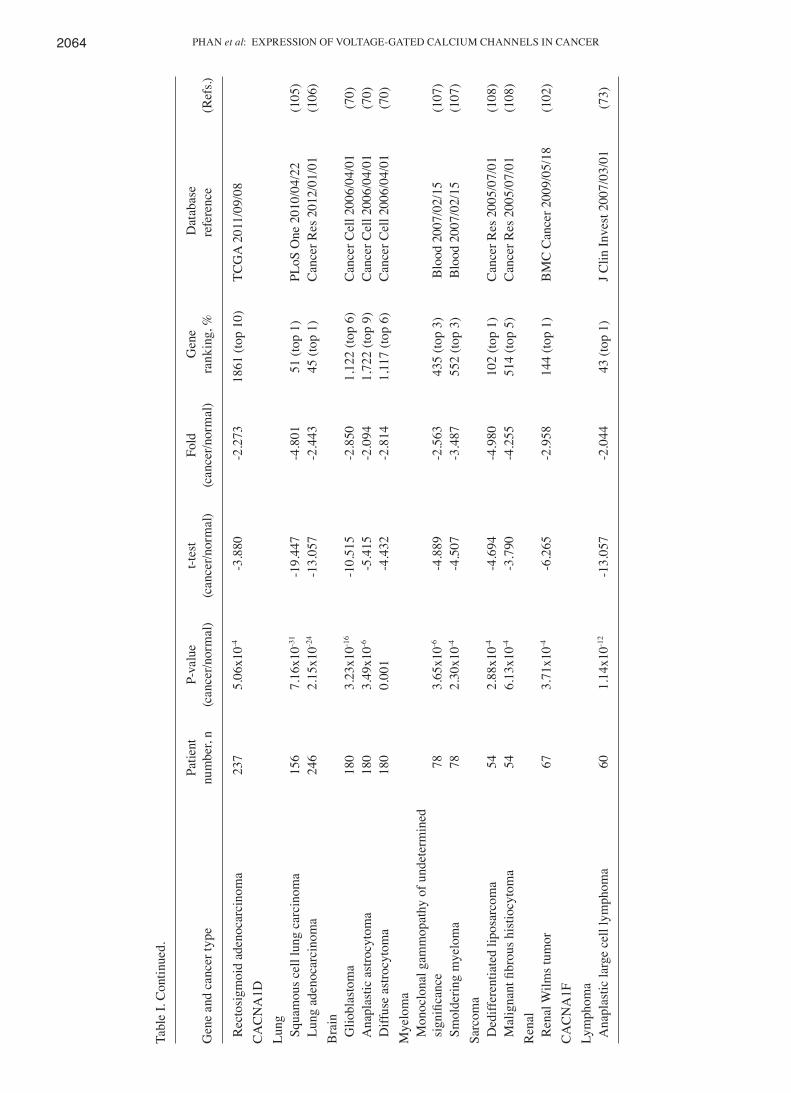
study revealed that CACNA1D expression levels decreased in lung, brain, myeloma, sarcoma and renal cancer. In 5 of the 20 cancer tissue sections, CACNA1D was downregulated and presented in the top 10% of downregulated genes (Fig. 2). In addition, CACNA1D levels also markedly declined in squa-mous cell lung carcinoma and lung adenocarcinoma, with fold changes ranging between-2.443 and -4.801, P-values ranging between 2.15x10⁻²⁴ and 7.16x10⁻³¹ and gene rankings all in the top 1% relative to normal type-matched tissue. In brain tumors, consisting of glioblastoma, anaplastic astrocytoma and diffuse astrocytoma, CACNA1D was substantially downregulated, with fold changes between 2.814 and -2.850, P-values between 0.001 and 3.23x10⁻¹⁶ and gene rankings in the top 6-9%. To the best of our knowledge, these findings regarding the low expression of CACNA1D in myeloma, sarcoma and renal tumors (Table I) are novel findings. In our previous study (43), CACNA1D specifically had low expression in myeloma, sarcoma and renal tumors and was highly expressed in pros-tate, breast, colorectal, bladder, gastric, uterine and esophageal tumors. In addition, CACNA1D was up- and downregulated in brain and lung cancer. CACNA1D was upregulated in lung carcinoid tumors, but under-expressed in squamous cell lung carcinoma and lung adenocarcinoma. Based on the current data, CACNA1D may be a useful marker for potential tumor suppressor genes in cancer development; however, its mecha-nism of action in cancer requires additional investigation in prospective studies.
CACNA1F was reported to be involved in human physi-ology and photoreceptors, although its role in cancer biology is generally unknown. In the present analysis, CACNA1F was under-expressed in anaplastic large cell lymphoma with a fold change of -2.044, P-value of 1.14x10⁻¹², and gene ranking in the top 1% (Table I). In our previous study, CACNA1F was over-expressed in testicular teratoma relative to normal matched tissue samples (72). Therefore, CACNA1F had increased mRNA expression in testis cancer but decreased expression in lymphoma. These findings indicated that cell context‑specific alterations in CACNA1F expression may play a critical role in cancer biology.
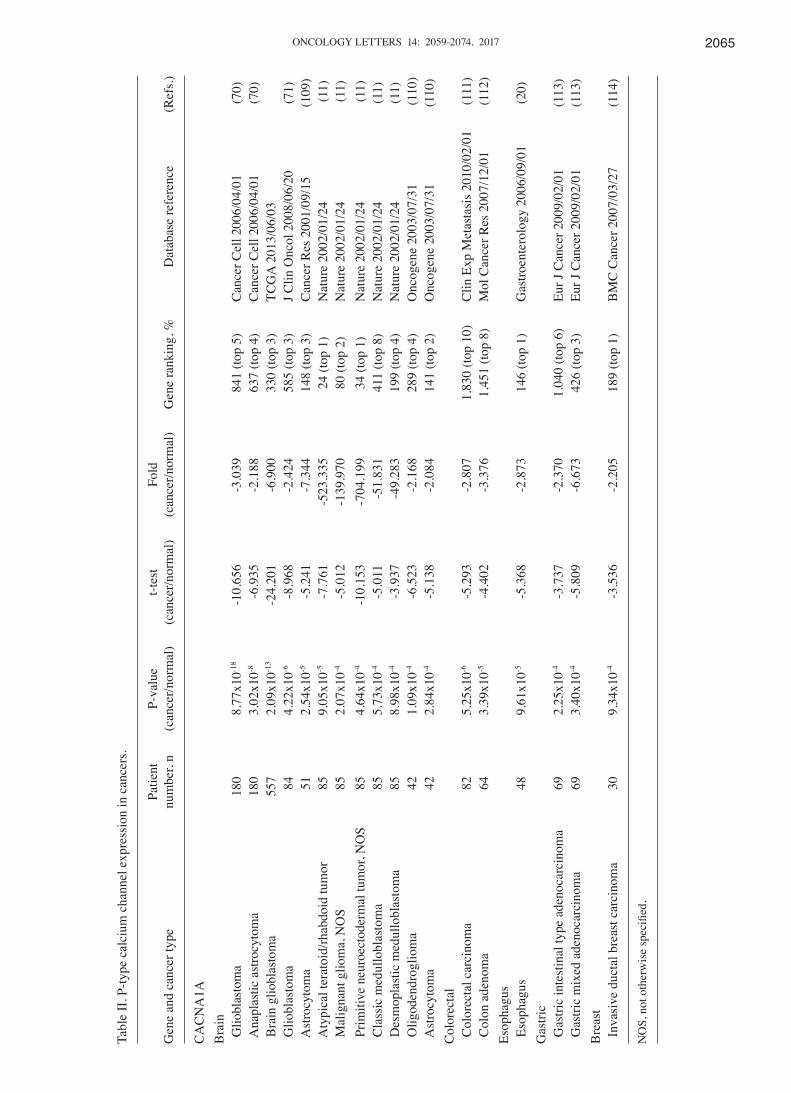
P/Q‑type calcium channel family. The P/Q calcium channel is encoded by Cav2.1 (CACNA1A), located in Purkinje cells and cerebellar granule cells (73). CACNA1A is known to be involved in neurological disease (74); compared with normal tissue, CACNA1A is downregulated in brain, colorectal, gastric and breast cancers (Fig. 1). In 4 of the 20 cancer types studied, the expression of CACNA1A was low, with a gene ranking in the top 10% of downregulated genes (Fig. 1). Brain tumors, consisting of glioblastoma, anaplastic astrocytoma, astrocy-toma, atypical teratoid/rhabdoid tumor, malignant glioma, primitive neuroectodermal tumor, classic medulloblastoma, desmoplastic medulloblastoma and oligodendroglioma, all showed significant downregulation (P<0.05) of CACNA1A in comparison to type-matched tissues. In silico analysis of brain datasets showed a -2.084-fold change in CACNA1A expression levels, with P-values ranging between 2.84x10⁻⁴ and 8.77x10⁻¹⁸
and a gene ranking in the top 1-5%. Colorectal cancers, including colorectal carcinoma and colon adenoma, all showed the most significant decreases in expression of CACNA1A relative to control samples, with-2.807- to -3.376-fold
downregulation, P-values between 3.39x10⁻⁵ and 5.25x10⁻⁶ and gene rankings in the top 8-10% (Table II). Compared with our previous studies (43), CACNA1A specifically had low expres-sion in colorectal, esophageal and gastric cancers, but also had high expression in leukemia, and sarcoma, ovarian, uterine, lung and cervical tumors. In addition, it was also identified that CACNA1A was up- and downregulated in brain tumors. Overall, our bioinformatics analysis verified that CACNA1A is likely to be useful as a possible cancer therapeutic target for colorectal, esophagus, gastric and breast cancers.
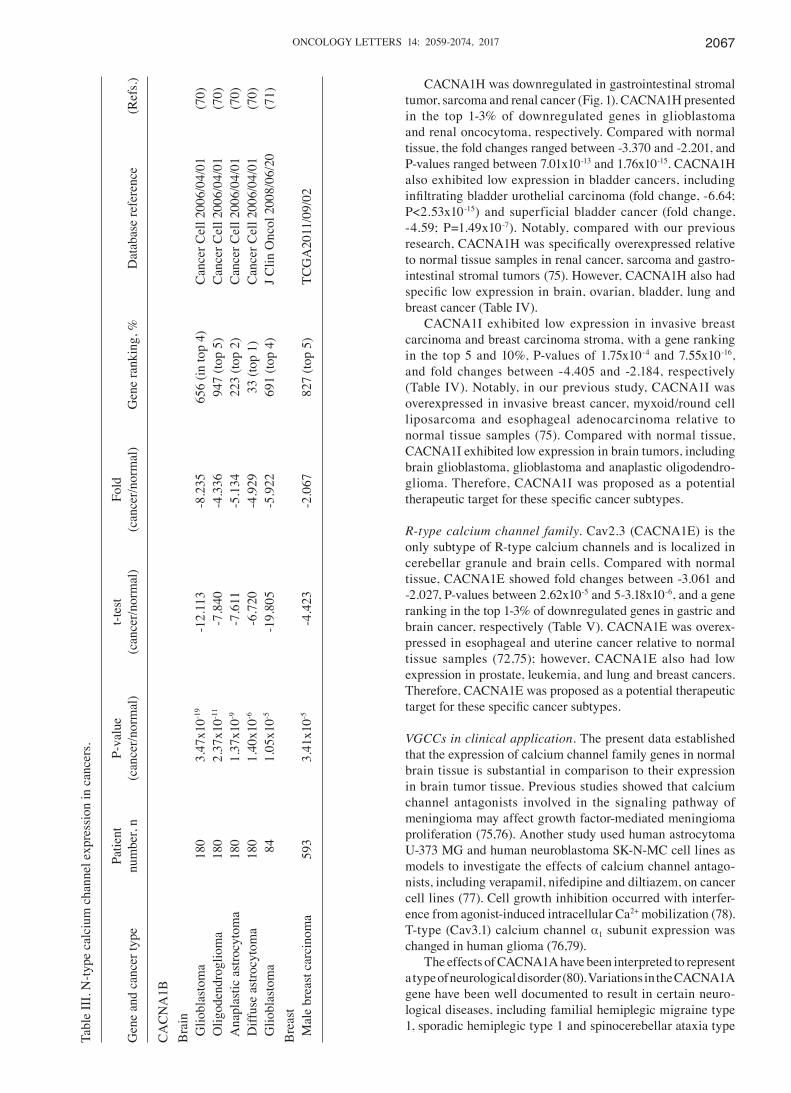
N‑type calcium channel family. The N-type calcium channel is encoded by an α1 subunit termed CACNA1B (Cav2.2), which is localized in the brain and peripheral nervous system. In neuropathic pain, CACNA1B serves to preserve neuronal firing and neurotransmitter release (74). However, CACNA1B has not yet been associated with cancer. The bioinformatics data derived in the present study regarding brain and breast cancer showed that CACNA1B ranked in the top 1 and 5% of genes with low expression, respectively. Brain tumors, including glioblastoma, oligodendroglia, anaplastic astro-cytoma, diffuse astrocytoma and glioblastoma all showed significant downregulation (P<0.05) of CACNA1B relative to control samples. In silico analyses of brain datasets showed under-expression of CACNA1A, ranging between -4.336 and -8.235-fold decreases in transcript expression, P-values between 1.05x10⁻⁵ and 3.47x10⁻¹⁹ and gene rankings in the top 1-5%. For CACNA1B expression in male breast carcinoma, the data also showed decreases, with a -2.067-fold change and a P-value of 3.41x10⁻⁵ relative to control tissue (Table III). Compared with our previous results (43), CACNA1B specifically had low expression in brain cancer, but also had high expression in prostate tumors. In addition, CACNA1B was also upregulated in intraductal cribriform breast adenocarcinoma, but down-regulated in male breast carcinoma. Finally, the present data indicated that CACNA1B was moderately expressed in brain cancer and male breast cancer. Understanding the underlying mechanisms behind CACNA1B action in cancer progression may assist in determining prospective therapeutic targets for the treatment of brain cancer and male breast cancer.
T‑type calcium channel family. The T-type calcium channel consists of three subtypes [Cav3.1 (CACNA1G), Cav3.2 (CACNA1H) and Cav3.3 (CACNA1I)], which are located in neurons, pacemaker cells and osteocytes. The functions of the T-type calcium channel remain generally unknown. CACNA1G exhibited low expression in numerous cancers, including ovarian serous adenocarcinoma and mucinous breast carcinoma, with a gene ranking in the top 3-5% of genes with low expression, fold changes between -6.893 and -2.209, and P-values between 2.42x10⁻⁵ and 4.27x10⁻¹⁰ (Table IV). Compared with our previous results (43), CACNA1G specifi-cally had low expression in ovarian, renal, brain and bladder cancer, but also exhibited high expression in sarcoma, lung, uterine and prostate tumors. CACNA1G was also revealed to be upregulated in invasive lobular breast carcinoma but downregulated CACNA1G was observed in mucinous breast carcinoma and mantle cell lymphoma. In addition, CACNA1G was upregulated in rectosigmoid adenocarcinoma but down-regulated in colorectal carcinoma.
ONCOLOGY LETTERS 14: 2059-2074, 2017 2067
CACNA1H was downregulated in gastrointestinal stromal tumor, sarcoma and renal cancer (Fig. 1). CACNA1H presented in the top 1-3% of downregulated genes in glioblastoma and renal oncocytoma, respectively. Compared with normal tissue, the fold changes ranged between -3.370 and -2.201, and P-values ranged between 7.01x10⁻¹³ and 1.76x10⁻¹⁵. CACNA1H also exhibited low expression in bladder cancers, including infiltrating bladder urothelial carcinoma (fold change, ‑6.64; P<2.53x10⁻¹⁵) and superficial bladder cancer (fold change, -4.59; P=1.49x10⁻⁷). Notably, compared with our previous research, CACNA1H was specifically overexpressed relative to normal tissue samples in renal cancer, sarcoma and gastro-intestinal stromal tumors (75). However, CACNA1H also had specific low expression in brain, ovarian, bladder, lung and breast cancer (Table IV).
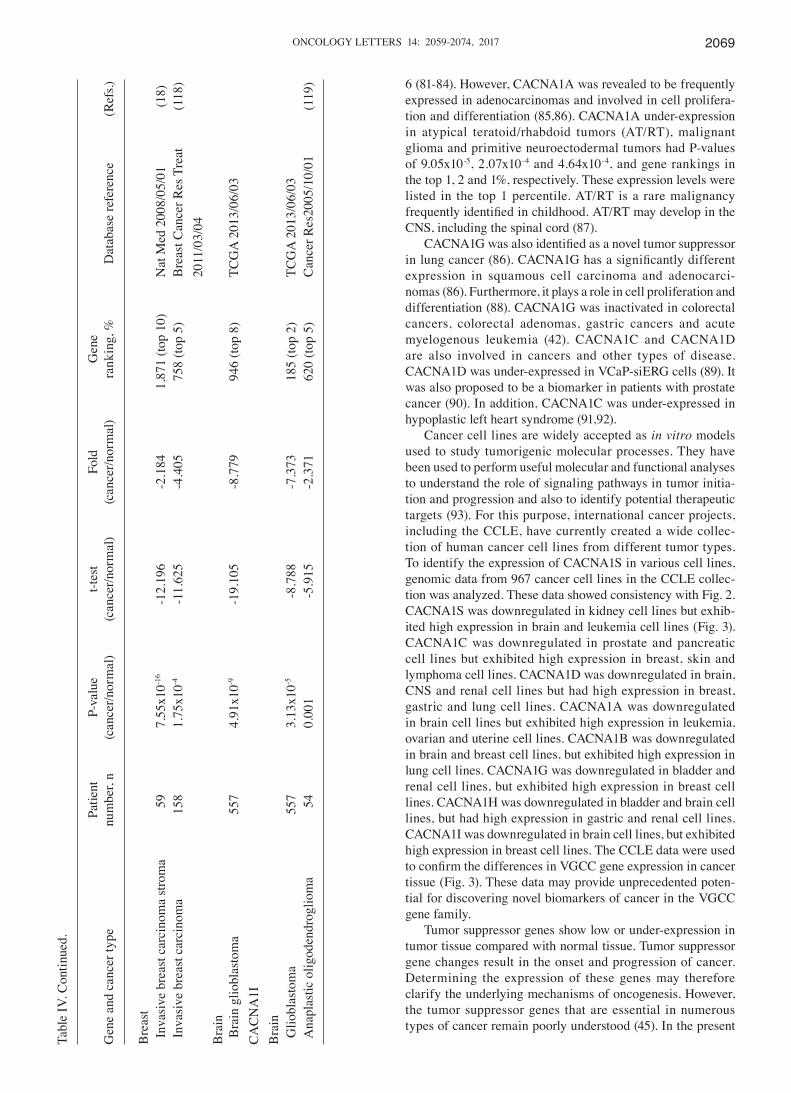
CACNA1I exhibited low expression in invasive breast carcinoma and breast carcinoma stroma, with a gene ranking in the top 5 and 10%, P-values of 1.75x10⁻⁴ and 7.55x10⁻¹⁶, and fold changes between -4.405 and -2.184, respectively (Table IV). Notably, in our previous study, CACNA1I was overexpressed in invasive breast cancer, myxoid/round cell liposarcoma and esophageal adenocarcinoma relative to normal tissue samples (75). Compared with normal tissue, CACNA1I exhibited low expression in brain tumors, including brain glioblastoma, glioblastoma and anaplastic oligodendro-glioma. Therefore, CACNA1I was proposed as a potential therapeutic target for these specific cancer subtypes.
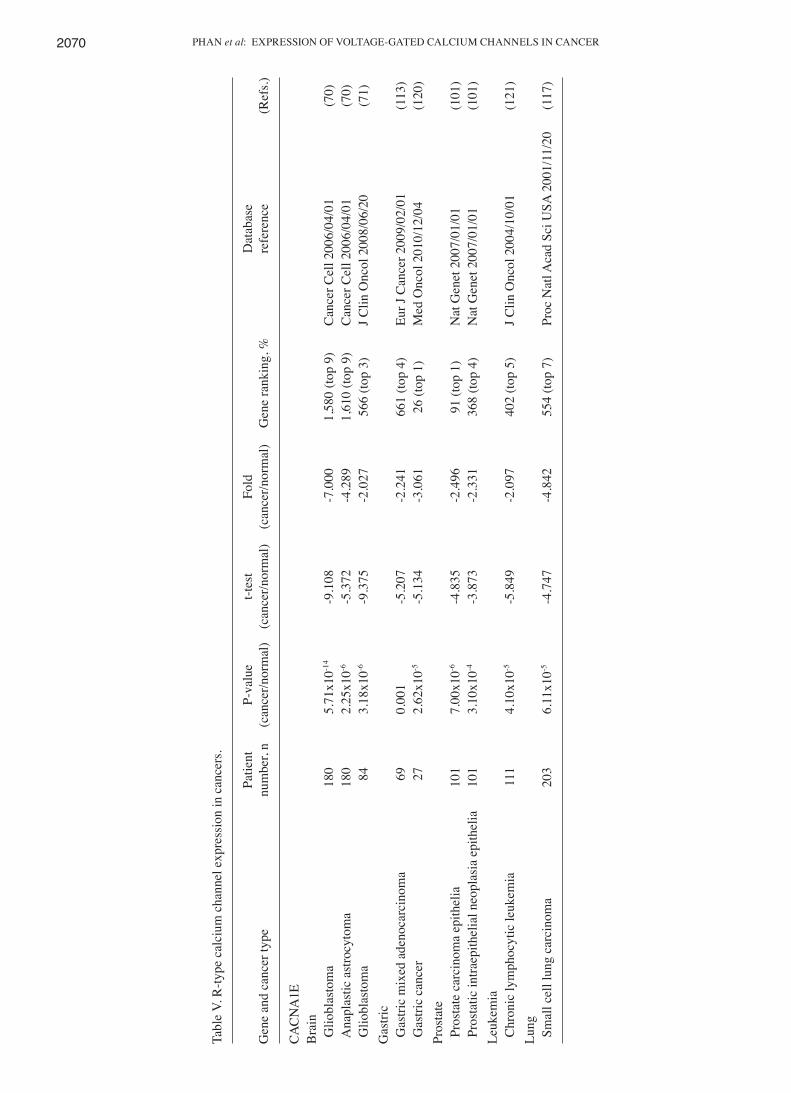
R‑type calcium channel family. Cav2.3 (CACNA1E) is the only subtype of R-type calcium channels and is localized in cerebellar granule and brain cells. Compared with normal tissue, CACNA1E showed fold changes between -3.061 and -2.027, P-values between 2.62x10⁻⁵ and 5-3.18x10⁻⁶, and a gene ranking in the top 1-3% of downregulated genes in gastric and brain cancer, respectively (Table V). CACNA1E was overex-pressed in esophageal and uterine cancer relative to normal tissue samples (72,75); however, CACNA1E also had low expression in prostate, leukemia, and lung and breast cancers. Therefore, CACNA1E was proposed as a potential therapeutic target for these specific cancer subtypes.
VGCCs in clinical application. The present data established that the expression of calcium channel family genes in normal brain tissue is substantial in comparison to their expression in brain tumor tissue. Previous studies showed that calcium channel antagonists involved in the signaling pathway of meningioma may affect growth factor-mediated meningioma proliferation (75,76). Another study used human astrocytoma U-373 MG and human neuroblastoma SK-N-MC cell lines as models to investigate the effects of calcium channel antago-nists, including verapamil, nifedipine and diltiazem, on cancer cell lines (77). Cell growth inhibition occurred with interfer-ence from agonist-induced intracellular Ca2+ mobilization (78). T-type (Cav3.1) calcium channel α1 subunit expression was changed in human glioma (76,79).
The effects of CACNA1A have been interpreted to represent a type of neurological disorder (80). Variations in the CACNA1A gene have been well documented to result in certain neuro-logical diseases, including familial hemiplegic migraine type 1, sporadic hemiplegic type 1 and spinocerebellar ataxia type
Tabl
e II
I. N
-type
cal
cium
cha
nnel
exp
ress
ion
in c
ance
rs.
Pa
tient
P-
valu
e t-t
est
Fold
Gen
e an
d ca
ncer
type
nu
mbe
r, n
(can
cer/n
orm
al)
(can
cer/n
orm
al)
(can
cer/n
orm
al)
Gen
e ra
nkin
g, %
D
atab
ase
refe
renc
e (R
efs.)
CA
CN
A1B
Bra
in
G
liobl
asto
ma
180
3.47
x10-1
9 -1
2.11
3 -8
.235
65
6 (in
top
4)
Can
cer C
ell 2
006/
04/0
1 (7
0) O
ligod
endr
oglio
ma
180
2.37
x10-1
1 -7
.840
-4
.336
94
7 (to
p 5)
C
ance
r Cel
l 200
6/04
/01
(70)
Ana
plas
tic a
stro
cyto
ma
180
1.37
x10-9
-7
.611
-5
.134
22
3 (to
p 2)
C
ance
r Cel
l 200
6/04
/01
(70)
Diff
use
astro
cyto
ma
180
1.40
x10-6
-6
.720
-4
.929
33
(top
1)
Can
cer C
ell 2
006/
04/0
1 (7
0) G
liobl
asto
ma
84
1.05
x10-5
-1
9.80
5 -5
.922
69
1 (to
p 4)
J C
lin O
ncol
200
8/06
/20
(71)
Bre
ast
M
ale
brea
st c
arci
nom
a 59
3 3.
41x1
0-5
-4.4
23
-2.0
67
827
(top
5)
TCG
A20
11/0
9/02

PHAN et al: EXPRESSION OF VOLTAGE-GATED CALCIUM CHANNELS IN CANCER2068Ta
ble
IV. T
-type
cal
cium
cha
nnel
exp
ress
ion
in c
ance
rs.
Pa
tient
P-
valu
e t-t
est
Fold
G
ene
G
ene
and
canc
er ty
pe
num
ber,
n (c
ance
r/nor
mal
) (c
ance
r/nor
mal
) (c
ance
r/nor
mal
) ra
nkin
g, %
D
atab
ase
refe
renc
e (R
efs.)
CA
CN
A1G
Ova
rian
O
varia
n se
rous
ade
noca
rcin
oma
53
4.27
x10-1
0 -8
.514
-6
.893
68
5 (to
p 5)
C
ance
r Sci
200
9/08
/01
(99)
Col
orec
tal
C
olor
ecta
l car
cino
ma
82
6.45
x10-7
-6
.447
-3
.266
1,
537
(top
8)
Clin
Exp
Met
asta
sis 2
010/
02/0
1 (1
11)
Bra
in
A
napl
astic
ast
rocy
tom
a 18
0 4.
26x1
0-6
-5.1
11
-1.9
76
1,77
1 (to
p 10
) C
ance
r Cel
l 200
6/04
/01
(70)
Bre
ast
M
ucin
ous b
reas
t car
cino
ma
593
2.42
x10-5
-7
.311
-2
.209
43
8 (to
p 3)
TC
GA
201
1/09
/02
Man
tle c
ell l
ymph
oma
33
6 7.
74x1
0-4
-3.8
39
-2.0
85
207
(top
3)
Nat
Gen
et 2
005/
04/0
1 (9
8)R
enal
Ren
al o
ncoc
ytom
a 92
1.
76x1
0-15
-3.7
10
-2.2
01
362
(top
3)
Clin
Can
cer R
es 2
005/
08/1
5 (9
4) C
hrom
opho
be re
nal c
ell c
arci
nom
a
1.24
x10-7
-9
.936
-2
.096
49
0 (to
p 4)
C
lin C
ance
r Res
200
5/08
/15
(94)
Bla
dder
Infi
ltrat
ing
blad
der
Uro
thel
ial c
arci
nom
a 15
7 2.
53x1
0-15
-9.9
13
-6.6
40
380
(top
4)
J Clin
Onc
ol 2
006/
02/1
0 (1
00)
Sup
erfic
ial b
ladd
er c
ance
r 15
7 1.
49x1
0-7
-5.7
54
-4.5
95
1,15
8 (to
p 10
) J C
lin O
ncol
200
6/02
/10
(100
)C
AC
NA
1H
B
rain
Glio
blas
tom
a 10
1 7.
01x1
0-13
-13.
798
-3.3
70
129
(top
1)
Can
cer C
ell 2
006/
05/0
1 (1
15)
Ova
rian
O
varia
n se
rous
ade
noca
rcin
oma
53
1.44
x10-8
-7
.924
-9
.621
1,
021
(top
7)
Can
cer S
ci 2
009/
08/0
1 (9
9)B
ladd
er
I
nfiltr
atin
g bl
adde
r uro
thel
ial c
arci
nom
a 25
6 4.
81x1
0-9
-6.1
50
-2.6
79
356
(top
2)
J Clin
Onc
ol 2
010/
06/0
1 (1
16)
Sup
erfic
ial b
ladd
er c
ance
r 25
6 2.
62x1
0-8
-5.8
51
-2.2
92
1,29
5 (to
p 7)
J C
lin O
ncol
201
0/06
/01
(116
)Lu
ng
L
ung
aden
ocar
cino
ma
203
1.43
x10-4
-4
.251
-2
.152
60
9 (to
p 8)
Pr
oc N
atl A
cad
Sci U
SA
(117
)
20
01/1
1/20
S
quam
ous c
ell l
ung
carc
inom
a 20
3 3.
80x1
0-4
-3.7
79
-4.3
18
423
(top
5)
Proc
Nat
l Aca
d Sc
i USA
(1
17)
2001
/11/
20
ONCOLOGY LETTERS 14: 2059-2074, 2017 2069
6 (81-84). However, CACNA1A was revealed to be frequently expressed in adenocarcinomas and involved in cell prolifera-tion and differentiation (85,86). CACNA1A under-expression in atypical teratoid/rhabdoid tumors (AT/RT), malignant glioma and primitive neuroectodermal tumors had P-values of 9.05x10⁻⁵, 2.07x10⁻⁴ and 4.64x10⁻⁴, and gene rankings in the top 1, 2 and 1%, respectively. These expression levels were listed in the top 1 percentile. AT/RT is a rare malignancy frequently identified in childhood. AT/RT may develop in the CNS, including the spinal cord (87).
CACNA1G was also identified as a novel tumor suppressor in lung cancer (86). CACNA1G has a significantly different expression in squamous cell carcinoma and adenocarci-nomas (86). Furthermore, it plays a role in cell proliferation and differentiation (88). CACNA1G was inactivated in colorectal cancers, colorectal adenomas, gastric cancers and acute myelogenous leukemia (42). CACNA1C and CACNA1D are also involved in cancers and other types of disease. CACNA1D was under-expressed in VCaP-siERG cells (89). It was also proposed to be a biomarker in patients with prostate cancer (90). In addition, CACNA1C was under-expressed in hypoplastic left heart syndrome (91,92).
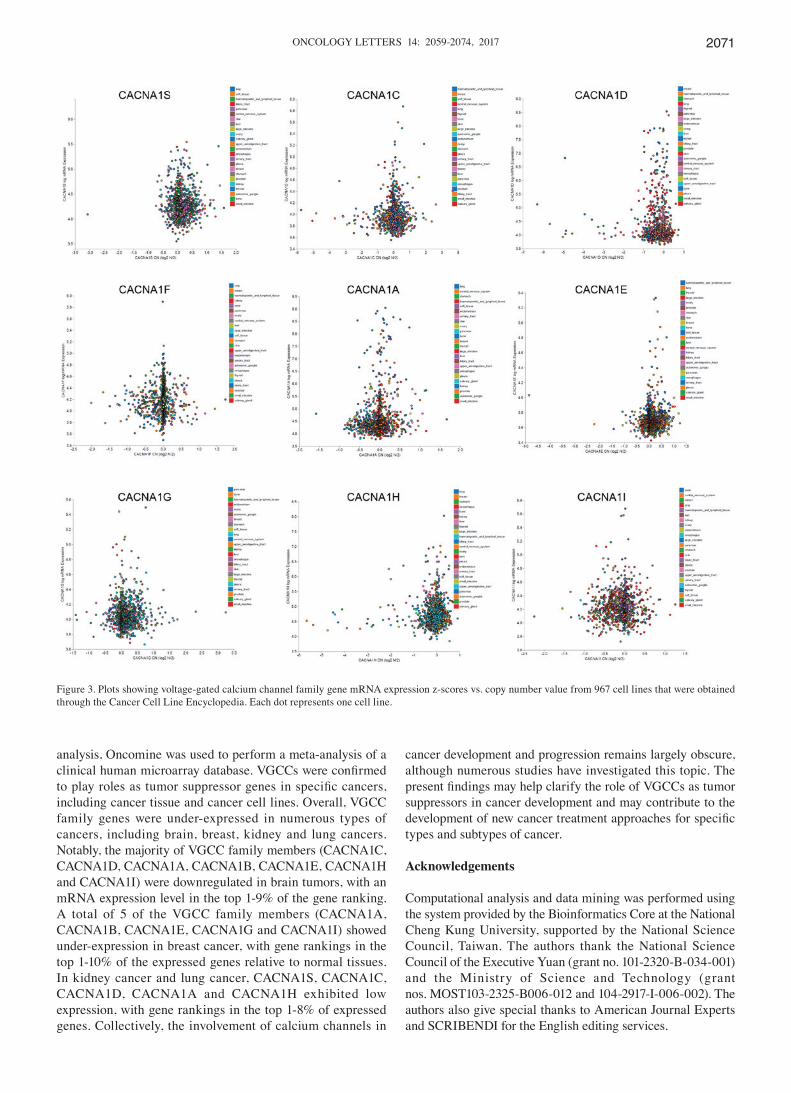
Cancer cell lines are widely accepted as in vitro models used to study tumorigenic molecular processes. They have been used to perform useful molecular and functional analyses to understand the role of signaling pathways in tumor initia-tion and progression and also to identify potential therapeutic targets (93). For this purpose, international cancer projects, including the CCLE, have currently created a wide collec-tion of human cancer cell lines from different tumor types. To identify the expression of CACNA1S in various cell lines, genomic data from 967 cancer cell lines in the CCLE collec-tion was analyzed. These data showed consistency with Fig. 2. CACNA1S was downregulated in kidney cell lines but exhib-ited high expression in brain and leukemia cell lines (Fig. 3). CACNA1C was downregulated in prostate and pancreatic cell lines but exhibited high expression in breast, skin and lymphoma cell lines. CACNA1D was downregulated in brain, CNS and renal cell lines but had high expression in breast, gastric and lung cell lines. CACNA1A was downregulated in brain cell lines but exhibited high expression in leukemia, ovarian and uterine cell lines. CACNA1B was downregulated in brain and breast cell lines, but exhibited high expression in lung cell lines. CACNA1G was downregulated in bladder and renal cell lines, but exhibited high expression in breast cell lines. CACNA1H was downregulated in bladder and brain cell lines, but had high expression in gastric and renal cell lines. CACNA1I was downregulated in brain cell lines, but exhibited high expression in breast cell lines. The CCLE data were used to confirm the differences in VGCC gene expression in cancer tissue (Fig. 3). These data may provide unprecedented poten-tial for discovering novel biomarkers of cancer in the VGCC gene family.
Tumor suppressor genes show low or under-expression in tumor tissue compared with normal tissue. Tumor suppressor gene changes result in the onset and progression of cancer. Determining the expression of these genes may therefore clarify the underlying mechanisms of oncogenesis. However, the tumor suppressor genes that are essential in numerous types of cancer remain poorly understood (45). In the present
Tabl
e IV
. Con
tinue
d.
Pa
tient
P-
valu
e t-t
est
Fold
G
ene
G
ene
and
canc
er ty
pe
num
ber,
n (c
ance
r/nor
mal
) (c
ance
r/nor
mal
) (c
ance
r/nor
mal
) ra
nkin
g, %
D
atab
ase
refe
renc
e (R
efs.)
Bre
ast
Inv
asiv
e br
east
car
cino
ma
stro
ma
59
7.55
x10-1
6 -1
2.19
6 -2
.184
1,
871
(top
10)
Nat
Med
200
8/05
/01
(18)
Inv
asiv
e br
east
car
cino
ma
158
1.75
x10-4
-1
1.62
5 -4
.405
75
8 (to
p 5)
B
reas
t Can
cer R
es T
reat
(1
18)
2011
/03/
04B
rain
Bra
in g
liobl
asto
ma
557
4.91
x10-9
-1
9.10
5 -8
.779
94
6 (to
p 8)
TC
GA
201
3/06
/03
CA
CN
A1I
Bra
in
G
liobl
asto
ma
557
3.13
x10-5
-8
.788
-7
.373
18
5 (to
p 2)
TC
GA
201
3/06
/03
Ana
plas
tic o
ligod
endr
oglio
ma
54
0.00
1 -5
.915
-2
.371
62
0 (to
p 5)
C
ance
r Res
2005
/10/
01
(119
)
PHAN et al: EXPRESSION OF VOLTAGE-GATED CALCIUM CHANNELS IN CANCER2070
Tabl
e V.
R-ty
pe c
alci
um c
hann
el e
xpre
ssio
n in
can
cers
.
Pa
tient
P-
valu
e t-t
est
Fold
Dat
abas
e G
ene
and
canc
er ty
pe
num
ber,
n (c
ance
r/nor
mal
) (c
ance
r/nor
mal
) (c
ance
r/nor
mal
) G
ene
rank
ing,
%
refe
renc
e
(Ref
s.)
CAC
NA
1E
B
rain
Glio
blas
tom
a 18
0 5.
71x1
0-14
-9.1
08
-7.0
00
1,58
0 (to
p 9)
C
ance
r Cel
l 200
6/04
/01
(70)
Ana
plas
tic a
stro
cyto
ma
180
2.25
x10-6
-5
.372
-4
.289
1,
610
(top
9)
Can
cer C
ell 2
006/
04/0
1 (7
0) G
liobl
asto
ma
84
3.18
x10-6
-9
.375
-2
.027
56
6 (to
p 3)
J C
lin O
ncol
200
8/06
/20
(71)
Gas
tric
G
astri
c m
ixed
ade
noca
rcin
oma
69
0.00
1 -5
.207
-2
.241
66
1 (to
p 4)
Eu
r J C
ance
r 200
9/02
/01
(113
) G
astri
c ca
ncer
27
2.
62x1
0-5
-5.1
34
-3.0
61
26 (t
op 1
) M
ed O
ncol
201
0/12
/04
(120
)Pr
osta
te
P
rost
ate
carc
inom
a ep
ithel
ia
101
7.00
x10-6
-4
.835
-2
.496
91
(top
1)
Nat
Gen
et 2
007/
01/0
1 (1
01)
Pro
stat
ic in
traep
ithel
ial n
eopl
asia
epi
thel
ia
101
3.10
x10-4
-3
.873
-2
.331
36
8 (to
p 4)
N
at G
enet
200
7/01
/01
(101
)Le
ukem
ia
C
hron
ic ly
mph
ocyt
ic le
ukem
ia
111
4.10
x10-5
-5
.849
-2
.097
40
2 (to
p 5)
J C
lin O
ncol
200
4/10
/01
(121
)Lu
ng
S
mal
l cel
l lun
g ca
rcin
oma
203
6.11
x10-5
-4
.747
-4
.842
55
4 (to
p 7)
Pr
oc N
atl A
cad
Sci U
SA 2
001/
11/2
0 (1
17)
ONCOLOGY LETTERS 14: 2059-2074, 2017 2071
analysis, Oncomine was used to perform a meta-analysis of a clinical human microarray database. VGCCs were confirmed to play roles as tumor suppressor genes in specific cancers, including cancer tissue and cancer cell lines. Overall, VGCC family genes were under-expressed in numerous types of cancers, including brain, breast, kidney and lung cancers. Notably, the majority of VGCC family members (CACNA1C, CACNA1D, CACNA1A, CACNA1B, CACNA1E, CACNA1H and CACNA1I) were downregulated in brain tumors, with an mRNA expression level in the top 1-9% of the gene ranking. A total of 5 of the VGCC family members (CACNA1A, CACNA1B, CACNA1E, CACNA1G and CACNA1I) showed under-expression in breast cancer, with gene rankings in the top 1-10% of the expressed genes relative to normal tissues. In kidney cancer and lung cancer, CACNA1S, CACNA1C, CACNA1D, CACNA1A and CACNA1H exhibited low expression, with gene rankings in the top 1-8% of expressed genes. Collectively, the involvement of calcium channels in
cancer development and progression remains largely obscure, although numerous studies have investigated this topic. The present findings may help clarify the role of VGCCs as tumor suppressors in cancer development and may contribute to the development of new cancer treatment approaches for specific types and subtypes of cancer.
Acknowledgements
Computational analysis and data mining was performed using the system provided by the Bioinformatics Core at the National Cheng Kung University, supported by the National Science Council, Taiwan. The authors thank the National Science Council of the Executive Yuan (grant no. 101-2320-B-034-001) and the Ministry of Science and Technology (grant nos. MOST103-2325-B006-012 and 104-2917-I-006-002). The authors also give special thanks to American Journal Experts and SCRIBENDI for the English editing services.
Figure 3. Plots showing voltage-gated calcium channel family gene mRNA expression z-scores vs. copy number value from 967 cell lines that were obtained through the Cancer Cell Line Encyclopedia. Each dot represents one cell line.
PHAN et al: EXPRESSION OF VOLTAGE-GATED CALCIUM CHANNELS IN CANCER2072
References
1. Sarkar P and Kumar S: Calcium sensing receptor modulation for cancer therapy. Asian Pac J Cancer Prev 13: 3561-3568, 2012.
2. Lang F, Föller M, Lang KS, Lang PA, Ritter M, Gulbins E, Vereninov A and Huber SM: Ion channels in cell proliferation and apoptotic cell death. J Membr Biol 205: 147-157, 2005.
3. Cuddapah VA and Sontheimer H: Ion channels and tranporters [corrected] in cancer. 2. Ion channels and the control of cancer cell migration. Am J Physiol Cell Physiol 301: C541-C549, 2011.
4. Long J, Zhang ZB, Liu Z, Xu YH and Ge CL: Loss of hetero-zygosity at the calcium regulation gene locus on chromosome 10q in human pancreatic cancer. Asian Pac J Cancer Prev 16: 2489-2493, 2015.
5. Azimi I, Roberts-Thomson SJ and Monteith GR: Calcium influx pathways in breast cancer: Opportunities for pharmacological intervention. Br J Pharmacol 171: 945-960, 2014.
6. Loughlin KR: Calcium channel blockers and prostate cancer. Urol Oncol 32: 537-538, 2014.
7. Chen Q, Zhang Q, Zhong F, Guo S, Jin Z, Shi W, Chen C and He J: Association between calcium channel blockers and breast cancer: A meta-analysis of observational studies. Pharmacoepidemiol Drug Saf 23: 711-718, 2014.
8. George GP, Ramesh V and Mittal RD: Impact of total and ionized serum calcium on prostate cancer risk in North Indian men. Asian Pac J Cancer Prev 12: 1257-1260, 2011.
9. Mahmoudi T, Karimi K, Arkani M, Farahani H, Nobakht H, Dabiri R, Asadi A and Zali MR: Parathyroid hormone gene rs6256 and calcium sensing receptor gene rs1801725 variants are not associated with susceptibility to colorectal cancer in Iran. Asian Pac J Cancer Prev 15: 6035-6039, 2014.
10. Stegmaier K, Ross KN, Colavito SA, O'Malley S, Stockwell BR and Golub TR: Gene expression-based high-throughput screening (GE-HTS) and application to leukemia differentiation. Nat Genet 36: 257-263, 2004.
11. Pomeroy SL, Tamayo P, Gaasenbeek M, Sturla LM, Angelo M, McLaughlin ME, Kim JY, Goumnerova LC, Black PM, Lau C, et al: Prediction of central nervous system embryonal tumour outcome based on gene expression. Nature 415: 436-442, 2002.
12. Grasso CS, Wu YM, Robinson DR, Cao X, Dhanasekaran SM, Khan AP, Quist MJ, Jing X, Lonigro RJ, Brenner JC, et al: The mutational landscape of lethal castration-resistant prostate cancer. Nature 487: 239-243, 2012.
13. Storz MN, van de Rijn M, Kim YH, Mraz-Gernhard S, Hoppe RT and Kohler S: Gene expression profiles of cutaneous B cell lymphoma. J Invest Dermatol 120: 865-870, 2003.
14. Bonome T, Levine DA, Shih J, Randonovich M, Pise-Masison CA, Bogomolniy F, Ozbun L, Brady J, Barrett JC, Boyd J and Birrer MJ: A gene signature predicting for survival in suboptimally debulked patients with ovarian cancer. Cancer Res 68: 5478-5486, 2008.
15. Barretina J, Taylor BS, Banerji S, Ramos AH, Lagos-Quintana M, Decarolis PL, Shah K, Socci ND, Weir BA, Ho A, et al: Subtype-specific genomic alterations define new targets for soft-tissue sarcoma therapy. Nat Genet 42: 715-721, 2010.
16. Skotheim RI, Lind GE, Monni O, Nesland JM, Abeler VM, Fosså SD, Duale N, Brunborg G, Kallioniemi O, Andrews PW and Lothe RA: Differentiation of human embryonal carcinomas in vitro and in vivo reveals expression profiles relevant to normal development. Cancer Res 65: 5588-5598, 2005.
17. Cutcliffe C, Kersey D, Huang CC, Zeng Y, Walterhouse D and Perlman EJ; Renal Tumor Committee of the Children's Oncology Group: Clear cell sarcoma of the kidney: Up-regulation of neural markers with activation of the sonic hedgehog and Akt pathways. Clin Cancer Res 11: 7986-7994, 2005.
18. Finak G, Bertos N, Pepin F, Sadekova S, Souleimanova M, Zhao H, Chen H, Omeroglu G, Meterissian S, Omeroglu A, et al: Stromal gene expression predicts clinical outcome in breast cancer. Nat Med 14: 518-527, 2008.
19. Crabt ree JS, Jel insky SA, Ha r r is HA, Choe SE, Cotreau MM, Kimberland ML, Wilson E, Saraf KA, Liu W, McCampbell AS, et al: Comparison of human and rat uterine leiomyomata: Identification of a dysregulated mammalian target of rapamycin pathway. Cancer Res 69: 6171-6178, 2009.
20. Hao Y, Triadafilopoulos G, Sahbaie P, Young HS, Omary MB and Lowe AW: Gene expression profiling reveals stromal genes expressed in common between Barrett's esophagus and adeno-carcinoma. Gastroenterology 131: 925-933, 2006.
21. Szatkowski C, Parys JB, Ouadid-Ahidouch H and Matifat F: Research Inositol 1,4,5-trisphosphate-induced Ca2+ signalling is involved in estradiol-induced breast cancer epithelial cell growth. Mol Cancer 9: 156, 2010.
22. Mariot P, Prevarskaya N, Roudbaraki MM, Le Bourhis X, Van Coppenolle F, Vanoverberghe K and Skryma R: Evidence of functional ryanodine receptor involved in apoptosis of prostate cancer (LNCaP) cells. Prostate 43: 205-214, 2000.
23. Galione A, Evans AM, Ma J, Parrington J, Arredouani A, Cheng X and Zhu MX: The acid test: The discovery of two-pore channels (TPCs) as NAADP-gated endolysosomal Ca(2+) release channels. Pflugers Arch 458: 869-876, 2009.
24. Lipkin M and Newmark H: Effect of added dietary calcium on colonic epithelial-cell proliferation in subjects at high risk for familial colonic cancer. N Engl J Med 313: 1381-1384, 1985.
25. Jin T, Zhang Z, Yang XF and Luo JS: S100A4 expression is closely linked to genesis and progression of glioma by regulating proliferation, apoptosis, migration and invasion. Asian Pac J Cancer Prev 16: 2883-2887, 2015.
26. Berridge MJ, Bootman MD and Roderick HL: Calcium signal-ling: Dynamics, homeostasis and remodelling. Nat Rev Mol Cell Biol 4: 517-529, 2003.
27. Takeshige N, Yin G, Ohnaka K, Kono S, Ueki T, Tanaka M, Maehara Y, Okamura T, Ikejiri K, Maekawa T, et al: Associations between vitamin D receptor (VDR) gene polymorphisms and colorectal cancer risk and effect modifications of dietary calcium and vitamin D in a Japanese population. Asian Pac J Cancer Prev 16: 2019-2026, 2015.
28. Panner A and Wurster RD: T-type calcium channels and tumor proliferation. Cell Calcium 40: 253-259, 2006.
29. Zhong H, De Marzo AM, Laughner E, Lim M, Hilton DA, Zagzag D, Buechler P, Isaacs WB, Semenza GL and Simons JW: Overexpression of hypoxia-inducible factor 1alpha in common human cancers and their metastases. Cancer Res 59: 5830-5835, 1999.
30. Linja MJ, Savinainen KJ, Saramäki OR, Tammela TL, Vessella RL and Visakorpi T: Amplification and overexpression of androgen receptor gene in hormone-refractory prostate cancer. Cancer Res 61: 3550-3555, 2001.
31. Gillett C, Fantl V, Smith R, Fisher C, Bartek J, Dickson C, Barnes D and Peters G: Amplification and overexpression of cyclin D1 in breast cancer detected by immunohistochemical staining. Cancer Res 54: 1812-1817, 1994.
32. Cole S, Bhardwaj G, Gerlach J, Mackie JE, Grant CE, Almquist KC, Stewart AJ, Kurz EU, Duncan AM and Deeley RG: Overexpression of a transporter gene in a multidrug-resistant human lung cancer cell line. Science 258: 1650-1654, 1992.
33. Liu TH, Guo K, Liu RQ, Zhang S, Huang ZH and Liu YK: The high expressed serum soluble neural cell adhesion molecule, a high risk factor indicating hepatic encephalopathy in hepatocelular carcinoma patients. Asian Pac J Cancer Prev 16: 3131-3135, 2015.
34. Mao YY, Jing FY, Jin MJ, Li YJ, Ding Y, Guo J, Wang FJ, Jiang LF and Chen K: rs12904 polymorphism in the 3'UTR of EFNA1 is associated with colorectal cancer susceptibility in a Chinese popu-lation. Asian Pac J Cancer Prev 14: 5037-5041, 2013.
35. Martino-Echarri E, Fernández-Rodríguez R, Rodríguez-Baena FJ, Barrientos-Durán A, Torres-Collado AX, Plaza-Calonge Mdel C, Amador-Cubero S, Cortés J, Reynolds LE, Hodivala-Dilke KM and Rodríguez-Manzaneque JC: Contribution of ADAMTS1 as a tumor suppressor gene in human breast carcinoma. Linking its tumor inhibitory properties to its proteolytic activity on nidogen-1 and nidogen-2. Int J Cancer 133: 2315-2324, 2013.
36. Li YP, Tian FG, Shi PC, Guo LY, Wu HM, Chen RQ and Xue JM: 4-Hydroxynonenal promotes growth and angiogenesis of breast cancer cells through HIF-1α stabilization. Asian Pac J Cancer Prev 15: 10151-10156, 2014.
37. Kim HS, Patel K, Muldoon-Jacobs K, Bisht KS, Aykin-Burns N, Pennington JD, van der Meer R, Nguyen P, Savage J, Owens KM, et al: SIRT3 is a mitochondria-localized tumor suppressor required for maintenance of mitochondrial integrity and metabolism during stress. Cancer Cell 17: 41-52, 2010.
38. Dziegielewska B, Gray LS and Dziegielewski J: T-type calcium channels blockers as new tools in cancer therapies. Pflugers Arch 466: 801-810, 2014.
39. Lee JY, Park SJ, Park SJ, Lee MJ, Rhim H, Seo SH and Kim KS: Growth inhibition of human cancer cells in vitro by T-type calcium channel blockers. Bioorg Med Chem Lett 16: 5014-5017, 2006.
40. Bertolesi GE, Shi CJ, Elbaum L, Jollimore C, Rozenberg G, Barnes S and Kelly ME: The Ca(2+) channel antagonists mibe-fradil and pimozide inhibit cell growth via different cytotoxic mechanisms. Mol Pharmacol 62: 210-219, 2002.
41. Toyota M, Ho C, Ohe-Toyota M, Baylin SB and Issa JP: Inactivation of CACNA1G, a T-type calcium channel gene, by aberrant methylation of its 5' CpG island in human tumors. Cancer Res 59: 4535-4541, 1999.

ONCOLOGY LETTERS 14: 2059-2074, 2017 2073
42. Díaz-Lezama N, Hernández-Elvira M, Sandoval A, Monroy A, Felix R and Monjaraz E: Ghrelin inhibits proliferation and increases T-type Ca2+ channel expression in PC-3 human prostate carcinoma cells. Biochem Biophys Res Commun 403: 24-29, 2010.
43. Wang CY, Lai MD, Phan NN, Sun ZD and Lin YC: Meta-analysis of public microarray datasets reveals voltage-gated calcium gene signatures in clinical cancer patients. PLoS One 10: e0125766, 2015.
44. Rhodes DR and Chinnaiyan AM: Integrative analysis of the cancer transcriptome. Nat Genet 37 (Suppl): S31-S37, 2005.
45. Zhou C, Ren Y, Wang K, Liu J, He JJ and Liu PJ: Intra-operative rectal washout with saline solution can effectively prevent anastomotic recurrence: A meta-analysis. Asian Pac J Cancer Prev 14: 7155-7159, 2013.
46. Alqumber MA, Dar SA, Haque S, Wahid M, Singh R and Akhter N: No association of the TGF-β1 29T/C polymorphism with breast cancer risk in caucasian and Asian populations: Evidence from a meta-analysis involving 55, 841 subjects. Asian Pac J Cancer Prev 15: 8725-8734, 2014.
47. Ni M, Chen Y, Lim E, Wimberly H, Bailey ST, Imai Y, Rimm DL, Liu XS and Brown M: Targeting androgen receptor in estrogen receptor-negative breast cancer. Cancer Cell 20: 119-131, 2011.
48. D'Ambrogio A, Nagaoka K and Richter JD: Translational control of cell growth and malignancy by the CPEBs. Nat Rev Cancer 13: 283-290, 2013.
49. Barretina J, Caponigro G, Stransky N, Venkatesan K, Margolin AA, Kim S, Wilson CJ, Lehár J, Kryukov GV, Sonkin D, et al: The cancer cell line encyclopedia enables predictive modelling of anticancer drug sensitivity. Nature 483: 603-607, 2012.
50. Er tel EA, Campbell KP, Harpold MM, Hofmann F, Mori Y, Perez-Reyes E, Schwartz A, Snutch TP, Tanabe T, Birnbaumer L, et al: Nomenclature of voltage-gated calcium channels. Neuron 25: 533-535, 2000.
51. Cain SM and Snutch TP: Voltage-gated calcium channels and disease. Biofactors 37: 197-205, 2011.
52. Bidaud I, Mezghrani A, Swayne LA, Monteil A and Lory P: Voltage-gated calcium channels in genetic diseases. Biochim Biophys Acta 1763: 1169-1174, 2006.
53. Kavianpour M, Ahmadzadeh A, Shahrabi S and Saki N: Significance of oncogenes and tumor suppressor genes in AML prognosis. Tumour Biol 37: 10041-10052, 2016.
54. Cooper GM and Hausman RE: The cell. Sinauer Associates Sunderland, 2000.
55. Sanchez-Carbayo M, Socci ND, Lozano J, Saint F and Cordon-Cardo C: Defining molecular profiles of poor outcome in patients with invasive bladder cancer using oligonucleotide microarrays. J Clin Oncol 24: 778-789, 2006.
56. Marta SC, Nicholas S, Juanjo L, Fabien S and Carlos CC: Defining molecular profiles of poor outcome in patients with invasive bladder cancer using oligonucleotide microarrays. Tumor Biol 27: 47-47, 2006.
57. Schaldemose EL, Horjales-Araujo E, Demontis D, Børglum AD, Svensson P and Finnerup NB: No association of polymorphisms in the serotonin transporter gene with thermal pain sensation in healthy individuals. Mol Pain 10: 76, 2014.
58. Stunnenberg BC, Deinum J, Links TP, Wilde AA, Franssen H and Drost G: Cardiac arrhythmias in hypokalemic periodic paralysis: Hypokalemia as only cause? Muscle Nerve 50: 327-332, 2014.
59. Beitelshees AL, Navare H, Wang D, Gong Y, Wessel J, Moss JI, Langaee TY, Cooper-DeHoff RM, Sadee W, Pepine CJ, et al: CACNA1C gene polymorphisms, cardiovascular disease outcomes, and treatment response. Circ Cardiovasc Genet 2: 362-370, 2009.
60. Baig SM, Koschak A, Lieb A, Gebhart M, Dafinger C, Nürnberg G, Ali A, Ahmad I, Sinnegger-Brauns MJ, Brandt N, et al: Loss of Cav1. 3 (CACNA1D) function in a human channelopathy with bradycardia and congenital deafness. Nat Neurosci 14: 77-84, 2011.
61. Johnson AD, Newton-Cheh C, Chasman DI, Ehret GB, Johnson T, Rose L, Rice K, Verwoert GC, Launer LJ, Gudnason V, et al: Association of hypertension drug target genes with blood pres-sure and hypertension in 86 588 individuals. Hypertension 57: 903-910, 2011.
62. Madden E: Differential gene remodeling in overweight and obese patients with heart failure, 2013.
63. Kang H, Yang X, Chen R, Zhang B, Corona E, Schadt EE and Butte AJ: Integration of disease-specific single nucleotide polymorphisms, expression quantitative trait loci and coexpres-sion networks reveal novel candidate genes for type 2 diabetes. Diabetologia 55: 2205-2213, 2012.
64. Reinbothe TM, Alkayyali S, Ahlqvist E, Tuomi T, Isomaa B, Lyssenko V and Renström E: The human L-type calcium channel Cav1. 3 regulates insulin release and polymorphisms in CACNA1D associate with type 2 diabetes. Diabetologia 56: 340-349, 2013.
65. Reinbothe T, Lyssenko V, Lang S and Renström E: Polymorphisms in CACNA1D affect insulin release and channel expression and associate with type 2 diabetes. In: 46th Annual Meeting of the European-Association-for-the-Study-of-Diabetes (EASD) Springer, p 296, 2010.
66. Qiu ZX, Zhao S, Li L and Li WM: Loss of expression of PTEN is associated with worse prognosis in patients with cancer. Asian Pac J Cancer Prev 16: 4691-4698, 2015.
67. Kamp TJ and Hell JW: Regulation of cardiac L-type calcium channels by protein kinase A and protein kinase C. Cir Res 87: 1095-1102, 2000.
68. Moosmang S, Schulla V, Welling A, Feil R, Feil S, Wegener JW, Hofmann F and Klugbauer N: Dominant role of smooth muscle L-type calcium channel Cav1. 2 for blood pressure regulation. EMBO J 22: 6027-6034, 2003.
69. Bhat S, Dao DT, Terrillion CE, Arad M, Smith RJ, Soldatov NM and Gould TD: CACNA1C (Ca v 1.2) in the pathophysiology of psychiatric disease. Prog Neurobiol 99: 1-14, 2012.
70. Sun L, Hui AM, Su Q, Vortmeyer A, Kotliarov Y, Pastorino S, Passaniti A, Menon J, Walling J, Bailey R, et al: Neuronal and glioma-derived stem cell factor induces angiogenesis within the brain. Cancer Cell 9: 287-300, 2006.
71. Murat A, Migl iavacca E, Gorl ia T, Lambiv W L, Shay T, Hamou MF, de Tribolet N, Regli L, Wick W, Kouwenhoven MC, et al: Stem cell-related ʻself-renewalʼ signature and high epidermal growth factor receptor expression associated with resistance to concomitant chemoradiotherapy in glioblastoma. J Clin Oncol 26: 3015-3024, 2008.
72. Uchitel OD, Protti DA, Sanchez V, Cherksey BD, Sugimori M and Llinás R: P-type voltage-dependent calcium channel mediates presynaptic calcium influx and transmitter release in mammalian synapses. Proc Natl Acad Sci USA 89: 3330-3333, 1992.
73. Catterall WA: Structure and function of neuronal Ca2+ chan-nels and their role in neurotransmitter release. Cell Calcium 24: 307-323, 1998.
74. Piccaluga PP, Agostinelli C, Califano A, Rossi M, Basso K, Zupo S, Went P, Klein U, Zinzani PL, Baccarani M, et al: Gene expression analysis of peripheral T cell lymphoma, unspecified, reveals distinct profiles and new potential therapeutic targets. J Clin Invest 117: 823-834, 2007.
75. Gazulla J and Tintore M: P/Q-type voltage-dependent calcium channels in neurological disease. Neurologia 22: 511-516, 2007 (In Spanish).
76. Jensen RL, Petr M and Wurster RD: Calcium channel antagonist effect on in vitro meningioma signal transduction pathways after growth factor stimulation. Neurosurgery 46: 692-703, 2000.
77. Lee YS, Sayeed MM and Wurster RD: Inhibition of cell growth and intracellular Ca2+ mobilization in human brain tumor cells by Ca2+ channel antagonists. Mol Chem Neuropathol 22: 81-95, 1994.
78. Jensen RL, Origitano TC, Lee YS, Weber M and Wurster RD: In vitro growth inhibition of growth factor-stimulated menin-gioma cells by calcium channel antagonists. Neurosurgery 36: 365-374, 1995.
79. Latour I, Louw DF, Beedle AM, Hamid J, Sutherland GR and Zamponi GW: Expression of T-type calcium channel splice vari-ants in human glioma. Glia 48: 112-119, 2004.
80. Schorge S and Rajakulendran S: The P/Q channel in human disease: untangling the genetics and physiology. WIREs Membr Transp Signal 1: 311-320, 2012.
81. Ophoff RA, Terwindt GM, Vergouwe MN, van Eijk R, Oefner PJ, Hoffman SM, Lamerdin JE, Mohrenweiser HW, Bulman DE, Ferrari M, et al: Familial hemiplegic migraine and episodic ataxia type-2 are caused by mutations in the Ca2+ channel gene CACNL1A4. Cell 87: 543-552, 1996.
82. Zhuchenko O, Bailey J, Bonnen P, Ashizawa T, Stockton DW, Amos C, Dobyns WB, Subramony SH, Zoghbi HY, Lee CC, et al: Autosomal dominant cerebellar ataxia (SCA6) associated with small polyglutamine expansions in the alpha1A-voltage-depen-dent calcium channel. Nat Genet 15: 62-69, 1997.
83. Bürk K, Kaiser FJ, Tennstedt S, Schöls L, Kreuz FR, Wieland T, Strom TM, Büttner T, Hollstein R, Braunholz D, et al: A novel missense mutation in CACNA1A evaluated by in silico protein modeling is associated with non-episodic spinocerebellar ataxia with slow progression. Eur J Med Genet 57: 207-211, 2014.
PHAN et al: EXPRESSION OF VOLTAGE-GATED CALCIUM CHANNELS IN CANCER2074
84. Sintas C, Carreño O, Corominas R, Serra SA, Vila M, Fernández-Castillo N, Toma C, Pons R, Llaneza M, Sobrido MJ, et al: Screening of cacna1a and ATP1A2 genes in hemiplegic migraine: Clinical, genetic and functional studies. J Headache Pain 14 (Suppl 1): P26, 2013.
85. Verschuur-Maes AH, de Bruin PC and van Diest PJ: Epigenetic progression of columnar cell lesions of the breast to invasive breast cancer. Breast Cancer Res Treat 136: 705-715, 2012.
86. Castro M, Grau L, Puerta P, Gimenez L, Venditti J, Quadrelli S and Sánchez-Carbayo M: Multiplexed methylation profiles of tumor suppressor genes and clinical outcome in lung cancer. J Transl Med 8: 86, 2010.
87. Burger PC, Yu I, Tihan T, et al: Atypical teratoid/rhabdoid tumor of the central nervous system: A highly malignant tumor of infancy and childhood frequently mistaken for medulloblastoma: A pedi-atric oncology group study. Am J Surg Pathol 22: 1083-1092, 1998.
88. Roderick HL and Cook SJ: Ca2+ signalling checkpoints in cancer: Remodelling Ca2+ for cancer cell proliferation and survival. Nat Rev Cancer 8: 361-375, 2008.
89. Tomlins SA, Laxman B, Varambally S, Cao X, Yu J, Helgeson BE, Cao Q, Prensner JR, Rubin MA, Shah RB, et al: Role of the TMPRSS2-ERG gene fusion in prostate cancer. Neoplasia 10: 177-188, 2008.
90. Chen R, Zeng X, Zhang R, Huang J, Kuang X, Yang J, Liu J, Tawfik O, Thrasher JB and Li B: Cav1.3 channel α1D protein is overexpressed and modulates androgen receptor transactivation in prostate cancers. Urol Oncol 32: 524-536, 2014.
91. Liu Z, Christudass C, Zhang H, et al: A novel quantitative histo-morphological tool to assess multiple biomarkers to predict prostate cancer aggression. Cancer Res 74 (19 Suppl): S4013, 2014.
92. Ricci M, Xu Y, Hammond HL, Willoughby DA, Nathanson L, Rodriguez MM, Vatta M, Lipshultz SE and Lincoln J: Myocardial alternative RNA splicing and gene expression profiling in early stage hypoplastic left heart syndrome. PLoS One 7: e29784, 2012.
93. Dutton Regester K and Hayward NK: Reviewing the somatic genetics of melanoma: From current to future analytical approaches. Pigment Cell Melanoma Res 25: 144-154, 2012.
94. Jones J, Otu H, Spentzos D, Kolia S, Inan M, Beecken WD, Fellbaum C, Gu X, Joseph M, Pantuck AJ, et al: Gene signatures of progression and metastasis in renal cell cancer. Clin Cancer Res 11: 5730-5739, 2005.
95. Ginos MA, Page GP, Michalowicz BS, Patel KJ, Volker SE, Pambuccian SE, Ondrey FG, Adams GL and Gaffney PM: Identification of a gene expression signature associated with recurrent disease in squamous cell carcinoma of the head and neck. Cancer Res 64: 55-63, 2004.
96. Estilo CL, O-charoenrat P, Talbot S, Socci ND, Carlson DL, Ghossein R, Williams T, Yonekawa Y, Ramanathan Y, Boyle JO, et al: Oral tongue cancer gene expression profiling: Identification of novel potential prognosticators by oligonucle-otide microarray analysis. BMC Cancer 9: 11, 2009.
97. Talbot SG, Estilo C, Maghami E, Sarkaria IS, Pham DK, O-charoenrat P, Socci ND, Ngai I, Carlson D, Ghossein R, et al: Gene expression profiling allows distinction between primary and metastatic squamous cell carcinomas in the lung. Cancer Res 65: 3063-3071, 2005.
98. Basso K, Margolin AA, Stolovitzky G, Klein U, Dalla-Favera R and Califano A: Reverse engineering of regulatory networks in human B cells. Nat Genet 37: 382-390, 2005.
99. Yoshihara K, Tajima A, Komata D, et al: Gene expression profiling of advanced-stage serous ovarian cancers distinguishes novel subclasses and implicates ZEB2 in tumor progression and prog-nosis. Cancer Sci 100: 1421-1428, 2009.
100. Sanchez-Carbayo M, Socci ND, Lozano J, Saint F and Cordon-Cardo C: Defining molecular profiles of poor outcome in patients with invasive bladder cancer using oligonucleotide microarrays. J Clin Oncol 24: 778-789, 2006.
101. Tomlins SA, Mehra R, Rhodes DR, et al: Integrative molecular concept modeling of prostate cancer progression. Nat Genet 39: 41-51, 2007.
102. Yusenko MV, Kuiper RP, Boethe T, Ljungberg B, van Kessel AG and Kovacs G: High-resolution DNA copy number and gene expression analyses distinguish chromophobe renal cell carci-nomas and renal oncocytomas. BMC Cancer 9: 152, 2009.
103. Frierson HF Jr, El-Naggar AK, Welsh JB, Sapinoso LM, Su AI, Cheng J, Saku T, Moskaluk CA and Hampton GM: Large scale molecular analysis identifies genes with altered expression in sali-vary adenoid cystic carcinoma. Am J Pathol 161: 1315-1323, 2002.
104. Biewenga P, Buist MR, Moerland PD, Ver Loren van Themaat E, van Kampen AH, ten Kate FJ and Baas F: Gene expression in early stage cervical cancer. Gynecol Oncol 108: 520-526, 2008.
105. Hou J, Aerts J, den Hamer B, van Ijcken W, den Bakker M, Riegman P, van der Leest C, van der Spek P, Foekens JA, Hoogsteden HC, et al: Gene expression‑based classification of non-small cell lung carcinomas and survival prediction. PLoS One 5: e10312, 2010.
106. Okayama H, Kohno T, Ishii Y, Shimada Y, Shiraishi K, Iwakawa R, Furuta K, Tsuta K, Shibata T, Yamamoto S, et al: Identification of genes upregulated in ALK-positive and EGFR/KRAS/ALK-negative lung adenocarcinomas. Cancer Res 72: 100-111, 2012.
107. Wurmbach E, Chen YB, Khitrov G, Zhang W, Roayaie S, Schwartz M, Fiel I, Thung S, Mazzaferro V, Bruix J, et al: Genome‑wide molecular profiles of HCV‑induced dysplasia and hepatocellular carcinoma. Hepatology 45: 938-947, 2007.
108. Detwiller KY, Fernando NT, Segal NH, Ryeom SW, D'Amore PA and Yoon SS: Analysis of hypoxia-related gene expression in sarcomas and effect of hypoxia on RNA interference of vascular endothelial cell growth factor A. Cancer Res 65: 5881-5889, 2005.
109. Rickman DS, Bobek MP, Misek DE, Kuick R, Blaivas M, Kurnit DM, Taylor J and Hanash SM: Distinctive molecular profiles of high‑grade and low‑grade gliomas based on oligonu-cleotide microarray analysis. Cancer Res 61: 6885-6891, 2001.
110. Shai R, Shi T, Kremen TJ, Horvath S, Liau LM, Cloughesy TF, Mischel PS and Nelson SF: Gene expression profiling identifies molecular subtypes of gliomas. Oncogene 22: 4918-4923, 2003.
111. Hong Y, Downey T, Eu KW, Koh PK and Cheah PY: A ‘metas-tasis‑prone’ signature for early‑stage mismatch‑repair proficient sporadic colorectal cancer patients and its implications for possible therapeutics. Clin Exp Metastasis 27: 83-90, 2010.
112. Sabates-Bellver J, Van der Flier LG, de Palo M, et al: Transcriptome profile of human colorectal adenomas. Mol Cancer Res 5: 1263-1275, 2007.
113. D'Errico M, de Rinaldis E, Blasi MF, Viti V, Falchetti M, Calcagnile A, Sera F, Saieva C, Ottini L, Palli D, et al: Genome-wide expression profile of sporadic gastric cancers with microsatellite instability. Eur J Cancer 45: 461-469, 2009.
114. Turashvili G, Bouchal J, Baumforth K, Wei W, Dziechciarkova M, Ehrmann J, Klein J, Fridman E, Skarda J, Srovnal J, et al: Novel markers for differentiation of lobular and ductal invasive breast carcinomas by laser microdissection and microarray analysis. BMC Cancer 7: 55, 2007.
115. Lee J, Kotliarova S, Kotliarov Y, Li A, Su Q, Donin NM, Pastorino S, Purow BW, Christopher N, Zhang W, et al: Tumor stem cells derived from glioblastomas cultured in bFGF and EGF more closely mirror the phenotype and genotype of primary tumors than do serum-cultured cell lines. Cancer Cell 9: 391-403, 2006.
116. Lee JS, Leem SH, Lee SY, Kim SC, Park ES, Kim SB, Kim SK, Kim YJ, Kim WJ and Chu IS: Expression signature of E2F1 and its associated genes predict superficial to invasive progression of bladder tumors. J Clin Oncol 28: 2660-2667, 2010.
117. Bhattacharjee A, Richards WG, Staunton J, Li C, Monti S, Vasa P, Ladd C, Beheshti J, Bueno R, Gillette M, et al: Classification of human lung carcinomas by mRNA expression profiling reveals distinct adenocarcinoma subclasses. Proc Natl Acad Sci USA 98: 13790-13795, 2001.
118. Gluck S, Ross JS, Royce M, McKenna EF Jr, Perou CM, Avisar E and Wu L: TP53 genomics predict higher clinical and pathologic tumor response in operable early-stage breast cancer treated with docetaxel-capecitabine ± trastuzumab. Breast Cancer Res Treat 132: 781-791, 2012.
119. French PJ, Swagemakers SM, Nagel JH, Kouwenhoven MC, Brouwer E, van der Spek P, Luider TM, Kros JM, van den Bent MJ and Sillevis Smitt PA: Gene expression profiles associ-ated with treatment response in oligodendrogliomas. Cancer Res 65: 11335-11344, 2005.
120. Wang Q, Wen YG, Li DP, Xia J, Zhou CZ, Yan DW, Tang HM and Peng ZH: Upregulated INHBA expression is associated with poor survival in gastric cancer. Med Oncol 29: 77-83, 2012.
121. Haslinger C, Schweifer N, Stilgenbauer S, Döhner H, Lichter P, Kraut N, Stratowa C and Abseher R: Microarray gene expression profiling of B‑cell chronic lymphocytic leukemia subgroups defined by genomic aberrations and VH mutation status. J Clin Oncol 22: 3937-3949, 2004.