Visualizing genome and systems biology: technologies ... · REVIEW Open Access Visualizing genome...
27
REVIEW Open Access Visualizing genome and systems biology: technologies, tools, implementation techniques and trends, past, present and future Georgios A. Pavlopoulos 1* , Dimitris Malliarakis 2 , Nikolas Papanikolaou 1 , Theodosis Theodosiou 1 , Anton J. Enright 3 and Ioannis Iliopoulos 1* Abstract “Α picture is worth a thousand words.” This widely used adage sums up in a few words the notion that a successful visual representation of a concept should enable easy and rapid absorption of large amounts of information. Although, in general, the notion of capturing complex ideas using images is very appealing, would 1000 words be enough to describe the unknown in a research field such as the life sciences? Life sciences is one of the biggest generators of enormous datasets, mainly as a result of recent and rapid technological advances; their complexity can make these datasets incomprehensible without effective visualization methods. Here we discuss the past, present and future of genomic and systems biology visualization. We briefly comment on many visualization and analysis tools and the purposes that they serve. We focus on the latest libraries and programming languages that enable more effective, efficient and faster approaches for visualizing biological concepts, and also comment on the future human-computer interaction trends that would enable for enhancing visualization further. Keywords: Biological data visualization, Network biology, Genomics, Systems biology, Multivariate analysis Review Introduction In the current ‘big data’ era [1], the magnitude of data explosion in life science research is undeniable. The bio- medical literature currently includes about 27 million abstracts in PubMed and about 3.5 million full text arti- cles in PubMed Central. Additionally, there are more than 300 established biological databases that store in- formation about various biological entities (bioentities) and their associations. Obvious examples include: dis- eases, proteins, genes, chemicals, pathways, small mole- cules, ontologies, sequences, structures and expression data. In the past 250 years, only 1.2 million eukaryotic species (out of the approximately 8.8 million that are es- timated to be present on earth) [2] have been identified and taxonomically classified in the Catalog of Life and the World Register of Marine Species [3]. The sequen- cing of the first human genome (2002) took 13 years and cost over $3 million to complete. Although the cost for de novo assembly of a new genome to acceptable coverage is still high, probably at least $40,000, we can now resequence a human genome for $1000 and can generate more than 320 genomes per week [4]. Notably, few species have been fully sequenced, and a large frac- tion of their gene function is not fully understood or still remains completely unknown [5]. The human genome is 3.3 billion base pairs in length and consists of over 20,000 human coding genes organized into 23 pairs of chromosomes [6, 7]. Today over 60,000 solved protein structures are hosted in the Protein Data Bank [8]. Nevertheless, many of the protein functions remain un- known or are partially understood. Shifting away from basic research to applied sciences, personalized medicine is on the cusp of a revolution allowing the customization of healthcare by tailoring decisions, practices and/or products to the individual pa- tient. To this end, such information should be accom- panied by medical history and digital images and should guarantee a high level of privacy. The efficiency and se- curity of distributed cloud computing systems for medical * Correspondence: [email protected]; [email protected] 1 Bioinformatics & Computational Biology Laboratory, Division of Basic Sciences, University of Crete, Medical School, 70013 Heraklion, Crete, Greece Full list of author information is available at the end of the article © 2015 Pavlopoulos et al. Open Access This article is distributed under the terms of the Creative Commons Attribution 4.0 International License (http://creativecommons.org/licenses/by/4.0/), which permits unrestricted use, distribution, and reproduction in any medium, provided you give appropriate credit to the original author(s) and the source, provide a link to the Creative Commons license, and indicate if changes were made. The Creative Commons Public Domain Dedication waiver (http://creativecommons.org/publicdomain/zero/1.0/) applies to the data made available in this article, unless otherwise stated. Pavlopoulos et al. GigaScience (2015) 4:38 DOI 10.1186/s13742-015-0077-2
Transcript of Visualizing genome and systems biology: technologies ... · REVIEW Open Access Visualizing genome...
REVIEW Open Access
Visualizing genome and systems biology:technologies, tools, implementation techniquesand trends, past, present and futureGeorgios A. Pavlopoulos1*, Dimitris Malliarakis2, Nikolas Papanikolaou1, Theodosis Theodosiou1,Anton J. Enright3 and Ioannis Iliopoulos1*
Abstract
“Α picture is worth a thousand words.” This widely used adage sums up in a few words the notion that a successfulvisual representation of a concept should enable easy and rapid absorption of large amounts of information.Although, in general, the notion of capturing complex ideas using images is very appealing, would 1000 words beenough to describe the unknown in a research field such as the life sciences? Life sciences is one of the biggestgenerators of enormous datasets, mainly as a result of recent and rapid technological advances; their complexitycan make these datasets incomprehensible without effective visualization methods. Here we discuss the past,present and future of genomic and systems biology visualization. We briefly comment on many visualization andanalysis tools and the purposes that they serve. We focus on the latest libraries and programming languages thatenable more effective, efficient and faster approaches for visualizing biological concepts, and also comment on thefuture human-computer interaction trends that would enable for enhancing visualization further.
Keywords: Biological data visualization, Network biology, Genomics, Systems biology, Multivariate analysis
ReviewIntroductionIn the current ‘big data’ era [1], the magnitude of dataexplosion in life science research is undeniable. The bio-medical literature currently includes about 27 millionabstracts in PubMed and about 3.5 million full text arti-cles in PubMed Central. Additionally, there are morethan 300 established biological databases that store in-formation about various biological entities (bioentities)and their associations. Obvious examples include: dis-eases, proteins, genes, chemicals, pathways, small mole-cules, ontologies, sequences, structures and expressiondata. In the past 250 years, only 1.2 million eukaryoticspecies (out of the approximately 8.8 million that are es-timated to be present on earth) [2] have been identifiedand taxonomically classified in the Catalog of Life andthe World Register of Marine Species [3]. The sequen-cing of the first human genome (2002) took 13 yearsand cost over $3 million to complete. Although the cost
for de novo assembly of a new genome to acceptablecoverage is still high, probably at least $40,000, we cannow resequence a human genome for $1000 and cangenerate more than 320 genomes per week [4]. Notably,few species have been fully sequenced, and a large frac-tion of their gene function is not fully understood or stillremains completely unknown [5]. The human genome is3.3 billion base pairs in length and consists of over20,000 human coding genes organized into 23 pairs ofchromosomes [6, 7]. Today over 60,000 solved proteinstructures are hosted in the Protein Data Bank [8].Nevertheless, many of the protein functions remain un-known or are partially understood.Shifting away from basic research to applied sciences,
personalized medicine is on the cusp of a revolutionallowing the customization of healthcare by tailoringdecisions, practices and/or products to the individual pa-tient. To this end, such information should be accom-panied by medical history and digital images and shouldguarantee a high level of privacy. The efficiency and se-curity of distributed cloud computing systems for medical
* Correspondence: [email protected]; [email protected] & Computational Biology Laboratory, Division of BasicSciences, University of Crete, Medical School, 70013 Heraklion, Crete, GreeceFull list of author information is available at the end of the article
© 2015 Pavlopoulos et al. Open Access This article is distributed under the terms of the Creative Commons Attribution4.0 International License (http://creativecommons.org/licenses/by/4.0/), which permits unrestricted use, distribution,and reproduction in any medium, provided you give appropriate credit to the original author(s) and the source,provide a link to the Creative Commons license, and indicate if changes were made. The Creative Commons PublicDomain Dedication waiver (http://creativecommons.org/publicdomain/zero/1.0/) applies to the data made available inthis article, unless otherwise stated.
Pavlopoulos et al. GigaScience (2015) 4:38 DOI 10.1186/s13742-015-0077-2
health record organization, storage and handling will beone of the big challenges during the coming years.Information overload, data interconnectivity, high di-
mensionality of data and pattern extraction also posemajor hurdles. Visualization is one way of coping withsuch data complexity. Implementation of efficient visua-lization technologies is necessary not only to present theknown but to also reveal the unknown, allowing inference
of conclusions, ideas and concepts [9]. Here we focus onvisualization advances in the fields of network and systemsbiology, present the state-of-the-art tools and provide anoverview of the technological advances over time, gaininginsights into what to expect in the future of visualizationin the life sciences.In the section on network biology below, we discuss
widely used tools related to graph visualization and
J
A
B C D
E F G
H I
Simple graph PPI network and protein complexes 3D visualization
Multi-layered graphs Hive plots Time series
Remote navigation Virtual realityPathway
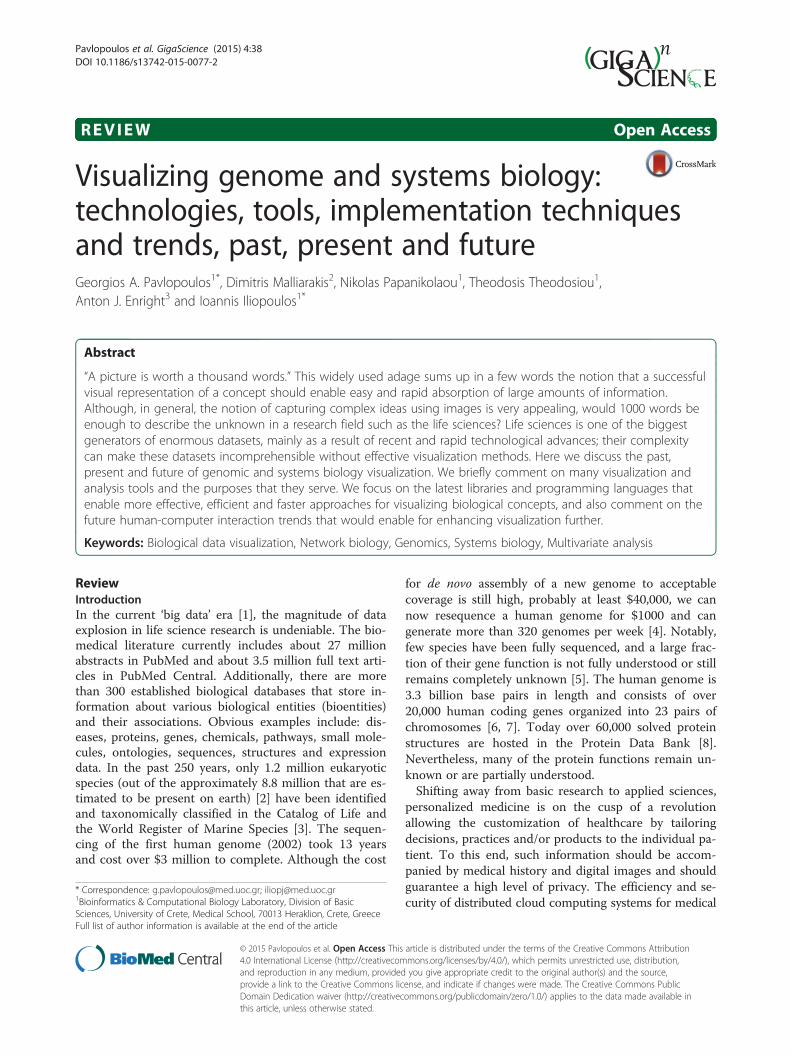
Fig. 1 Visualization for network biology. a Timeline of the emergence of relevant technologies and concepts. b A simple drawing of an undirectedunweighted graph. c A 2D representation of a yeast protein-protein interaction network visualized in Cytoscape (left) and potential protein complexesidentified by the MCL algorithm from that network (right). d A 3D view of a protein-protein interaction network visualized by BiolayoutExpress3D.e A multilayered network integrating different types of data visualized by Arena3D. f A hive plot view of a network in which nodes are mapped to andpositioned on radially distributed linear axes. g Visualization of network changes over time. h Part of lung cancer pathway visualized by iPath. i Remotenavigation and control of networks by hand gestures. j Integration and control of 3D networks using VR devices
Pavlopoulos et al. GigaScience (2015) 4:38
2
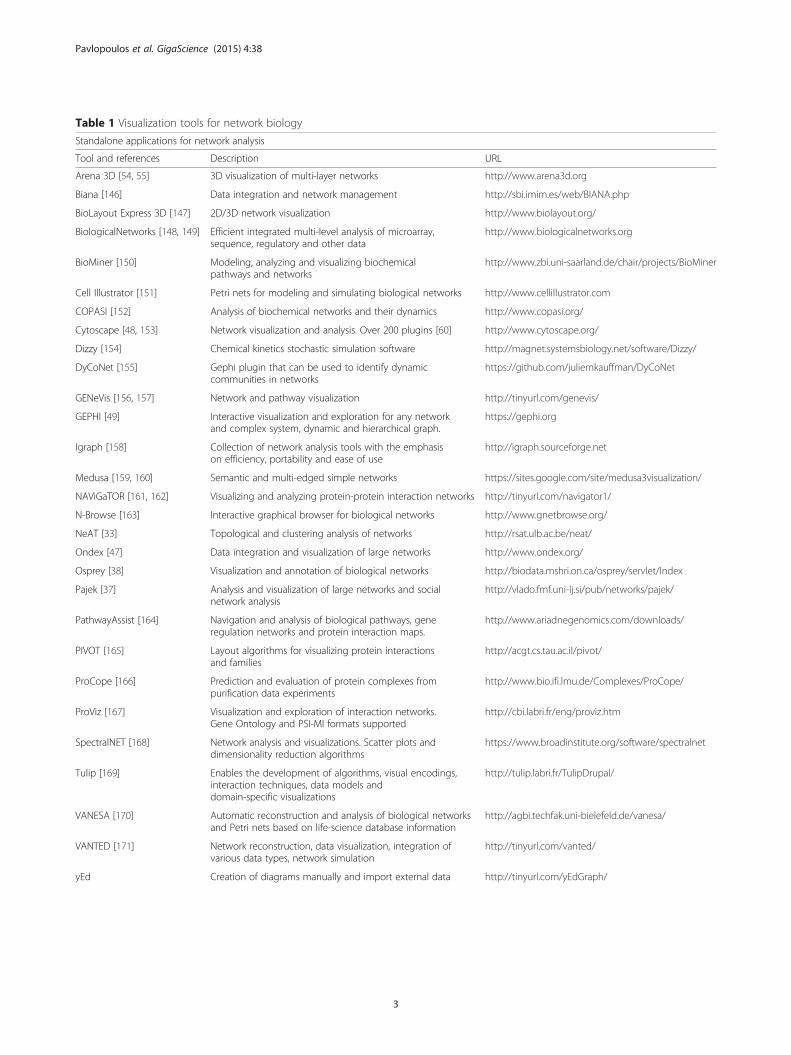
Table 1 Visualization tools for network biology
Standalone applications for network analysis
Tool and references Description URL
Arena 3D [54, 55] 3D visualization of multi-layer networks http://www.arena3d.org
Biana [146] Data integration and network management http://sbi.imim.es/web/BIANA.php
BioLayout Express 3D [147] 2D/3D network visualization http://www.biolayout.org/
BiologicalNetworks [148, 149] Efficient integrated multi-level analysis of microarray,sequence, regulatory and other data
http://www.biologicalnetworks.org
BioMiner [150] Modeling, analyzing and visualizing biochemicalpathways and networks
http://www.zbi.uni-saarland.de/chair/projects/BioMiner
Cell Illustrator [151] Petri nets for modeling and simulating biological networks http://www.cellillustrator.com
COPASI [152] Analysis of biochemical networks and their dynamics http://www.copasi.org/
Cytoscape [48, 153] Network visualization and analysis. Over 200 plugins [60] http://www.cytoscape.org/
Dizzy [154] Chemical kinetics stochastic simulation software http://magnet.systemsbiology.net/software/Dizzy/
DyCoNet [155] Gephi plugin that can be used to identify dynamiccommunities in networks
https://github.com/juliemkauffman/DyCoNet
GENeVis [156, 157] Network and pathway visualization http://tinyurl.com/genevis/
GEPHI [49] Interactive visualization and exploration for any networkand complex system, dynamic and hierarchical graph.
https://gephi.org
Igraph [158] Collection of network analysis tools with the emphasison efficiency, portability and ease of use
http://igraph.sourceforge.net
Medusa [159, 160] Semantic and multi-edged simple networks https://sites.google.com/site/medusa3visualization/
NAViGaTOR [161, 162] Visualizing and analyzing protein-protein interaction networks http://tinyurl.com/navigator1/
N-Browse [163] Interactive graphical browser for biological networks http://www.gnetbrowse.org/
NeAT [33] Topological and clustering analysis of networks http://rsat.ulb.ac.be/neat/
Ondex [47] Data integration and visualization of large networks http://www.ondex.org/
Osprey [38] Visualization and annotation of biological networks http://biodata.mshri.on.ca/osprey/servlet/Index
Pajek [37] Analysis and visualization of large networks and socialnetwork analysis
http://vlado.fmf.uni-lj.si/pub/networks/pajek/
PathwayAssist [164] Navigation and analysis of biological pathways, generegulation networks and protein interaction maps.
http://www.ariadnegenomics.com/downloads/
PIVOT [165] Layout algorithms for visualizing protein interactionsand families
http://acgt.cs.tau.ac.il/pivot/
ProCope [166] Prediction and evaluation of protein complexes frompurification data experiments
http://www.bio.ifi.lmu.de/Complexes/ProCope/
ProViz [167] Visualization and exploration of interaction networks.Gene Ontology and PSI-MI formats supported
http://cbi.labri.fr/eng/proviz.htm
SpectralNET [168] Network analysis and visualizations. Scatter plots anddimensionality reduction algorithms
https://www.broadinstitute.org/software/spectralnet
Tulip [169] Enables the development of algorithms, visual encodings,interaction techniques, data models anddomain-specific visualizations
http://tulip.labri.fr/TulipDrupal/
VANESA [170] Automatic reconstruction and analysis of biological networksand Petri nets based on life-science database information
http://agbi.techfak.uni-bielefeld.de/vanesa/
VANTED [171] Network reconstruction, data visualization, integration ofvarious data types, network simulation
http://tinyurl.com/vanted/
yEd Creation of diagrams manually and import external data http://tinyurl.com/yEdGraph/
Pavlopoulos et al. GigaScience (2015) 4:38
3
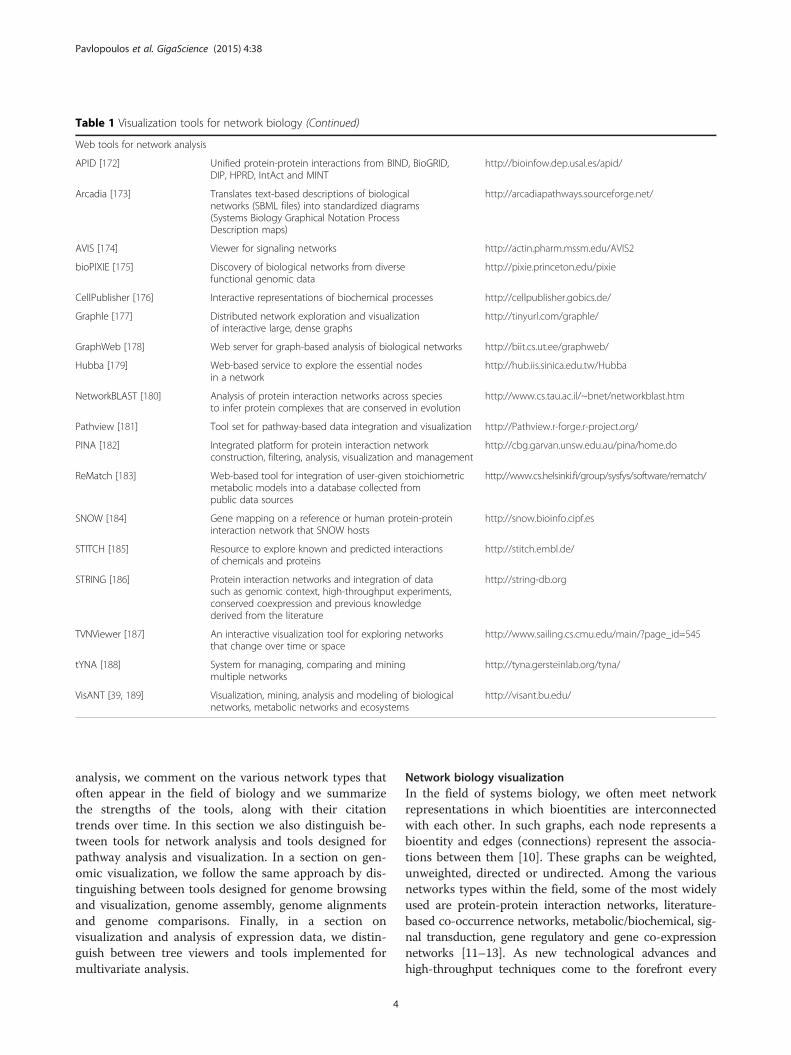
analysis, we comment on the various network types thatoften appear in the field of biology and we summarizethe strengths of the tools, along with their citationtrends over time. In this section we also distinguish be-tween tools for network analysis and tools designed forpathway analysis and visualization. In a section on gen-omic visualization, we follow the same approach by dis-tinguishing between tools designed for genome browsingand visualization, genome assembly, genome alignmentsand genome comparisons. Finally, in a section onvisualization and analysis of expression data, we distin-guish between tree viewers and tools implemented formultivariate analysis.
Network biology visualizationIn the field of systems biology, we often meet networkrepresentations in which bioentities are interconnectedwith each other. In such graphs, each node represents abioentity and edges (connections) represent the associa-tions between them [10]. These graphs can be weighted,unweighted, directed or undirected. Among the variousnetworks types within the field, some of the most widelyused are protein-protein interaction networks, literature-based co-occurrence networks, metabolic/biochemical, sig-nal transduction, gene regulatory and gene co-expressionnetworks [11–13]. As new technological advances andhigh-throughput techniques come to the forefront every
Table 1 Visualization tools for network biology (Continued)
Web tools for network analysis
APID [172] Unified protein-protein interactions from BIND, BioGRID,DIP, HPRD, IntAct and MINT
http://bioinfow.dep.usal.es/apid/
Arcadia [173] Translates text-based descriptions of biologicalnetworks (SBML files) into standardized diagrams(Systems Biology Graphical Notation ProcessDescription maps)
http://arcadiapathways.sourceforge.net/
AVIS [174] Viewer for signaling networks http://actin.pharm.mssm.edu/AVIS2
bioPIXIE [175] Discovery of biological networks from diversefunctional genomic data
http://pixie.princeton.edu/pixie
CellPublisher [176] Interactive representations of biochemical processes http://cellpublisher.gobics.de/
Graphle [177] Distributed network exploration and visualizationof interactive large, dense graphs
http://tinyurl.com/graphle/
GraphWeb [178] Web server for graph-based analysis of biological networks http://biit.cs.ut.ee/graphweb/
Hubba [179] Web-based service to explore the essential nodesin a network
http://hub.iis.sinica.edu.tw/Hubba
NetworkBLAST [180] Analysis of protein interaction networks across speciesto infer protein complexes that are conserved in evolution
http://www.cs.tau.ac.il/~bnet/networkblast.htm
Pathview [181] Tool set for pathway-based data integration and visualization http://Pathview.r-forge.r-project.org/
PINA [182] Integrated platform for protein interaction networkconstruction, filtering, analysis, visualization and management
http://cbg.garvan.unsw.edu.au/pina/home.do
ReMatch [183] Web-based tool for integration of user-given stoichiometricmetabolic models into a database collected frompublic data sources
http://www.cs.helsinki.fi/group/sysfys/software/rematch/
SNOW [184] Gene mapping on a reference or human protein-proteininteraction network that SNOW hosts
http://snow.bioinfo.cipf.es
STITCH [185] Resource to explore known and predicted interactionsof chemicals and proteins
http://stitch.embl.de/
STRING [186] Protein interaction networks and integration of datasuch as genomic context, high-throughput experiments,conserved coexpression and previous knowledgederived from the literature
http://string-db.org
TVNViewer [187] An interactive visualization tool for exploring networksthat change over time or space
http://www.sailing.cs.cmu.edu/main/?page_id=545
tYNA [188] System for managing, comparing and miningmultiple networks
http://tyna.gersteinlab.org/tyna/
VisANT [39, 189] Visualization, mining, analysis and modeling of biologicalnetworks, metabolic networks and ecosystems
http://visant.bu.edu/
Pavlopoulos et al. GigaScience (2015) 4:38
4
few years, such networks can increase dramatically in sizeand complexity, and therefore more efficient algorithmsfor analysis and visualization are necessary. Notably, a net-work consisting of a hundred nodes and connections isincomprehensible and impossible for a human to visually
analyze. For example, techniques such as tandem affinitypurification (TAP) [14], yeast two hybrid (Y2H) [15] andmass spectrometry [16] can nowadays generate a signifi-cant fraction of the physical interactions of a proteome. Asnetwork biology evolves over time, we indicate standard
Table 2 Visualization tools for pathways
Standalone applications
Tool and references Description URL
BiNA [190] Drawings of metabolic networks supporting hiding of cofactors anddrawing of chemical structures
http://bina.unipax.info/
BioTapestry [191] Interactive tool for building, visualizing and sharing gene regulatorynetwork models over the web
http://www.biotapestry.org/
Caleydo [192] Visual analysis framework targeted at biomolecular data. Visualization ofinterdependencies between multiple datasets
http://www.caleydo.org/
CellDesigner [193] A modeling tool for biochemical networks http://www.celldesigner.org/
Edinburgh Pathway Editor [194] Edit and draw pathway diagrams http://epe.sourceforge.net/SourceForge/EPE.html
GenMAPP [195] Visualization of gene expression and other genomic data on mapsrepresenting biological pathways and groupings of genes
http://www.genmapp.org/
Ingenuity IPA Data integration platform and manually annotated pathways http://tinyurl.com/IngenuityPath
JDesigner [196] Graphical modeling environment for biochemical reaction networks http://jdesigner.sourceforge.net/Site/JDesigner.html
KaPPA View [197] Plant pathways http://kpv.kazusa.or.jp/
KEGG Atlas [198] Interactive Kyoto Encyclopedia of Genes and Genomes pathways http://www.genome.jp/kegg/
Omix [199] Visualizing multi-omics data in metabolic networks https://www.omix-visualization.com
PathVisio [52] Biological pathway analysis software that allows drawing, editing andanalysis of biological pathways
http://www.pathvisio.org/
VitaPad [200] Application to visualize biological pathways and map experimentaldata to them
http://tinyurl.com/vitapad/
Web tools for pathways
ArrayXPath [201] Mapping and visualizing microarray gene-expression data andintegrated biological pathway resources using SVG
http://tinyurl.com/ArrayXPath/
GEPAT [202] Integrated analysis of transcriptome data in genomic, proteomic andmetabolic contexts
http://gepat.sourceforge.net/
iPath [50, 203] Web-based tool for the visualization, analysis and customization ofpathway maps
http://pathways.embl.de/
Kegg-Based Viewer [204] KEGG-based pathway visualization tool for complex high-throughput data http://www.g-language.org/data/marray/
MapMan [61] User-driven tool that displays large datasets onto diagrams ofmetabolic pathways or other processes
http://mapman.gabipd.org/web/guest/mapman
MetPA [205] Analysis and visualization of metabolomic data within the biologicalcontext of metabolic pathways
http://metpa.metabolomics.ca
Omics Viewer [206] Data mapping on BioCyc pathways (collection of 5500 pathway/genome databases)
http://www.biocyc.org/
Pathway Explorer [207] Interactive Java drawing tool for the construction of biologicalpathway diagrams in a visual way and the annotation of thecomponents and interactions between them
http://genome.tugraz.at/pathwayexplorer/pathwayexplorer_description.shtml
Pathway projector [208] Zoomable pathway browser using KEGG atlas and Google Maps API http://www.g-language.org/PathwayProjector/
PATIKA [51] Integrated environment composed of a central database and a visualeditor, built around an extensive ontology and an integration framework
http://www.cs.bilkent.edu.tr/~patikaweb/
Reactome SkyPainter [62] Visualization of over-represented pathways and reactions from gene lists http://www.reactome.org/skypainter-2
WikiPathways [209] Wiki-based, open, public platform dedicated to the curation ofbiological pathways by and for the scientific community
http://www.wikipathways.org/
Pavlopoulos et al. GigaScience (2015) 4:38
5
procedures that were developed over the past 20 years andhighlight key tools and methodologies that had a crucialrole in this maturation process (Fig. 1).In the 1990s, two-dimensional (2D) static graph lay-
outs were developed for visualizing networks. Topo-logical analysis, layout and clustering were pre-calculated and results were captured in a single staticimage. Clustering analysis was performed to detect cli-ques or highly connected regions within a graph, layouttechniques such as Fruchterman-Reingold [17] were im-plemented to place nodes in positions where the cross-overs between the edges are minimized and topologicalanalysis was used for detecting important nodes of thenetwork such as hubs or nodes with high betweennesscentrality. The typical visual encoding consisted of usingarrows for directed graphs, adjusting the thickness of anedge to show the importance of a connection, using thesame color for nodes that belong to the same cluster ormodifying the node’s size to show its topological fea-tures, such as its neighbor connectivity. As integrativebiology and high-throughput techniques advanced overthe years, the necessity to move away from static imagesand add interactivity and navigation for easier data ex-ploration became clearer.
Bridging between analysis and visualization becamenecessary, and tools that incorporated both increasedthe standards in the field. In clustering analysis, for ex-ample, new computational methods such as MCL [18]and variations [19], Cfinder [20], MCODE [21], Clique[22] and others were applied to biological networks tofind highly connected regions of importance. DECAFF[23], SWEMODE [24] or STM [25], for example, weredeveloped to predict protein complexes [26] incorporat-ing graph annotations, whereas others such as DMSP[27], GFA [28] and MATISSE [29] were focused ongene-expression data. Most of these algorithms werecommand-line-based and only few tools such as jClust[30], GIBA [31], ClusterMaker [32] or NeAT [33] havebeen developed to integrate data in visual environments.These aforementioned techniques along with others arethoroughly discussed elsewhere [26, 34–36].Although most network visualization tools are standa-
lone applications, they guarantee efficient data explorationand the manipulation of visualization with mouse-hovering supporting actions. Such tools are for examplethe Pajek [37], Osprey [38], VisANT [39] and others.Next-generation visualization tools took advantage ofstandard file formats such as BioPAX [40, 41], SBML [42],
A B
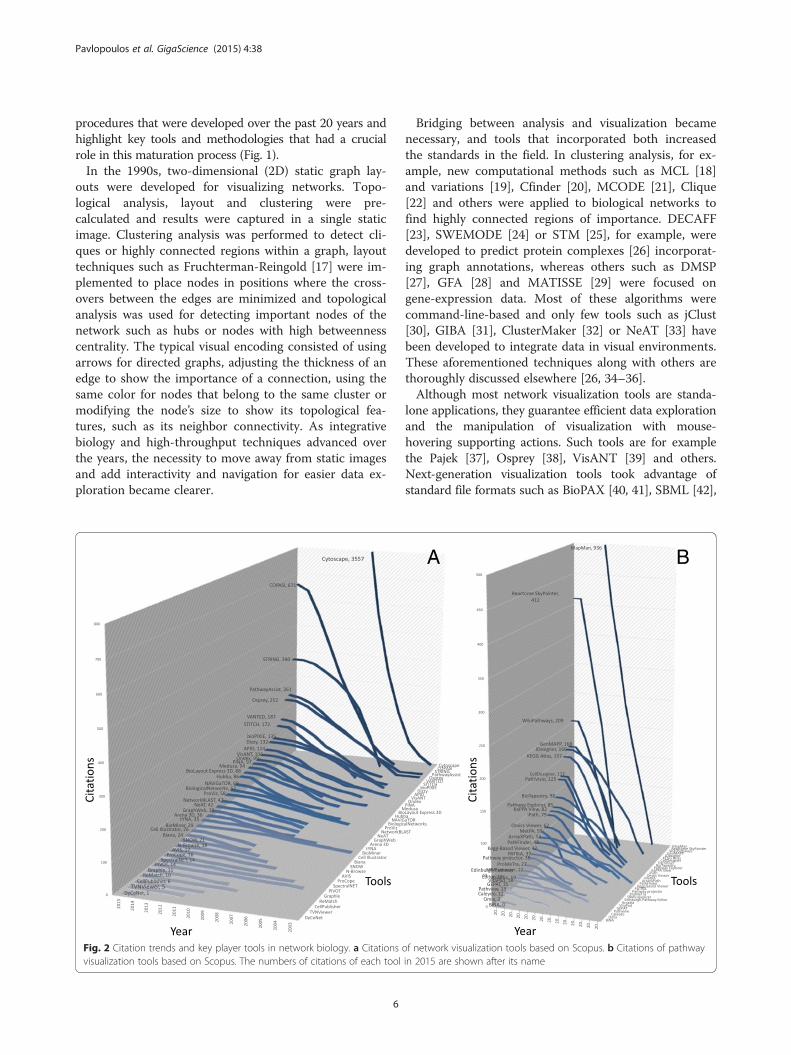
Fig. 2 Citation trends and key player tools in network biology. a Citations of network visualization tools based on Scopus. b Citations of pathwayvisualization tools based on Scopus. The numbers of citations of each tool in 2015 are shown after its name
Pavlopoulos et al. GigaScience (2015) 4:38
6
PSI-MI [43] and CellML [44]; modern, more sophisticatedlayouts such as Hive-Plots [45]; and the available webservices and data integration techniques to directly retrieveand handle information from public repositories on the fly.Functional enrichment of genes using the Gene Ontology(GO) repository [46] is a typical example. Among others,current state-of-the-art tools are the Ondex [47], Cytoscape[48] or Gephi [49], while tools such as iPath [50], PATIKA[51], PathVisio [52] and others [53] are pathway specific.As biological networks became larger over time, con-
sisting of thousands of nodes and connections, the so-called ‘hairball’ effect, where many nodes are denselyconnected with each other became very difficult to copewith. A partial solution to this was to shift from 2D rep-resentations to three-dimensional (3D) representations.Tools such as Arena3D [54, 55] or BioLayout Express
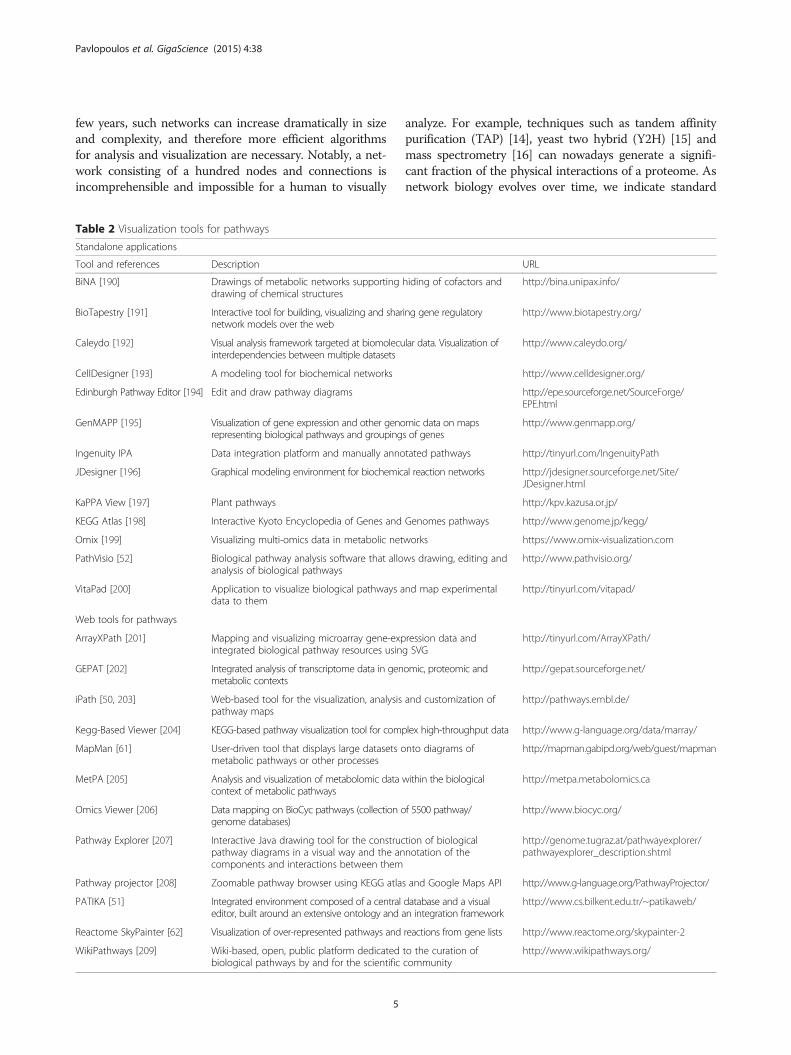
3D [56] take advantage of 3D space to show data in avirtual 3D universe. BioLayout Express uses whole 3Dspace to visualize networks, whereas Arena3D imple-ments a multilayered concept to present 2D networks ina stack. Although a 2D network allows immediate visualfeedback, a 3D rendering usually requires the user tointeract more with the data in a more explorative mode,but can help reveal interesting features potentially hid-den in a 2D representation. Although it is debatablewhether 3D rendering is better than 2D visualization,hardware acceleration and performance still need to betaken into account when planning 3D visualizations(Fig. 1).Tables 1 and 2 present currently freely available net-
work and pathway visualization tools and their maincharacteristics. However, it is not the purpose of this
A
B
Blast hits Genome browser
Genome assembly
Unordered reads
Aligned reads
Genome
D
Normal karyotype
C
E
Genomic variations
F
Time series
Time
G
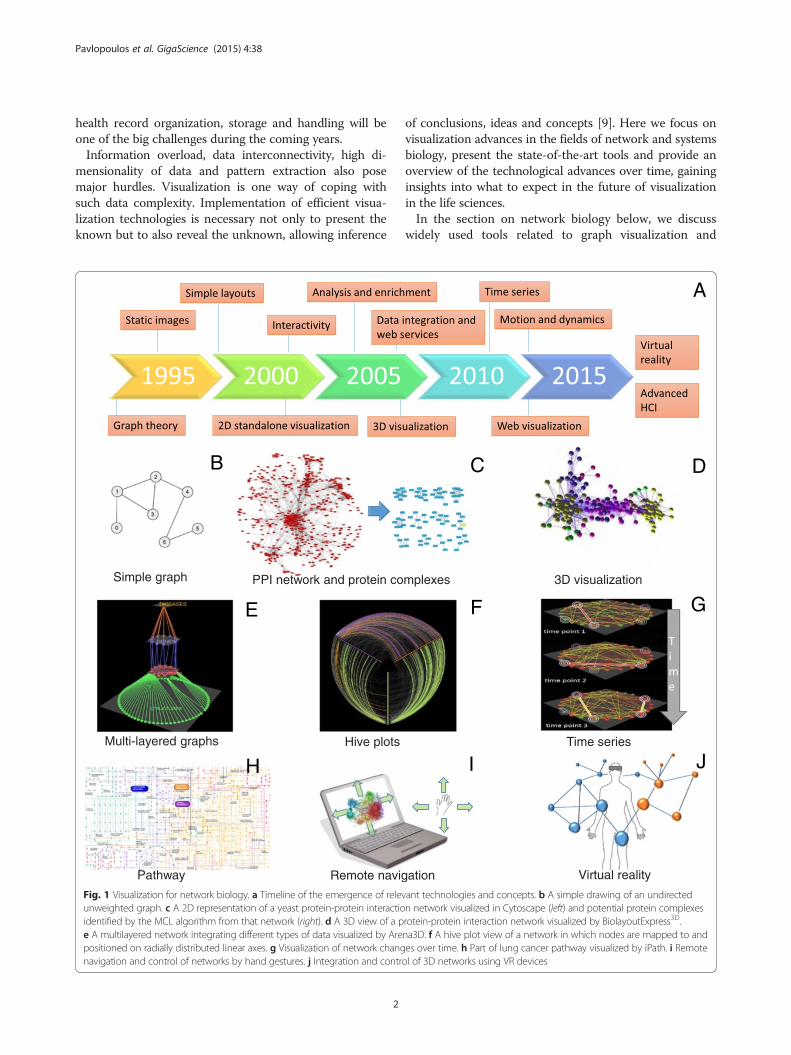
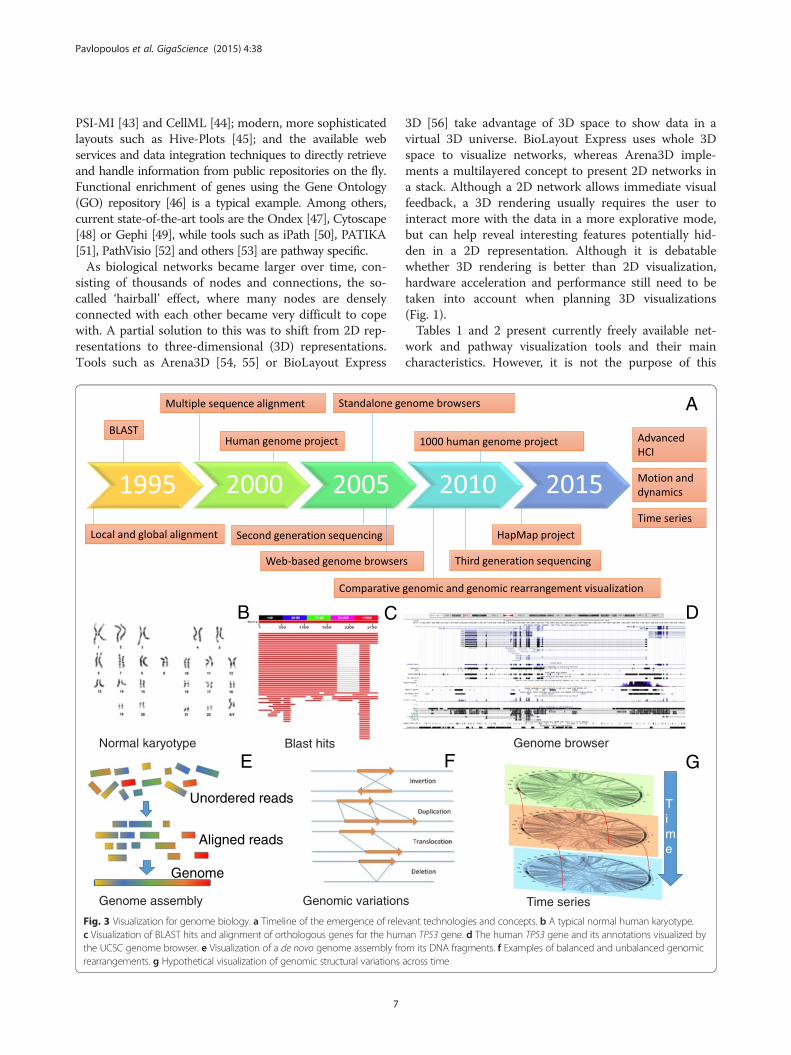
Fig. 3 Visualization for genome biology. a Timeline of the emergence of relevant technologies and concepts. b A typical normal human karyotype.c Visualization of BLAST hits and alignment of orthologous genes for the human TP53 gene. d The human TP53 gene and its annotations visualized bythe UCSC genome browser. e Visualization of a de novo genome assembly from its DNA fragments. f Examples of balanced and unbalanced genomicrearrangements. g Hypothetical visualization of genomic structural variations across time
Pavlopoulos et al. GigaScience (2015) 4:38
7
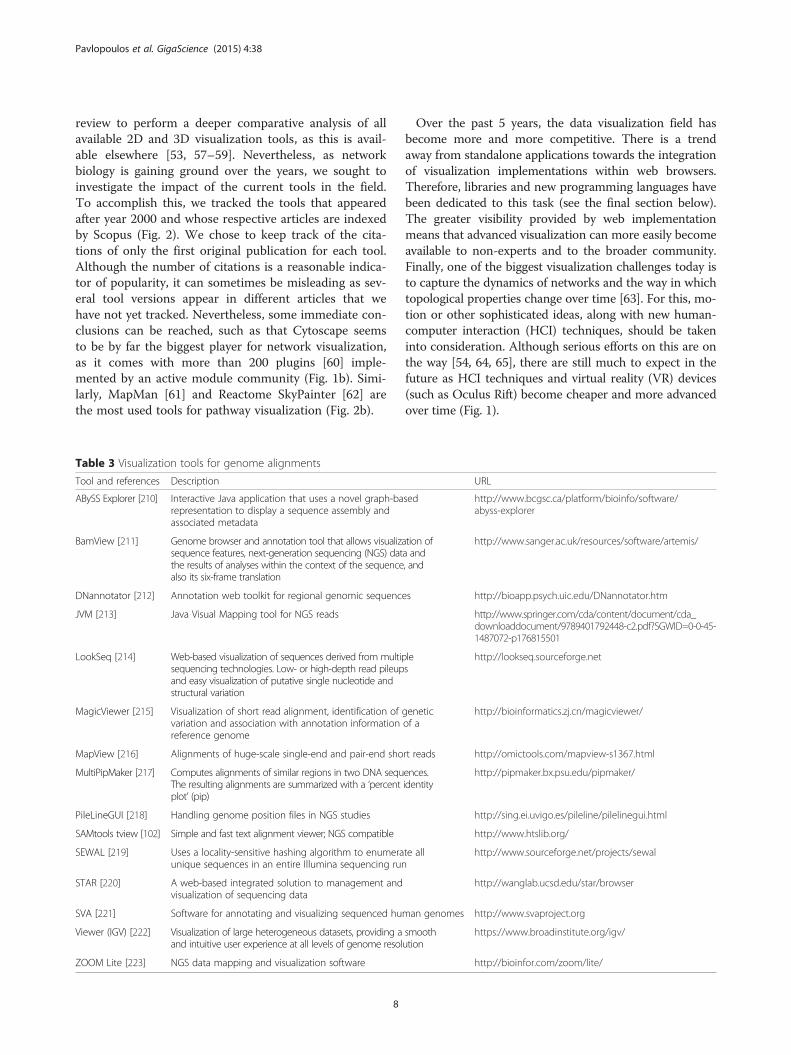
review to perform a deeper comparative analysis of allavailable 2D and 3D visualization tools, as this is avail-able elsewhere [53, 57–59]. Nevertheless, as networkbiology is gaining ground over the years, we sought toinvestigate the impact of the current tools in the field.To accomplish this, we tracked the tools that appearedafter year 2000 and whose respective articles are indexedby Scopus (Fig. 2). We chose to keep track of the cita-tions of only the first original publication for each tool.Although the number of citations is a reasonable indica-tor of popularity, it can sometimes be misleading as sev-eral tool versions appear in different articles that wehave not yet tracked. Nevertheless, some immediate con-clusions can be reached, such as that Cytoscape seemsto be by far the biggest player for network visualization,as it comes with more than 200 plugins [60] imple-mented by an active module community (Fig. 1b). Simi-larly, MapMan [61] and Reactome SkyPainter [62] arethe most used tools for pathway visualization (Fig. 2b).
Over the past 5 years, the data visualization field hasbecome more and more competitive. There is a trendaway from standalone applications towards the integrationof visualization implementations within web browsers.Therefore, libraries and new programming languages havebeen dedicated to this task (see the final section below).The greater visibility provided by web implementationmeans that advanced visualization can more easily becomeavailable to non-experts and to the broader community.Finally, one of the biggest visualization challenges today isto capture the dynamics of networks and the way in whichtopological properties change over time [63]. For this, mo-tion or other sophisticated ideas, along with new human-computer interaction (HCI) techniques, should be takeninto consideration. Although serious efforts on this are onthe way [54, 64, 65], there are still much to expect in thefuture as HCI techniques and virtual reality (VR) devices(such as Oculus Rift) become cheaper and more advancedover time (Fig. 1).
Table 3 Visualization tools for genome alignments
Tool and references Description URL
ABySS Explorer [210] Interactive Java application that uses a novel graph-basedrepresentation to display a sequence assembly andassociated metadata
http://www.bcgsc.ca/platform/bioinfo/software/abyss-explorer
BamView [211] Genome browser and annotation tool that allows visualization ofsequence features, next-generation sequencing (NGS) data andthe results of analyses within the context of the sequence, andalso its six-frame translation
http://www.sanger.ac.uk/resources/software/artemis/
DNannotator [212] Annotation web toolkit for regional genomic sequences http://bioapp.psych.uic.edu/DNannotator.htm
JVM [213] Java Visual Mapping tool for NGS reads http://www.springer.com/cda/content/document/cda_downloaddocument/9789401792448-c2.pdf?SGWID=0-0-45-1487072-p176815501
LookSeq [214] Web-based visualization of sequences derived from multiplesequencing technologies. Low- or high-depth read pileupsand easy visualization of putative single nucleotide andstructural variation
http://lookseq.sourceforge.net
MagicViewer [215] Visualization of short read alignment, identification of geneticvariation and association with annotation information of areference genome
http://bioinformatics.zj.cn/magicviewer/
MapView [216] Alignments of huge-scale single-end and pair-end short reads http://omictools.com/mapview-s1367.html
MultiPipMaker [217] Computes alignments of similar regions in two DNA sequences.The resulting alignments are summarized with a ‘percent identityplot’ (pip)
http://pipmaker.bx.psu.edu/pipmaker/
PileLineGUI [218] Handling genome position files in NGS studies http://sing.ei.uvigo.es/pileline/pilelinegui.html
SAMtools tview [102] Simple and fast text alignment viewer; NGS compatible http://www.htslib.org/
SEWAL [219] Uses a locality-sensitive hashing algorithm to enumerate allunique sequences in an entire Illumina sequencing run
http://www.sourceforge.net/projects/sewal
STAR [220] A web-based integrated solution to management andvisualization of sequencing data
http://wanglab.ucsd.edu/star/browser
SVA [221] Software for annotating and visualizing sequenced human genomes http://www.svaproject.org
Viewer (IGV) [222] Visualization of large heterogeneous datasets, providing a smoothand intuitive user experience at all levels of genome resolution
https://www.broadinstitute.org/igv/
ZOOM Lite [223] NGS data mapping and visualization software http://bioinfor.com/zoom/lite/
Pavlopoulos et al. GigaScience (2015) 4:38
8
Visualization in genomicsThere remain many open challenges for advancedvisualization for genome assemblies, alignments, polymor-phisms, variations, synteny, single nucleotide polymor-phisms (SNPs), rearrangements and annotations [66, 67].To better follow progress in the visualization field, we firstneed to follow the way in which new technologies, ques-tions and trends have been shaped over the years (Fig. 3).Up to the 1990s, local and global pairwise and mul-
tiple sequence alignment algorithms such as Smith-Waterman [68], Needleman-Wunsch [69], FASTA [70]and BLAST [71] were the focus of bioinformaticsmethods development. Multiple sequence alignmenttools such as the ClustalW/Clustal X [72], MUSCLE[73], T-Coffee [74] and others [75] used basic visualizationschemes, in which sequences were represented as stringsplaced vertically in stacks. Colors were used to visuallyencode base conservation and to indicate matching, non-matching and similar nucleotides [76, 77].Although these tools were successful for small num-
bers of nucleotide or protein sequences, a question wasraised regarding their applicability to whole-genome se-quencing and comparison. A few years later (2002), theSanger (dideoxy) first generation sequencing, particularlycapillary approaches, allowed the sequencing of the firstwhole human genome, consisting of about 3 billion basepairs and over 20,000 human genes [78, 79]. Shortly afterthat, second-generation (Illumina [80], Roche/454 [81],Biosystems/SOLiD [82]) and third-generation techniques(Helicos BioSciences [83], Pacific Biosciences [84], OxfordNanopore [85] and Complete Genomics [86]) high-throughput sequencing techniques [87–91] allowed thesequencing of a transcriptome, an exome or a whole
genome at a much lower cost and within reasonabletimeframes.Projects such as the 1000 Genomes Project, for com-
prehensive human genetic variation analysis [92–94],and the International HapMap Project [95–99], for theidentification of common genetic variations amongpeople from different countries, are just a few examplesof the data explosion that has taken place in the era ofcomparative genomics, after 2005. Such large-scalegenomic datasets necessitate powerful tools to link gen-omic data to its source genome and across genomes.Therefore, among others [66], widely used standaloneand web-based genome browsers were dedicated to in-formation handling, genome visualization, navigation,exploration and integration with annotations from va-rious repositories. At present, many specialized tools forcomparative genomic visualization are available and arewidely used.To follow trends in the field, we summarize the tools
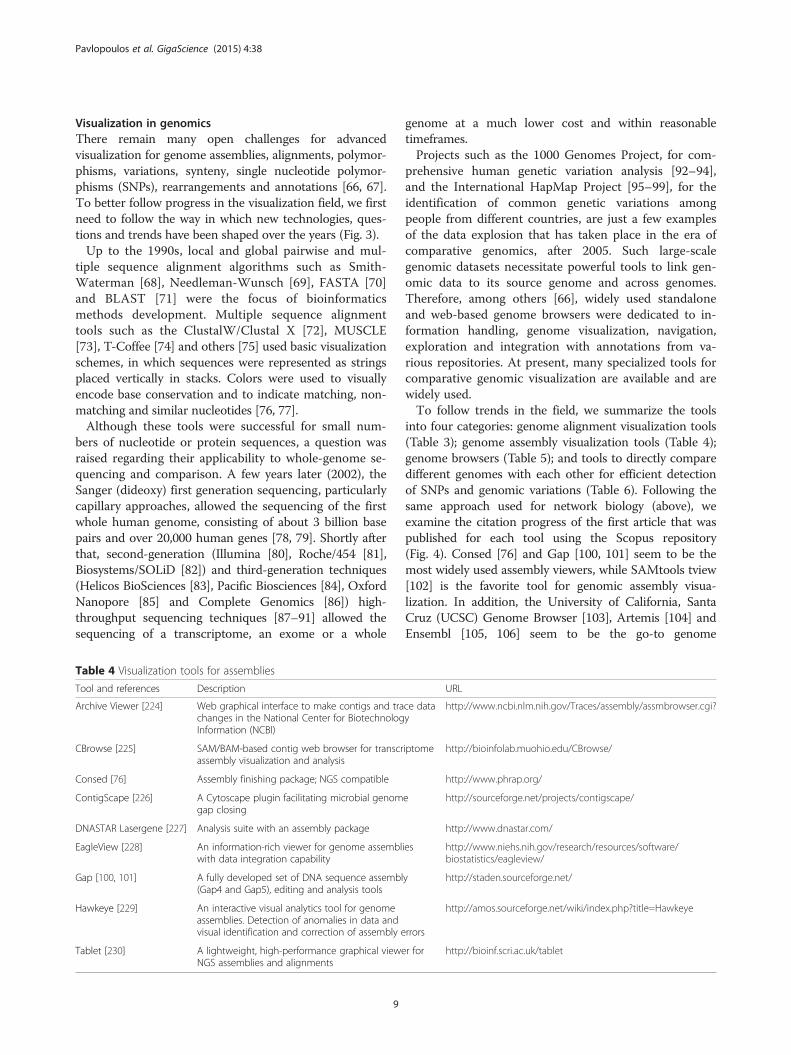
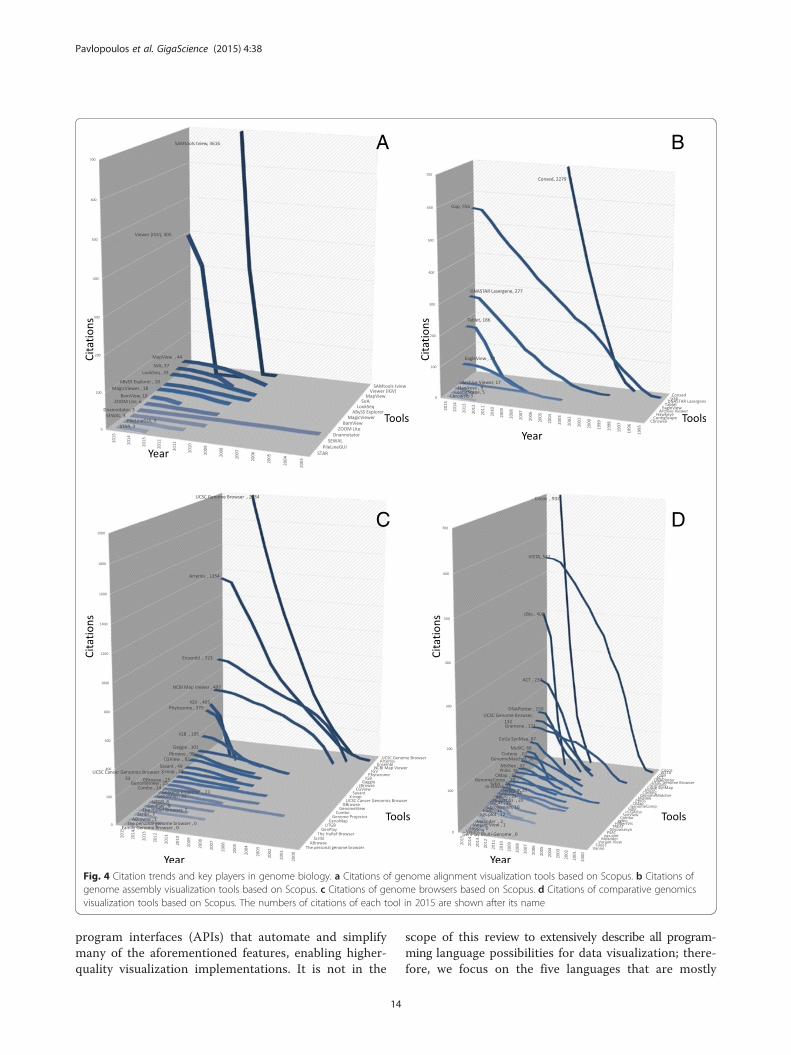
into four categories: genome alignment visualization tools(Table 3); genome assembly visualization tools (Table 4);genome browsers (Table 5); and tools to directly comparedifferent genomes with each other for efficient detectionof SNPs and genomic variations (Table 6). Following thesame approach used for network biology (above), weexamine the citation progress of the first article that waspublished for each tool using the Scopus repository(Fig. 4). Consed [76] and Gap [100, 101] seem to be themost widely used assembly viewers, while SAMtools tview[102] is the favorite tool for genomic assembly visua-lization. In addition, the University of California, SantaCruz (UCSC) Genome Browser [103], Artemis [104] andEnsembl [105, 106] seem to be the go-to genome
Table 4 Visualization tools for assemblies
Tool and references Description URL
Archive Viewer [224] Web graphical interface to make contigs and trace datachanges in the National Center for BiotechnologyInformation (NCBI)
http://www.ncbi.nlm.nih.gov/Traces/assembly/assmbrowser.cgi?
CBrowse [225] SAM/BAM-based contig web browser for transcriptomeassembly visualization and analysis
http://bioinfolab.muohio.edu/CBrowse/
Consed [76] Assembly finishing package; NGS compatible http://www.phrap.org/
ContigScape [226] A Cytoscape plugin facilitating microbial genomegap closing
http://sourceforge.net/projects/contigscape/
DNASTAR Lasergene [227] Analysis suite with an assembly package http://www.dnastar.com/
EagleView [228] An information-rich viewer for genome assemblieswith data integration capability
http://www.niehs.nih.gov/research/resources/software/biostatistics/eagleview/
Gap [100, 101] A fully developed set of DNA sequence assembly(Gap4 and Gap5), editing and analysis tools
http://staden.sourceforge.net/
Hawkeye [229] An interactive visual analytics tool for genomeassemblies. Detection of anomalies in data andvisual identification and correction of assembly errors
http://amos.sourceforge.net/wiki/index.php?title=Hawkeye
Tablet [230] A lightweight, high-performance graphical viewer forNGS assemblies and alignments
http://bioinf.scri.ac.uk/tablet
Pavlopoulos et al. GigaScience (2015) 4:38
9
Table 5 Genome browsers
Tool and references Description URL Web-based orstandalone
ABrowse [231] A customizable genome browser framework http://www.abrowse.org/ Web-based
AnnoJ [232] A web 2.0 application designed for visualizing deepsequencing data and other genome annotation data
http://www.annoj.org/ Web-based
Argo Java tool for visualizing and manually annotatingwhole genomes
http://www.broadinstitute.org/annotation/argo/ Standalone
Artemis [104] Browser and annotation tool that allows visualizationof sequence features, data and the results of analyseswithin the context of the sequence, and also itssix-frame translation
https://www.sanger.ac.uk/resources/software/artemis/
Standalone
CGView [233] Static and interactive graphical maps of circulargenomes using a circular layout
https://www.gview.ca/wiki/GView/ Standalone
Combo [234] Dynamic browser to visualize alignments of wholegenomes and their associated annotations
http://www.broad.mit.edu/annotation/argo/ Standalone
Ensembl [105, 106] Annotation, analysis and display of vertebrates andother eukaryotic species
http://www.ensembl.org/ Web-based
Family GenomeBrowser [235]
Visualizing genomes with pedigree information http://mlg.hit.edu.cn/FGB/ Web-based
Gaggle [236] Genome browser within an analysis framework;good microarray support
http://gaggle.systemsbiology.net/ Standalone
GBrowse [237, 238] A combination of database and interactive webpages for manipulating and displaying annotationson genomes
http://gmod.org/wiki/Gbrowse Web-based
GenoMap [239] A circular genome data viewer http://nsato4.c.u-tokyo.ac.jp/old/GenoMap/GenoMap.html
Standalone
Genome Projector [240] Circular genome maps, traditional genome maps,plasmid maps, biochemical pathways maps and DNAwalks. Google API
http://www.g-language.org/GenomeProjector/ Web-based
GenomeView [241] Designed to visualize and manipulate a multitude ofgenomics data
http://genomeview.org/content/integration Standalone
GenPlay [242] A multipurpose genome analyzer and browser http://www.genplay.net Standalone
IGB [243] Optimized to achieve maximum flexibility and highquality genome visualization
http://genoviz.sourceforge.net/ Standalone
IGV [222] A high-performance visualization tool for interactiveexploration of large, integrated genomic datasets
http://www.broadinstitute.org/igv/ Standalone
JBrowse [244] A fast, embeddable genome browser built completelywith JavaScript and HTML5
http://jbrowse.org/ Web-based
JGI Supports live annotation; primary portal for DOE JointGenomics Institute genome projects
http://genome.jgi-psf.org/ Web-based
NCBI GenomeWorkbench
An integrated application for viewing and analyzingsequence data
http://www.ncbi.nlm.nih.gov/tools/gbench/ Standalone
NCBI Map Viewer [245] Vertically oriented viewer; integrated with NCBIresources and tools
http://www.ncbi.nlm.nih.gov/mapview/ Web-based
Phytozome [246] A comparative platform for green plant genomics http://www.phytozome.net Web-based
Savant [247] It was primarily developed for visualizing sequencingdata, although it can be used to visualize almost anygenome-based sequence, point, interval orcontinuous dataset
http://compbio.cs.toronto.edu/savant Standalone
Scribl [248] An HTML5 Canvas-based graphics library for visualizinggenomic data over the web
http://chmille4.github.com/Scribl/ Web-based
The HuRef Browser [249] A web resource for individual human genomics http://huref.jcvi.org Web-based
The personal genomebrowser [250]
Visualizing functions of genetic variants http://www.pgbrowser.org/ Web-based
Pavlopoulos et al. GigaScience (2015) 4:38
10
browsers, while Circos [107], VISTA [108] and cBio [109]are the most widely used tools for comparative genomics.Although tremendous progress has been made in gen-
omic visualization and very large amounts of moneyhave been invested in such projects, genome browsers[110] still need to address major problems. One of thebiggest challenges is the integration of data in differentformats (such as genomic and clinical data) as societyenters the personalized medicine era. Furthermore, navi-gation at different resolution or granularity levels andsmooth scaling are necessary as long as simultaneouscomparisons across millions of elements [111] remains abottleneck. Newer infrastructure and software that allowon-the-fly calculations both in the front end and theback end would definitely be a step forward. Finally,similarly to network biology, time-series data visua-lization is one of the great challenges. For example, in ahypothetical scenario in which it is required to followgenomic rearrangements over time during tumor devel-opment, time-series data visualization would be an in-valuable tool. Motion integration and visualization usingadditional dimensions could be possible solutions. Over-all, it would be unrealistic to expect an ideal universalgenome browser that serves all the possible purposes inthe field.
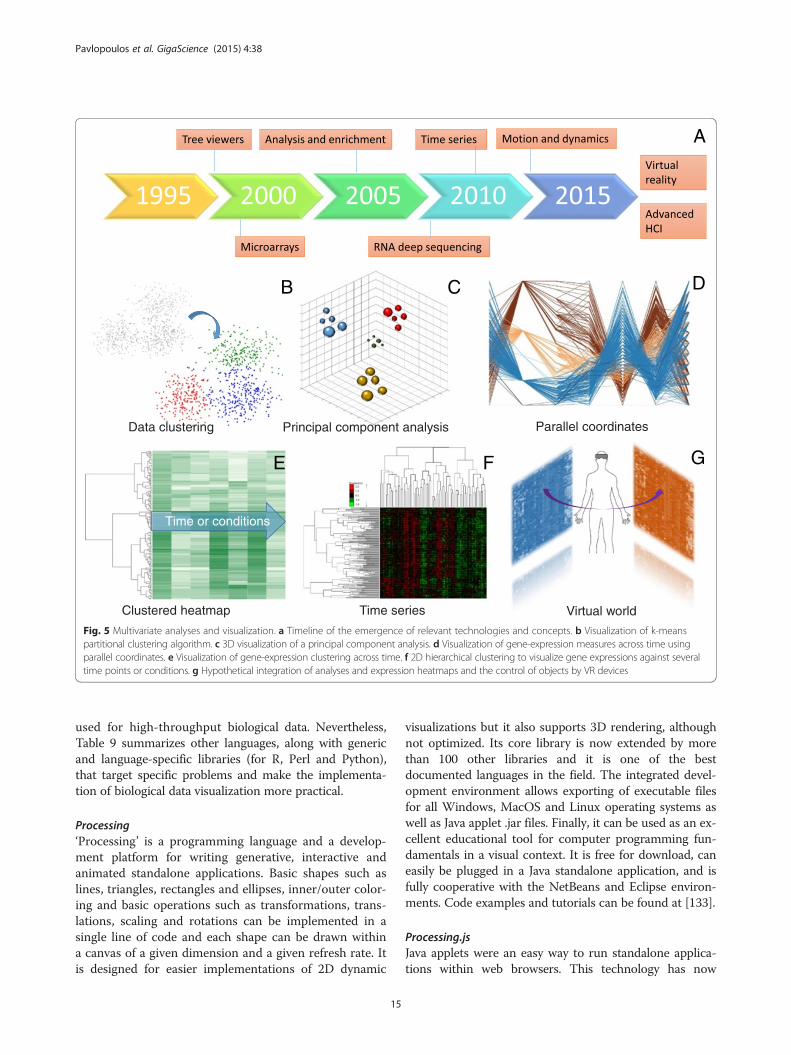
Visualization and analysis of expression dataMicroarrays [112] and RNA sequencing [87] are the twomain high-throughput techniques for measuring expres-sion levels of large numbers of genes simultaneously.Both methods are revolutionary as one can simultan-eously monitor the effects of certain treatments, diseasesand developmental stages on gene expression acrosstime (Fig. 5a) and for multiple transcript isoforms. Al-though microarrays and RNAseq technologies are com-parable to each other [113], the latter tends to dominate,especially as sequencing technologies have improved,and there now are robust statistics to model the particu-lar noise characteristics of RNAseq, particularly for lowexpression [114]. Microarrays are still cheaper and insome contexts may be more convenient as their analysis isstill simpler and requires less computing infrastructure.
In both cases, a typical analysis procedure is first tonormalize experimental and batch differences betweensamples and then to identify up- and downregulated genesbased on a fold-change level when comparing across sam-ples, such as between a healthy and a non-healthy tissue.Statistical approaches are used to assess how reliable fold-change measurements are for each transcript of interestby modeling variation across transcripts and experiments.Subsequently, functional enrichment is performed toidentify pathways and biological processes in which theup- and downregulated genes may be involved. Althoughthere are numerous functional enrichment suites [115],David [116], Panther [117] and WebGestalt [118] areamong the most widely used.When gene expression is measured across many time
points or conditions so as to observe, for example, the ex-pression patterns following treatment, various analysescan be taken into consideration. Principal component ana-lysis or partitional clustering algorithms such as k-means[119] can be used to group together genes with similar be-havior patterns. Scatter-plotting is the typical visualizationto represent such groupings. Thus, each point on a planerepresents a gene and the closer two genes appear, themore similar they are (Fig. 5b, c).When one wants to categorize genes with similar be-
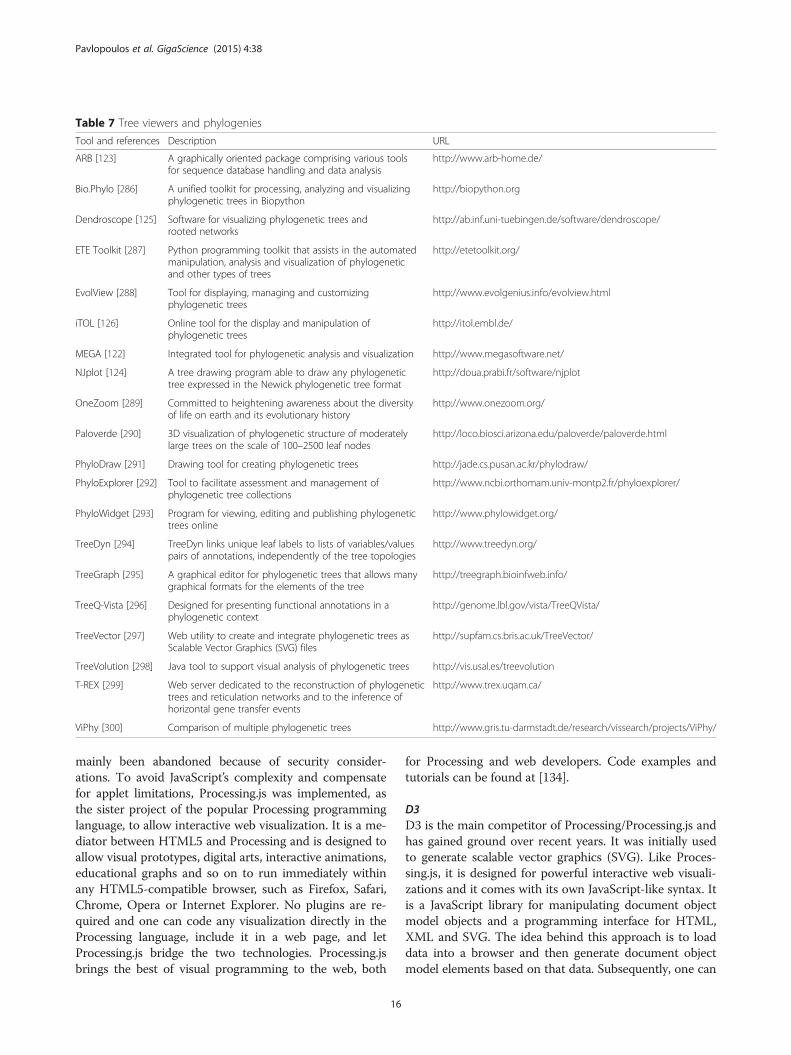
havior patterns across time (Fig. 5d), hierarchical cluster-ing based on expression correlation can be performed.Average linkage, complete linkage, single linkage, neigh-bor joining [120] and UPGMA [121] are the most widelyused methods. In such approaches, an all-against-all dis-tance or correlation matrix that shows the similaritiesbetween each pair of genes is required and genes areplaced as leaves in a tree hierarchy. The two most widelyused correlation metrics for expression data are theSpearman and Pearson correlation metrics. A list of treeviewers for hierarchical clustering visualization is pre-sented in Table 7. A more advanced visualization methodis combining trees with heatmaps (Fig. 5e): genes aregrouped together according to their expression patterns ina tree hierarchy and the heat map is a graphical represen-tation of individual gene-expression values represented ascolors. Darker colors indicate a higher expression value
Table 5 Genome browsers (Continued)
UCSC Cancer GenomicsBrowser [251, 252]
Integration of clinical data http://genome-cancer.ucsc.edu/ Web-based
UCSC Genome Browser[103]
Rapid linear visualization, examination andquerying of the data at many levels
http://genome.ucsc.edu/cgi-bin/hgGateway Web-based
UTGB [253] Open-source software for developing personalizedgenome browsers that work in web browsers
http://utgenome.org/ Web-based
X:map [254] Mappings between genomic features andAffymetrix microarrays
http://xmap.picr.man.ac.uk/ Web-based
Pavlopoulos et al. GigaScience (2015) 4:38
11
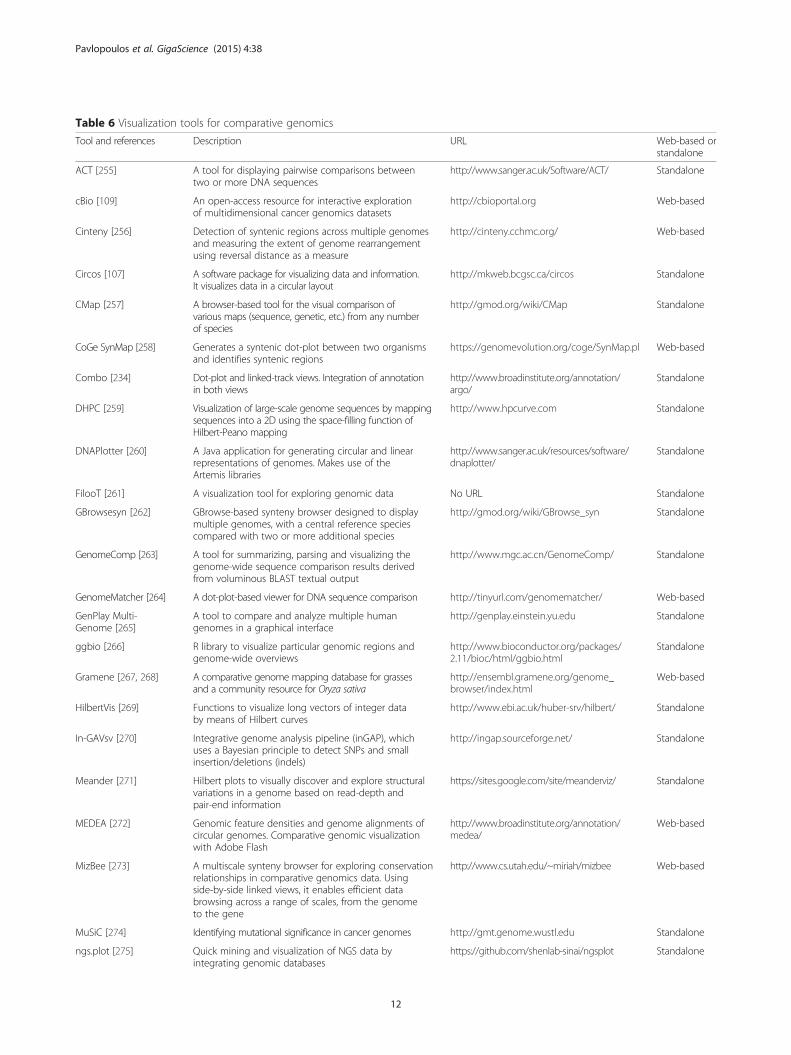
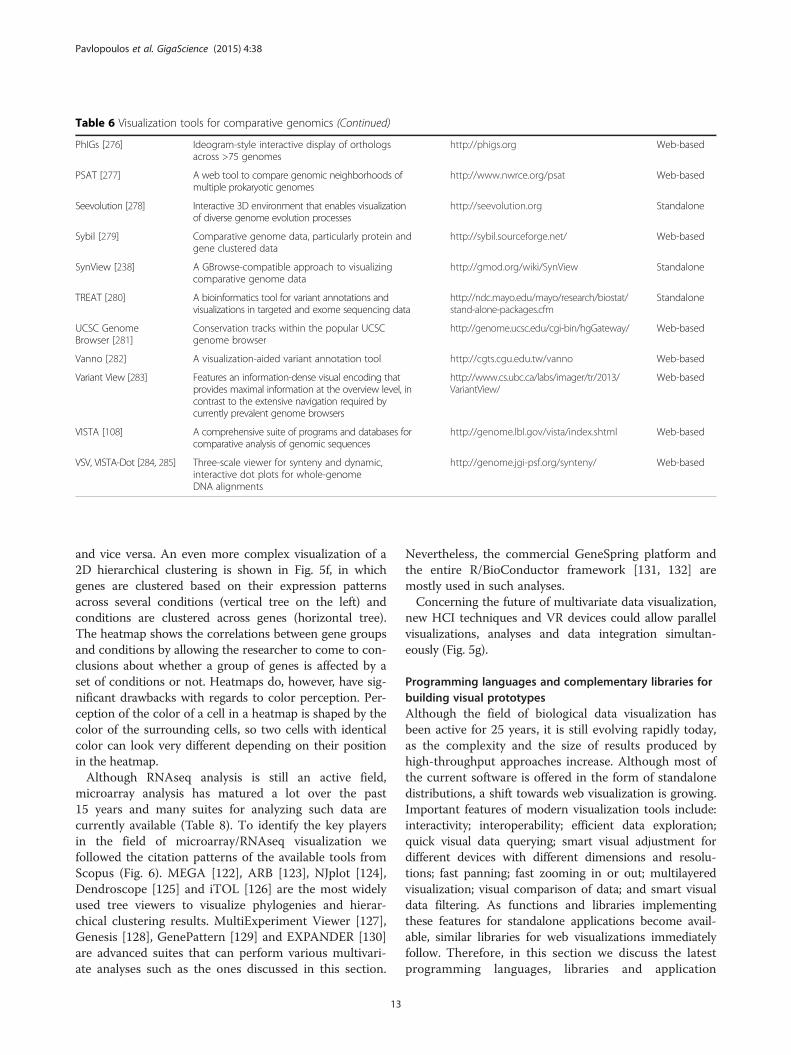
Table 6 Visualization tools for comparative genomics
Tool and references Description URL Web-based orstandalone
ACT [255] A tool for displaying pairwise comparisons betweentwo or more DNA sequences
http://www.sanger.ac.uk/Software/ACT/ Standalone
cBio [109] An open-access resource for interactive explorationof multidimensional cancer genomics datasets
http://cbioportal.org Web-based
Cinteny [256] Detection of syntenic regions across multiple genomesand measuring the extent of genome rearrangementusing reversal distance as a measure
http://cinteny.cchmc.org/ Web-based
Circos [107] A software package for visualizing data and information.It visualizes data in a circular layout
http://mkweb.bcgsc.ca/circos Standalone
CMap [257] A browser-based tool for the visual comparison ofvarious maps (sequence, genetic, etc.) from any numberof species
http://gmod.org/wiki/CMap Standalone
CoGe SynMap [258] Generates a syntenic dot-plot between two organismsand identifies syntenic regions
https://genomevolution.org/coge/SynMap.pl Web-based
Combo [234] Dot-plot and linked-track views. Integration of annotationin both views
http://www.broadinstitute.org/annotation/argo/
Standalone
DHPC [259] Visualization of large-scale genome sequences by mappingsequences into a 2D using the space-filling function ofHilbert-Peano mapping
http://www.hpcurve.com Standalone
DNAPlotter [260] A Java application for generating circular and linearrepresentations of genomes. Makes use of theArtemis libraries
http://www.sanger.ac.uk/resources/software/dnaplotter/
Standalone
FilooT [261] A visualization tool for exploring genomic data No URL Standalone
GBrowsesyn [262] GBrowse-based synteny browser designed to displaymultiple genomes, with a central reference speciescompared with two or more additional species
http://gmod.org/wiki/GBrowse_syn Standalone
GenomeComp [263] A tool for summarizing, parsing and visualizing thegenome-wide sequence comparison results derivedfrom voluminous BLAST textual output
http://www.mgc.ac.cn/GenomeComp/ Standalone
GenomeMatcher [264] A dot-plot-based viewer for DNA sequence comparison http://tinyurl.com/genomematcher/ Web-based
GenPlay Multi-Genome [265]
A tool to compare and analyze multiple humangenomes in a graphical interface
http://genplay.einstein.yu.edu Standalone
ggbio [266] R library to visualize particular genomic regions andgenome-wide overviews
http://www.bioconductor.org/packages/2.11/bioc/html/ggbio.html
Standalone
Gramene [267, 268] A comparative genome mapping database for grassesand a community resource for Oryza sativa
http://ensembl.gramene.org/genome_browser/index.html
Web-based
HilbertVis [269] Functions to visualize long vectors of integer databy means of Hilbert curves
http://www.ebi.ac.uk/huber-srv/hilbert/ Standalone
In-GAVsv [270] Integrative genome analysis pipeline (inGAP), whichuses a Bayesian principle to detect SNPs and smallinsertion/deletions (indels)
http://ingap.sourceforge.net/ Standalone
Meander [271] Hilbert plots to visually discover and explore structuralvariations in a genome based on read-depth andpair-end information
https://sites.google.com/site/meanderviz/ Standalone
MEDEA [272] Genomic feature densities and genome alignments ofcircular genomes. Comparative genomic visualizationwith Adobe Flash
http://www.broadinstitute.org/annotation/medea/
Web-based
MizBee [273] A multiscale synteny browser for exploring conservationrelationships in comparative genomics data. Usingside-by-side linked views, it enables efficient databrowsing across a range of scales, from the genometo the gene
http://www.cs.utah.edu/~miriah/mizbee Web-based
MuSiC [274] Identifying mutational significance in cancer genomes http://gmt.genome.wustl.edu Standalone
ngs.plot [275] Quick mining and visualization of NGS data byintegrating genomic databases
https://github.com/shenlab-sinai/ngsplot Standalone
Pavlopoulos et al. GigaScience (2015) 4:38
12
and vice versa. An even more complex visualization of a2D hierarchical clustering is shown in Fig. 5f, in whichgenes are clustered based on their expression patternsacross several conditions (vertical tree on the left) andconditions are clustered across genes (horizontal tree).The heatmap shows the correlations between gene groupsand conditions by allowing the researcher to come to con-clusions about whether a group of genes is affected by aset of conditions or not. Heatmaps do, however, have sig-nificant drawbacks with regards to color perception. Per-ception of the color of a cell in a heatmap is shaped by thecolor of the surrounding cells, so two cells with identicalcolor can look very different depending on their positionin the heatmap.Although RNAseq analysis is still an active field,
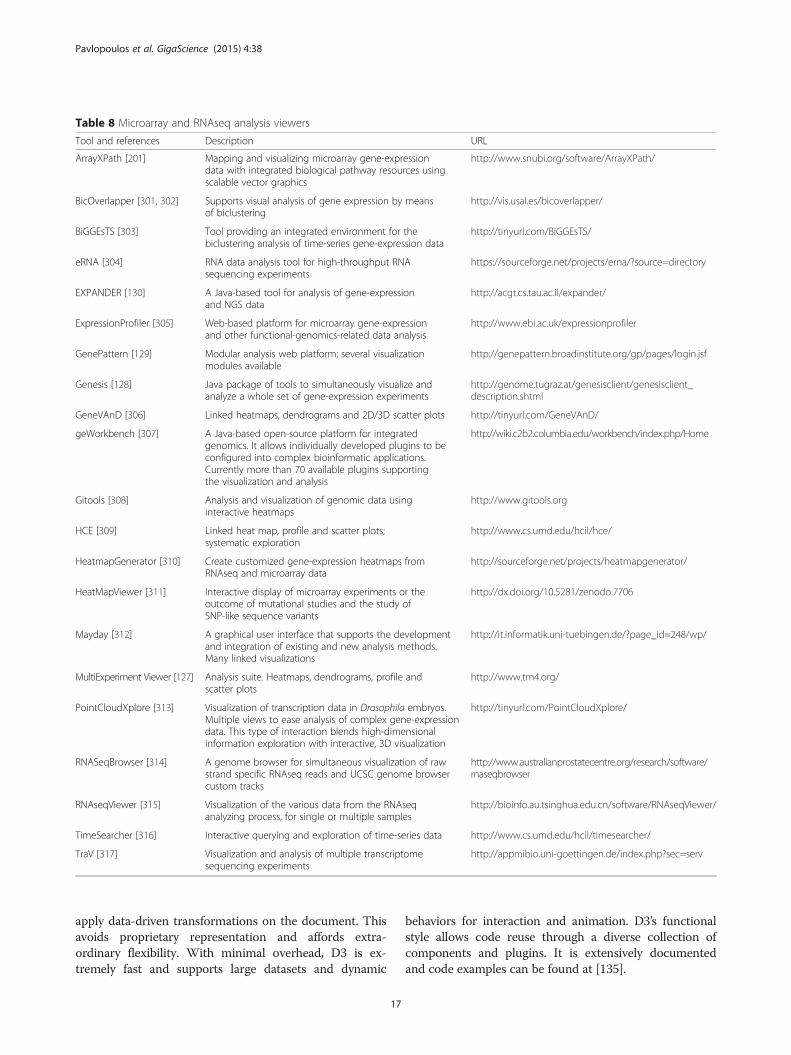
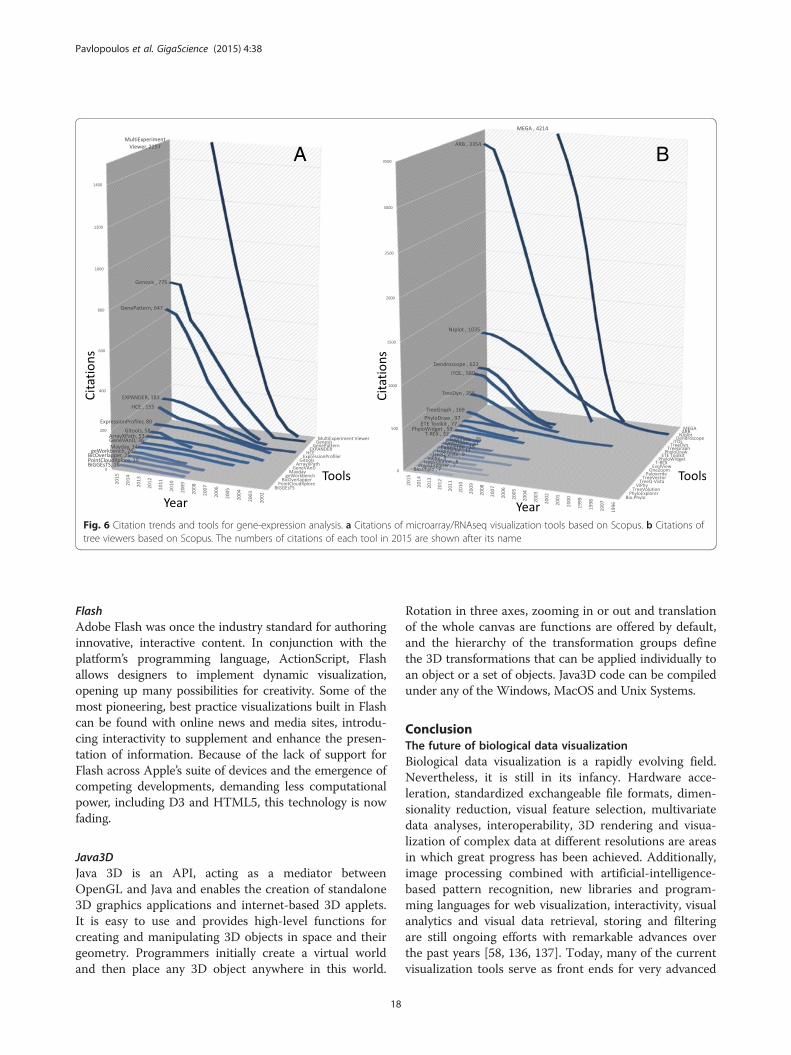
microarray analysis has matured a lot over the past15 years and many suites for analyzing such data arecurrently available (Table 8). To identify the key playersin the field of microarray/RNAseq visualization wefollowed the citation patterns of the available tools fromScopus (Fig. 6). MEGA [122], ARB [123], NJplot [124],Dendroscope [125] and iTOL [126] are the most widelyused tree viewers to visualize phylogenies and hierar-chical clustering results. MultiExperiment Viewer [127],Genesis [128], GenePattern [129] and EXPANDER [130]are advanced suites that can perform various multivari-ate analyses such as the ones discussed in this section.
Nevertheless, the commercial GeneSpring platform andthe entire R/BioConductor framework [131, 132] aremostly used in such analyses.Concerning the future of multivariate data visualization,
new HCI techniques and VR devices could allow parallelvisualizations, analyses and data integration simultan-eously (Fig. 5g).
Programming languages and complementary libraries forbuilding visual prototypesAlthough the field of biological data visualization hasbeen active for 25 years, it is still evolving rapidly today,as the complexity and the size of results produced byhigh-throughput approaches increase. Although most ofthe current software is offered in the form of standalonedistributions, a shift towards web visualization is growing.Important features of modern visualization tools include:interactivity; interoperability; efficient data exploration;quick visual data querying; smart visual adjustment fordifferent devices with different dimensions and resolu-tions; fast panning; fast zooming in or out; multilayeredvisualization; visual comparison of data; and smart visualdata filtering. As functions and libraries implementingthese features for standalone applications become avail-able, similar libraries for web visualizations immediatelyfollow. Therefore, in this section we discuss the latestprogramming languages, libraries and application
Table 6 Visualization tools for comparative genomics (Continued)
PhIGs [276] Ideogram-style interactive display of orthologsacross >75 genomes
http://phigs.org Web-based
PSAT [277] A web tool to compare genomic neighborhoods ofmultiple prokaryotic genomes
http://www.nwrce.org/psat Web-based
Seevolution [278] Interactive 3D environment that enables visualizationof diverse genome evolution processes
http://seevolution.org Standalone
Sybil [279] Comparative genome data, particularly protein andgene clustered data
http://sybil.sourceforge.net/ Web-based
SynView [238] A GBrowse-compatible approach to visualizingcomparative genome data
http://gmod.org/wiki/SynView Standalone
TREAT [280] A bioinformatics tool for variant annotations andvisualizations in targeted and exome sequencing data
http://ndc.mayo.edu/mayo/research/biostat/stand-alone-packages.cfm
Standalone
UCSC GenomeBrowser [281]
Conservation tracks within the popular UCSCgenome browser
http://genome.ucsc.edu/cgi-bin/hgGateway/ Web-based
Vanno [282] A visualization-aided variant annotation tool http://cgts.cgu.edu.tw/vanno Web-based
Variant View [283] Features an information-dense visual encoding thatprovides maximal information at the overview level, incontrast to the extensive navigation required bycurrently prevalent genome browsers
http://www.cs.ubc.ca/labs/imager/tr/2013/VariantView/
Web-based
VISTA [108] A comprehensive suite of programs and databases forcomparative analysis of genomic sequences
http://genome.lbl.gov/vista/index.shtml Web-based
VSV, VISTA-Dot [284, 285] Three-scale viewer for synteny and dynamic,interactive dot plots for whole-genomeDNA alignments
http://genome.jgi-psf.org/synteny/ Web-based
Pavlopoulos et al. GigaScience (2015) 4:38
13
program interfaces (APIs) that automate and simplifymany of the aforementioned features, enabling higher-quality visualization implementations. It is not in the
scope of this review to extensively describe all program-ming language possibilities for data visualization; there-fore, we focus on the five languages that are mostly
A B
C D
Fig. 4 Citation trends and key players in genome biology. a Citations of genome alignment visualization tools based on Scopus. b Citations ofgenome assembly visualization tools based on Scopus. c Citations of genome browsers based on Scopus. d Citations of comparative genomicsvisualization tools based on Scopus. The numbers of citations of each tool in 2015 are shown after its name
Pavlopoulos et al. GigaScience (2015) 4:38
14
used for high-throughput biological data. Nevertheless,Table 9 summarizes other languages, along with genericand language-specific libraries (for R, Perl and Python),that target specific problems and make the implementa-tion of biological data visualization more practical.
Processing‘Processing’ is a programming language and a develop-ment platform for writing generative, interactive andanimated standalone applications. Basic shapes such aslines, triangles, rectangles and ellipses, inner/outer color-ing and basic operations such as transformations, trans-lations, scaling and rotations can be implemented in asingle line of code and each shape can be drawn withina canvas of a given dimension and a given refresh rate. Itis designed for easier implementations of 2D dynamic
visualizations but it also supports 3D rendering, althoughnot optimized. Its core library is now extended by morethan 100 other libraries and it is one of the bestdocumented languages in the field. The integrated devel-opment environment allows exporting of executable filesfor all Windows, MacOS and Linux operating systems aswell as Java applet .jar files. Finally, it can be used as an ex-cellent educational tool for computer programming fun-damentals in a visual context. It is free for download, caneasily be plugged in a Java standalone application, and isfully cooperative with the NetBeans and Eclipse environ-ments. Code examples and tutorials can be found at [133].
Processing.jsJava applets were an easy way to run standalone applica-tions within web browsers. This technology has now
Data clustering
A
B C D
Time or conditions
Principal component analysis Parallel coordinates
Time seriesClustered heatmap
E F G
Virtual world
Fig. 5 Multivariate analyses and visualization. a Timeline of the emergence of relevant technologies and concepts. b Visualization of k-meanspartitional clustering algorithm. c 3D visualization of a principal component analysis. d Visualization of gene-expression measures across time usingparallel coordinates. e Visualization of gene-expression clustering across time. f 2D hierarchical clustering to visualize gene expressions against severaltime points or conditions. g Hypothetical integration of analyses and expression heatmaps and the control of objects by VR devices
Pavlopoulos et al. GigaScience (2015) 4:38
15
mainly been abandoned because of security consider-ations. To avoid JavaScript’s complexity and compensatefor applet limitations, Processing.js was implemented, asthe sister project of the popular Processing programminglanguage, to allow interactive web visualization. It is a me-diator between HTML5 and Processing and is designed toallow visual prototypes, digital arts, interactive animations,educational graphs and so on to run immediately withinany HTML5-compatible browser, such as Firefox, Safari,Chrome, Opera or Internet Explorer. No plugins are re-quired and one can code any visualization directly in theProcessing language, include it in a web page, and letProcessing.js bridge the two technologies. Processing.jsbrings the best of visual programming to the web, both
for Processing and web developers. Code examples andtutorials can be found at [134].
D3D3 is the main competitor of Processing/Processing.js andhas gained ground over recent years. It was initially usedto generate scalable vector graphics (SVG). Like Proces-sing.js, it is designed for powerful interactive web visuali-zations and it comes with its own JavaScript-like syntax. Itis a JavaScript library for manipulating document objectmodel objects and a programming interface for HTML,XML and SVG. The idea behind this approach is to loaddata into a browser and then generate document objectmodel elements based on that data. Subsequently, one can
Table 7 Tree viewers and phylogenies
Tool and references Description URL
ARB [123] A graphically oriented package comprising various toolsfor sequence database handling and data analysis
http://www.arb-home.de/
Bio.Phylo [286] A unified toolkit for processing, analyzing and visualizingphylogenetic trees in Biopython
http://biopython.org
Dendroscope [125] Software for visualizing phylogenetic trees androoted networks
http://ab.inf.uni-tuebingen.de/software/dendroscope/
ETE Toolkit [287] Python programming toolkit that assists in the automatedmanipulation, analysis and visualization of phylogeneticand other types of trees
http://etetoolkit.org/
EvolView [288] Tool for displaying, managing and customizingphylogenetic trees
http://www.evolgenius.info/evolview.html
iTOL [126] Online tool for the display and manipulation ofphylogenetic trees
http://itol.embl.de/
MEGA [122] Integrated tool for phylogenetic analysis and visualization http://www.megasoftware.net/
NJplot [124] A tree drawing program able to draw any phylogenetictree expressed in the Newick phylogenetic tree format
http://doua.prabi.fr/software/njplot
OneZoom [289] Committed to heightening awareness about the diversityof life on earth and its evolutionary history
http://www.onezoom.org/
Paloverde [290] 3D visualization of phylogenetic structure of moderatelylarge trees on the scale of 100–2500 leaf nodes
http://loco.biosci.arizona.edu/paloverde/paloverde.html
PhyloDraw [291] Drawing tool for creating phylogenetic trees http://jade.cs.pusan.ac.kr/phylodraw/
PhyloExplorer [292] Tool to facilitate assessment and management ofphylogenetic tree collections
http://www.ncbi.orthomam.univ-montp2.fr/phyloexplorer/
PhyloWidget [293] Program for viewing, editing and publishing phylogenetictrees online
http://www.phylowidget.org/
TreeDyn [294] TreeDyn links unique leaf labels to lists of variables/valuespairs of annotations, independently of the tree topologies
http://www.treedyn.org/
TreeGraph [295] A graphical editor for phylogenetic trees that allows manygraphical formats for the elements of the tree
http://treegraph.bioinfweb.info/
TreeQ-Vista [296] Designed for presenting functional annotations in aphylogenetic context
http://genome.lbl.gov/vista/TreeQVista/
TreeVector [297] Web utility to create and integrate phylogenetic trees asScalable Vector Graphics (SVG) files
http://supfam.cs.bris.ac.uk/TreeVector/
TreeVolution [298] Java tool to support visual analysis of phylogenetic trees http://vis.usal.es/treevolution
T-REX [299] Web server dedicated to the reconstruction of phylogenetictrees and reticulation networks and to the inference ofhorizontal gene transfer events
http://www.trex.uqam.ca/
ViPhy [300] Comparison of multiple phylogenetic trees http://www.gris.tu-darmstadt.de/research/vissearch/projects/ViPhy/
Pavlopoulos et al. GigaScience (2015) 4:38
16
apply data-driven transformations on the document. Thisavoids proprietary representation and affords extra-ordinary flexibility. With minimal overhead, D3 is ex-tremely fast and supports large datasets and dynamic
behaviors for interaction and animation. D3’s functionalstyle allows code reuse through a diverse collection ofcomponents and plugins. It is extensively documentedand code examples can be found at [135].
Table 8 Microarray and RNAseq analysis viewers
Tool and references Description URL
ArrayXPath [201] Mapping and visualizing microarray gene-expressiondata with integrated biological pathway resources usingscalable vector graphics
http://www.snubi.org/software/ArrayXPath/
BicOverlapper [301, 302] Supports visual analysis of gene expression by meansof biclustering
http://vis.usal.es/bicoverlapper/
BiGGEsTS [303] Tool providing an integrated environment for thebiclustering analysis of time-series gene-expression data
http://tinyurl.com/BiGGEsTS/
eRNA [304] RNA data analysis tool for high-throughput RNAsequencing experiments
https://sourceforge.net/projects/erna/?source=directory
EXPANDER [130] A Java-based tool for analysis of gene-expressionand NGS data
http://acgt.cs.tau.ac.il/expander/
ExpressionProfiler [305] Web-based platform for microarray gene-expressionand other functional-genomics-related data analysis
http://www.ebi.ac.uk/expressionprofiler
GenePattern [129] Modular analysis web platform; several visualizationmodules available
http://genepattern.broadinstitute.org/gp/pages/login.jsf
Genesis [128] Java package of tools to simultaneously visualize andanalyze a whole set of gene-expression experiments
http://genome.tugraz.at/genesisclient/genesisclient_description.shtml
GeneVAnD [306] Linked heatmaps, dendrograms and 2D/3D scatter plots http://tinyurl.com/GeneVAnD/
geWorkbench [307] A Java-based open-source platform for integratedgenomics. It allows individually developed plugins to beconfigured into complex bioinformatic applications.Currently more than 70 available plugins supportingthe visualization and analysis
http://wiki.c2b2.columbia.edu/workbench/index.php/Home
Gitools [308] Analysis and visualization of genomic data usinginteractive heatmaps
http://www.gitools.org
HCE [309] Linked heat map, profile and scatter plots;systematic exploration
http://www.cs.umd.edu/hcil/hce/
HeatmapGenerator [310] Create customized gene-expression heatmaps fromRNAseq and microarray data
http://sourceforge.net/projects/heatmapgenerator/
HeatMapViewer [311] Interactive display of microarray experiments or theoutcome of mutational studies and the study ofSNP-like sequence variants
http://dx.doi.org/10.5281/zenodo.7706
Mayday [312] A graphical user interface that supports the developmentand integration of existing and new analysis methods.Many linked visualizations
http://it.informatik.uni-tuebingen.de/?page_id=248/wp/
MultiExperiment Viewer [127] Analysis suite. Heatmaps, dendrograms, profile andscatter plots
http://www.tm4.org/
PointCloudXplore [313] Visualization of transcription data in Drosophila embryos.Multiple views to ease analysis of complex gene-expressiondata. This type of interaction blends high-dimensionalinformation exploration with interactive, 3D visualization
http://tinyurl.com/PointCloudXplore/
RNASeqBrowser [314] A genome browser for simultaneous visualization of rawstrand specific RNAseq reads and UCSC genome browsercustom tracks
http://www.australianprostatecentre.org/research/software/rnaseqbrowser
RNAseqViewer [315] Visualization of the various data from the RNAseqanalyzing process, for single or multiple samples
http://bioinfo.au.tsinghua.edu.cn/software/RNAseqViewer/
TimeSearcher [316] Interactive querying and exploration of time-series data http://www.cs.umd.edu/hcil/timesearcher/
TraV [317] Visualization and analysis of multiple transcriptomesequencing experiments
http://appmibio.uni-goettingen.de/index.php?sec=serv
Pavlopoulos et al. GigaScience (2015) 4:38
17
FlashAdobe Flash was once the industry standard for authoringinnovative, interactive content. In conjunction with theplatform’s programming language, ActionScript, Flashallows designers to implement dynamic visualization,opening up many possibilities for creativity. Some of themost pioneering, best practice visualizations built in Flashcan be found with online news and media sites, introdu-cing interactivity to supplement and enhance the presen-tation of information. Because of the lack of support forFlash across Apple’s suite of devices and the emergence ofcompeting developments, demanding less computationalpower, including D3 and HTML5, this technology is nowfading.
Java3DJava 3D is an API, acting as a mediator betweenOpenGL and Java and enables the creation of standalone3D graphics applications and internet-based 3D applets.It is easy to use and provides high-level functions forcreating and manipulating 3D objects in space and theirgeometry. Programmers initially create a virtual worldand then place any 3D object anywhere in this world.
Rotation in three axes, zooming in or out and translationof the whole canvas are functions are offered by default,and the hierarchy of the transformation groups definethe 3D transformations that can be applied individually toan object or a set of objects. Java3D code can be compiledunder any of the Windows, MacOS and Unix Systems.
ConclusionThe future of biological data visualizationBiological data visualization is a rapidly evolving field.Nevertheless, it is still in its infancy. Hardware acce-leration, standardized exchangeable file formats, dimen-sionality reduction, visual feature selection, multivariatedata analyses, interoperability, 3D rendering and visua-lization of complex data at different resolutions are areasin which great progress has been achieved. Additionally,image processing combined with artificial-intelligence-based pattern recognition, new libraries and program-ming languages for web visualization, interactivity, visualanalytics and visual data retrieval, storing and filteringare still ongoing efforts with remarkable advances overthe past years [58, 136, 137]. Today, many of the currentvisualization tools serve as front ends for very advanced
A B
Fig. 6 Citation trends and tools for gene-expression analysis. a Citations of microarray/RNAseq visualization tools based on Scopus. b Citations oftree viewers based on Scopus. The numbers of citations of each tool in 2015 are shown after its name
Pavlopoulos et al. GigaScience (2015) 4:38
18
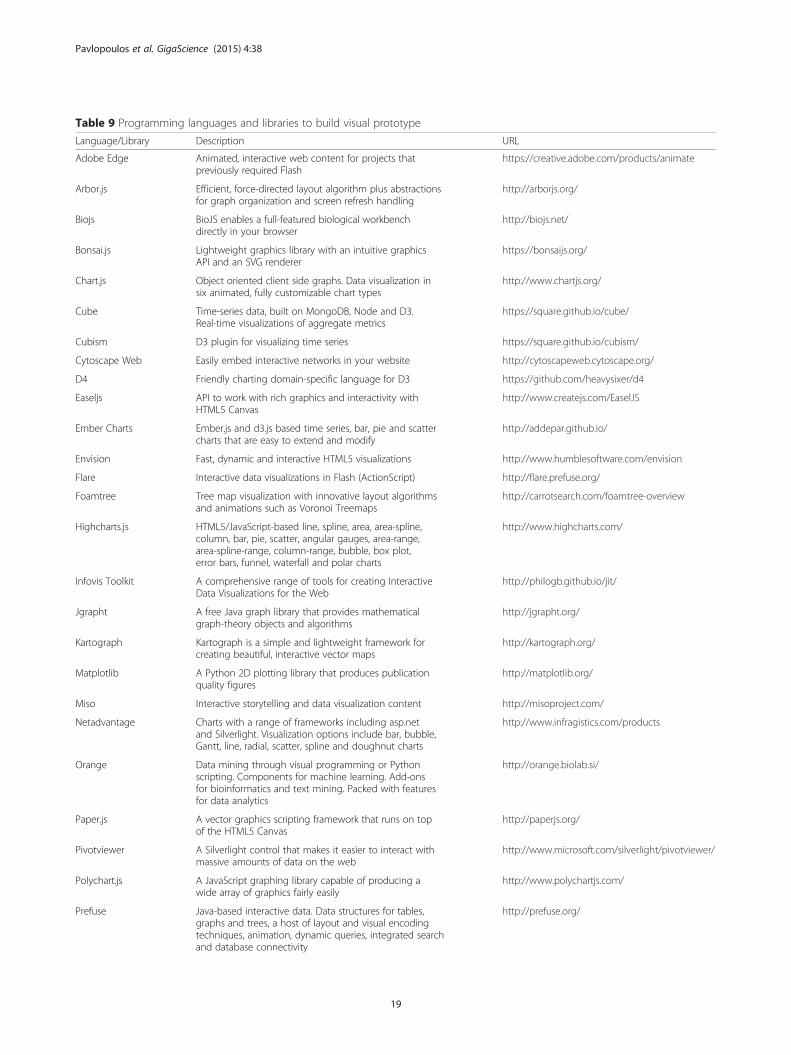
Table 9 Programming languages and libraries to build visual prototype
Language/Library Description URL
Adobe Edge Animated, interactive web content for projects thatpreviously required Flash
https://creative.adobe.com/products/animate
Arbor.js Efficient, force-directed layout algorithm plus abstractionsfor graph organization and screen refresh handling
http://arborjs.org/
Biojs BioJS enables a full-featured biological workbenchdirectly in your browser
http://biojs.net/
Bonsai.js Lightweight graphics library with an intuitive graphicsAPI and an SVG renderer
https://bonsaijs.org/
Chart.js Object oriented client side graphs. Data visualization insix animated, fully customizable chart types
http://www.chartjs.org/
Cube Time-series data, built on MongoDB, Node and D3.Real-time visualizations of aggregate metrics
https://square.github.io/cube/
Cubism D3 plugin for visualizing time series https://square.github.io/cubism/
Cytoscape Web Easily embed interactive networks in your website http://cytoscapeweb.cytoscape.org/
D4 Friendly charting domain-specific language for D3 https://github.com/heavysixer/d4
Easeljs API to work with rich graphics and interactivity withHTML5 Canvas
http://www.createjs.com/EaselJS
Ember Charts Ember.js and d3.js based time series, bar, pie and scattercharts that are easy to extend and modify
http://addepar.github.io/
Envision Fast, dynamic and interactive HTML5 visualizations http://www.humblesoftware.com/envision
Flare Interactive data visualizations in Flash (ActionScript) http://flare.prefuse.org/
Foamtree Tree map visualization with innovative layout algorithmsand animations such as Voronoi Treemaps
http://carrotsearch.com/foamtree-overview
Highcharts.js HTML5/JavaScript-based line, spline, area, area-spline,column, bar, pie, scatter, angular gauges, area-range,area-spline-range, column-range, bubble, box plot,error bars, funnel, waterfall and polar charts
http://www.highcharts.com/
Infovis Toolkit A comprehensive range of tools for creating InteractiveData Visualizations for the Web
http://philogb.github.io/jit/
Jgrapht A free Java graph library that provides mathematicalgraph-theory objects and algorithms
http://jgrapht.org/
Kartograph Kartograph is a simple and lightweight framework forcreating beautiful, interactive vector maps
http://kartograph.org/
Matplotlib A Python 2D plotting library that produces publicationquality figures
http://matplotlib.org/
Miso Interactive storytelling and data visualization content http://misoproject.com/
Netadvantage Charts with a range of frameworks including asp.netand Silverlight. Visualization options include bar, bubble,Gantt, line, radial, scatter, spline and doughnut charts
http://www.infragistics.com/products
Orange Data mining through visual programming or Pythonscripting. Components for machine learning. Add-onsfor bioinformatics and text mining. Packed with featuresfor data analytics
http://orange.biolab.si/
Paper.js A vector graphics scripting framework that runs on topof the HTML5 Canvas
http://paperjs.org/
Pivotviewer A Silverlight control that makes it easier to interact withmassive amounts of data on the web
http://www.microsoft.com/silverlight/pivotviewer/
Polychart.js A JavaScript graphing library capable of producing awide array of graphics fairly easily
http://www.polychartjs.com/
Prefuse Java-based interactive data. Data structures for tables,graphs and trees, a host of layout and visual encodingtechniques, animation, dynamic queries, integrated searchand database connectivity
http://prefuse.org/
Pavlopoulos et al. GigaScience (2015) 4:38
19

infrastructures dedicated to data manipulation and havedriven significant advances in user interfaces. Althoughthe implementation of sophisticated graphical user inter-faces is necessary, the effort to minimize back-endcalculations is of great importance. Unfortunately, only alimited number of visualization tools today take advantageof libraries designed for parallelization. Multi-threading,for example, allows the distribution of computationaltasks in terminals over the network, and CUDA (availableon Nvidia graphic cards) allows parallel calculations atmultiple graphical processing units.
Despite the fact that multiple screens, light and laserprojectors and other technologies partially solve the spacelimitation problem, HCI techniques are changing the rulesof the game and biological data visualization is expectedto adjust to these trends in the longer term. 3D controlcan be achieved without intermediate devices such asmouse, keyboards or touch screens [138] in modernperceptual input systems. Sony’s EyeToy, Playstation Eyeand Artag, for example, use non-spatial computer visionto determine hand gestures. Similarly, the Nintendo Wiiand Sony Move devices support object manipulation in
Table 9 Programming languages and libraries to build visual prototype (Continued)
Prefuse Flare Visualization and animation for ActionScript. From basiccharts and graphs to complex interactive graphics. Datamanagement, visual encoding, animation andinteraction techniques
http://flare.prefuse.org/
Ractive.js It transforms templates into blueprints for apps that areinteractive by default. Two-way binding, animations,SVG support and more
http://www.ractivejs.org/
Raphael.js JavaScript library for vector graphics on the web. To createa specific chart or image. Crop and rotate widget
http://raphaeljs.com/
Rcharts R package to create, customize and publish interactiveJavaScript visualizations from R using a familiar lattice styleplotting interface
http://rcharts.io/
Seaborn A Python visualization library based on matplotlib. It providesa high-level interface for drawing attractive statistical graphics
http://stanford.edu/~mwaskom/software/seaborn/
Shiny A web application framework for R to turn an analysis intointeractive web applications. No HTML, CSS or JavaScriptknowledge required
http://shiny.rstudio.com/
Sigma.js A JavaScript library dedicated to graph drawing. It makeseasy to publish networks on Web pages and allowsdevelopers to integrate network exploration in richweb applications
http://sigmajs.org/
Three.js A lightweight cross-browser JavaScript library/API used tocreate and display animated 3D computer graphics on aweb browser that supports WebGL
http://threejs.org/
Timeline.js Visually rich interactive timelines, available in 40 languages http://timeline.knightlab.com/
Variance Build powerful data visualizations for the web withoutwriting JavaScript. Wide range of visualizations
https://variancecharts.com/
Vega A visualization grammar, a declarative format for creating,saving and sharing visualization designs. Data visualizationsin JSON format and interactive views using eitherHTML5 Canvas or SVG
http://trifacta.github.io/vega/
Vida.io A way to build reusable cloud visualizations: clonevisualization templates, customize without coding skills andembed or share in the cloud
https://vida.io/
Vis A data visualization platform designed to assist investigativejournalists, activists and others in mapping complex businessor crime networks
http://vis.occrp.org/
Visual Sedimentation A JavaScript library for visualizing streaming data, inspiredby the process of physical sedimentation. jQuery (to facilitateHTML and JavaScript development) and Box2DWeb (for physicalworld simulation)
http://www.visualsedimentation.org/
WebGL A JavaScript API for rendering interactive 3D computer graphicsand 2D graphics within any compatible web browser withoutthe use of plugins
https://www.khronos.org/webgl/
Pavlopoulos et al. GigaScience (2015) 4:38
20
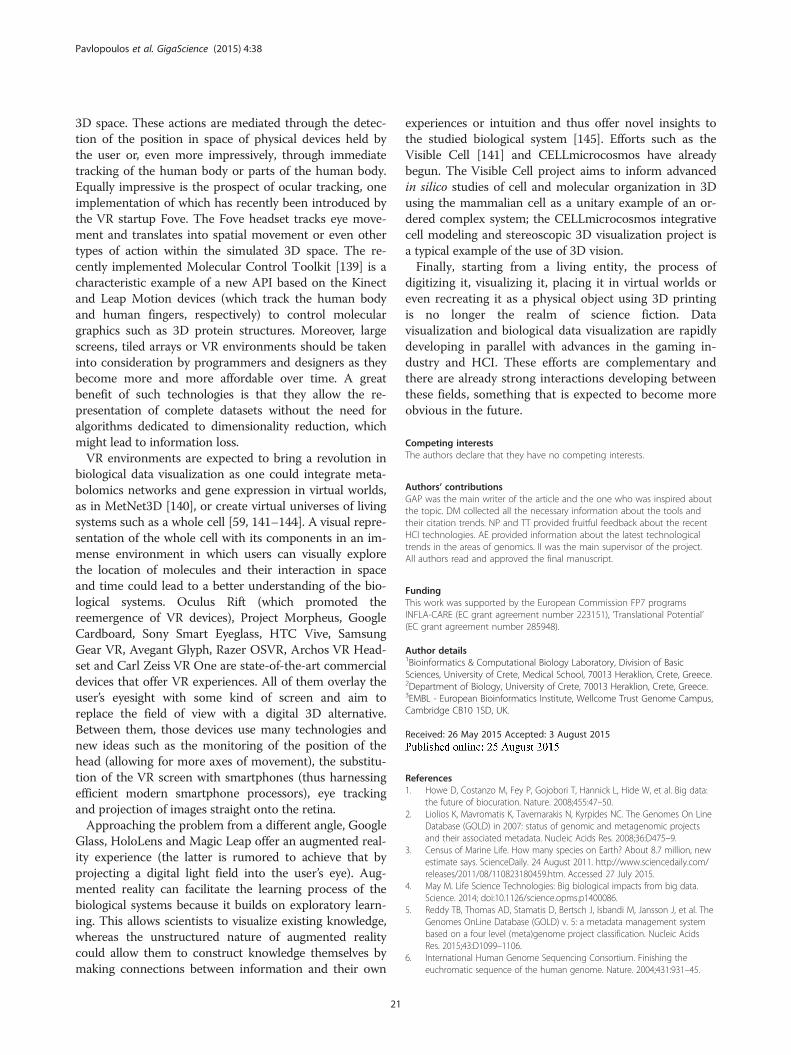
3D space. These actions are mediated through the detec-tion of the position in space of physical devices held bythe user or, even more impressively, through immediatetracking of the human body or parts of the human body.Equally impressive is the prospect of ocular tracking, oneimplementation of which has recently been introduced bythe VR startup Fove. The Fove headset tracks eye move-ment and translates into spatial movement or even othertypes of action within the simulated 3D space. The re-cently implemented Molecular Control Toolkit [139] is acharacteristic example of a new API based on the Kinectand Leap Motion devices (which track the human bodyand human fingers, respectively) to control moleculargraphics such as 3D protein structures. Moreover, largescreens, tiled arrays or VR environments should be takeninto consideration by programmers and designers as theybecome more and more affordable over time. A greatbenefit of such technologies is that they allow the re-presentation of complete datasets without the need foralgorithms dedicated to dimensionality reduction, whichmight lead to information loss.VR environments are expected to bring a revolution in
biological data visualization as one could integrate meta-bolomics networks and gene expression in virtual worlds,as in MetNet3D [140], or create virtual universes of livingsystems such as a whole cell [59, 141–144]. A visual repre-sentation of the whole cell with its components in an im-mense environment in which users can visually explorethe location of molecules and their interaction in spaceand time could lead to a better understanding of the bio-logical systems. Oculus Rift (which promoted thereemergence of VR devices), Project Morpheus, GoogleCardboard, Sony Smart Eyeglass, HTC Vive, SamsungGear VR, Avegant Glyph, Razer OSVR, Archos VR Head-set and Carl Zeiss VR One are state-of-the-art commercialdevices that offer VR experiences. All of them overlay theuser’s eyesight with some kind of screen and aim toreplace the field of view with a digital 3D alternative.Between them, those devices use many technologies andnew ideas such as the monitoring of the position of thehead (allowing for more axes of movement), the substitu-tion of the VR screen with smartphones (thus harnessingefficient modern smartphone processors), eye trackingand projection of images straight onto the retina.Approaching the problem from a different angle, Google
Glass, HoloLens and Magic Leap offer an augmented real-ity experience (the latter is rumored to achieve that byprojecting a digital light field into the user’s eye). Aug-mented reality can facilitate the learning process of thebiological systems because it builds on exploratory learn-ing. This allows scientists to visualize existing knowledge,whereas the unstructured nature of augmented realitycould allow them to construct knowledge themselves bymaking connections between information and their own
experiences or intuition and thus offer novel insights tothe studied biological system [145]. Efforts such as theVisible Cell [141] and CELLmicrocosmos have alreadybegun. The Visible Cell project aims to inform advancedin silico studies of cell and molecular organization in 3Dusing the mammalian cell as a unitary example of an or-dered complex system; the CELLmicrocosmos integrativecell modeling and stereoscopic 3D visualization project isa typical example of the use of 3D vision.Finally, starting from a living entity, the process of
digitizing it, visualizing it, placing it in virtual worlds oreven recreating it as a physical object using 3D printingis no longer the realm of science fiction. Datavisualization and biological data visualization are rapidlydeveloping in parallel with advances in the gaming in-dustry and HCI. These efforts are complementary andthere are already strong interactions developing betweenthese fields, something that is expected to become moreobvious in the future.
Competing interestsThe authors declare that they have no competing interests.
Authors’ contributionsGAP was the main writer of the article and the one who was inspired aboutthe topic. DM collected all the necessary information about the tools andtheir citation trends. NP and TT provided fruitful feedback about the recentHCI technologies. AE provided information about the latest technologicaltrends in the areas of genomics. II was the main supervisor of the project.All authors read and approved the final manuscript.
FundingThis work was supported by the European Commission FP7 programsINFLA-CARE (EC grant agreement number 223151), ‘Translational Potential’(EC grant agreement number 285948).
Author details1Bioinformatics & Computational Biology Laboratory, Division of BasicSciences, University of Crete, Medical School, 70013 Heraklion, Crete, Greece.2Department of Biology, University of Crete, 70013 Heraklion, Crete, Greece.3EMBL - European Bioinformatics Institute, Wellcome Trust Genome Campus,Cambridge CB10 1SD, UK.
Received: 26 May 2015 Accepted: 3 August 2015
References1. Howe D, Costanzo M, Fey P, Gojobori T, Hannick L, Hide W, et al. Big data:
the future of biocuration. Nature. 2008;455:47–50.2. Liolios K, Mavromatis K, Tavernarakis N, Kyrpides NC. The Genomes On Line
Database (GOLD) in 2007: status of genomic and metagenomic projectsand their associated metadata. Nucleic Acids Res. 2008;36:D475–9.
3. Census of Marine Life. How many species on Earth? About 8.7 million, newestimate says. ScienceDaily. 24 August 2011. http://www.sciencedaily.com/releases/2011/08/110823180459.htm. Accessed 27 July 2015.
4. May M. Life Science Technologies: Big biological impacts from big data.Science. 2014; doi:10.1126/science.opms.p1400086.
5. Reddy TB, Thomas AD, Stamatis D, Bertsch J, Isbandi M, Jansson J, et al. TheGenomes OnLine Database (GOLD) v. 5: a metadata management systembased on a four level (meta)genome project classification. Nucleic AcidsRes. 2015;43:D1099–1106.
6. International Human Genome Sequencing Consortium. Finishing theeuchromatic sequence of the human genome. Nature. 2004;431:931–45.
Pavlopoulos et al. GigaScience (2015) 4:38
21
7. Ezkurdia I, Juan D, Rodriguez JM, Frankish A, Diekhans M, Harrow J, et al.Multiple evidence strands suggest that there may be as few as 19,000human protein-coding genes. Hum Mol Genet. 2014;23:5866–78.
8. Berman H, Henrick K, Nakamura H. Announcing the worldwide Protein DataBank. Nat Struct Biol. 2003;10:980.
9. Pavlopoulos GA, Iacucci E, Iliopoulos I, Bagos PG. Interpreting the Omics'era' data. Multimedia Services in Intelligent Environments vol. 25. Heidelber:Springer; 2013. p. 79–100.
10. Pavlopoulos GA, Secrier M, Moschopoulos CN, Soldatos TG, Kossida S,Aerts J, et al. Using graph theory to analyze biological networks.BioData Min. 2011;4:10.
11. Moschopoulos CN, Pavlopoulos GA, Likothanassis SD, Kossida S. Analyzingprotein-protein interaction networks with web tools. Curr Bioinform.2011;6:389–97.
12. Papanikolaou N, Pavlopoulos GA, Theodosiou T, Iliopoulos I. Protein-proteininteraction predictions using text mining methods. Methods. 2015;74:47–53.
13. Pavlopoulos GA, Promponas VJ, Ouzounis CA, Iliopoulos I. Biologicalinformation extraction and co-occurrence analysis. Methods Mol Biol.2014;1159:77–92.
14. Puig O, Caspary F, Rigaut G, Rutz B, Bouveret E, Bragado-Nilsson E, et al. Thetandem affinity purification (TAP) method: a general procedure of proteincomplex purification. Methods. 2001;24:218–29.
15. Ito T, Chiba T, Ozawa R, Yoshida M, Hattori M, Sakaki Y. A comprehensivetwo-hybrid analysis to explore the yeast protein interactome. Proc NatlAcad Sci USA. 2001;98:4569–74.
16. Gavin AC, Bosche M, Krause R, Grandi P, Marzioch M, Bauer A, et al.Functional organization of the yeast proteome by systematic analysis ofprotein complexes. Nature. 2002;415:141–7.
17. Fruchterman T, Reingold E. Graph drawing by force-directed placement.Softw Pract Exp. 1991;21:1129–64.
18. Enright AJ, Van Dongen S, Ouzounis CA. An efficient algorithm for large-scaledetection of protein families. Nucleic Acids Res. 2002;30:1575–84.
19. Moschopoulos CN, Pavlopoulos GA, Likothanassis SD, Kossida S. Anenhanced Markov clustering method for detecting protein complexes. 8thIEEE International Conference on Bioinformatics and Bioengineering. 2008.doi:10.1109/BIBE.2008.4696656.
20. Adamcsek B, Palla G, Farkas IJ, Derenyi I, Vicsek T. CFinder: locating cliques andoverlapping modules in biological networks. Bioinformatics. 2006;22:1021–3.
21. Bader GD, Hogue CW. An automated method for finding molecular complexesin large protein interaction networks. BMC Bioinformatics. 2003;4:2.
22. Spirin V, Mirny LA. Protein complexes and functional modules in molecularnetworks. Proc Natl Acad Sci USA. 2003;100:12123–8.
23. Li XL, Foo CS, Ng SK. Discovering protein complexes in dense reliableneighborhoods of protein interaction networks. Comput Syst BioinformaticsConf. 2007;6:157–68.
24. Lubovac Z, Gamalielsson J, Olsson B. Combining functional and topologicalproperties to identify core modules in protein interaction networks.Proteins. 2006;64:948–59.
25. Cho YR, Hwang W, Ramanathan M, Zhang A. Semantic integration toidentify overlapping functional modules in protein interaction networks.BMC Bioinformatics. 2007;8:265.
26. Moschopoulos CN, Pavlopoulos GA, Iacucci E, Aerts J, Likothanassis S,Schneider R, et al. Which clustering algorithm is better for predictingprotein complexes? BMC Res Notes. 2011;4:549.
27. Maraziotis IA, Dimitrakopoulou K, Bezerianos A. Growing functional modulesfrom a seed protein via integration of protein interaction and geneexpression data. BMC Bioinformatics. 2007;8:408.
28. Feng J, Jiang R, Jiang T. A max-flow-based approach to the identification ofprotein complexes using protein interaction and microarray data. IEEE/ACMTrans Comput Biol Bioinform. 2011;8:621–34.
29. Ulitsky I, Shamir R. Identification of functional modules using networktopology and high-throughput data. BMC Syst Biol. 2007;1:8.
30. Pavlopoulos GA, Moschopoulos CN, Hooper SD, Schneider R, Kossida S.jClust: a clustering and visualization toolbox. Bioinformatics.2009;25:1994–6.
31. Moschopoulos CN, Pavlopoulos GA, Schneider R, Likothanassis SD, Kossida S.GIBA: a clustering tool for detecting protein complexes. BMC Bioinformatics.2009;10 Suppl 6:S11.
32. Morris JH, Apeltsin L, Newman AM, Baumbach J, Wittkop T, Su G, et al.clusterMaker: a multi-algorithm clustering plugin for Cytoscape.BMC Bioinformatics. 2011;12:436.
33. Brohee S, Faust K, Lima-Mendez G, Sand O, Janky R, Vanderstocken G, et al.NeAT: a toolbox for the analysis of biological networks, clusters, classes andpathways. Nucleic Acids Res. 2008;36:W444–51.
34. Li X, Wu M, Kwoh CK, Ng SK. Computational approaches for detectingprotein complexes from protein interaction networks: a survey. BMCGenomics. 2010;11 Suppl 1:S3.
35. Brohee S, Faust K, Lima-Mendez G, Vanderstocken G, van Helden J. Networkanalysis tools: from biological networks to clusters and pathways. NatProtoc. 2008;3:1616–29.
36. Brohee S, van Helden J. Evaluation of clustering algorithms for protein-protein interaction networks. BMC Bioinformatics. 2006;7:488.
37. Batagelj V, Mrvar A. Pajek - Program for large network analysis. Connections.1998;21:47–57.
38. Breitkreutz BJ, Stark C, Tyers M. Osprey: a network visualization system.Genome Biol. 2003;4:R22.
39. Hu Z, Hung JH, Wang Y, Chang YC, Huang CL, Huyck M, et al. VisANT 3.5:multi-scale network visualization, analysis and inference based on thegene ontology. Nucleic Acids Res. 2009;37:W115–21.
40. Luciano JS, Stevens RD. e-Science and biological pathway semantics.BMC Bioinformatics. 2007;8 Suppl 3:S3.
41. Luciano JS. PAX of mind for pathway researchers. Drug Discov Today.2005;10:937–42.
42. Hucka M, Finney A, Sauro HM, Bolouri H, Doyle JC, Kitano H, et al. Thesystems biology markup language (SBML): a medium for representationand exchange of biochemical network models. Bioinformatics.2003;19:524–31.
43. Hermjakob H, Montecchi-Palazzi L, Bader G, Wojcik J, Salwinski L, Ceol A,et al. The HUPO PSI's molecular interaction format–a community standardfor the representation of protein interaction data. Nat Biotechnol.2004;22:177–83.
44. Lloyd CM, Halstead MD, Nielsen PF. CellML: its future, present and past.Prog Biophys Mol Biol. 2004;85:433–50.
45. Krzywinski M, Birol I, Jones SJ, Marra MA. Hive plots–rational approach tovisualizing networks. Brief Bioinform. 2012;13:627–44.
46. Ashburner M, Ball CA, Blake JA, Botstein D, Butler H, Cherry JM, et al. Geneontology: tool for the unification of biology. The gene ontology consortium.Nat Genet. 2000;25:25–9.
47. Kohler J, Baumbach J, Taubert J, Specht M, Skusa A, Ruegg A, et al.Graph-based analysis and visualization of experimental results withONDEX. Bioinformatics. 2006;22:1383–90.
48. Shannon P, Markiel A, Ozier O, Baliga NS, Wang JT, Ramage D, et al.Cytoscape: a software environment for integrated models of biomolecularinteraction networks. Genome Res. 2003;13:2498–504.
49. Bastian M, Heymann S, Jacomy M. Gephi: an open source software forexploring and manipulating networks. In: International AAAI Conference onWeblogs and Social Media. 2009. https://www.aaai.org/ocs/index.php/ICWSM/09/paper/view/154. Accessed 27 July 2015.
50. Letunic I, Yamada T, Kanehisa M, Bork P. iPath: interactive exploration ofbiochemical pathways and networks. Trends Biochem Sci. 2008;33:101–3.
51. Dogrusoz U, Erson EZ, Giral E, Demir E, Babur O, Cetintas A, et al.PATIKAweb: a web interface for analyzing biological pathways throughadvanced querying and visualization. Bioinformatics. 2006;22:374–5.
52. van Iersel MP, Kelder T, Pico AR, Hanspers K, Coort S, Conklin BR, et al.Presenting and exploring biological pathways with PathVisio. BMCBioinformatics. 2008;9:399.
53. Bader GD, Cary MP, Sander C. Pathguide: a pathway resource list. NucleicAcids Res. 2006;34:D504–6.
54. Secrier M, Pavlopoulos GA, Aerts J, Schneider R. Arena3D: visualizingtime-driven phenotypic differences in biological systems. BMC Bioinformatics.2012;13:45.
55. Pavlopoulos GA, O'Donoghue SI, Satagopam VP, Soldatos TG, Pafilis E,Schneider R. Arena3D: visualization of biological networks in 3D. BMC SystBiol. 2008;2:104.
56. Freeman TC, Goldovsky L, Brosch M, van Dongen S, Maziere P, Grocock RJ,et al. Construction, visualisation, and clustering of transcription networksfrom microarray expression data. PLoS Comput Biol. 2007;3:2032–42.
57. Gehlenborg N, O'Donoghue SI, Baliga NS, Goesmann A, Hibbs MA, Kitano H,et al. Visualization of omics data for systems biology. Nat Methods.2010;7 Suppl 3:S56–68.
58. Pavlopoulos GA, Wegener AL, Schneider R. A survey of visualization toolsfor biological network analysis. BioData Min. 2008;1:12.
Pavlopoulos et al. GigaScience (2015) 4:38
22
59. Suderman M, Hallett M. Tools for visually exploring biological networks.Bioinformatics. 2007;23:2651–9.
60. Saito R, Smoot ME, Ono K, Ruscheinski J, Wang PL, Lotia S, et al. A travelguide to Cytoscape plugins. Nat Methods. 2012;9:1069–76.
61. Thimm O, Blasing O, Gibon Y, Nagel A, Meyer S, Kruger P, et al. MAPMAN:a user-driven tool to display genomics data sets onto diagrams ofmetabolic pathways and other biological processes. Plant J. 2004;37:914–39.
62. Matthews L, Gopinath G, Gillespie M, Caudy M, Croft D, de Bono B, et al.Reactome knowledgebase of human biological pathways and processes.Nucleic Acids Res. 2009;37:D619–22.
63. Klein C, Marino A, Sagot MF, Vieira Milreu P, Brilli M. Structural anddynamical analysis of biological networks. Brief Funct Genomics.2012;11:420–33.
64. Secrier M, Schneider R. PhenoTimer: software for the visual mapping oftime-resolved phenotypic landscapes. PloS One. 2013;8:e72361.
65. Secrier M, Schneider R. Visualizing time-related data in biology, a review.Brief Bioinform. 2014;15:771–82.
66. Nielsen CB, Cantor M, Dubchak I, Gordon D, Wang T. Visualizing genomes:techniques and challenges. Nat Methods. 2010;7 Suppl 3:S5–15.
67. Procter JB, Thompson J, Letunic I, Creevey C, Jossinet F, Barton GJ.Visualization of multiple alignments, phylogenies and gene family evolution.Nat Methods. 2010;7 Suppl 3:S16–25.
68. Smith TF, Waterman MS. Identification of common molecular subsequences.J Mol Biol. 1981;147:195–7.
69. Needleman SB, Wunsch CD. A general method applicable to the search forsimilarities in the amino acid sequence of two proteins. J Mol Biol.1970;48:443–53.
70. Lipman DJ, Pearson WR. Rapid and sensitive protein similarity searches.Science. 1985;227:1435–41.
71. Altschul SF, Gish W, Miller W, Myers EW, Lipman DJ. Basic local alignmentsearch tool. J Mol Biol. 1990;215:403–10.
72. Larkin MA, Blackshields G, Brown NP, Chenna R, McGettigan PA, McWilliam H,et al. Clustal W and Clustal X version 2.0. Bioinformatics. 2007;23:2947–8.
73. Edgar RC. MUSCLE: multiple sequence alignment with high accuracy andhigh throughput. Nucleic Acids Res. 2004;32:1792–7.
74. Notredame C, Higgins DG, Heringa J. T-Coffee: a novel method for fast andaccurate multiple sequence alignment. J Mol Biol. 2000;302:205–17.
75. Daugelaite J, O' Driscoll A, Sleator R. An overview of multiple sequencealignments and cloud computing in bioinformatics. ISRN Biomathematics.2013. doi:10.1155/2013/615630.
76. Gordon D, Abajian C, Green P. Consed: a graphical tool for sequencefinishing. Genome Res. 1998;8:195–202.
77. Ewing B, Hillier L, Wendl MC, Green P. Base-calling of automatedsequencer traces using phred. I. Accuracy assessment. Genome Res.1998;8:175–85.
78. Lander ES, Linton LM, Birren B, Nusbaum C, Zody MC, Baldwin J, et al. Initialsequencing and analysis of the human genome. Nature. 2001;409:860–921.
79. Venter JC, Adams MD, Myers EW, Li PW, Mural RJ, Sutton GG, et al. Thesequence of the human genome. Science. 2001;291:1304–51.
80. Bennett S. Solexa Ltd. Pharmacogenomics. 2004;5:433–8.81. Margulies M, Egholm M, Altman WE, Attiya S, Bader JS, Bemben LA, et al.
Genome sequencing in microfabricated high-density picolitre reactors.Nature. 2005;437:376–80.
82. Barabási A-L, Gulbahce N, Loscalzo J. Network medicine: a network-basedapproach to human disease. Nat Rev Genet. 2011;12:56–68.
83. Xie C, Tammi MT. CNV-seq, a new method to detect copy number variationusing high-throughput sequencing. BMC Bioinformatics. 2009;10:80.
84. Keravala A, Lee S, Thyagarajan B, Olivares EC, Gabrovsky VE, Woodard LE, etal. Mutational derivatives of PhiC31 integrase with increased efficiency andspecificity. Mol Ther. 2009;17:112–20.
85. Chiang DY, Getz G, Jaffe DB, O'Kelly MJ, Zhao X, Carter SL, et al. High-resolution mapping of copy-number alterations with massively parallelsequencing. Nat Methods. 2009;6:99–103.
86. Kim TM, Luquette LJ, Xi R, Park PJ. rSW-seq: algorithm for detection of copynumber alterations in deep sequencing data. BMC Bioinformatics. 2010;11:432.
87. Wang Z, Gerstein M, Snyder M. RNA-Seq: a revolutionary tool for transcriptomics.Nat Rev Genet. 2009;10:57–63.
88. Morin R, Bainbridge M, Fejes A, Hirst M, Krzywinski M, Pugh T, et al. Profilingthe HeLa S3 transcriptome using randomly primed cDNA and massivelyparallel short-read sequencing. Biotechniques. 2008;45:81–94.
89. Metzker ML. Sequencing technologies - the next generation. Nat Rev Genet.2010;11:31–46.
90. Hall N. Advanced sequencing technologies and their wider impact inmicrobiology. J Exp Biol. 2007;210:1518–25.
91. Li H, Homer N. A survey of sequence alignment algorithms for next-generationsequencing. Brief Bioinform. 2010;11:473–83.
92. Durbin RM, Abecasis GR, Altshuler DL, Auton A, Brooks LD, Gibbs RA, et al.A map of human genome variation from population-scale sequencing.Nature. 2010;467:1061–73.
93. Karchin R. Next generation tools for the annotation of human SNPs. BriefBioinform. 2009;10:35–52.
94. Medvedev P, Stanciu M, Brudno M. Computational methods for discoveringstructural variation with next-generation sequencing. Nat Methods.2009;6 Suppl 11:S13–20.
95. Buchanan CC, Torstenson ES, Bush WS, Ritchie MD. A comparison ofcataloged variation between International HapMap Consortium and 1000Genomes Project data. J Am Med Inform Assoc. 2012;19:289–94.
96. Tanaka T. [International HapMap project]. Nihon Rinsho. 2005;63 Suppl 12:29–34.97. Thorisson GA, Smith AV, Krishnan L, Stein LD. The International HapMap
Project web site. Genome Res. 2005;15:1592–3.98. International HapMap Consortium. Integrating ethics and science in the
International HapMap Project. Nat Rev Genet. 2004;5:467–75.99. International HapMap Consortium. The International HapMap Project.
Nature. 2003;426:789–96.100. Bonfield JK, Smith K, Staden R. A new DNA sequence assembly program.
Nucleic Acids Res. 1995;23:4992–9.101. Dear S, Staden R. A sequence assembly and editing program for efficient
management of large projects. Nucleic Acids Res. 1991;19:3907–11.102. Li H, Handsaker B, Wysoker A, Fennell T, Ruan J, Homer N, et al. The
Sequence Alignment/Map format and SAMtools. Bioinformatics.2009;25:2078–9.
103. Kent WJ, Sugnet CW, Furey TS, Roskin KM, Pringle TH, Zahler AM,et al. The human genome browser at UCSC. Genome Res.2002;12:996–1006.
104. Rutherford K, Parkhill J, Crook J, Horsnell T, Rice P, Rajandream M-A, et al.Artemis: sequence visualization and annotation. Bioinformatics.2000;16:944–5.
105. Flicek P, Amode MR, Barrell D, Beal K, Brent S, Carvalho-Silva D, et al.Ensembl 2012. Nucleic Acids Res. 2012;40:D84–90.
106. Hubbard T, Barker D, Birney E, Cameron G, Chen Y, Clark L, et al. TheEnsembl genome database project. Nucleic Acids Res. 2002;30:38–41.
107. Krzywinski M, Schein J, Birol I, Connors J, Gascoyne R, Horsman D, et al.Circos: an information aesthetic for comparative genomics. Genome Res.2009;19:1639–45.
108. Mayor C, Brudno M, Schwartz JR, Poliakov A, Rubin EM, Frazer KA, et al.VISTA: visualizing global DNA sequence alignments of arbitrary length.Bioinformatics. 2000;16:1046–7.
109. Cerami E, Gao J, Dogrusoz U, Gross BE, Sumer SO, Aksoy BA, et al. The cBiocancer genomics portal: an open platform for exploring multidimensionalcancer genomics data. Cancer Discov. 2012;2:401–4.
110. Wang J, Kong L, Gao G, Luo J. A brief introduction to web-based genomebrowsers. Brief Bioinform. 2013;14:131–43.
111. Pavlopoulos GA, Oulas A, Iacucci E, Sifrim A, Moreau Y, Schneider R, et al.Unraveling genomic variation from next generation sequencing data.BioData Min. 2013;6:13.
112. Quackenbush J. Computational analysis of microarray data. Nat Rev Genet.2001;2:418–27.
113. Mantione KJ, Kream RM, Kuzelova H, Ptacek R, Raboch J, Samuel JM,et al. Comparing bioinformatic gene expression profiling methods:microarray and RNA-Seq. Medical science monitor basic research.2014;20:138–42.
114. MAQC Consortium, Shi L, Reid LH, Jones WD, Shippy R, Warrington JA, et al.The MicroArray Quality Control (MAQC) project shows inter- andintraplatform reproducibility of gene expression measurements. NatBiotechnol. 2006;24:1151–61.
115. da Huang W, Sherman BT, Lempicki RA. Bioinformatics enrichment tools:paths toward the comprehensive functional analysis of large gene lists.Nucleic Acids Res. 2009;37:1–13.
116. da Huang W, Sherman BT, Lempicki RA. Systematic and integrative analysisof large gene lists using DAVID bioinformatics resources. Nat Protoc.2009;4:44–57.
Pavlopoulos et al. GigaScience (2015) 4:38
23
117. Mi H, Muruganujan A, Thomas PD. PANTHER in 2013: modeling theevolution of gene function, and other gene attributes, in the context ofphylogenetic trees. Nucleic Acids Res. 2013;41:D377–86.
118. Zhang B, Kirov S, Snoddy J. WebGestalt: an integrated system forexploring gene sets in various biological contexts. Nucleic Acids Res.2005;33:W741–8.
119. MacQueen J. Some methods for classification and analysis of multivariateobservations. In: Proceedings of the Fifth Berkeley Symposium onMathematical Statistics and Probability, Volume 1. Berkeley: University ofCalifornia Press; 1967. p. 281–97.
120. Saitou N, Nei M. The neighbor-joining method: a new method forreconstructing phylogenetic trees. Mol Biol Evol. 1987;4:406–25.
121. Li Y, Xu L. Unweighted multiple group method with arithmetic mean. 2010IEEE Fifth International Conference on Bio-Inspired Computing: Theories andApplications (BIC-TA). 2010;830–4.
122. Kumar S, Tamura K, Jakobsen IB, Nei M. MEGA2: molecular evolutionarygenetics analysis software. Bioinformatics. 2001;17:1244–5.
123. Ludwig W, Strunk O, Westram R, Richter L, Meier H, Yadhukumar, et al.ARB: a software environment for sequence data. Nucleic Acids Res.2004;32:1363–71.
124. Perriere G, Gouy M. WWW-query: an on-line retrieval system for biologicalsequence banks. Biochimie. 1996;78:364–9.
125. Huson DH, Richter DC, Rausch C, Dezulian T, Franz M, Rupp R. Dendroscope:an interactive viewer for large phylogenetic trees. BMC Bioinformatics.2007;8:460.
126. Letunic I, Bork P. Interactive Tree Of Life (iTOL): an online tool forphylogenetic tree display and annotation. Bioinformatics. 2007;23:127–8.
127. Saeed AI, Sharov V, White J, Li J, Liang W, Bhagabati N, et al. TM4: a free,open-source system for microarray data management and analysis.Biotechniques. 2003;34:374–8.
128. Sturn A, Quackenbush J, Trajanoski Z. Genesis: cluster analysis of microarraydata. Bioinformatics. 2002;18:207–8.
129. Reich M, Liefeld T, Gould J, Lerner J, Tamayo P, Mesirov JP. GenePattern 2.0.Nat Genet. 2006;38:500–1.
130. Shamir R, Maron-Katz A, Tanay A, Linhart C, Steinfeld I, Sharan R, et al.EXPANDER–an integrative program suite for microarray data analysis.BMC Bioinformatics. 2005;6:232.
131. R Development Core Team. R: A Language and Environment for StatisticalComputing. Vienna: R Foundation for Statistical Computing; 2008.
132. Huber W, Carey VJ, Gentleman R, Anders S, Carlson M, Carvalho BS, et al.Orchestrating high-throughput genomic analysis with Bioconductor.Nat Methods. 2015;12:115–21.
133. Fry B, Reas C. Processing. 2015. http://processing.org. Accessed 30 July 2015.134. Fry B, Reas C, Resig, J. Processing.js. 2015. http://processingjs.org. Accessed
30 July 2015.135. Bostock M. Data-Driven Documents. 2015. http://d3js.org/. Accessed 30 July
2015.136. O'Donoghue SI, Gavin AC, Gehlenborg N, Goodsell DS, Heriche JK, Nielsen
CB, et al. Visualizing biological data-now and in the future. Nat Methods.2010;7 Suppl 3:S2–4.
137. Thomas J, Cook KA. Illuminating the path: the research and developmentagenda for visual analytics. National Visualization and Analytics Center. 2005.http://vis.pnnl.gov/pdf/RD_Agenda_VisualAnalytics.pdf. Accessed 27 July 2015.
138. Karam M, Schraefel. A taxonomy of gestures in human computerinteractions. In: Electronics and Computer Science. Southampton: Universityof Southampton; 2005. p. 1–45.
139. Sabir K, Stolte C, Tabor B, O'Donoghue SI. The molecular control toolkit:controlling 3D molecular graphics via gesture and voice. IEEE Symposiumon Biological Data Visualization (BioVis). 2013;2013:49–56. doi:10.1109/BioVis.2013.6664346.
140. Yang Y, Engin L, Wurtele ES, Cruz-Neira C, Dickerson JA. Integration ofmetabolic networks and gene expression in virtual reality. Bioinformatics.2005;21:3645–50.
141. Burrage K, Hood L, Ragan MA. Advanced computing for systems biology.Brief Bioinform. 2006;7:390–8.
142. McComb T, Cairncross O, Noske AB, Wood DL, Marsh BJ, Ragan MA.Illoura: a software tool for analysis, visualization and semantic queryingof cellular and other spatial biological data. Bioinformatics.2009;25:1208–10.
143. Loew LM, Schaff JC. The Virtual Cell: a software environment forcomputational cell biology. Trends Biotechnol. 2001;19:401–6.
144. McClean P, Johnson C, Rogers R, Daniels L, Reber J, Slator BM, et al.Molecular and cellular biology animations: development and impact onstudent learning. Cell Biol Educ. 2005;4:169–79.
145. Kaufmann H. Collaborative Augmented Reality in Education. ImaginaConference 2003;TUW-137414.
146. Garcia-Garcia J, Guney E, Aragues R, Planas-Iglesias J, Oliva B. Biana: asoftware framework for compiling biological interactions and analyzingnetworks. BMC Bioinformatics. 2010;11:56.
147. Theocharidis A, van Dongen S, Enright AJ, Freeman TC. Networkvisualization and analysis of gene expression data using BioLayoutExpress(3D). Nat Protoc. 2009;4:1535–50.
148. Baitaluk M, Sedova M, Ray A, Gupta A. BiologicalNetworks: visualization andanalysis tool for systems biology. Nucleic Acids Res. 2006;34:W466–71.
149. Kozhenkov S, Sedova M, Dubinina Y, Gupta A, Ray A, Ponomarenko J, et al.BiologicalNetworks–tools enabling the integration of multi-scale data forthe host-pathogen studies. BMC Syst Biol. 2011;5:7.
150. Sirava M, Schafer T, Eiglsperger M, Kaufmann M, Kohlbacher O,Bornberg-Bauer E, et al. BioMiner–modeling, analyzing, andvisualizing biochemical pathways and networks. Bioinformatics.2002;18 Suppl 2:S219–30.
151. Nagasaki M, Saito A, Jeong E, Li C, Kojima K, Ikeda E, et al. Cell Illustrator 4.0:a computational platform for systems biology. In Silico Biol. 2010;10:5–26.
152. Hoops S, Sahle S, Gauges R, Lee C, Pahle J, Simus N, et al. COPASI–aCOmplex PAthway SImulator. Bioinformatics. 2006;22:3067–74.
153. Smoot ME, Ono K, Ruscheinski J, Wang PL, Ideker T. Cytoscape 2.8: newfeatures for data integration and network visualization. Bioinformatics.2011;27:431–2.
154. Ramsey S, Orrell D, Bolouri H. Dizzy: stochastic simulation of large-scalegenetic regulatory networks. J Bioinform Comput Biol. 2005;3:415–36.
155. Kauffman J, Kittas A, Bennett L, Tsoka S. DyCoNet: a Gephi plugin forcommunity detection in dynamic complex networks. PloS One.2014;9:e101357.
156. Westenberg MA, van Hijum SAFT, Kuipers OP, Roerdink JBTM. Visualizinggenome expression and regulatory network dynamics in genomic andmetabolic context. Comput Graph Forum. 2008;27:887–94.
157. Baker C, Carpendale S, Prusinkiewicz P, Surette M. GeneVis: simulation andvisualization of genetic networks. Information Visualization. 2003;2:201–17.
158. Csardi G, Nepusz T. The igraph software package for complex networkresearch. InterJournal Complex Syst. 2006;1695.
159. Hooper SD, Bork P. Medusa: a simple tool for interaction graph analysis.Bioinformatics. 2005;21:4432–3.
160. Pavlopoulos GA, Hooper SD, Sifrim A, Schneider R, Aerts J. Medusa: a toolfor exploring and clustering biological networks. BMC Res Notes. 2011;4:384.
161. Brown KR, Otasek D, Ali M, McGuffin MJ, Xie W, Devani B, et al. NAViGaTOR:network analysis. Visualization and Graphing Toronto Bioinformatics.2009;25:3327–9.
162. Djebbari A, Ali M, Otasek D, Kotlyar M, Fortney K, Wong S, et al. NAViGaTOR:large scalable and interactive navigation and analysis of large graphs.Internet Math. 2011;7:314–47.
163. Kao HL, Gunsalus KC. Browsing multidimensional molecular networks withthe generic network browser (N-Browse). Curr Protoc Bioinf. 2008: Chapter9:Unit 9.11.
164. Nikitin A, Egorov S, Daraselia N, Mazo I. Pathway studio–the analysis andnavigation of molecular networks. Bioinformatics. 2003;19:2155–7.
165. Orlev N, Shamir R, Shiloh Y. PIVOT: protein interacions visualizatiOn tool.Bioinformatics. 2004;20:424–5.
166. Krumsiek J, Friedel CC, Zimmer R. ProCope–protein complex prediction andevaluation. Bioinformatics. 2008;24:2115–16.
167. Iragne F, Nikolski M, Mathieu B, Auber D, Sherman D. ProViz: proteininteraction visualization and exploration. Bioinformatics. 2005;21:272–4.
168. Forman JJ, Clemons PA, Schreiber SL, Haggarty SJ. SpectralNET–an applicationfor spectral graph analysis and visualization. BMC Bioinformatics. 2005;6:260.
169. Auber D. A huge graph visualization framework. In: Mutzel P, Jünger M,editors. Graph Drawing Software (Mathematics and Visualization).Heidelberg: Springer; 2004. p. 105–26.
170. Brinkrolf C, Janowski SJ, Kormeier B, Lewinski M, Hippe K, Borck D, et al.VANESA - a software application for the visualization and analysis ofnetworks in system biology applications. J Integr Bioinform. 2014;11:239.
171. Junker BH, Klukas C, Schreiber F. VANTED: a system for advanced dataanalysis and visualization in the context of biological networks. BMCBioinformatics. 2006;7:109.
Pavlopoulos et al. GigaScience (2015) 4:38
24
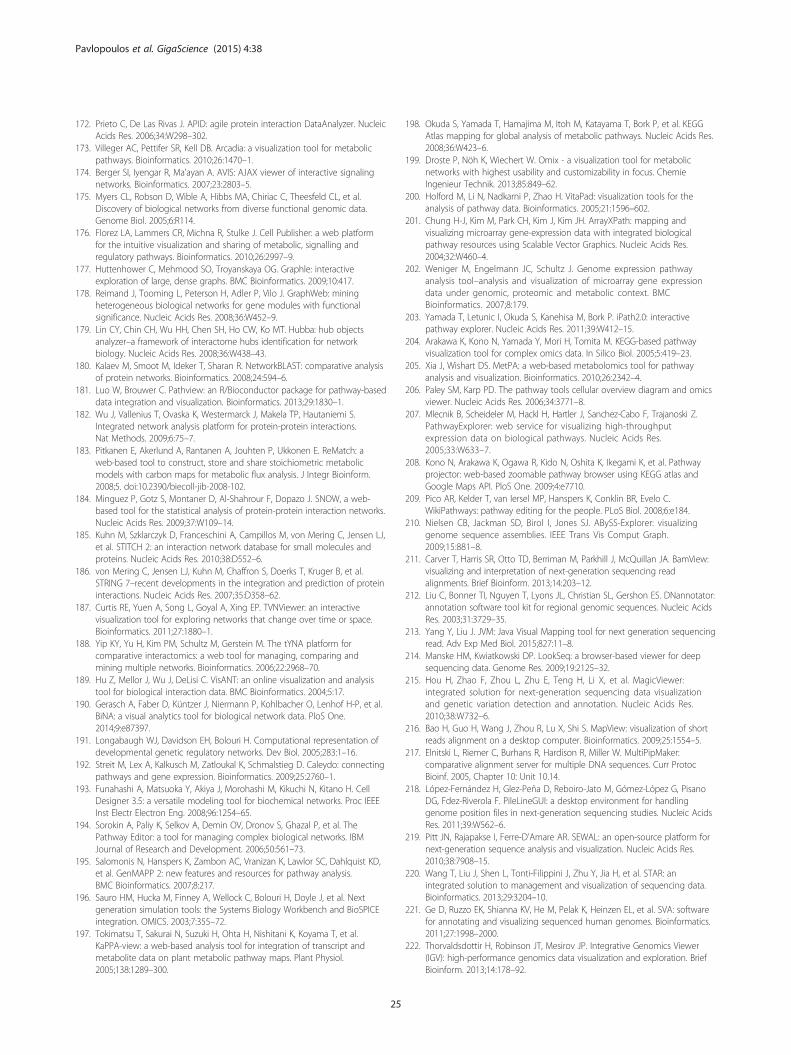
172. Prieto C, De Las Rivas J. APID: agile protein interaction DataAnalyzer. NucleicAcids Res. 2006;34:W298–302.
173. Villeger AC, Pettifer SR, Kell DB. Arcadia: a visualization tool for metabolicpathways. Bioinformatics. 2010;26:1470–1.
174. Berger SI, Iyengar R, Ma'ayan A. AVIS: AJAX viewer of interactive signalingnetworks. Bioinformatics. 2007;23:2803–5.
175. Myers CL, Robson D, Wible A, Hibbs MA, Chiriac C, Theesfeld CL, et al.Discovery of biological networks from diverse functional genomic data.Genome Biol. 2005;6:R114.
176. Florez LA, Lammers CR, Michna R, Stulke J. Cell Publisher: a web platformfor the intuitive visualization and sharing of metabolic, signalling andregulatory pathways. Bioinformatics. 2010;26:2997–9.
177. Huttenhower C, Mehmood SO, Troyanskaya OG. Graphle: interactiveexploration of large, dense graphs. BMC Bioinformatics. 2009;10:417.
178. Reimand J, Tooming L, Peterson H, Adler P, Vilo J. GraphWeb: miningheterogeneous biological networks for gene modules with functionalsignificance. Nucleic Acids Res. 2008;36:W452–9.
179. Lin CY, Chin CH, Wu HH, Chen SH, Ho CW, Ko MT. Hubba: hub objectsanalyzer–a framework of interactome hubs identification for networkbiology. Nucleic Acids Res. 2008;36:W438–43.
180. Kalaev M, Smoot M, Ideker T, Sharan R. NetworkBLAST: comparative analysisof protein networks. Bioinformatics. 2008;24:594–6.
181. Luo W, Brouwer C. Pathview: an R/Bioconductor package for pathway-baseddata integration and visualization. Bioinformatics. 2013;29:1830–1.
182. Wu J, Vallenius T, Ovaska K, Westermarck J, Makela TP, Hautaniemi S.Integrated network analysis platform for protein-protein interactions.Nat Methods. 2009;6:75–7.
183. Pitkanen E, Akerlund A, Rantanen A, Jouhten P, Ukkonen E. ReMatch: aweb-based tool to construct, store and share stoichiometric metabolicmodels with carbon maps for metabolic flux analysis. J Integr Bioinform.2008;5. doi:10.2390/biecoll-jib-2008-102.
184. Minguez P, Gotz S, Montaner D, Al-Shahrour F, Dopazo J. SNOW, a web-based tool for the statistical analysis of protein-protein interaction networks.Nucleic Acids Res. 2009;37:W109–14.
185. Kuhn M, Szklarczyk D, Franceschini A, Campillos M, von Mering C, Jensen LJ,et al. STITCH 2: an interaction network database for small molecules andproteins. Nucleic Acids Res. 2010;38:D552–6.
186. von Mering C, Jensen LJ, Kuhn M, Chaffron S, Doerks T, Kruger B, et al.STRING 7–recent developments in the integration and prediction of proteininteractions. Nucleic Acids Res. 2007;35:D358–62.
187. Curtis RE, Yuen A, Song L, Goyal A, Xing EP. TVNViewer: an interactivevisualization tool for exploring networks that change over time or space.Bioinformatics. 2011;27:1880–1.
188. Yip KY, Yu H, Kim PM, Schultz M, Gerstein M. The tYNA platform forcomparative interactomics: a web tool for managing, comparing andmining multiple networks. Bioinformatics. 2006;22:2968–70.
189. Hu Z, Mellor J, Wu J, DeLisi C. VisANT: an online visualization and analysistool for biological interaction data. BMC Bioinformatics. 2004;5:17.
190. Gerasch A, Faber D, Küntzer J, Niermann P, Kohlbacher O, Lenhof H-P, et al.BiNA: a visual analytics tool for biological network data. PloS One.2014;9:e87397.
191. Longabaugh WJ, Davidson EH, Bolouri H. Computational representation ofdevelopmental genetic regulatory networks. Dev Biol. 2005;283:1–16.
192. Streit M, Lex A, Kalkusch M, Zatloukal K, Schmalstieg D. Caleydo: connectingpathways and gene expression. Bioinformatics. 2009;25:2760–1.
193. Funahashi A, Matsuoka Y, Akiya J, Morohashi M, Kikuchi N, Kitano H. CellDesigner 3.5: a versatile modeling tool for biochemical networks. Proc IEEEInst Electr Electron Eng. 2008;96:1254–65.
194. Sorokin A, Paliy K, Selkov A, Demin OV, Dronov S, Ghazal P, et al. ThePathway Editor: a tool for managing complex biological networks. IBMJournal of Research and Development. 2006;50:561–73.
195. Salomonis N, Hanspers K, Zambon AC, Vranizan K, Lawlor SC, Dahlquist KD,et al. GenMAPP 2: new features and resources for pathway analysis.BMC Bioinformatics. 2007;8:217.
196. Sauro HM, Hucka M, Finney A, Wellock C, Bolouri H, Doyle J, et al. Nextgeneration simulation tools: the Systems Biology Workbench and BioSPICEintegration. OMICS. 2003;7:355–72.
197. Tokimatsu T, Sakurai N, Suzuki H, Ohta H, Nishitani K, Koyama T, et al.KaPPA-view: a web-based analysis tool for integration of transcript andmetabolite data on plant metabolic pathway maps. Plant Physiol.2005;138:1289–300.
198. Okuda S, Yamada T, Hamajima M, Itoh M, Katayama T, Bork P, et al. KEGGAtlas mapping for global analysis of metabolic pathways. Nucleic Acids Res.2008;36:W423–6.
199. Droste P, Nöh K, Wiechert W. Omix - a visualization tool for metabolicnetworks with highest usability and customizability in focus. ChemieIngenieur Technik. 2013;85:849–62.
200. Holford M, Li N, Nadkarni P, Zhao H. VitaPad: visualization tools for theanalysis of pathway data. Bioinformatics. 2005;21:1596–602.
201. Chung H-J, Kim M, Park CH, Kim J, Kim JH. ArrayXPath: mapping andvisualizing microarray gene-expression data with integrated biologicalpathway resources using Scalable Vector Graphics. Nucleic Acids Res.2004;32:W460–4.
202. Weniger M, Engelmann JC, Schultz J. Genome expression pathwayanalysis tool–analysis and visualization of microarray gene expressiondata under genomic, proteomic and metabolic context. BMCBioinformatics. 2007;8:179.
203. Yamada T, Letunic I, Okuda S, Kanehisa M, Bork P. iPath2.0: interactivepathway explorer. Nucleic Acids Res. 2011;39:W412–15.
204. Arakawa K, Kono N, Yamada Y, Mori H, Tomita M. KEGG-based pathwayvisualization tool for complex omics data. In Silico Biol. 2005;5:419–23.
205. Xia J, Wishart DS. MetPA: a web-based metabolomics tool for pathwayanalysis and visualization. Bioinformatics. 2010;26:2342–4.
206. Paley SM, Karp PD. The pathway tools cellular overview diagram and omicsviewer. Nucleic Acids Res. 2006;34:3771–8.
207. Mlecnik B, Scheideler M, Hackl H, Hartler J, Sanchez-Cabo F, Trajanoski Z.PathwayExplorer: web service for visualizing high-throughputexpression data on biological pathways. Nucleic Acids Res.2005;33:W633–7.
208. Kono N, Arakawa K, Ogawa R, Kido N, Oshita K, Ikegami K, et al. Pathwayprojector: web-based zoomable pathway browser using KEGG atlas andGoogle Maps API. PloS One. 2009;4:e7710.
209. Pico AR, Kelder T, van Iersel MP, Hanspers K, Conklin BR, Evelo C.WikiPathways: pathway editing for the people. PLoS Biol. 2008;6:e184.
210. Nielsen CB, Jackman SD, Birol I, Jones SJ. ABySS-Explorer: visualizinggenome sequence assemblies. IEEE Trans Vis Comput Graph.2009;15:881–8.
211. Carver T, Harris SR, Otto TD, Berriman M, Parkhill J, McQuillan JA. BamView:visualizing and interpretation of next-generation sequencing readalignments. Brief Bioinform. 2013;14:203–12.
212. Liu C, Bonner TI, Nguyen T, Lyons JL, Christian SL, Gershon ES. DNannotator:annotation software tool kit for regional genomic sequences. Nucleic AcidsRes. 2003;31:3729–35.
213. Yang Y, Liu J. JVM: Java Visual Mapping tool for next generation sequencingread. Adv Exp Med Biol. 2015;827:11–8.
214. Manske HM, Kwiatkowski DP. LookSeq: a browser-based viewer for deepsequencing data. Genome Res. 2009;19:2125–32.
215. Hou H, Zhao F, Zhou L, Zhu E, Teng H, Li X, et al. MagicViewer:integrated solution for next-generation sequencing data visualizationand genetic variation detection and annotation. Nucleic Acids Res.2010;38:W732–6.
216. Bao H, Guo H, Wang J, Zhou R, Lu X, Shi S. MapView: visualization of shortreads alignment on a desktop computer. Bioinformatics. 2009;25:1554–5.
217. Elnitski L, Riemer C, Burhans R, Hardison R, Miller W. MultiPipMaker:comparative alignment server for multiple DNA sequences. Curr ProtocBioinf. 2005, Chapter 10: Unit 10.14.
218. López-Fernández H, Glez-Peña D, Reboiro-Jato M, Gómez-López G, PisanoDG, Fdez-Riverola F. PileLineGUI: a desktop environment for handlinggenome position files in next-generation sequencing studies. Nucleic AcidsRes. 2011;39:W562–6.
219. Pitt JN, Rajapakse I, Ferre-D'Amare AR. SEWAL: an open-source platform fornext-generation sequence analysis and visualization. Nucleic Acids Res.2010;38:7908–15.
220. Wang T, Liu J, Shen L, Tonti-Filippini J, Zhu Y, Jia H, et al. STAR: anintegrated solution to management and visualization of sequencing data.Bioinformatics. 2013;29:3204–10.
221. Ge D, Ruzzo EK, Shianna KV, He M, Pelak K, Heinzen EL, et al. SVA: softwarefor annotating and visualizing sequenced human genomes. Bioinformatics.2011;27:1998–2000.
222. Thorvaldsdottir H, Robinson JT, Mesirov JP. Integrative Genomics Viewer(IGV): high-performance genomics data visualization and exploration. BriefBioinform. 2013;14:178–92.
Pavlopoulos et al. GigaScience (2015) 4:38
25
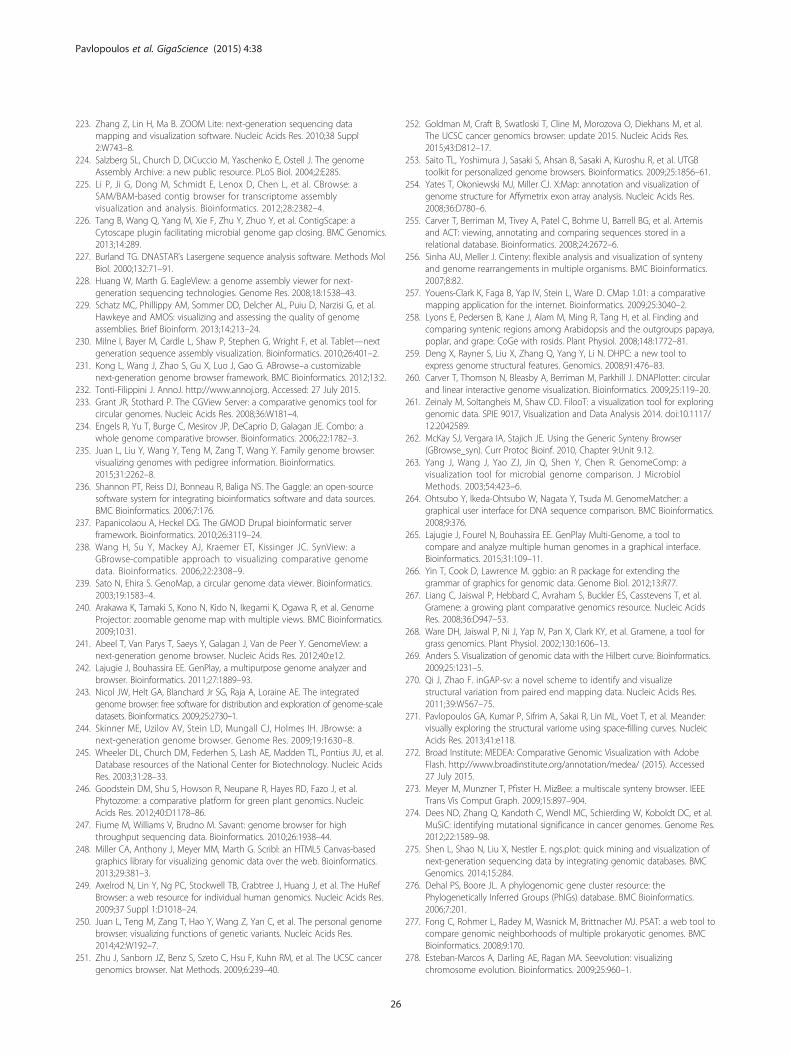
223. Zhang Z, Lin H, Ma B. ZOOM Lite: next-generation sequencing datamapping and visualization software. Nucleic Acids Res. 2010;38 Suppl2:W743–8.
224. Salzberg SL, Church D, DiCuccio M, Yaschenko E, Ostell J. The genomeAssembly Archive: a new public resource. PLoS Biol. 2004;2:E285.
225. Li P, Ji G, Dong M, Schmidt E, Lenox D, Chen L, et al. CBrowse: aSAM/BAM-based contig browser for transcriptome assemblyvisualization and analysis. Bioinformatics. 2012;28:2382–4.
226. Tang B, Wang Q, Yang M, Xie F, Zhu Y, Zhuo Y, et al. ContigScape: aCytoscape plugin facilitating microbial genome gap closing. BMC Genomics.2013;14:289.
227. Burland TG. DNASTAR's Lasergene sequence analysis software. Methods MolBiol. 2000;132:71–91.
228. Huang W, Marth G. EagleView: a genome assembly viewer for next-generation sequencing technologies. Genome Res. 2008;18:1538–43.
229. Schatz MC, Phillippy AM, Sommer DD, Delcher AL, Puiu D, Narzisi G, et al.Hawkeye and AMOS: visualizing and assessing the quality of genomeassemblies. Brief Bioinform. 2013;14:213–24.
230. Milne I, Bayer M, Cardle L, Shaw P, Stephen G, Wright F, et al. Tablet—nextgeneration sequence assembly visualization. Bioinformatics. 2010;26:401–2.
231. Kong L, Wang J, Zhao S, Gu X, Luo J, Gao G. ABrowse–a customizablenext-generation genome browser framework. BMC Bioinformatics. 2012;13:2.
232. Tonti-Filippini J. AnnoJ. http://www.annoj.org. Accessed: 27 July 2015.233. Grant JR, Stothard P. The CGView Server: a comparative genomics tool for
circular genomes. Nucleic Acids Res. 2008;36:W181–4.234. Engels R, Yu T, Burge C, Mesirov JP, DeCaprio D, Galagan JE. Combo: a
whole genome comparative browser. Bioinformatics. 2006;22:1782–3.235. Juan L, Liu Y, Wang Y, Teng M, Zang T, Wang Y. Family genome browser:
visualizing genomes with pedigree information. Bioinformatics.2015;31:2262–8.
236. Shannon PT, Reiss DJ, Bonneau R, Baliga NS. The Gaggle: an open-sourcesoftware system for integrating bioinformatics software and data sources.BMC Bioinformatics. 2006;7:176.
237. Papanicolaou A, Heckel DG. The GMOD Drupal bioinformatic serverframework. Bioinformatics. 2010;26:3119–24.
238. Wang H, Su Y, Mackey AJ, Kraemer ET, Kissinger JC. SynView: aGBrowse-compatible approach to visualizing comparative genomedata. Bioinformatics. 2006;22:2308–9.
239. Sato N, Ehira S. GenoMap, a circular genome data viewer. Bioinformatics.2003;19:1583–4.
240. Arakawa K, Tamaki S, Kono N, Kido N, Ikegami K, Ogawa R, et al. GenomeProjector: zoomable genome map with multiple views. BMC Bioinformatics.2009;10:31.
241. Abeel T, Van Parys T, Saeys Y, Galagan J, Van de Peer Y. GenomeView: anext-generation genome browser. Nucleic Acids Res. 2012;40:e12.
242. Lajugie J, Bouhassira EE. GenPlay, a multipurpose genome analyzer andbrowser. Bioinformatics. 2011;27:1889–93.
243. Nicol JW, Helt GA, Blanchard Jr SG, Raja A, Loraine AE. The integratedgenome browser: free software for distribution and exploration of genome-scaledatasets. Bioinformatics. 2009;25:2730–1.
244. Skinner ME, Uzilov AV, Stein LD, Mungall CJ, Holmes IH. JBrowse: anext-generation genome browser. Genome Res. 2009;19:1630–8.
245. Wheeler DL, Church DM, Federhen S, Lash AE, Madden TL, Pontius JU, et al.Database resources of the National Center for Biotechnology. Nucleic AcidsRes. 2003;31:28–33.
246. Goodstein DM, Shu S, Howson R, Neupane R, Hayes RD, Fazo J, et al.Phytozome: a comparative platform for green plant genomics. NucleicAcids Res. 2012;40:D1178–86.
247. Fiume M, Williams V, Brudno M. Savant: genome browser for highthroughput sequencing data. Bioinformatics. 2010;26:1938–44.
248. Miller CA, Anthony J, Meyer MM, Marth G. Scribl: an HTML5 Canvas-basedgraphics library for visualizing genomic data over the web. Bioinformatics.2013;29:381–3.
249. Axelrod N, Lin Y, Ng PC, Stockwell TB, Crabtree J, Huang J, et al. The HuRefBrowser: a web resource for individual human genomics. Nucleic Acids Res.2009;37 Suppl 1:D1018–24.
250. Juan L, Teng M, Zang T, Hao Y, Wang Z, Yan C, et al. The personal genomebrowser: visualizing functions of genetic variants. Nucleic Acids Res.2014;42:W192–7.
251. Zhu J, Sanborn JZ, Benz S, Szeto C, Hsu F, Kuhn RM, et al. The UCSC cancergenomics browser. Nat Methods. 2009;6:239–40.
252. Goldman M, Craft B, Swatloski T, Cline M, Morozova O, Diekhans M, et al.The UCSC cancer genomics browser: update 2015. Nucleic Acids Res.2015;43:D812–17.
253. Saito TL, Yoshimura J, Sasaki S, Ahsan B, Sasaki A, Kuroshu R, et al. UTGBtoolkit for personalized genome browsers. Bioinformatics. 2009;25:1856–61.
254. Yates T, Okoniewski MJ, Miller CJ. X:Map: annotation and visualization ofgenome structure for Affymetrix exon array analysis. Nucleic Acids Res.2008;36:D780–6.
255. Carver T, Berriman M, Tivey A, Patel C, Bohme U, Barrell BG, et al. Artemisand ACT: viewing, annotating and comparing sequences stored in arelational database. Bioinformatics. 2008;24:2672–6.
256. Sinha AU, Meller J. Cinteny: flexible analysis and visualization of syntenyand genome rearrangements in multiple organisms. BMC Bioinformatics.2007;8:82.
257. Youens-Clark K, Faga B, Yap IV, Stein L, Ware D. CMap 1.01: a comparativemapping application for the internet. Bioinformatics. 2009;25:3040–2.
258. Lyons E, Pedersen B, Kane J, Alam M, Ming R, Tang H, et al. Finding andcomparing syntenic regions among Arabidopsis and the outgroups papaya,poplar, and grape: CoGe with rosids. Plant Physiol. 2008;148:1772–81.
259. Deng X, Rayner S, Liu X, Zhang Q, Yang Y, Li N. DHPC: a new tool toexpress genome structural features. Genomics. 2008;91:476–83.
260. Carver T, Thomson N, Bleasby A, Berriman M, Parkhill J. DNAPlotter: circularand linear interactive genome visualization. Bioinformatics. 2009;25:119–20.
261. Zeinaly M, Soltangheis M, Shaw CD. FilooT: a visualization tool for exploringgenomic data. SPIE 9017, Visualization and Data Analysis 2014. doi:10.1117/12.2042589.
262. McKay SJ, Vergara IA, Stajich JE. Using the Generic Synteny Browser(GBrowse_syn). Curr Protoc Bioinf. 2010, Chapter 9:Unit 9.12.
263. Yang J, Wang J, Yao ZJ, Jin Q, Shen Y, Chen R. GenomeComp: avisualization tool for microbial genome comparison. J MicrobiolMethods. 2003;54:423–6.
264. Ohtsubo Y, Ikeda-Ohtsubo W, Nagata Y, Tsuda M. GenomeMatcher: agraphical user interface for DNA sequence comparison. BMC Bioinformatics.2008;9:376.
265. Lajugie J, Fourel N, Bouhassira EE. GenPlay Multi-Genome, a tool tocompare and analyze multiple human genomes in a graphical interface.Bioinformatics. 2015;31:109–11.
266. Yin T, Cook D, Lawrence M. ggbio: an R package for extending thegrammar of graphics for genomic data. Genome Biol. 2012;13:R77.
267. Liang C, Jaiswal P, Hebbard C, Avraham S, Buckler ES, Casstevens T, et al.Gramene: a growing plant comparative genomics resource. Nucleic AcidsRes. 2008;36:D947–53.
268. Ware DH, Jaiswal P, Ni J, Yap IV, Pan X, Clark KY, et al. Gramene, a tool forgrass genomics. Plant Physiol. 2002;130:1606–13.
269. Anders S. Visualization of genomic data with the Hilbert curve. Bioinformatics.2009;25:1231–5.
270. Qi J, Zhao F. inGAP-sv: a novel scheme to identify and visualizestructural variation from paired end mapping data. Nucleic Acids Res.2011;39:W567–75.
271. Pavlopoulos GA, Kumar P, Sifrim A, Sakai R, Lin ML, Voet T, et al. Meander:visually exploring the structural variome using space-filling curves. NucleicAcids Res. 2013;41:e118.
272. Broad Institute: MEDEA: Comparative Genomic Visualization with AdobeFlash. http://www.broadinstitute.org/annotation/medea/ (2015). Accessed27 July 2015.
273. Meyer M, Munzner T, Pfister H. MizBee: a multiscale synteny browser. IEEETrans Vis Comput Graph. 2009;15:897–904.
274. Dees ND, Zhang Q, Kandoth C, Wendl MC, Schierding W, Koboldt DC, et al.MuSiC: identifying mutational significance in cancer genomes. Genome Res.2012;22:1589–98.
275. Shen L, Shao N, Liu X, Nestler E. ngs.plot: quick mining and visualization ofnext-generation sequencing data by integrating genomic databases. BMCGenomics. 2014;15:284.
276. Dehal PS, Boore JL. A phylogenomic gene cluster resource: thePhylogenetically Inferred Groups (PhIGs) database. BMC Bioinformatics.2006;7:201.
277. Fong C, Rohmer L, Radey M, Wasnick M, Brittnacher MJ. PSAT: a web tool tocompare genomic neighborhoods of multiple prokaryotic genomes. BMCBioinformatics. 2008;9:170.
278. Esteban-Marcos A, Darling AE, Ragan MA. Seevolution: visualizingchromosome evolution. Bioinformatics. 2009;25:960–1.
Pavlopoulos et al. GigaScience (2015) 4:38
26
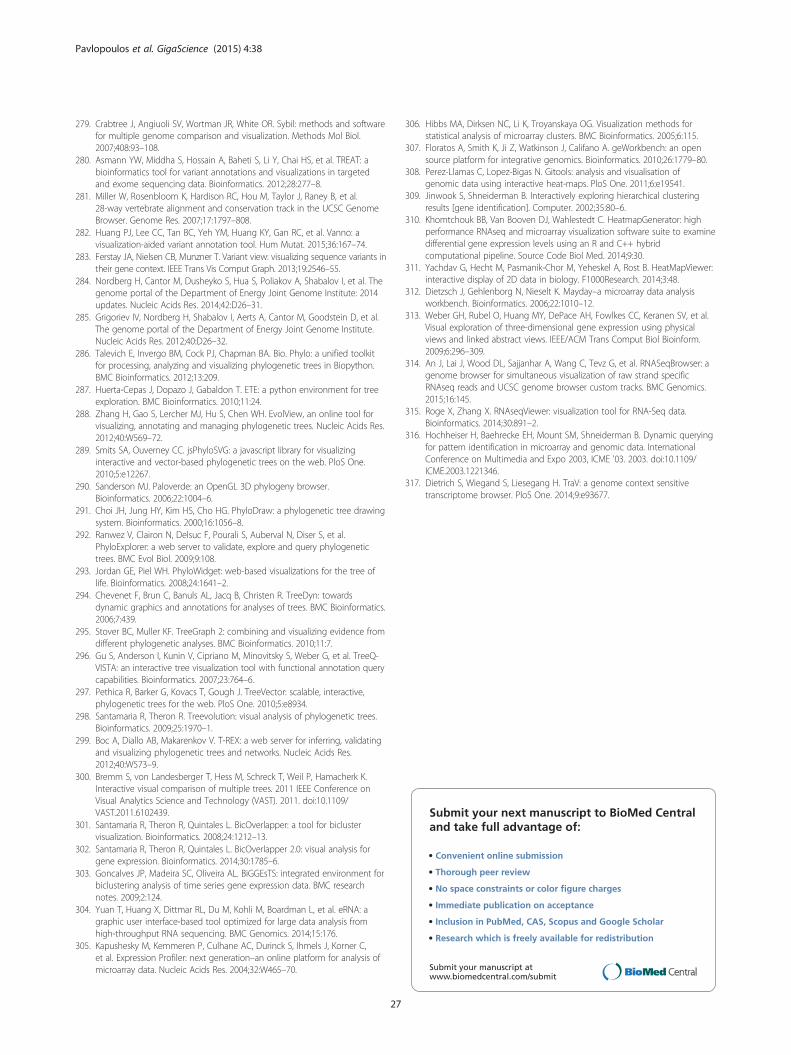
279. Crabtree J, Angiuoli SV, Wortman JR, White OR. Sybil: methods and softwarefor multiple genome comparison and visualization. Methods Mol Biol.2007;408:93–108.
280. Asmann YW, Middha S, Hossain A, Baheti S, Li Y, Chai HS, et al. TREAT: abioinformatics tool for variant annotations and visualizations in targetedand exome sequencing data. Bioinformatics. 2012;28:277–8.
281. Miller W, Rosenbloom K, Hardison RC, Hou M, Taylor J, Raney B, et al.28-way vertebrate alignment and conservation track in the UCSC GenomeBrowser. Genome Res. 2007;17:1797–808.
282. Huang PJ, Lee CC, Tan BC, Yeh YM, Huang KY, Gan RC, et al. Vanno: avisualization-aided variant annotation tool. Hum Mutat. 2015;36:167–74.
283. Ferstay JA, Nielsen CB, Munzner T. Variant view: visualizing sequence variants intheir gene context. IEEE Trans Vis Comput Graph. 2013;19:2546–55.
284. Nordberg H, Cantor M, Dusheyko S, Hua S, Poliakov A, Shabalov I, et al. Thegenome portal of the Department of Energy Joint Genome Institute: 2014updates. Nucleic Acids Res. 2014;42:D26–31.
285. Grigoriev IV, Nordberg H, Shabalov I, Aerts A, Cantor M, Goodstein D, et al.The genome portal of the Department of Energy Joint Genome Institute.Nucleic Acids Res. 2012;40:D26–32.
286. Talevich E, Invergo BM, Cock PJ, Chapman BA. Bio. Phylo: a unified toolkitfor processing, analyzing and visualizing phylogenetic trees in Biopython.BMC Bioinformatics. 2012;13:209.
287. Huerta-Cepas J, Dopazo J, Gabaldon T. ETE: a python environment for treeexploration. BMC Bioinformatics. 2010;11:24.
288. Zhang H, Gao S, Lercher MJ, Hu S, Chen WH. EvolView, an online tool forvisualizing, annotating and managing phylogenetic trees. Nucleic Acids Res.2012;40:W569–72.
289. Smits SA, Ouverney CC. jsPhyloSVG: a javascript library for visualizinginteractive and vector-based phylogenetic trees on the web. PloS One.2010;5:e12267.
290. Sanderson MJ. Paloverde: an OpenGL 3D phylogeny browser.Bioinformatics. 2006;22:1004–6.
291. Choi JH, Jung HY, Kim HS, Cho HG. PhyloDraw: a phylogenetic tree drawingsystem. Bioinformatics. 2000;16:1056–8.
292. Ranwez V, Clairon N, Delsuc F, Pourali S, Auberval N, Diser S, et al.PhyloExplorer: a web server to validate, explore and query phylogenetictrees. BMC Evol Biol. 2009;9:108.
293. Jordan GE, Piel WH. PhyloWidget: web-based visualizations for the tree oflife. Bioinformatics. 2008;24:1641–2.
294. Chevenet F, Brun C, Banuls AL, Jacq B, Christen R. TreeDyn: towardsdynamic graphics and annotations for analyses of trees. BMC Bioinformatics.2006;7:439.
295. Stover BC, Muller KF. TreeGraph 2: combining and visualizing evidence fromdifferent phylogenetic analyses. BMC Bioinformatics. 2010;11:7.
296. Gu S, Anderson I, Kunin V, Cipriano M, Minovitsky S, Weber G, et al. TreeQ-VISTA: an interactive tree visualization tool with functional annotation querycapabilities. Bioinformatics. 2007;23:764–6.
297. Pethica R, Barker G, Kovacs T, Gough J. TreeVector: scalable, interactive,phylogenetic trees for the web. PloS One. 2010;5:e8934.
298. Santamaria R, Theron R. Treevolution: visual analysis of phylogenetic trees.Bioinformatics. 2009;25:1970–1.
299. Boc A, Diallo AB, Makarenkov V. T-REX: a web server for inferring, validatingand visualizing phylogenetic trees and networks. Nucleic Acids Res.2012;40:W573–9.
300. Bremm S, von Landesberger T, Hess M, Schreck T, Weil P, Hamacherk K.Interactive visual comparison of multiple trees. 2011 IEEE Conference onVisual Analytics Science and Technology (VAST). 2011. doi:10.1109/VAST.2011.6102439.
301. Santamaria R, Theron R, Quintales L. BicOverlapper: a tool for biclustervisualization. Bioinformatics. 2008;24:1212–13.
302. Santamaria R, Theron R, Quintales L. BicOverlapper 2.0: visual analysis forgene expression. Bioinformatics. 2014;30:1785–6.
303. Goncalves JP, Madeira SC, Oliveira AL. BiGGEsTS: integrated environment forbiclustering analysis of time series gene expression data. BMC researchnotes. 2009;2:124.
304. Yuan T, Huang X, Dittmar RL, Du M, Kohli M, Boardman L, et al. eRNA: agraphic user interface-based tool optimized for large data analysis fromhigh-throughput RNA sequencing. BMC Genomics. 2014;15:176.
305. Kapushesky M, Kemmeren P, Culhane AC, Durinck S, Ihmels J, Korner C,et al. Expression Profiler: next generation–an online platform for analysis ofmicroarray data. Nucleic Acids Res. 2004;32:W465–70.
306. Hibbs MA, Dirksen NC, Li K, Troyanskaya OG. Visualization methods forstatistical analysis of microarray clusters. BMC Bioinformatics. 2005;6:115.
307. Floratos A, Smith K, Ji Z, Watkinson J, Califano A. geWorkbench: an opensource platform for integrative genomics. Bioinformatics. 2010;26:1779–80.
308. Perez-Llamas C, Lopez-Bigas N. Gitools: analysis and visualisation ofgenomic data using interactive heat-maps. PloS One. 2011;6:e19541.
309. Jinwook S, Shneiderman B. Interactively exploring hierarchical clusteringresults [gene identification]. Computer. 2002;35:80–6.
310. Khomtchouk BB, Van Booven DJ, Wahlestedt C. HeatmapGenerator: highperformance RNAseq and microarray visualization software suite to examinedifferential gene expression levels using an R and C++ hybridcomputational pipeline. Source Code Biol Med. 2014;9:30.
311. Yachdav G, Hecht M, Pasmanik-Chor M, Yeheskel A, Rost B. HeatMapViewer:interactive display of 2D data in biology. F1000Research. 2014;3:48.
312. Dietzsch J, Gehlenborg N, Nieselt K. Mayday–a microarray data analysisworkbench. Bioinformatics. 2006;22:1010–12.
313. Weber GH, Rubel O, Huang MY, DePace AH, Fowlkes CC, Keranen SV, et al.Visual exploration of three-dimensional gene expression using physicalviews and linked abstract views. IEEE/ACM Trans Comput Biol Bioinform.2009;6:296–309.
314. An J, Lai J, Wood DL, Sajjanhar A, Wang C, Tevz G, et al. RNASeqBrowser: agenome browser for simultaneous visualization of raw strand specificRNAseq reads and UCSC genome browser custom tracks. BMC Genomics.2015;16:145.
315. Roge X, Zhang X. RNAseqViewer: visualization tool for RNA-Seq data.Bioinformatics. 2014;30:891–2.
316. Hochheiser H, Baehrecke EH, Mount SM, Shneiderman B. Dynamic queryingfor pattern identification in microarray and genomic data. InternationalConference on Multimedia and Expo 2003, ICME '03. 2003. doi:10.1109/ICME.2003.1221346.
317. Dietrich S, Wiegand S, Liesegang H. TraV: a genome context sensitivetranscriptome browser. PloS One. 2014;9:e93677.
Submit your next manuscript to BioMed Centraland take full advantage of:
• Convenient online submission
• Thorough peer review
• No space constraints or color figure charges
• Immediate publication on acceptance
• Inclusion in PubMed, CAS, Scopus and Google Scholar
• Research which is freely available for redistribution
Submit your manuscript at www.biomedcentral.com/submit
Pavlopoulos et al. GigaScience (2015) 4:38
27