Visual acuity Shafee. The definition SPATIAL RESOLVING CAPACITY OF THE VISUAL SYSTEM Angular size of...
62
Visual acuity Shafee
-
Upload
julia-arnold -
Category
Documents
-
view
218 -
download
1
Transcript of Visual acuity Shafee. The definition SPATIAL RESOLVING CAPACITY OF THE VISUAL SYSTEM Angular size of...

Visual acuity
Shafee
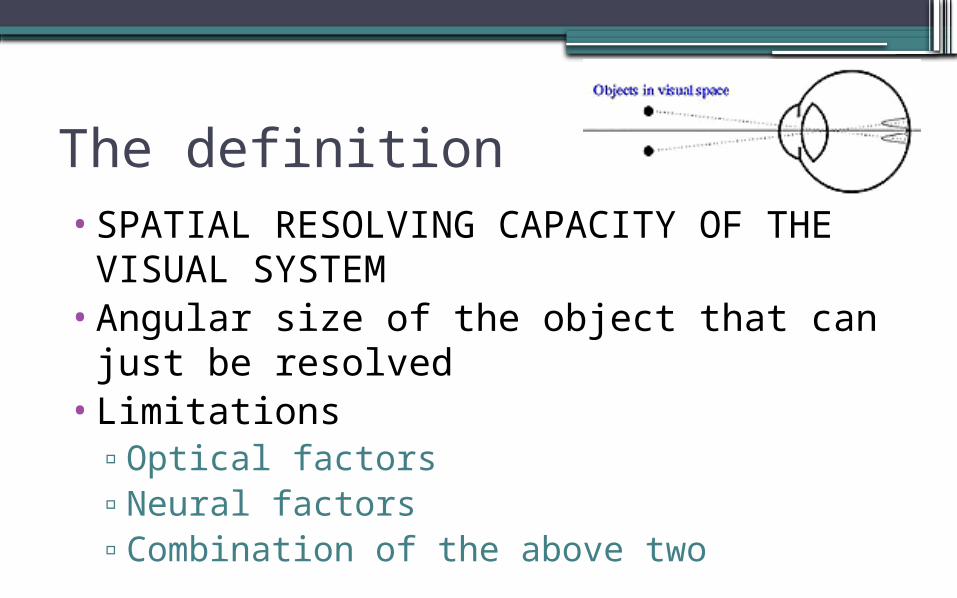
The definition•SPATIAL RESOLVING CAPACITY OF THE
VISUAL SYSTEM•Angular size of the object that can just be
resolved•Limitations
▫Optical factors▫Neural factors▫Combination of the above two

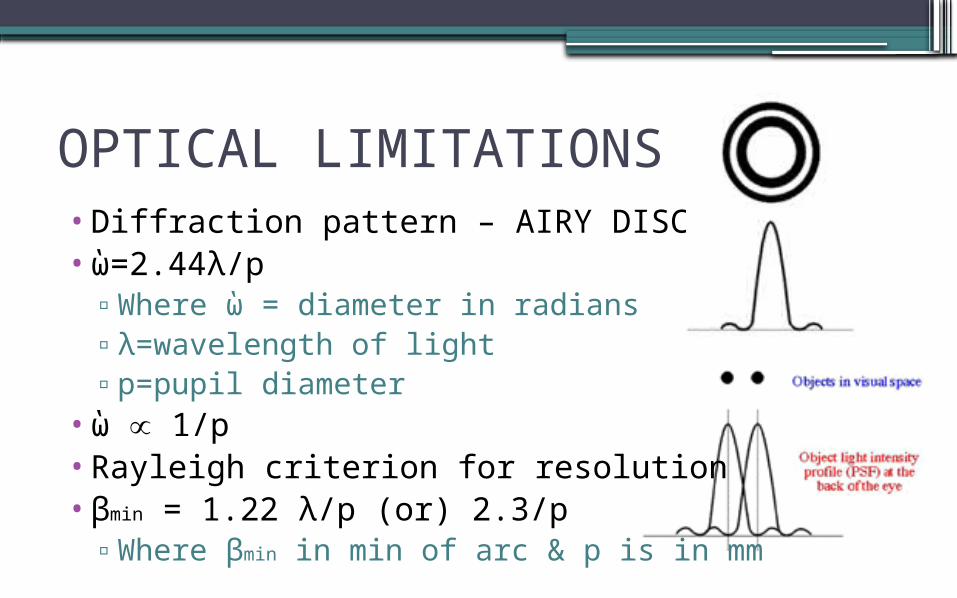
OPTICAL LIMITATIONS• Diffraction pattern – AIRY DISC• ὼ=2.44λ/p
▫Where ὼ = diameter in radians▫λ=wavelength of light▫p=pupil diameter
• ὼ ∝ 1/p• Rayleigh criterion for resolution• βmin = 1.22 λ/p (or) 2.3/p
▫Where βmin in min of arc & p is in mm
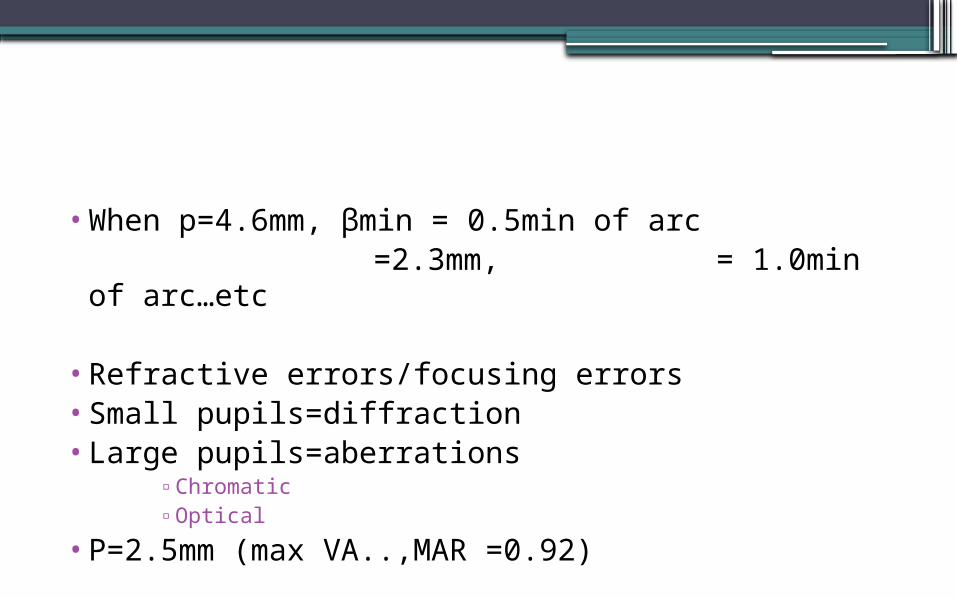
• When p=4.6mm, βmin = 0.5min of arc =2.3mm, = 1.0min of arc…etc
• Refractive errors/focusing errors• Small pupils=diffraction• Large pupils=aberrations
▫Chromatic▫Optical
• P=2.5mm (max VA..,MAR =0.92)
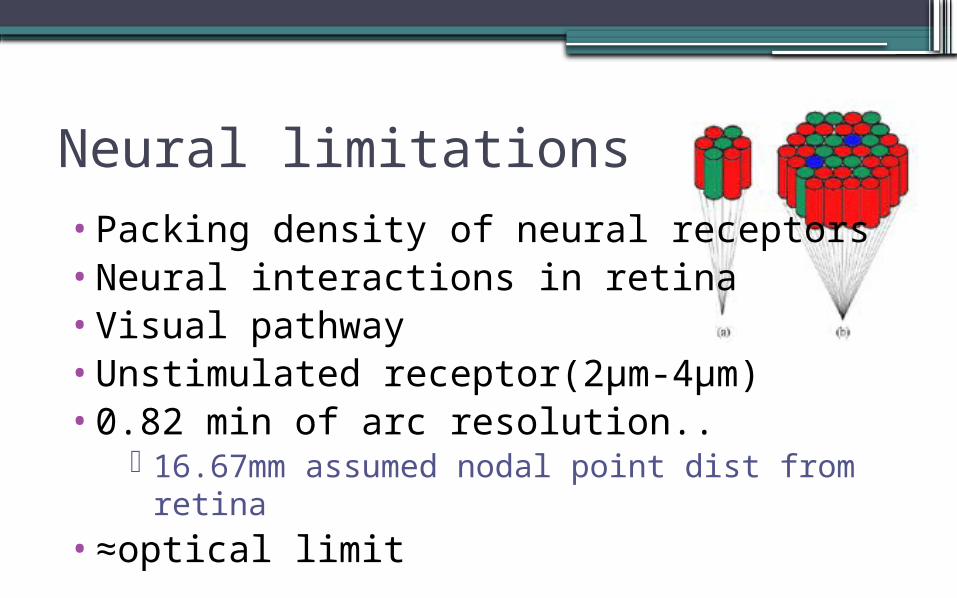
Neural limitations•Packing density of neural receptors•Neural interactions in retina•Visual pathway•Unstimulated receptor(2μm-4μm)•0.82 min of arc resolution..
16.67mm assumed nodal point dist from retina
•≈optical limit
Tests of visual resolutionMeasuring the limits of visual
performance…to discern & to detect & to recognize
•MINIMUM DETECTABLE•MINIMUM SEPERATION•RECOGNITION RESOLUTION
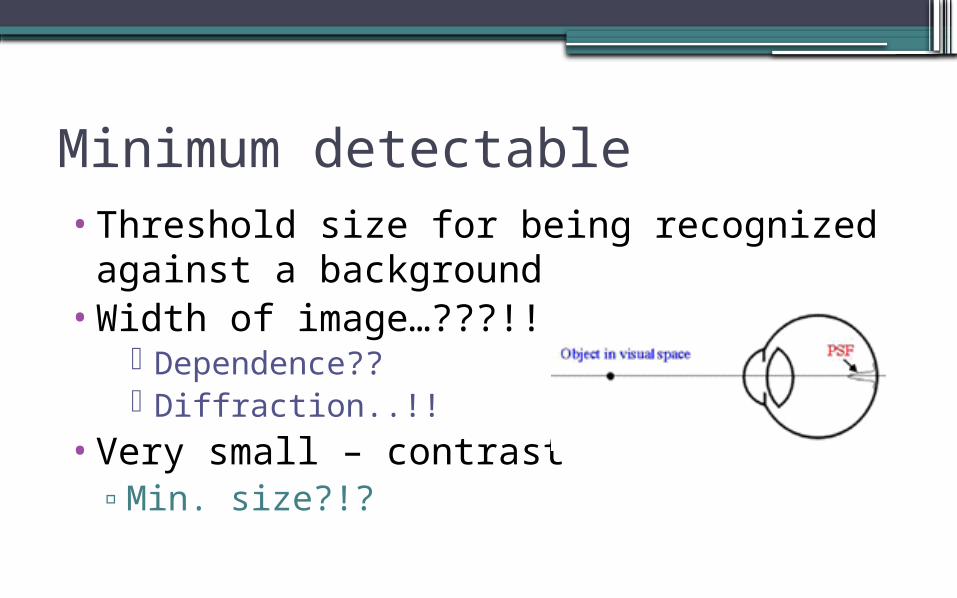
Minimum detectable•Threshold size for being recognized
against a background•Width of image…???!!!???
Dependence?? Diffraction..!!
•Very small – contrast▫Min. size?!?
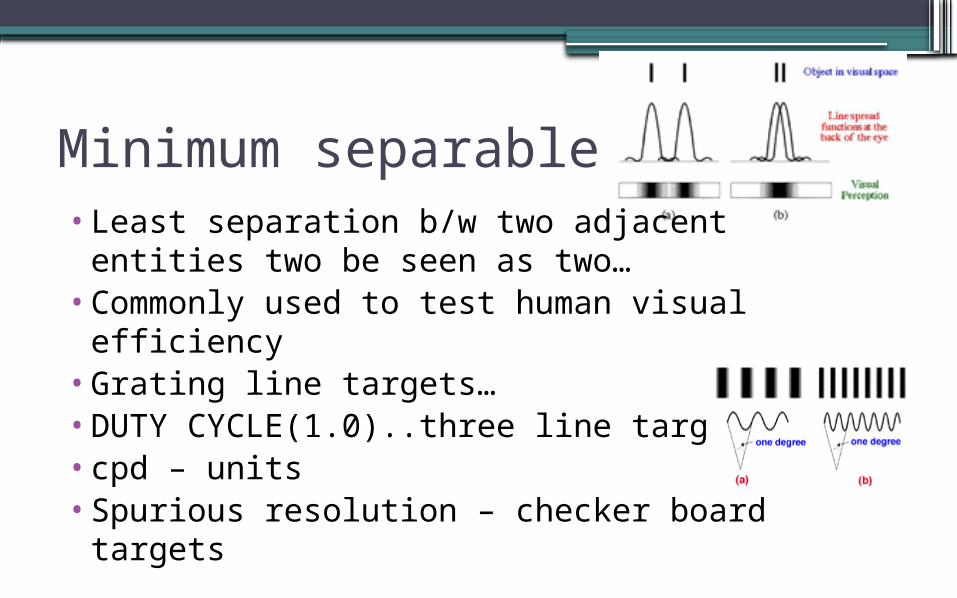
Minimum separable•Least separation b/w two adjacent entities
two be seen as two…•Commonly used to test human visual
efficiency•Grating line targets…•DUTY CYCLE(1.0)..three line target•cpd – units•Spurious resolution – checker board targets

Recognition resolution•Most widely used for clinical testing•Correct identification / recognition•OPTOTYPES
▫Test targets used for these tests▫Eg.,
Landolt C rings Letters Lh symbols..etc
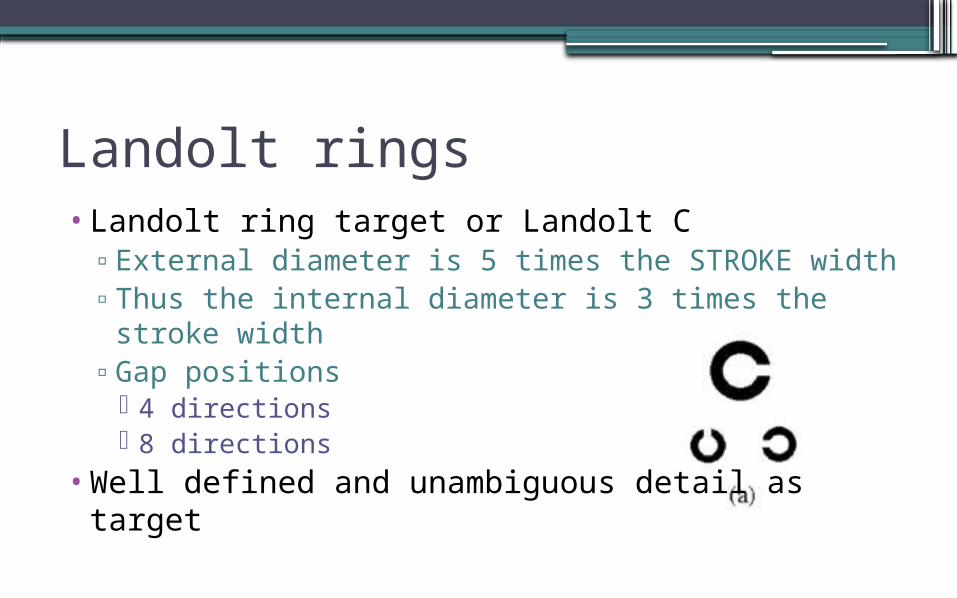
Landolt rings•Landolt ring target or Landolt C
▫External diameter is 5 times the STROKE width▫Thus the internal diameter is 3 times the stroke
width▫Gap positions
4 directions 8 directions
•Well defined and unambiguous detail as target
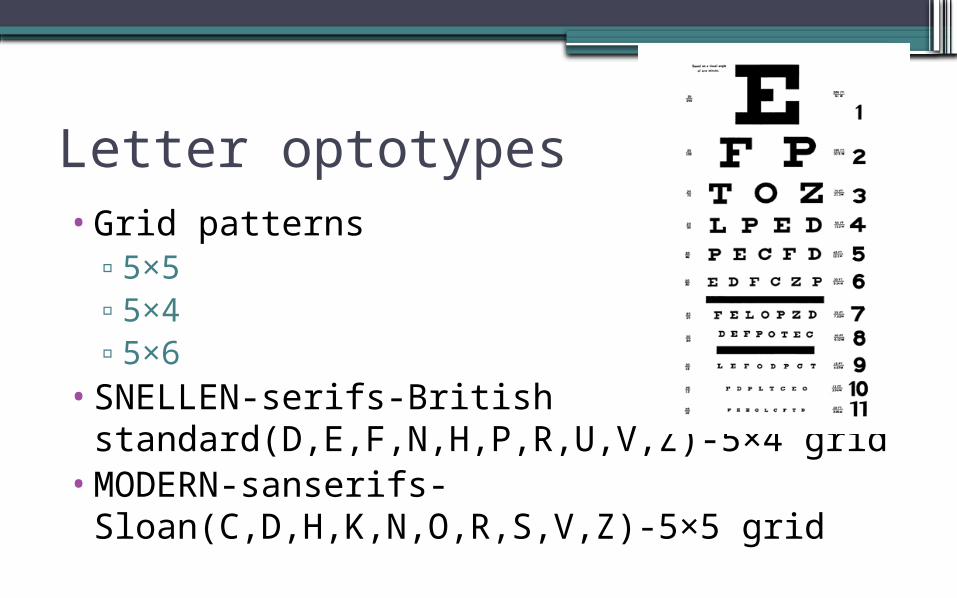
Letter optotypes•Grid patterns
▫5×5▫5×4▫5×6
•SNELLEN-serifs-British standard(D,E,F,N,H,P,R,U,V,Z)-5×4 grid
•MODERN-sanserifs-Sloan(C,D,H,K,N,O,R,S,V,Z)-5×5 grid
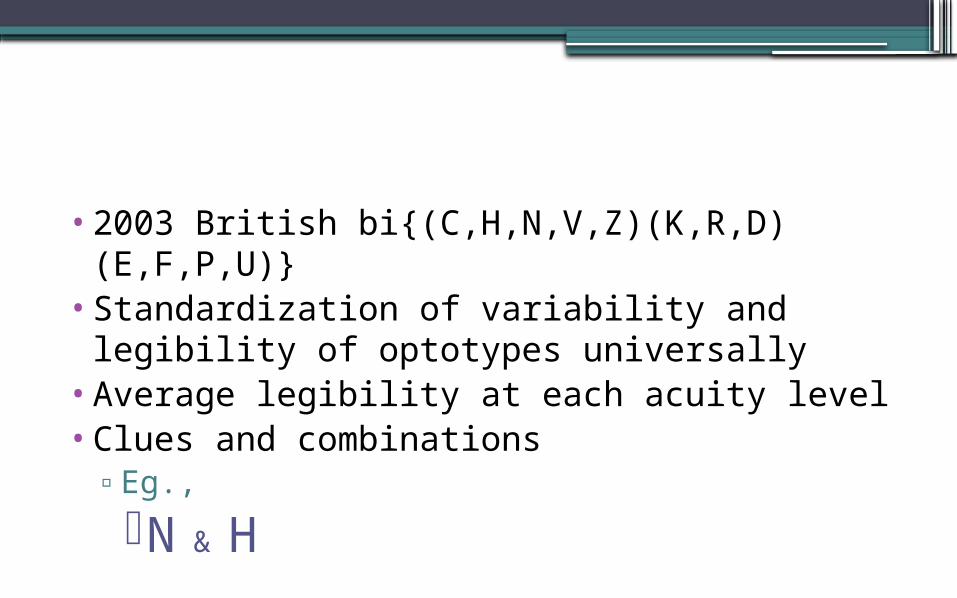
•2003 British bi{(C,H,N,V,Z)(K,R,D)(E,F,P,U)}
•Standardization of variability and legibility of optotypes universally
•Average legibility at each acuity level•Clues and combinations
▫Eg.,
N & H
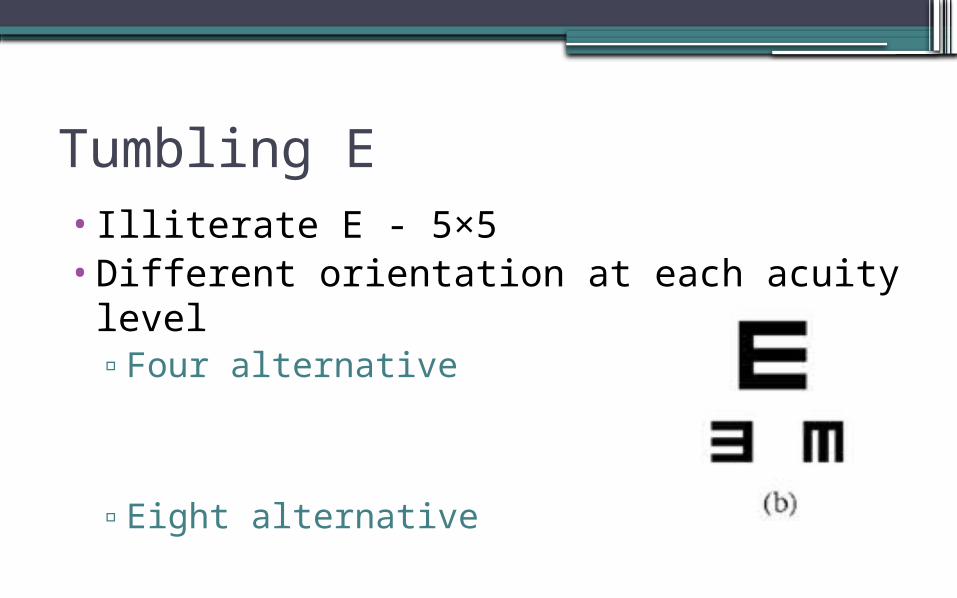
Tumbling E•Illiterate E - 5×5•Different orientation at each acuity level
▫Four alternative
▫Eight alternative
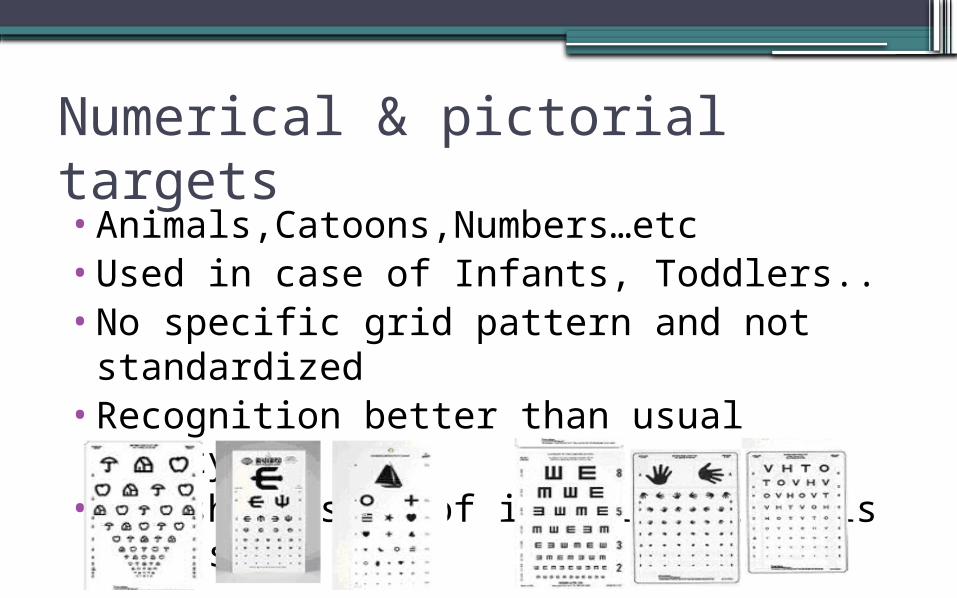
Numerical & pictorial targets•Animals,Catoons,Numbers…etc•Used in case of Infants, Toddlers..•No specific grid pattern and not
standardized•Recognition better than usual optotypes•Threshold size of identification is very
small
Events in the HISTORY• 1843 German ophthalmologist Heinrich Kuechler
wrote a treatise advocating the need for standardized vision tests and developed a set of three charts.
• 1854 Eduard von Jaeger published a set of reading samples to document functional vision. He published samples in German, French, English and other languages.
• He used fonts that were available in the State Printing House in Vienna in 1854 and labeled them with the numbers from that printing house catalogue.
Events in the HISTORY• 1861 Franciscus Donders coined the term visual acuity to
describe the “sharpness of vision” and defined it as the ratio between a subject's VA and a standard VA.
• 1862 Hermann Snellen published his famous letter chart.• His most significant decision was not to use existing typefaces
but to design special targets, which he called optotypes.• This was crucial because it was a physical standard measure to
reproduce the chart. Snellen defined “standard vision” as the ability to recognize one of his optotypes when it subtended 5 minutes of arc, thus the optotype can only be recognized if the person viewing it can discriminate a spatial pattern separated by a visual angle of 1 minute of arc.
Events in the HISTORY• 1875 Snellen changed from using feet to meters
(from 20/20 to 6/6 respectively)• Today, the 20-foot distance prevails in the United
States and 6 meters prevails in Britain.• 1875 Monoye proposed to replace the fractional
Snellen notation with its decimal equivalent (e.g., 20/40 = 0.5, 6/12 = 0.5,5/10 = 0.5)
• Decimal notation makes it simple to compare visual acuity values, regardless of the original measurement distance.
Events in the HISTORY• 1888 Edmund Landolt proposed the Landolt C, a symbol that
has only one element of detail and varies only in its orientation.
• The broken ring symbol is made with a "C" like figure in a 5 x 5 grid that, in the 20/20 optotype, subtends 5 minutes of arc and has an opening (oriented in the top, bottom, right or left) measuring 1 minute of arc.
• This proposal was based in the fact that not all of Snellen's optotypes were equally recognizable.
• This chart is actually the preferred visual acuity measurement symbol for laboratory experiments but gained only limited acceptance in clinical use.
Events in the HISTORY• 1923 Soviet ophthalmologists Sergei Golovin and D. A. Sivtsev
developed the table for testing visual acuity.• Later this table became known as Golovin-Sivtsev Table.• 1959 Louise Sloan designed a new optotype set of 10 letters,
all to be shown in each and every line tested, in order to avoid the problem that not all letters are equally recognizable.
• The larger letter sizes thus required more than one physical line.
• Louise Sloan also proposed a new letter size notation using the SI system stating that standard acuity (1.0, 20/20) represents the ability to recognize a standard letter size (1 M-b unit) at a standard distance (1 meter)
Events in the HISTORY• 1976 Ian Bailey and Jan Lovie published a new chart
featuring a new layout with five letters on each row and spacing between letters and rows equal to the letter size
• This layout was created to standardize the crowding effect and the number of errors that could be made on each line, so letter size became the only variable between the acuity levels measured.
• These charts have the shape of an inverted triangle and are much wider at the top than traditional charts.
• Like Sloan's chart, they followed a geometric progression of letter sizes
Events in the HISTORY•Lea Hyvärinen created a chart, the Lea
chart, using outlines of figures (an apple, a house, a circle and a square) to measure visual acuity in preschool children.
•Hugh Taylor used these design principles for a "Tumbling E Chart" for illiterates, later used to study the visual acuity of Australian Aborigines.
Designation of VA•Snellen fraction•Decimal notation•MAR
•logMAR•VAR & fAS•VE
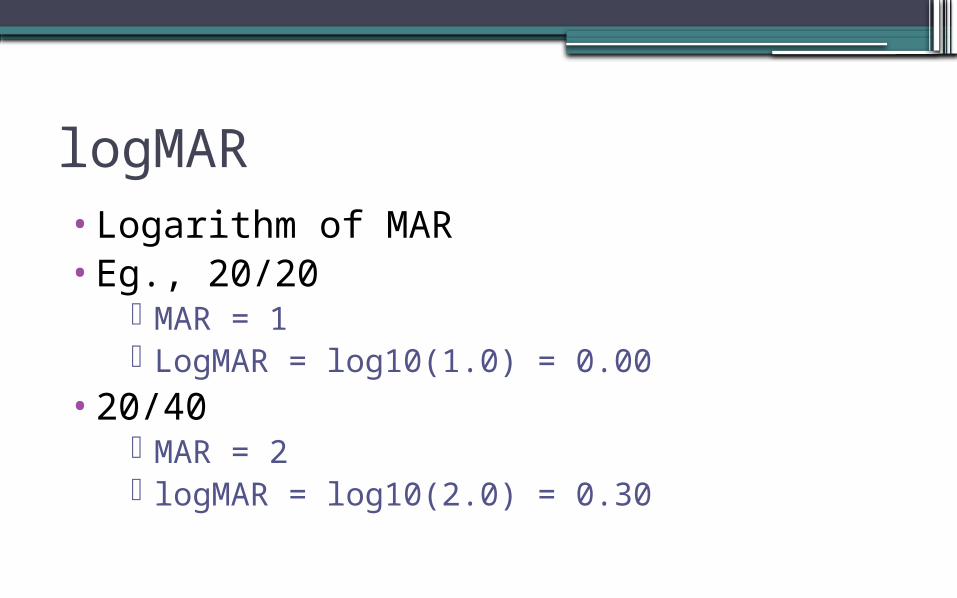
logMAR•Logarithm of MAR•Eg., 20/20
MAR = 1 LogMAR = log10(1.0) = 0.00
•20/40 MAR = 2 logMAR = log10(2.0) = 0.30
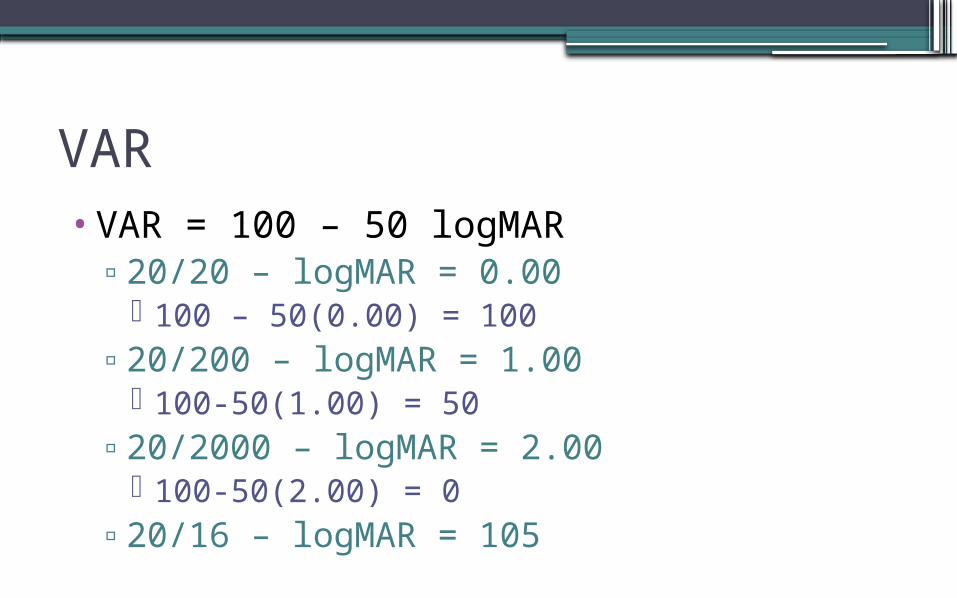
VAR•VAR = 100 – 50 logMAR
▫20/20 – logMAR = 0.00 100 – 50(0.00) = 100
▫20/200 – logMAR = 1.00 100-50(1.00) = 50
▫20/2000 – logMAR = 2.00 100-50(2.00) = 0
▫20/16 – logMAR = 105
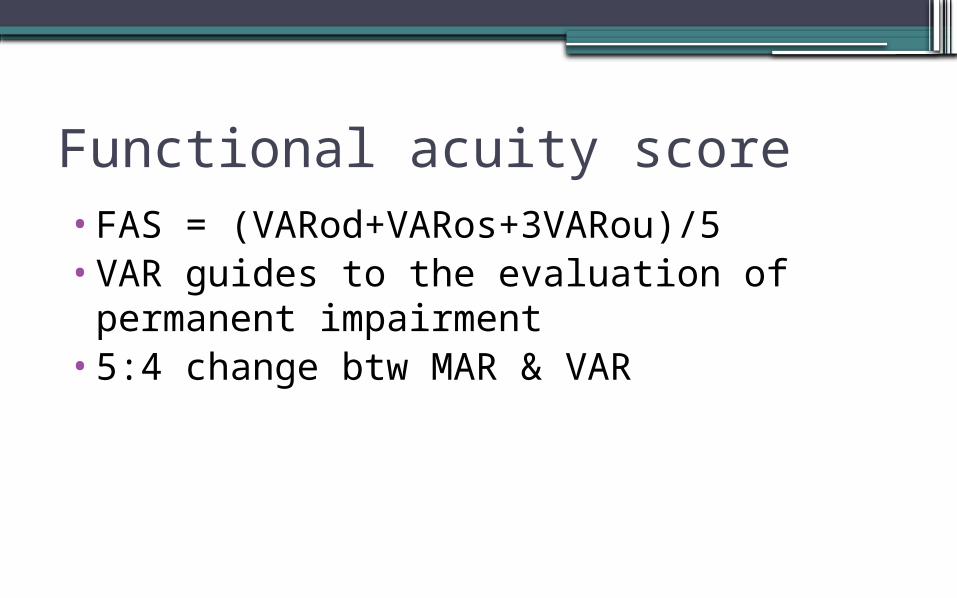
Functional acuity score•FAS = (VARod+VARos+3VARou)/5•VAR guides to the evaluation of
permanent impairment•5:4 change btw MAR & VAR
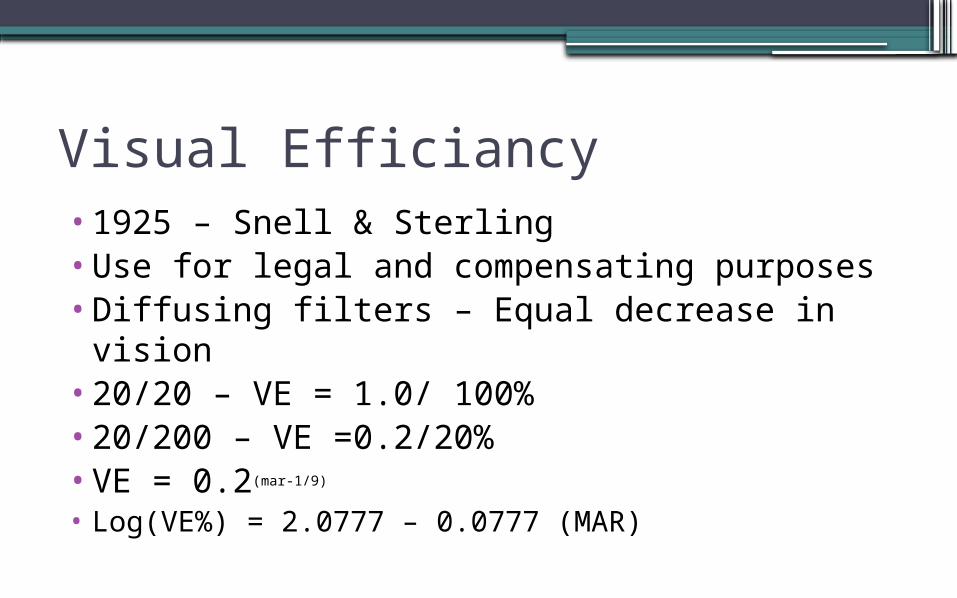
Visual Efficiancy•1925 – Snell & Sterling•Use for legal and compensating purposes•Diffusing filters – Equal decrease in vision•20/20 – VE = 1.0/ 100%•20/200 – VE =0.2/20%•VE = 0.2(mar-1/9)
• Log(VE%) = 2.0777 – 0.0777 (MAR)
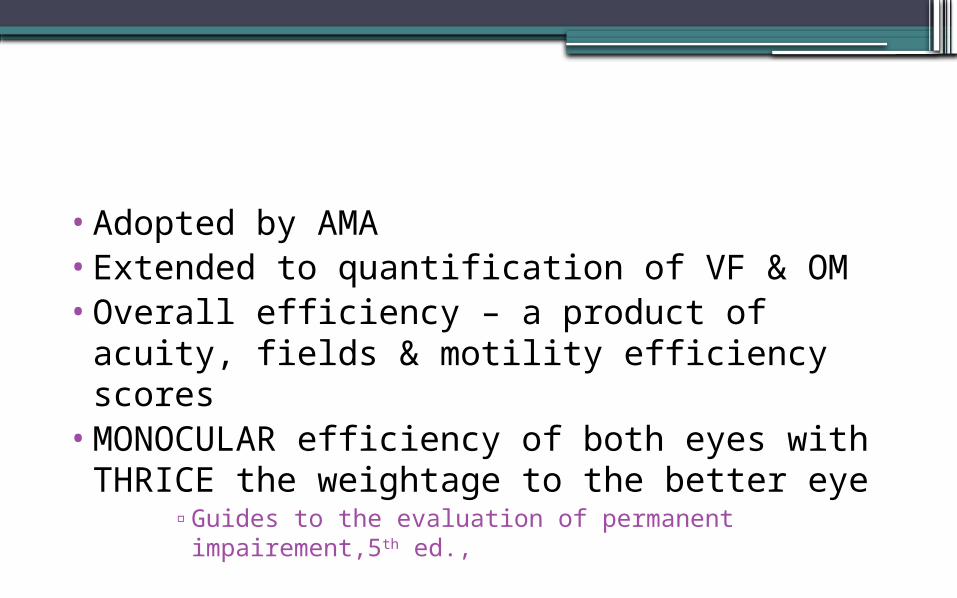
•Adopted by AMA•Extended to quantification of VF & OM•Overall efficiency – a product of acuity,
fields & motility efficiency scores•MONOCULAR efficiency of both eyes with
THRICE the weightage to the better eye▫Guides to the evaluation of permanent
impairement,5th ed.,
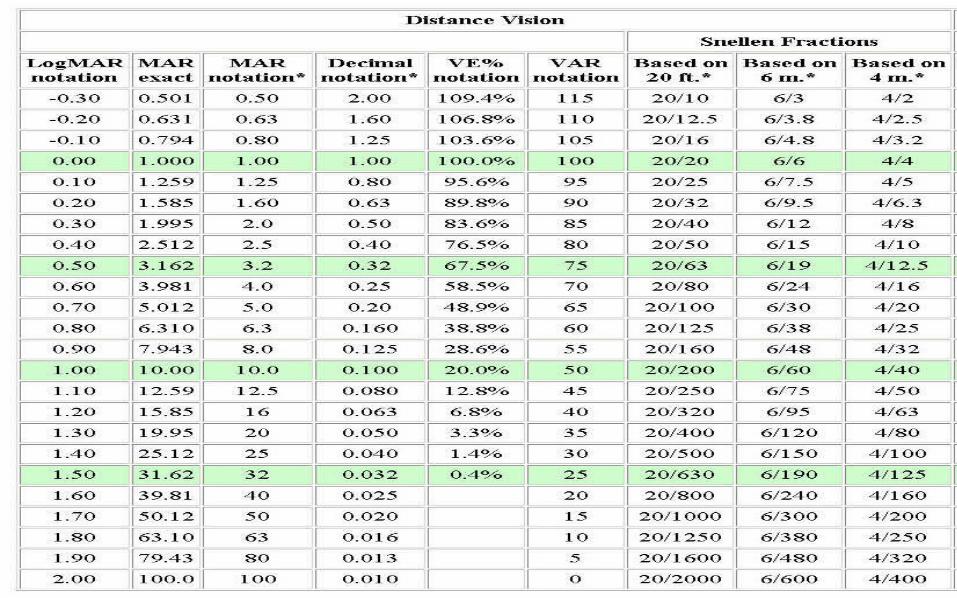
Chart Designs•SNELLEN•Bailey lovie
▫TAYLOR – tumbling E chart▫Ferris & colleagues – ETDRS – Sloan letters▫Strong & Woo – columnar size progression
with masking bars▫Others( Johnston, Hyvarinen, Landolt)
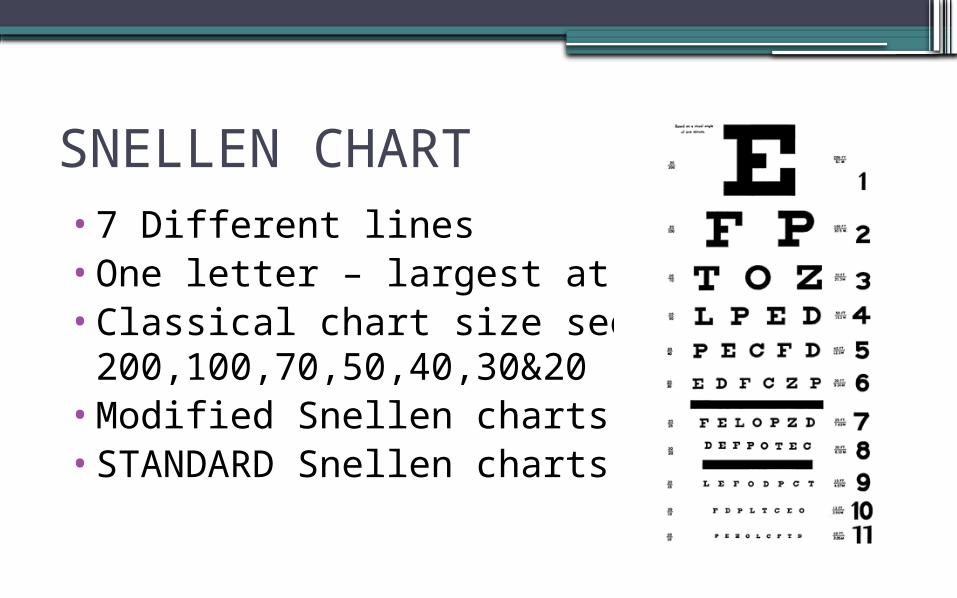
SNELLEN CHART•7 Different lines•One letter – largest at the top•Classical chart size sequence is
200,100,70,50,40,30&20•Modified Snellen charts•STANDARD Snellen charts
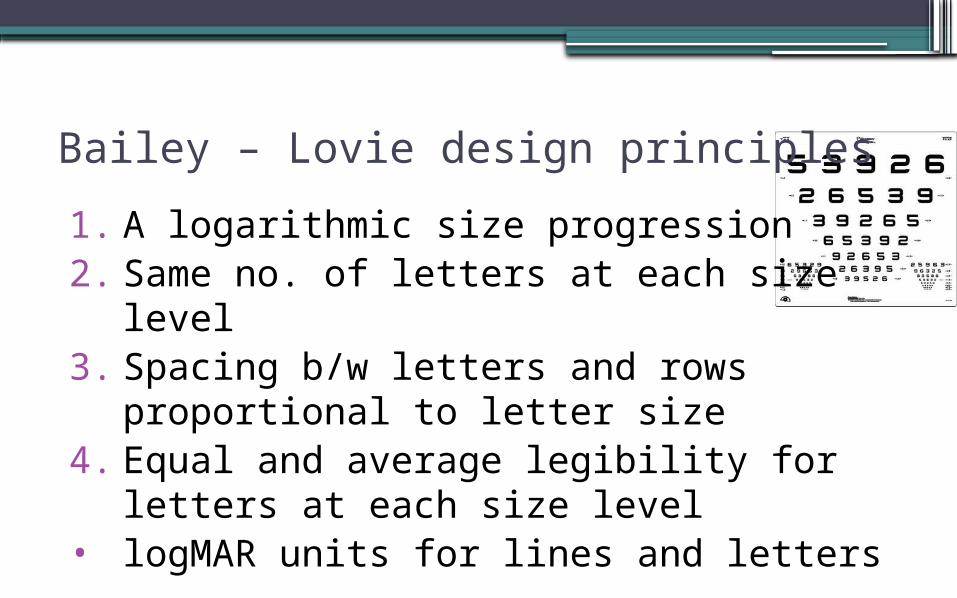
Bailey – Lovie design principles 1. A logarithmic size progression2. Same no. of letters at each size level3. Spacing b/w letters and rows
proportional to letter size4. Equal and average legibility for letters
at each size level• logMAR units for lines and letters

Design features•Logarithmic size progression
▫Green , Sloan , Westheimer▫Peripheral visual acuities @ dif retinal
eccentricities on a logarithmic scale is constant▫0.1 log units progression commonly used▫1.2589:1 ratio(5:4 approx.)▫1.0,1.25,1.6,2.0,2.5,3.2,4.0,5.0,6.3,8.0,10,12.5,1
6…▫(6.0,7.5,9.5,12,15,19,24,30,38,48,60,75,95….)
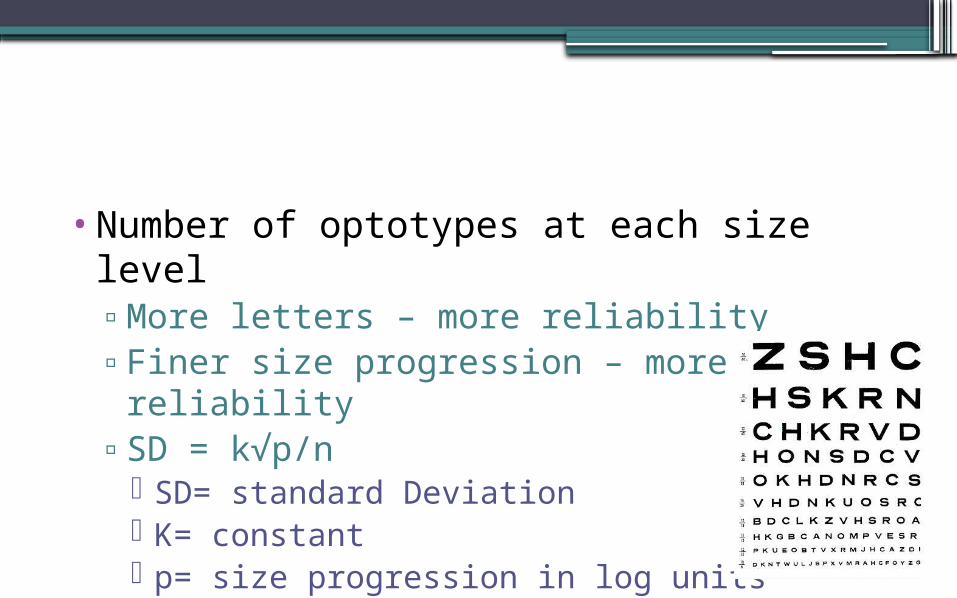
•Number of optotypes at each size level▫More letters – more reliability▫Finer size progression – more reliability▫SD = k√p/n
SD= standard Deviation K= constant p= size progression in log units N= no. of letters at each line
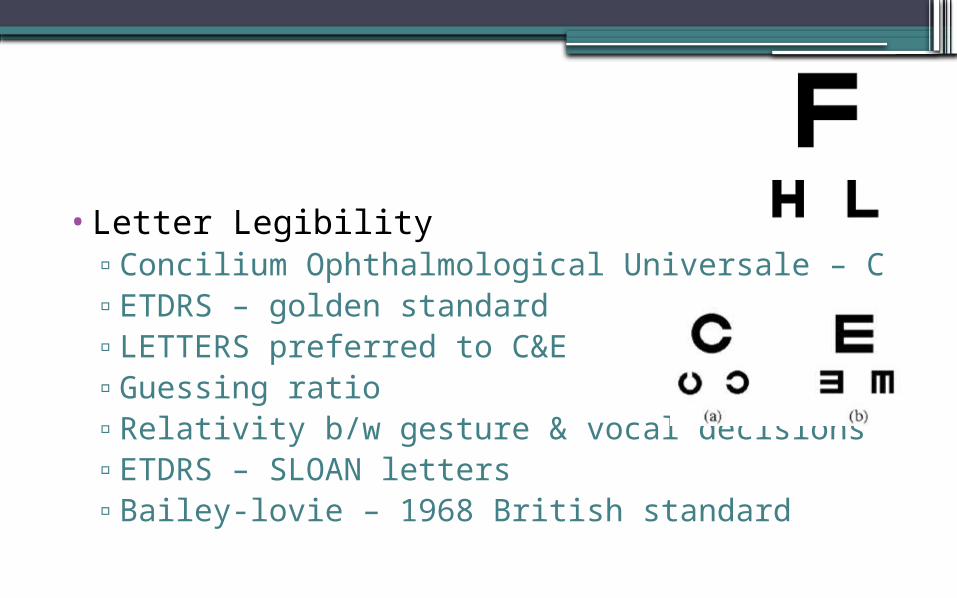
•Letter Legibility▫Concilium Ophthalmological Universale – C▫ETDRS – golden standard▫LETTERS preferred to C&E▫Guessing ratio▫Relativity b/w gesture & vocal decisions▫ETDRS – SLOAN letters▫Bailey-lovie – 1968 British standard
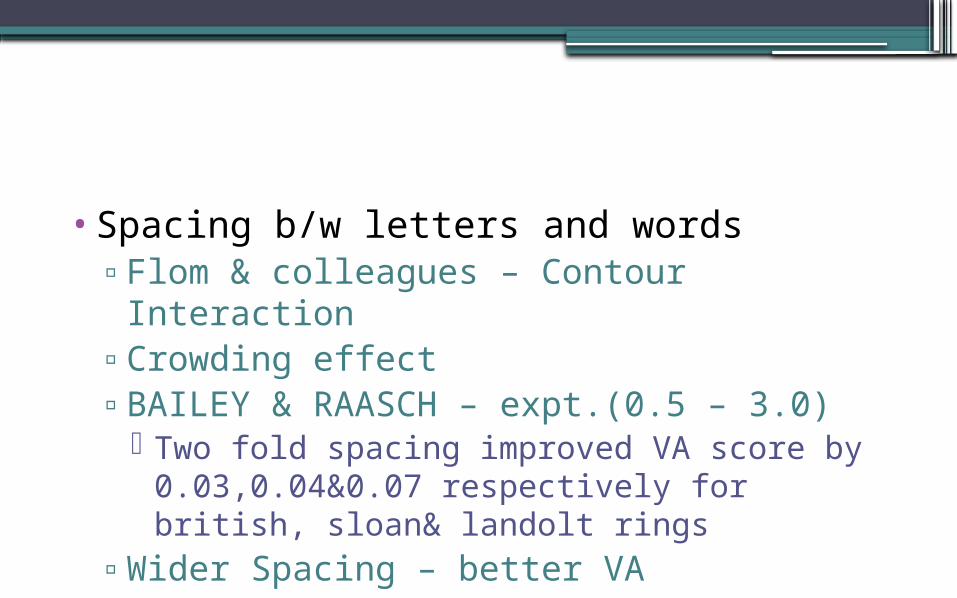
•Spacing b/w letters and words▫Flom & colleagues – Contour Interaction▫Crowding effect▫BAILEY & RAASCH – expt.(0.5 – 3.0)
Two fold spacing improved VA score by 0.03,0.04&0.07 respectively for british, sloan& landolt rings
▫Wider Spacing – better VA
Chart formats•Printed Panel Charts•Projector Charts
▫Self illuminated▫Back illuminated
•Charts On Display Screens▫150cd/m2
▫300cd/m2
Chart luminance• Moderate photopic luminance+subdued room
lightning• Recommendations –
▫85-300cd/m2(general)▫Sheedy & colleagues – twice luminance(5%MAR)▫160m2(stnd)▫120m2 min(British stnd)▫80-320cd/m2(clinical tolerance)&low contrast
targets
Refractive correction•Unaided VA•Uncorrected VA•Habitual VA•Corrected VA/BCVA•Optimal VA•Pinhole VA& PAM•VA under Special Illumination
Testing distance•Visual infinity…??!!??•Spatial constraints of examination room•10-30 foot range•Distance appropriate testing charts•Low vision•Pre-presbyopes – proximal accomodation
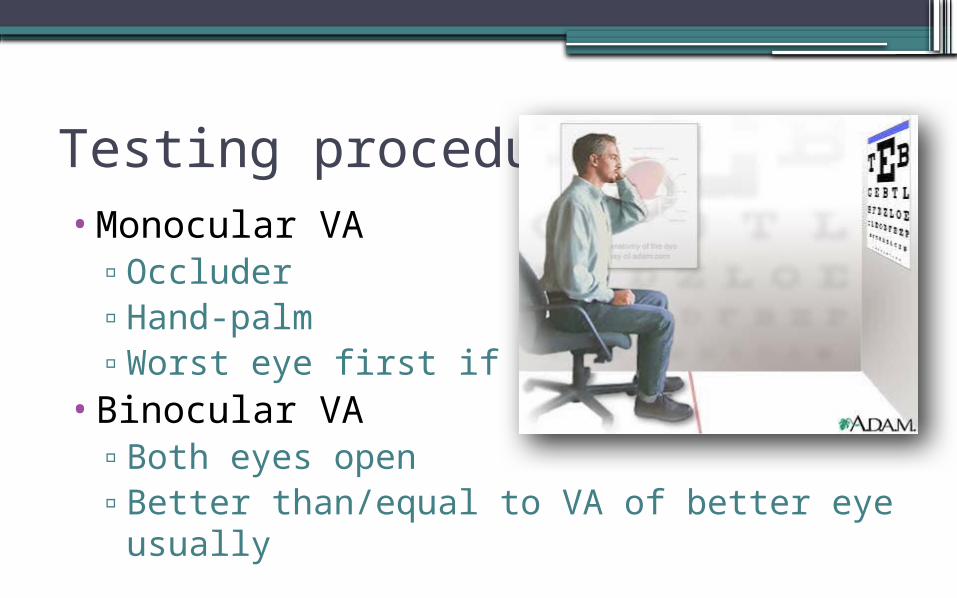
Testing procedures•Monocular VA
▫Occluder▫Hand-palm▫Worst eye first if known
•Binocular VA▫Both eyes open▫Better than/equal to VA of better eye
usually
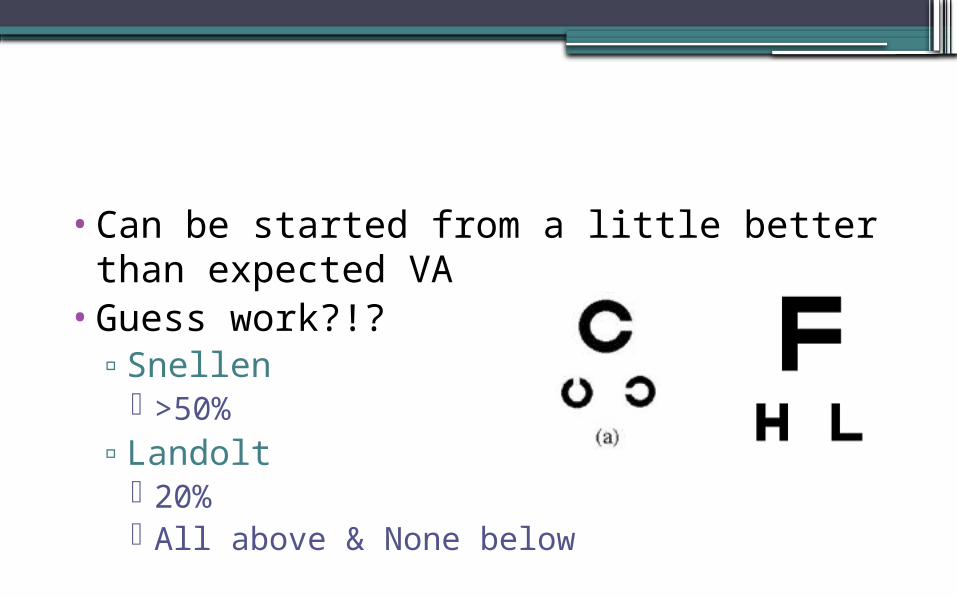
•Can be started from a little better than expected VA
•Guess work?!?▫Snellen
>50%▫Landolt
20% All above & None below
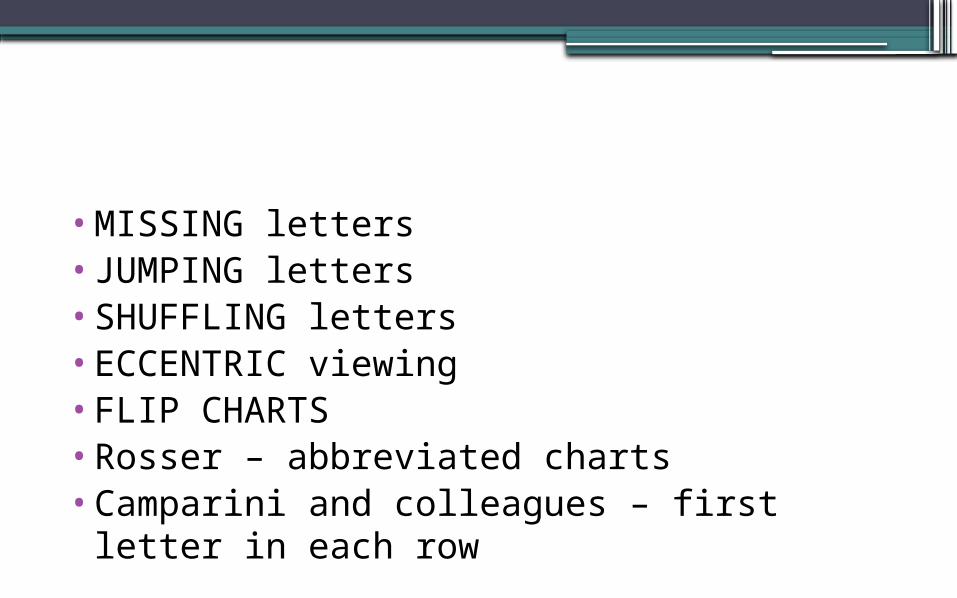
•MISSING letters•JUMPING letters•SHUFFLING letters•ECCENTRIC viewing•FLIP CHARTS•Rosser – abbreviated charts•Camparini and colleagues – first letter in
each row
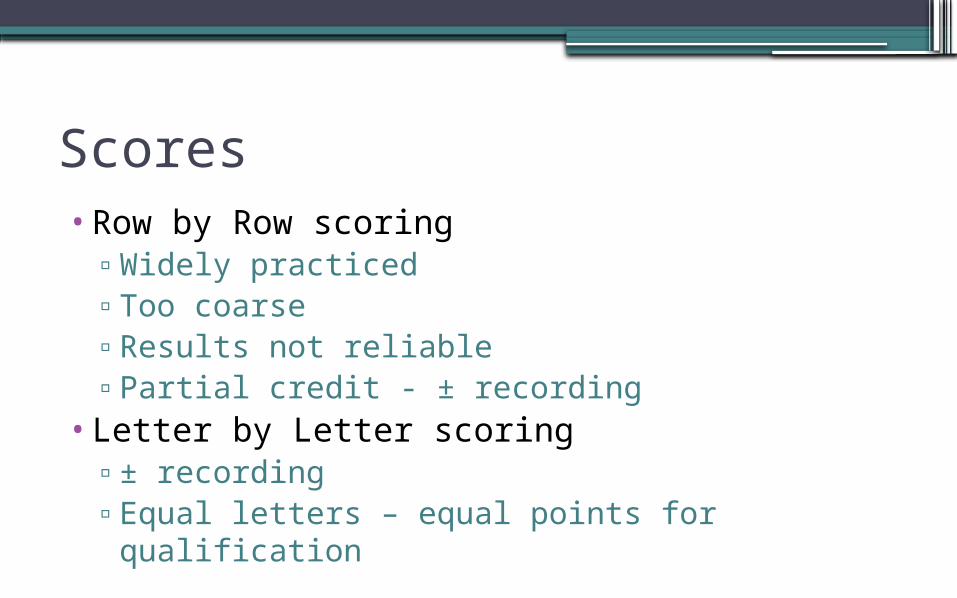
Scores•Row by Row scoring
▫Widely practiced▫Too coarse▫Results not reliable▫Partial credit - ± recording
•Letter by Letter scoring▫± recording▫Equal letters – equal points for qualification
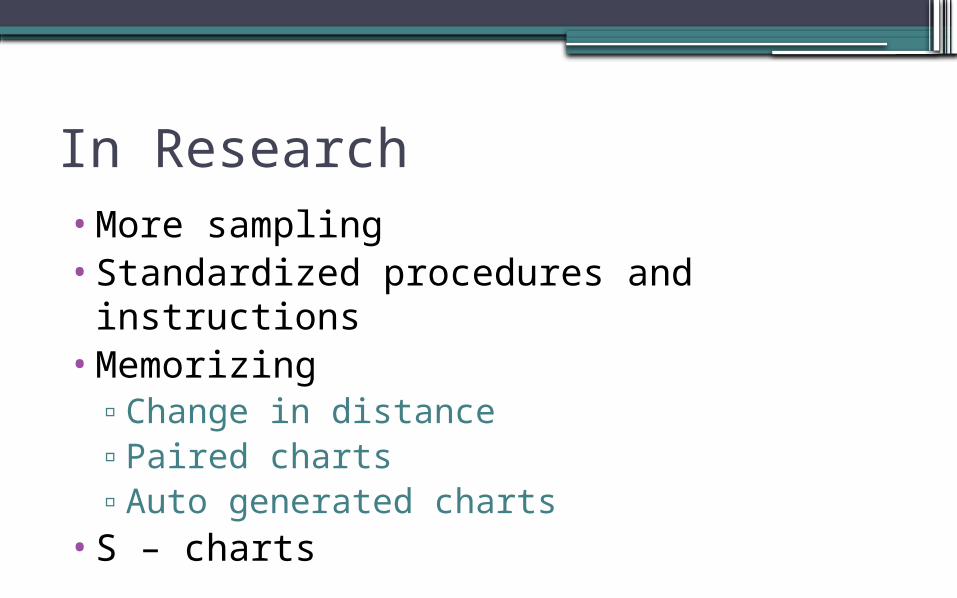
In Research•More sampling•Standardized procedures and instructions•Memorizing
▫Change in distance▫Paired charts▫Auto generated charts
•S – charts
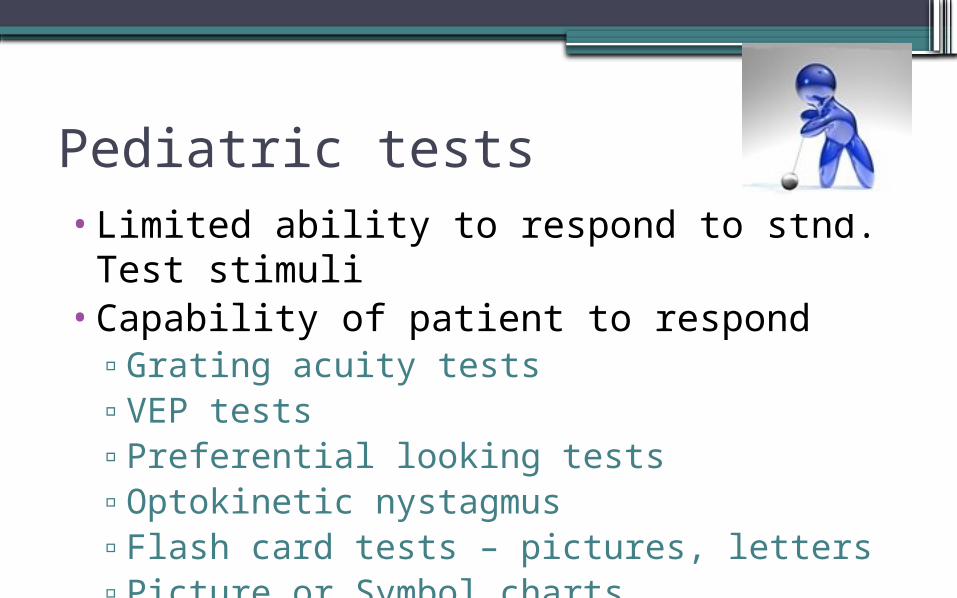
Pediatric tests•Limited ability to respond to stnd. Test
stimuli•Capability of patient to respond
▫Grating acuity tests▫VEP tests▫Preferential looking tests▫Optokinetic nystagmus▫Flash card tests – pictures, letters▫Picture or Symbol charts
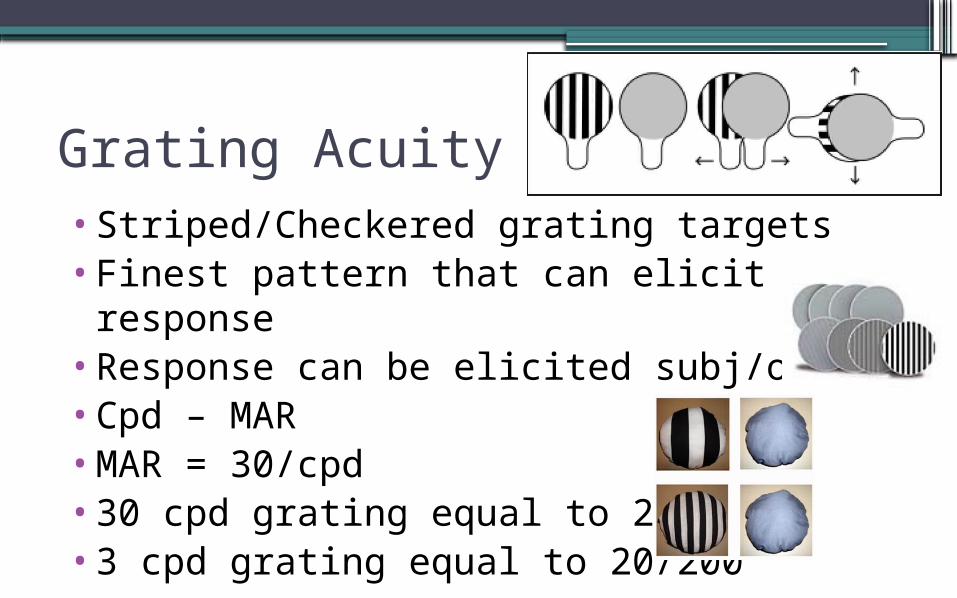
Grating Acuity Tests•Striped/Checkered grating targets•Finest pattern that can elicit the response•Response can be elicited subj/obj•Cpd – MAR•MAR = 30/cpd•30 cpd grating equal to 20/20•3 cpd grating equal to 20/200
Visual Evoked Potential•For least responsive patients•Measuring electrical potentials due to
vision•Flickering striped / checkered pattern•EP magnitude declines with finer detail•Smallest spatial frequency(in CPD) with a
measurable response is taken as VA
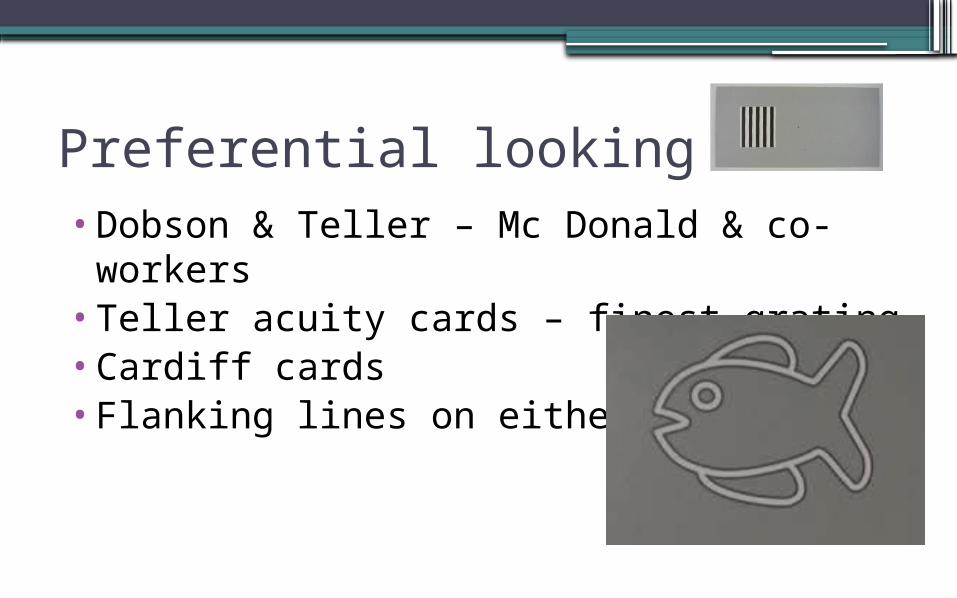
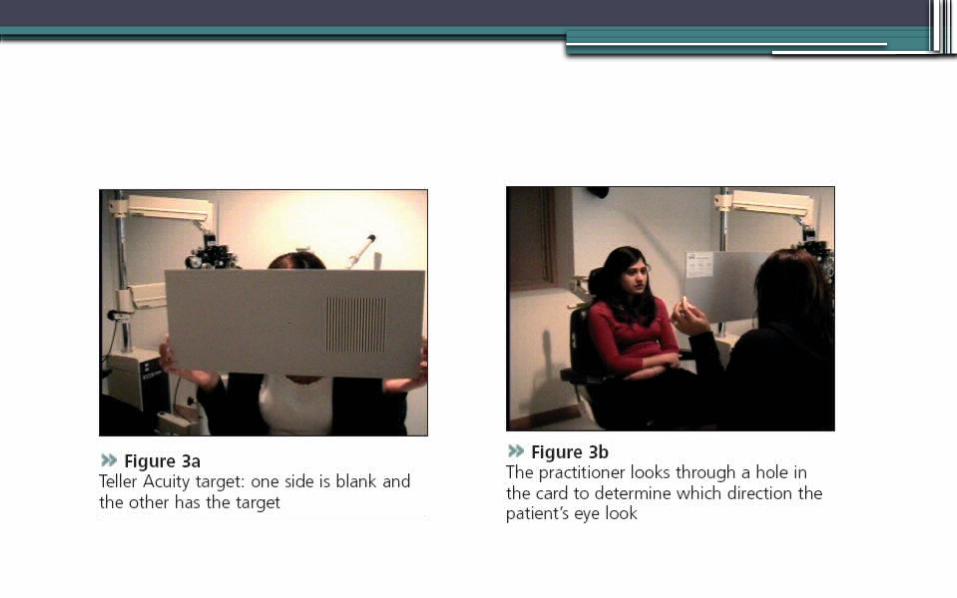
Preferential looking tests•Dobson & Teller – Mc Donald & co-
workers•Teller acuity cards – finest grating•Cardiff cards•Flanking lines on either side
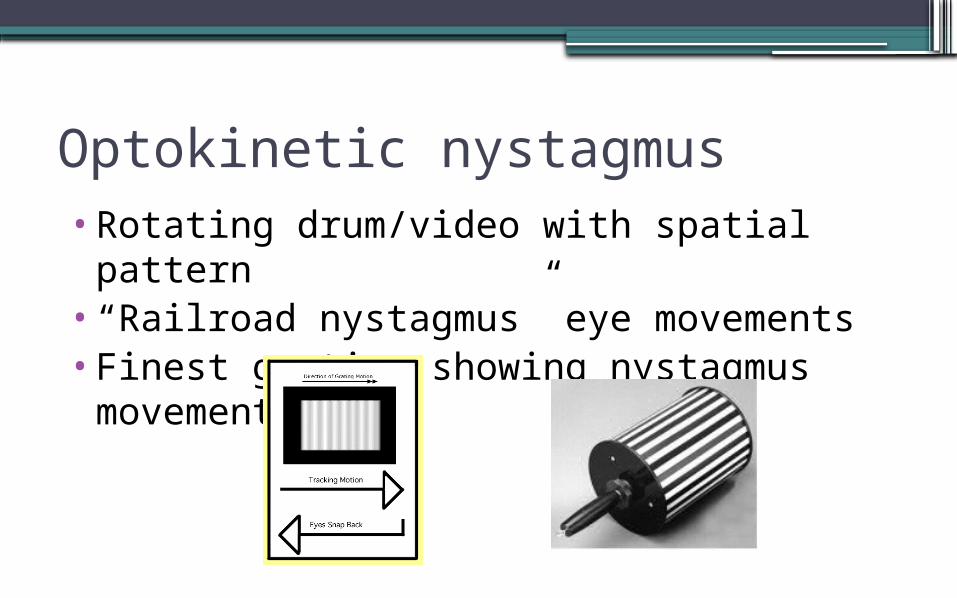
Optokinetic nystagmus•Rotating drum/video with spatial pattern•“Railroad nystagmus” eye movements•Finest grating showing nystagmus
movements
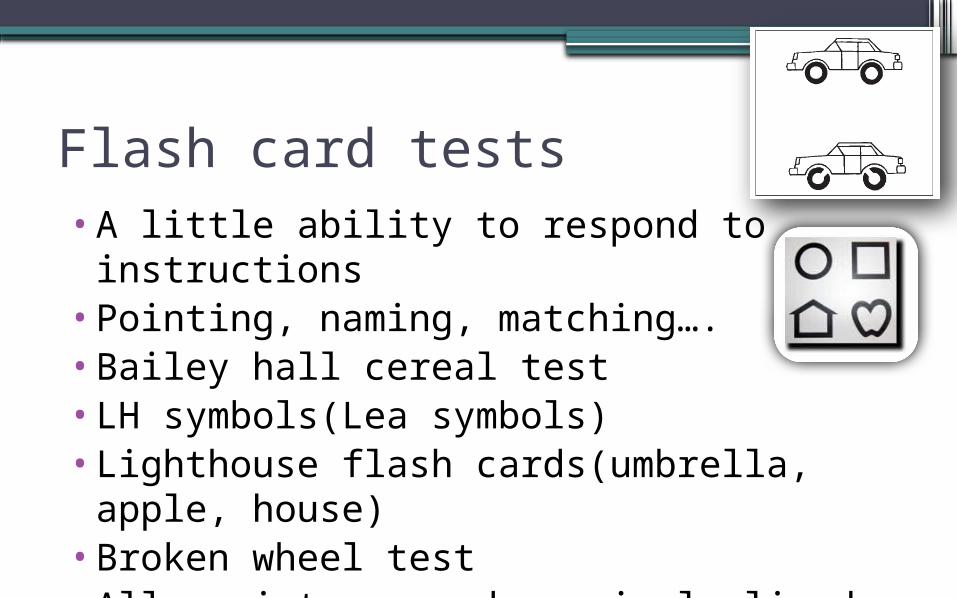
Flash card tests•A little ability to respond to instructions•Pointing, naming, matching….•Bailey hall cereal test•LH symbols(Lea symbols)•Lighthouse flash cards(umbrella, apple,
house)•Broken wheel test•Allen picture cards – simple lined
drawings
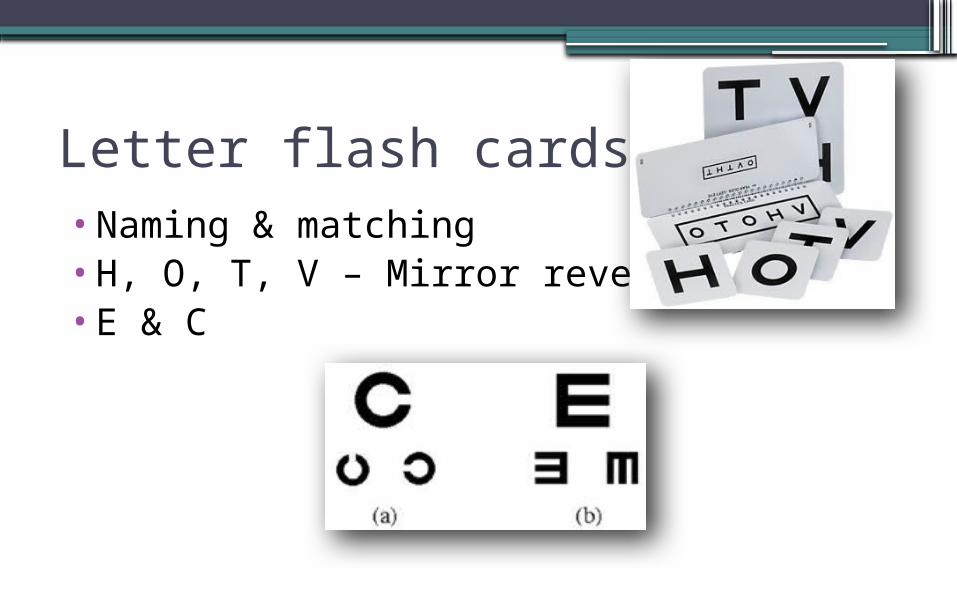
Letter flash cards•Naming & matching•H, O, T, V – Mirror reversible•E & C
NEAR VISUAL ACUITY•Arm’s length•40 cm stnd. Distance•Should be comparable with DVA if the
illumination is same•But accommodation should be at rest•Pupillary constriction (in PSCC)•Typeset materials – sentences,
paragraphs, unrelated words
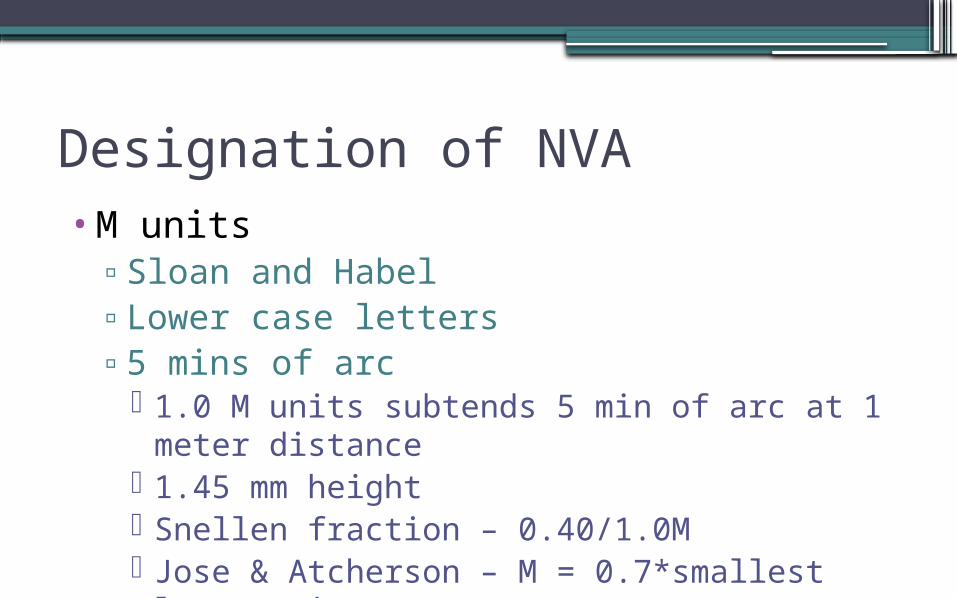
Designation of NVA•M units
▫Sloan and Habel▫Lower case letters▫5 mins of arc
1.0 M units subtends 5 min of arc at 1 meter distance
1.45 mm height Snellen fraction – 0.40/1.0M Jose & Atcherson – M = 0.7*smallest letter
size(mm)
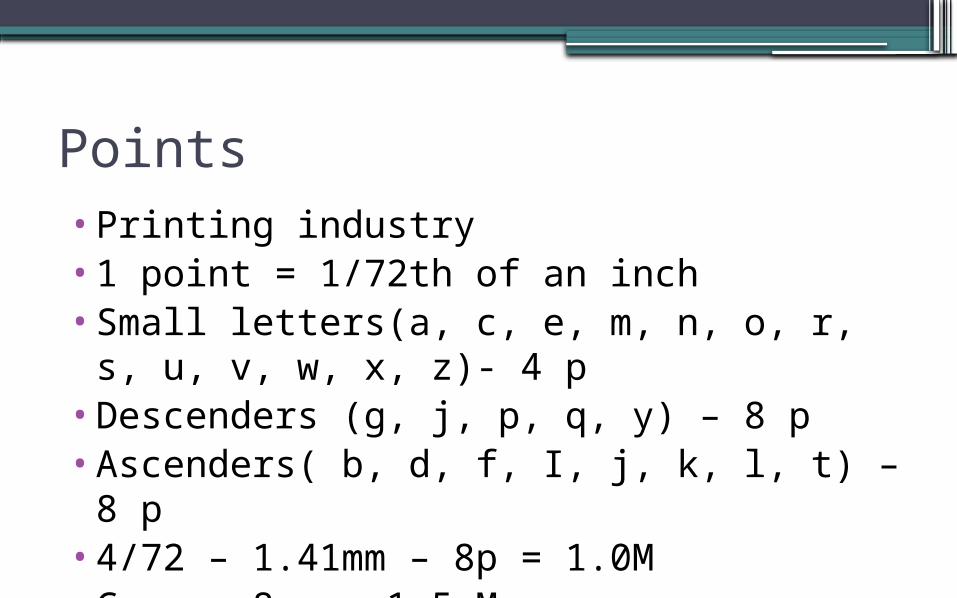
Points•Printing industry•1 point = 1/72th of an inch•Small letters(a, c, e, m, n, o, r, s, u, v, w, x,
z)- 4 p•Descenders (g, j, p, q, y) – 8 p•Ascenders( b, d, f, I, j, k, l, t) – 8 p •4/72 – 1.41mm – 8p = 1.0M•Caps – 8 p = 1.5 M
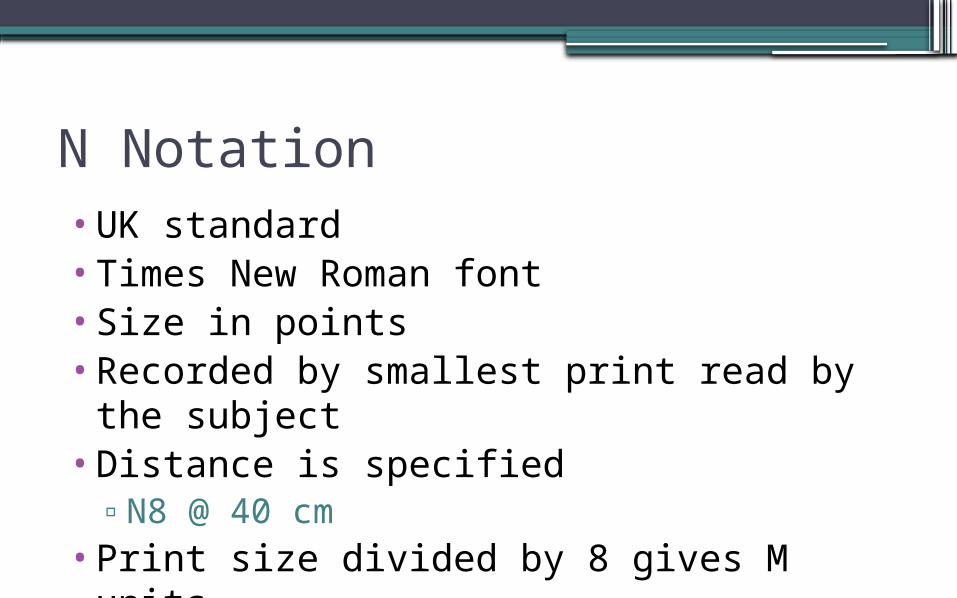
N Notation•UK standard•Times New Roman font•Size in points•Recorded by smallest print read by the
subject•Distance is specified
▫N8 @ 40 cm•Print size divided by 8 gives M units
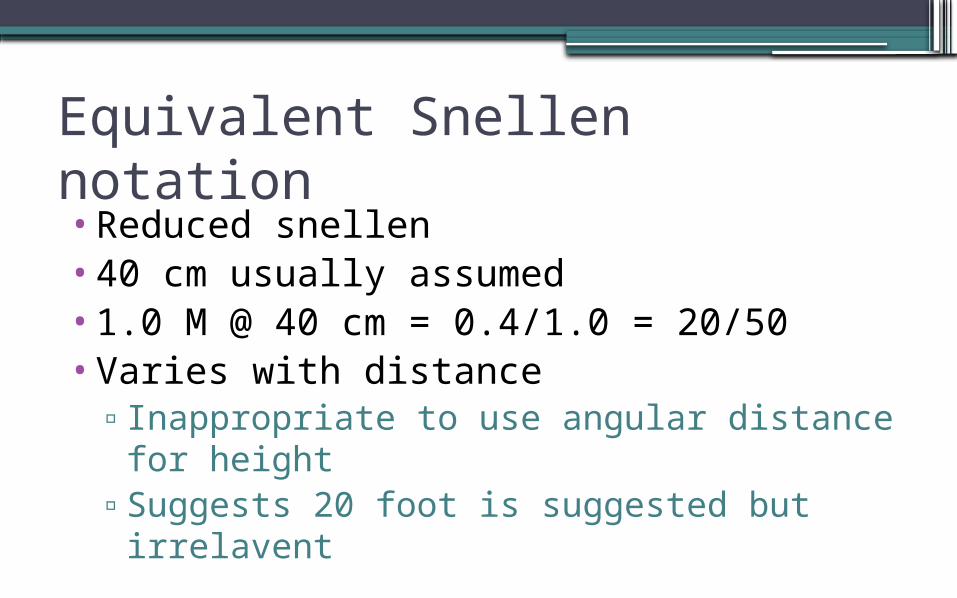
Equivalent Snellen notation•Reduced snellen•40 cm usually assumed•1.0 M @ 40 cm = 0.4/1.0 = 20/50•Varies with distance
▫Inappropriate to use angular distance for height
▫Suggests 20 foot is suggested but irrelavent
Jaeger Notation•J followed by number•Used widely by ophthalmologists•No standardization•Smaller no., larger size•Should not be used
IMP things to remember•Reading & letter chart acuity•Near visual acuity verses near vision
adequacy•Resolution limit•Reading efficiency•Logarithmic scaling
Purposes•Refraction and prescribing decisions•Monitoring ocular health•Insurances•Treatment•Contrast•Disability glare•PAM

Thank
you...!!!