
Venture Capital Funds Πέτρος Φατούρος
10
ΦΑΤΟΥΡΟΣ ΛΑΜΠΡΟΠΟΥΛΟΣ ΔΙΚΗΓΟΡΙΚΗ ΕΤΑΙΡΕΙΑ VENTURE CAPITAL FUNDS Πώς λειτουργούν και σε ποιούς απευθύνονται Πέτρος Χρ. Φατούρος Δικηγόρος «ΕΝΑΛΛΑΚΤΙΚΟΣΤΡΟΠΟΣ ΧΡΗΜΑΤΟΔΟΤΗΣΗΣ ΕΠΙΧΕΙΡΗΣΕΩΝ» ΕΛΛΗΝΙΚΗ ΕΝΩΣΗΤΡΑΠΕΖΙΚΗΣ ΚΑΙ ΕΝΑΛΛΑΚΤΙΚΗΣ ΧΡΗΜΑΤΟΔΟΤΗΣΗΣ ΕΠΙΧΕΙΡΗΣΕΩΝ
-
Upload
phoebekouvelas -
Category
Law
-
view
233 -
download
6
Transcript of Venture Capital Funds Πέτρος Φατούρος
ΦΑΤΟΥΡΟΣ ΛΑΜΠΡΟΠΟΥΛΟΣ ΔΙΚΗΓΟΡΙΚΗ ΕΤΑΙΡΕΙΑ
VENTURE CAPITAL FUNDS Πώς λειτουργούν και σε ποιούς
απευθύνονται Πέτρος Χρ. Φατούρος Δικηγόρος
«ΕΝΑΛΛΑΚΤΙΚΟΣ ΤΡΟΠΟΣ ΧΡΗΜΑΤΟΔΟΤΗΣΗΣ ΕΠΙΧΕΙΡΗΣΕΩΝ» ΕΛΛΗΝΙΚΗ ΕΝΩΣΗ ΤΡΑΠΕΖΙΚΗΣ ΚΑΙ ΕΝΑΛΛΑΚΤΙΚΗΣ ΧΡΗΜΑΤΟΔΟΤΗΣΗΣ ΕΠΙΧΕΙΡΗΣΕΩΝ
Η λειτουργία των Venture Capitals (VCs)
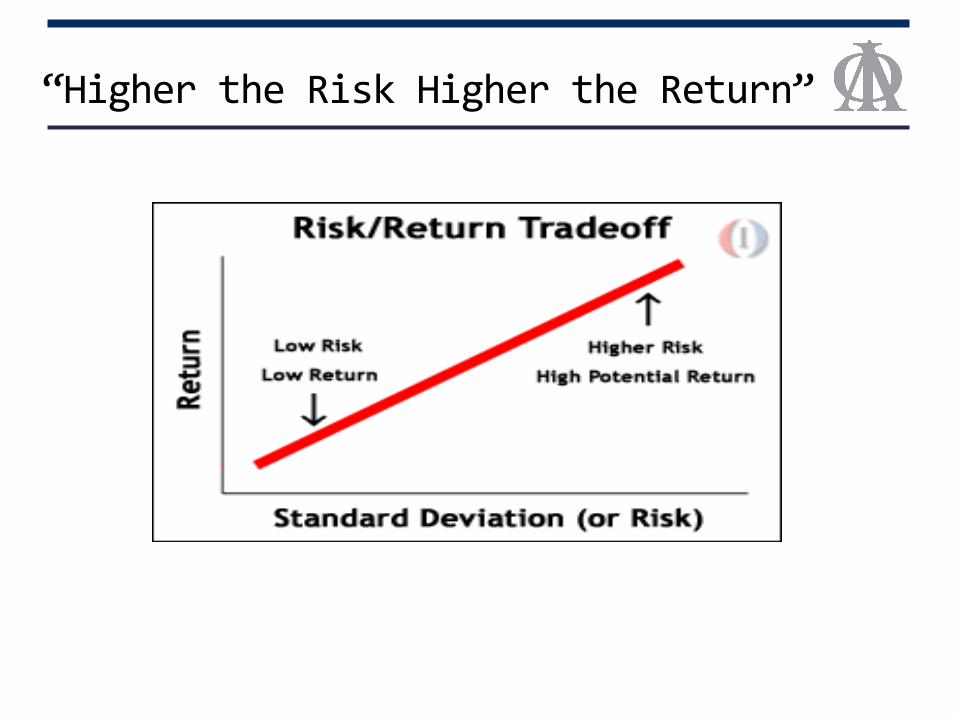
“Higher the Risk Higher the Return”
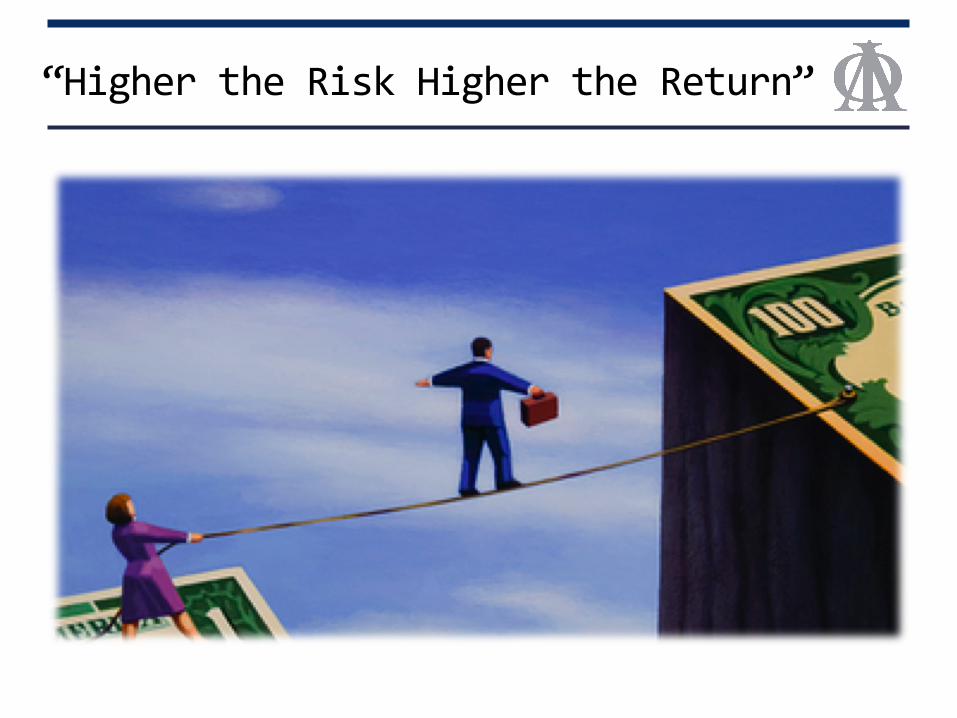
“Higher the Risk Higher the Return”
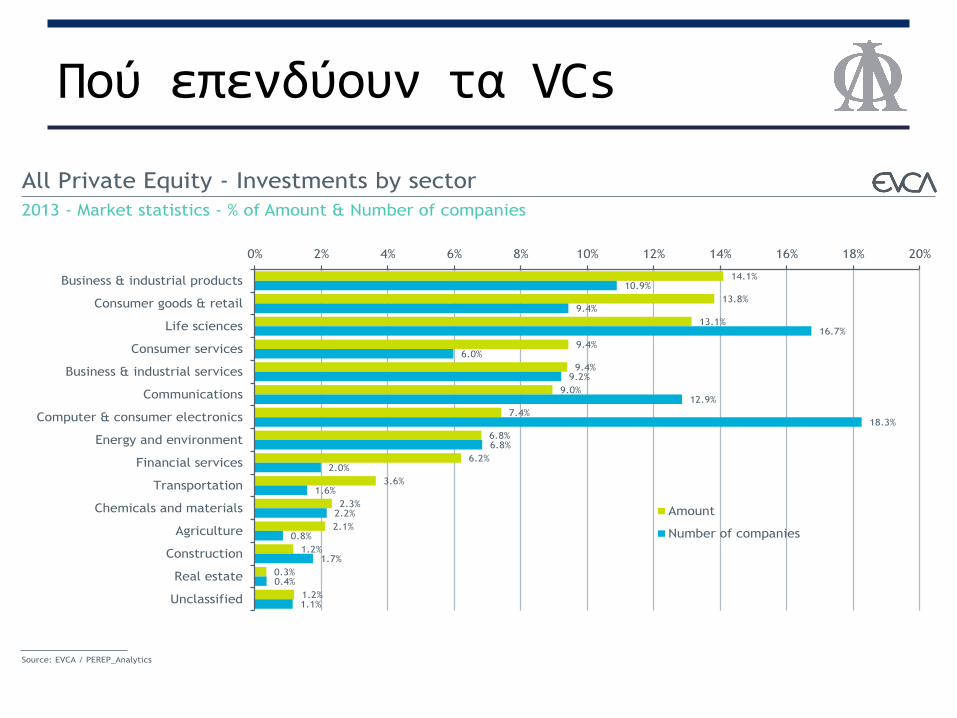
Πού επενδύουν τα VCs
Divestments INVESTMENTS Fundraising
All Private Equity - Investments by sector 2013 - Market statistics - % of Amount & Number of companies
Source: EVCA / PEREP_Analytics
2013 European Private Equity Activity 52
14.1%
13.8%
13.1%
9.4%
9.4%
9.0%
7.4%
6.8%
6.2%
3.6%
2.3%
2.1%
1.2%
0.3%
1.2%
10.9%
9.4%
16.7%
6.0%
9.2%
12.9%
18.3%
6.8%
2.0%
1.6%
2.2%
0.8%
1.7%
0.4%
1.1%
0% 2% 4% 6% 8% 10% 12% 14% 16% 18% 20%
Business & industrial products
Consumer goods & retail
Life sciences
Consumer services
Business & industrial services
Communications
Computer & consumer electronics
Energy and environment
Financial services
Transportation
Chemicals and materials
Agriculture
Construction
Real estate
Unclassified
Amount
Number of companies
Πλεονεκτήματα VCs Networks / Expertise / Funds
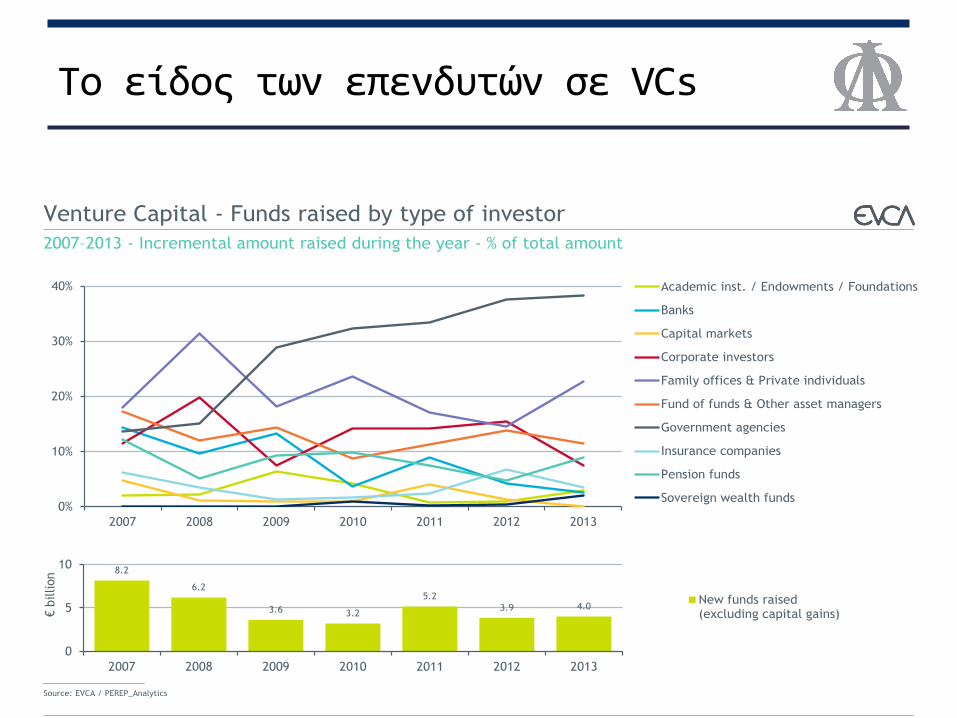
Το είδος των επενδυτών σε VCs
Divestments Investments FUNDRAISING
0%
10%
20%
30%
40%
2007 2008 2009 2010 2011 2012 2013
Venture Capital - Funds raised by type of investor 2007–2013 - Incremental amount raised during the year - % of total amount
Source: EVCA / PEREP_Analytics
2013 European Private Equity Activity 17
8.2
6.2
3.6 3.2
5.2 3.9 4.0
0
5
10
2007 2008 2009 2010 2011 2012 2013
€ bi
llion
New funds raised(excluding capital gains)
0%5%
10%15%20%25%30%35%40%
Academic inst. / Endowments / Foundations
Banks
Capital markets
Corporate investors
Family offices & Private individuals
Fund of funds & Other asset managers
Government agencies
Insurance companies
Pension funds
Sovereign wealth funds
Divestments INVESTMENTS Fundraising
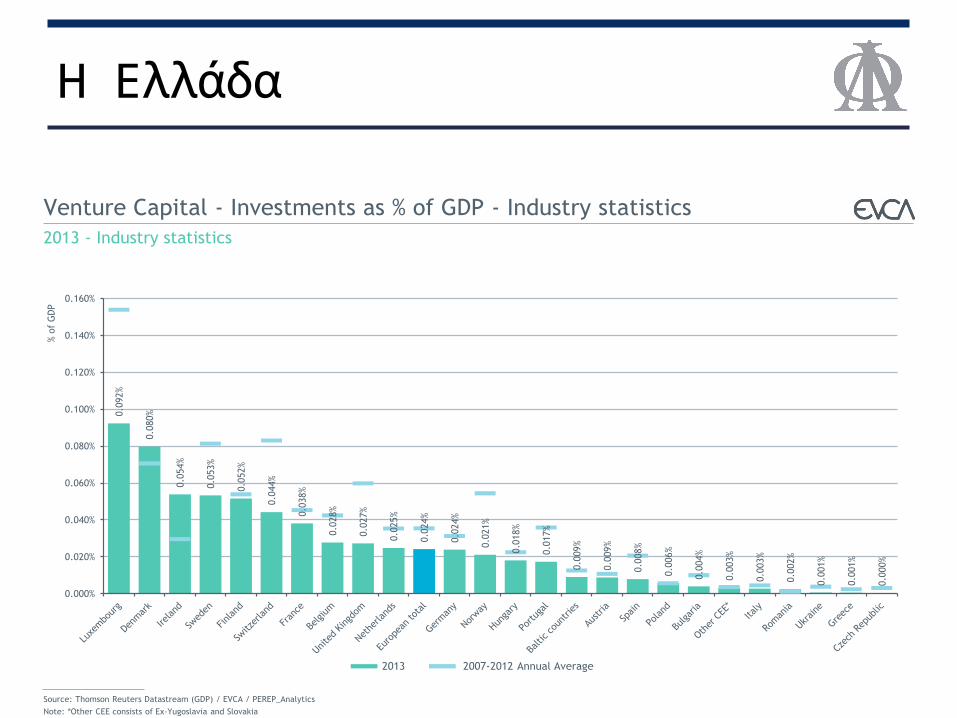
Venture Capital - Investments as % of GDP - Industry statistics 2013 - Industry statistics
Source: Thomson Reuters Datastream (GDP) / EVCA / PEREP_Analytics Note: *Other CEE consists of Ex-Yugoslavia and Slovakia 2013 European Private Equity Activity 45
0.09
2%
0.08
0%
0.05
4%
0.05
3%
0.05
2%
0.04
4%
0.03
8%
0.02
8%
0.02
7%
0.02
5%
0.02
4%
0.02
4%
0.02
1%
0.01
8%
0.01
7%
0.00
9%
0.00
9%
0.00
8%
0.00
6%
0.00
4%
0.00
3%
0.00
3%
0.00
2%
0.00
1%
0.00
1%
0.00
0%
0.000%
0.020%
0.040%
0.060%
0.080%
0.100%
0.120%
0.140%
0.160%
% of
GDP
2013 2007-2012 Annual Average
Η Ελλάδα
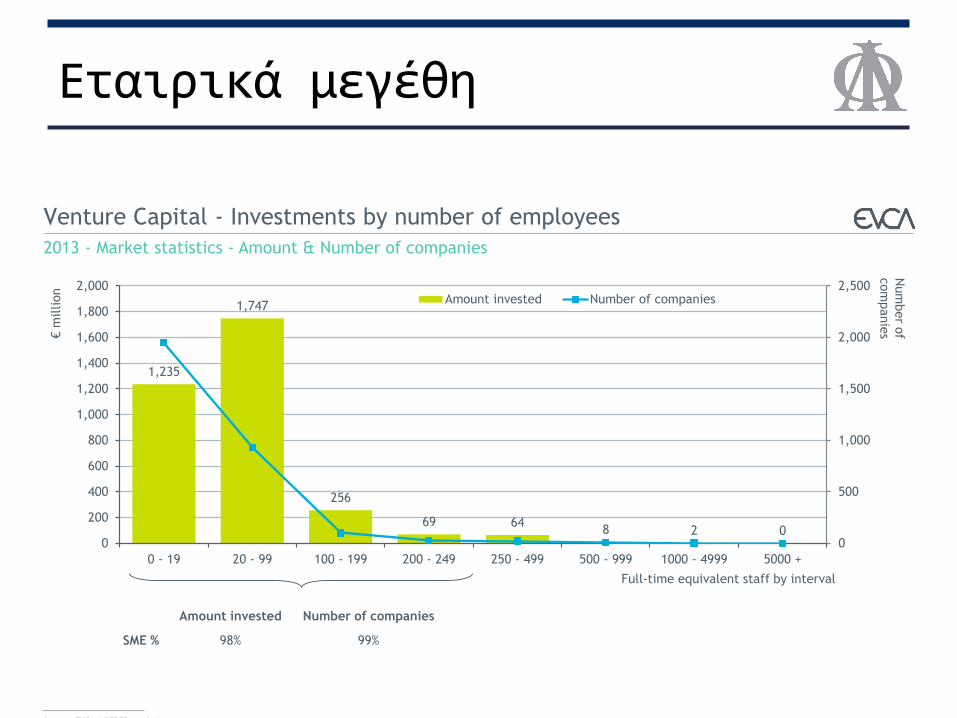
Εταιρικά μεγέθη
The image
The image
The imag
The image
The imag
The imag
The imag
The image
The imag
The image
Divestments INVESTMENTS Fundraising
1,235
1,747
256
69 64 8 2 0 0
500
1,000
1,500
2,000
2,500
0
200
400
600
800
1,000
1,200
1,400
1,600
1,800
2,000
0 - 19 20 - 99 100 - 199 200 - 249 250 - 499 500 - 999 1000 - 4999 5000 +
Num
ber of com
panies € m
illio
n
Amount invested Number of companies
Venture Capital - Investments by number of employees 2013 - Market statistics - Amount & Number of companies
Source: EVCA / PEREP_Analytics
Full-time equivalent staff by interval
Amount invested Number of companies
SME % 98% 99%
2013 European Private Equity Activity 57

Ευχαριστώ για το χρόνο σας