Vconditions diverging from equilibrium. Modest differences in γ and γ′ lattice parameters and...
44
T.P. Gabb, J. Gayda, D.F. Johnson, R.A. MacKay, R.B. Rogers, and C.K. Sudbrack Glenn Research Center, Cleveland, Ohio A. Garg and I.E. Locci University of Toledo, Toledo, Ohio S.L. Semiatin Air Force Research Laboratory, Wright-Patterson Air Force Base, Ohio E. Kang Northwestern University, Evanston, Illinois Comparison of γ-γ′ Phase Coarsening Responses of Three Powder Metal Disk Superalloys NASA/TM—2016-218936 February 2016 https://ntrs.nasa.gov/search.jsp?R=20160001847 2020-03-09T22:59:57+00:00Z
Transcript of Vconditions diverging from equilibrium. Modest differences in γ and γ′ lattice parameters and...
T.P. Gabb, J. Gayda, D.F. Johnson, R.A. MacKay, R.B. Rogers, and C.K. SudbrackGlenn Research Center, Cleveland, Ohio
A. Garg and I.E. LocciUniversity of Toledo, Toledo, Ohio
S.L. SemiatinAir Force Research Laboratory, Wright-Patterson Air Force Base, Ohio
E. KangNorthwestern University, Evanston, Illinois
Comparison of γ-γ′ Phase Coarsening Responsesof Three Powder Metal Disk Superalloys
NASA/TM—2016-218936
February 2016
https://ntrs.nasa.gov/search.jsp?R=20160001847 2020-03-09T22:59:57+00:00Z
NASA STI Program . . . in Profile
Since its founding, NASA has been dedicated to the advancement of aeronautics and space science. The NASA Scientific and Technical Information (STI) Program plays a key part in helping NASA maintain this important role.
The NASA STI Program operates under the auspices of the Agency Chief Information Officer. It collects, organizes, provides for archiving, and disseminates NASA’s STI. The NASA STI Program provides access to the NASA Technical Report Server—Registered (NTRS Reg) and NASA Technical Report Server—Public (NTRS) thus providing one of the largest collections of aeronautical and space science STI in the world. Results are published in both non-NASA channels and by NASA in the NASA STI Report Series, which includes the following report types: • TECHNICAL PUBLICATION. Reports of
completed research or a major significant phase of research that present the results of NASA programs and include extensive data or theoretical analysis. Includes compilations of significant scientific and technical data and information deemed to be of continuing reference value. NASA counter-part of peer-reviewed formal professional papers, but has less stringent limitations on manuscript length and extent of graphic presentations.
• TECHNICAL MEMORANDUM. Scientific
and technical findings that are preliminary or of specialized interest, e.g., “quick-release” reports, working papers, and bibliographies that contain minimal annotation. Does not contain extensive analysis.
• CONTRACTOR REPORT. Scientific and technical findings by NASA-sponsored contractors and grantees.
• CONFERENCE PUBLICATION. Collected papers from scientific and technical conferences, symposia, seminars, or other meetings sponsored or co-sponsored by NASA.
• SPECIAL PUBLICATION. Scientific,
technical, or historical information from NASA programs, projects, and missions, often concerned with subjects having substantial public interest.
• TECHNICAL TRANSLATION. English-
language translations of foreign scientific and technical material pertinent to NASA’s mission.
For more information about the NASA STI program, see the following:
• Access the NASA STI program home page at http://www.sti.nasa.gov
• E-mail your question to [email protected] • Fax your question to the NASA STI
Information Desk at 757-864-6500
• Telephone the NASA STI Information Desk at 757-864-9658 • Write to:
NASA STI Program Mail Stop 148 NASA Langley Research Center Hampton, VA 23681-2199
T.P. Gabb, J. Gayda, D.F. Johnson, R.A. MacKay, R.B. Rogers, and C.K. SudbrackGlenn Research Center, Cleveland, Ohio
A. Garg and I.E. LocciUniversity of Toledo, Toledo, Ohio
S.L. SemiatinAir Force Research Laboratory, Wright-Patterson Air Force Base, Ohio
E. KangNorthwestern University, Evanston, Illinois
Comparison of γ-γ′ Phase Coarsening Responsesof Three Powder Metal Disk Superalloys
NASA/TM—2016-218936
February 2016
National Aeronautics andSpace Administration
Glenn Research Center Cleveland, Ohio 44135
Acknowledgments
Michael Cox and Anna Palzer are gratefully acknowledged for X-ray diffraction and differential thermal analysis experiments, respectively. Herng-Jeng Jou, Greg Olsen, Jeff Simmons, and Mark Hardy are acknowledged for many helpful discussions during the design and performance of this study. The NASA Aviation Safety and Aging Aircraft Durability programs are also acknowledged for supporting this work.
Available from
Trade names and trademarks are used in this report for identification only. Their usage does not constitute an official endorsement, either expressed or implied, by the National Aeronautics and
Space Administration.
This work was sponsored by the Fundamental Aeronautics Program at the NASA Glenn Research Center.
Level of Review: This material has been technically reviewed by technical management.
NASA STI ProgramMail Stop 148NASA Langley Research CenterHampton, VA 23681-2199
National Technical Information Service5285 Port Royal RoadSpringfield, VA 22161
703-605-6000
This report is available in electronic form at http://www.sti.nasa.gov/ and http://ntrs.nasa.gov/
NASA/TM—2016-218936 1
Comparison of γ-γ′ Phase Coarsening Responses of Three Powder Metal Disk Superalloys
T.P. Gabb, J. Gayda,* D.F. Johnson, R.A. MacKay, R.B. Rogers, and C.K. Sudbrack
National Aeronautics and Space Administration Glenn Research Center Cleveland, Ohio 44135
A. Garg and I.E. Locci University of Toledo Toledo, Ohio 43606
S.L. Semiatin
Air Force Research Laboratory Wright-Patterson Air Force Base, Ohio 45433
E. Kang
Northwestern University Evanston, Illinois 60208
Abstract The phase microstructures of several powder metal (PM) disk superalloys were quantitatively
evaluated. Contents, chemistries, and lattice parameters of γ and γ′ strengthening phase were determined for conventionally heat treated Alloy 10, LSHR, and ME3 superalloys, after electrolytic phase extractions. Several of long term heat treatments were then performed, to allow quantification of the precipitation, content, and size distribution of γ′ at a long time interval to approximate equilibrium conditions. Additional coarsening heat treatments were performed at multiple temperatures and shorter time intervals, to allow quantification of the precipitation, contents and size distributions of γ′ at conditions diverging from equilibrium. Modest differences in γ and γ′ lattice parameters and their mismatch were observed among the alloys, which varied with heat treatment. Yet, γ′ coarsening rates were very similar for all three alloys in the heat treatment conditions examined. Alloy 10 had higher γ′ dissolution and formation temperatures than LSHR and ME3, but a lower lattice mismatch, which was slightly positive for all three alloys at room temperature. The γ′ precipitates of Alloy 10 appeared to remain coherent at higher temperatures than for LSHR and ME3. Higher coarsening rates were observed for γ′ precipitates residing along grain boundaries than for those within grains in all three alloys, during slow-moderate quenching from supersolvus solution heat treatments, and during aging at temperatures of 843 °C and higher.
Introduction Nickel-based turbine disk superalloys are fundamentally made up of a Ni face centered cubic (γ)
phase matrix reinforced by Ni3Al ordered L12 (γ′) phase precipitates (Ref. 1). The composition of both γ′ and γ phases can influence the mechanical properties and environmental resistance of each phase, and the superalloy as well (Ref. 2). The contents and size distributions of γ′ strengthening precipitates have been
* Currently retired.
NASA/TM—2016-218936 2
shown to strongly influence mechanical properties of disk superalloys (Refs. 1, 2, 3, and 4). When powder metallurgy alloys are processed for uniform composition, these morphology parameters are dictated by alloy composition and thermo-mechanical processing. More recent powder metallurgy disk superalloys for high temperature applications have been designed with 50 to 55 percent of γ′ precipitates, usually less than 0.3 µm in diameter, having refractory element additions of Ti, Ta, and Nb for additional inherent phase strength. The γ matrix phase also has element additions for processing (Co, Mo), strength (W, Mo), and environmental resistance (Cr).
Microstructure modeling software such as ThermoCalc (Ref. 5), JMatPro (Ref. 6), and Pandat (Ref. 7) have been developed over recent years, which can estimate equilibrium phase compositions, quantities, and sizes as functions of temperature for input alloy compositions. Other software packages such as PrecipiCalc (Ref. 8) have been developed to specifically predict γ′ content and size distribution for input alloy composition and temperature-time paths. In order to assess and calibrate such tools for specific needs, it is necessary to consistently generate experimental data on representative alloys of interest, quantifying phase compositions, contents, and sizes after varying thermal histories. Furthermore, it would be useful to consistently apply the same isothermal coarsening experiments to disk superalloys having varied compositions, and then to consistently quantify the microstructures and compare coarsening responses. The objective of this study was to compare the γ′ phase contents and sizes present in three powder metallurgy disk superalloys consistently heat treated near and far from equilibrium conditions, specifically after varied quenching and isothermal coarsening heat treatments.
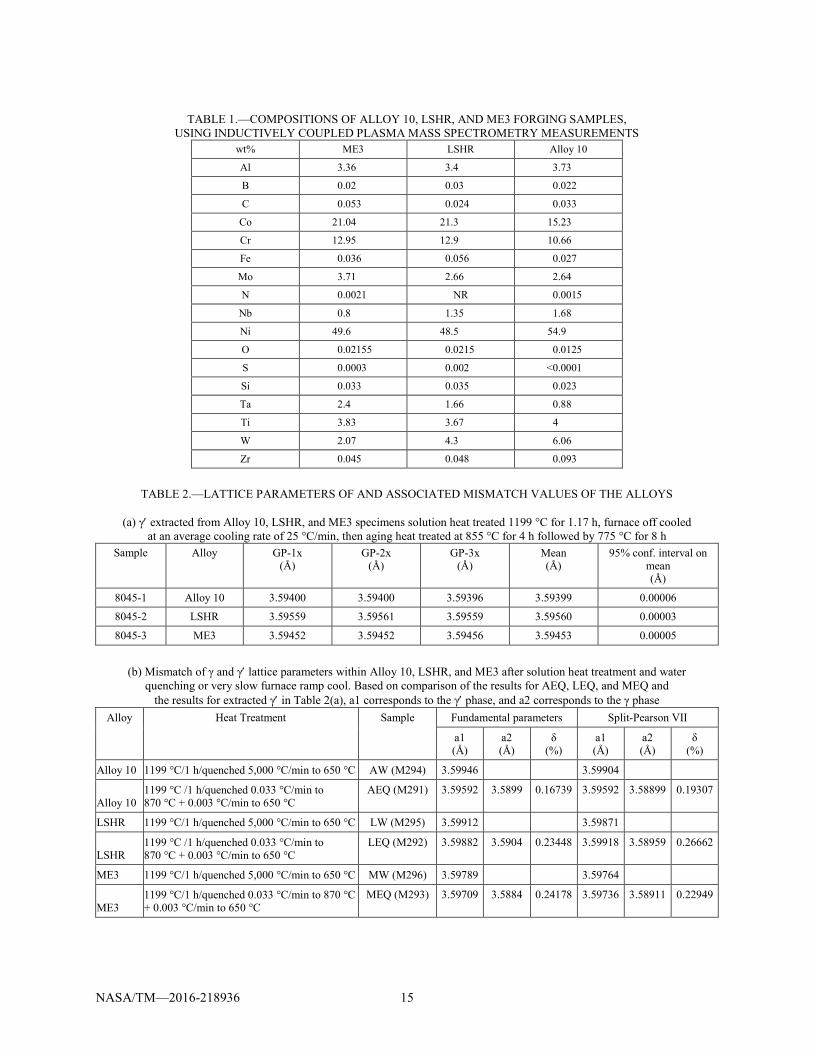
Materials and Procedures Compositions in weight percent of the three disk superalloys examined are listed in Table 1 in weight
percent. These superalloys were all produced using powder metallurgy processing, with powder atomization in argon atmosphere. Alloy 10 (Refs. 9 and 10) powder was passed through –270 mesh screens, then sealed in a container, hot isostatically pressed, and extruded at a reduction ratio of 6:1. A segment of the extrusion billet was machined, then isothermally forged into a flat disk about 35.6 cm in diameter and 5 cm thick. LSHR (Ref. 11) powder was passed through –270 mesh screens, then sealed in a container, hot compacted, and extruded at a reduction ratio of 6:1. A segment of the extrusion billet was machined to 15 cm diameter and 20 cm long, then isothermally forged into a flat disk about 30 cm in diameter and 5 cm thick. ME3 (Refs. 12 and 13), was processed in a comparable manner, but the larger diameter extrusion segment was machined to 23 cm diameter and 20 cm long, then isothermally forged into a flat disk about 46 cm in diameter and 5 cm thick. Samples were obtained from each disk in the as-forged condition for a variety of heat treatments.
Phase Extractions
Samples of the three alloys weighing about 10 g each were solution heat treated at 1199 °C for 1.17 h, then cooled in the furnace with the power off to below 870 °C at an average cooling rate of 25 °C/min, as shown in the temperature-time cooling curves of Figure 1. They were then aged at 855 °C for 4 h and 775 °C for 8 h, again with furnace off cools from each temperature. Compositions and contents of γ and γ′ phases were determined after separation by electrolytic phase extractions. Triplicate γ′ phase extractions were performed for each alloy using a 1 g ammonium sulfate-1 g citric acid-100 mL H2O electrolyte. The extractions were passed through a filter having mean mesh size of 0.1 μm. Extracted phases and lattice parameters were identified using X-ray diffraction (XRD). The compositions of samples prior to extractions and of the phase extractions were determined by inductively coupled plasma (ICP) chemical
NASA/TM—2016-218936 3
analyses. The composition of the γ phase was determined by chemical analysis of the ammonium sulfate/citric acid electrolyte immediately after the γ′ extractions were completed. The composition of the extracted γ′ phase was determined after analyses by X-ray diffraction.
X-Ray Diffraction
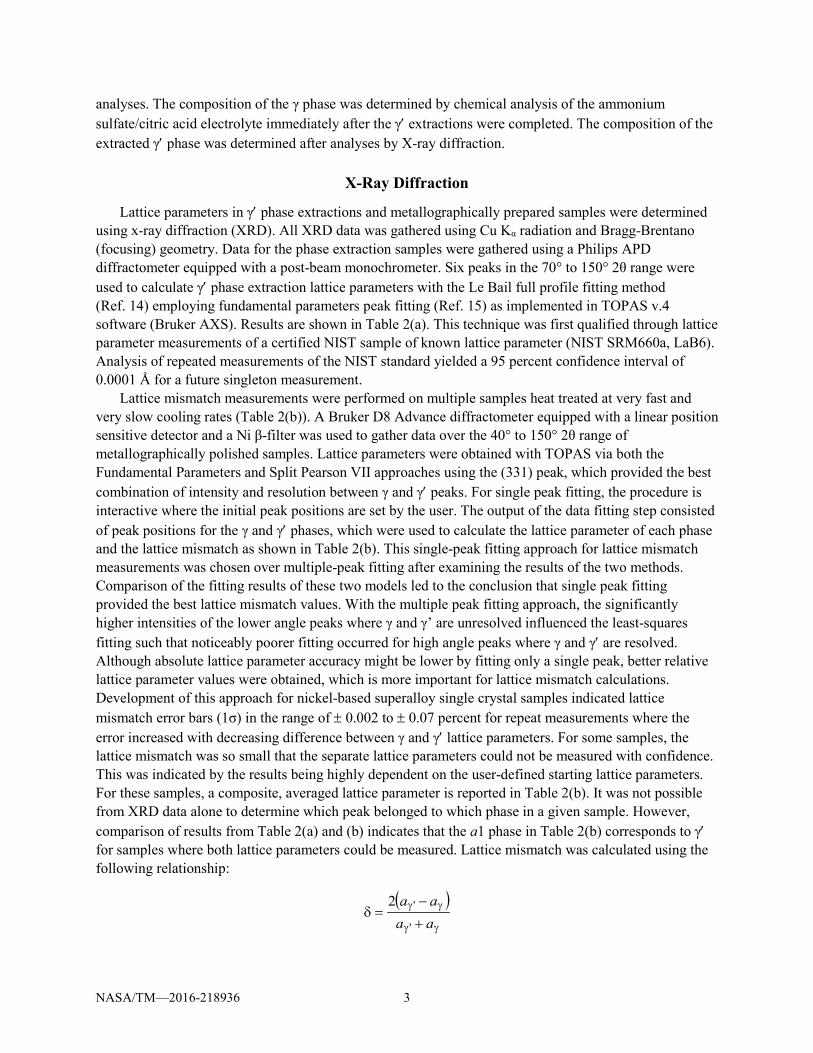
Lattice parameters in γ′ phase extractions and metallographically prepared samples were determined using x-ray diffraction (XRD). All XRD data was gathered using Cu Kα radiation and Bragg-Brentano (focusing) geometry. Data for the phase extraction samples were gathered using a Philips APD diffractometer equipped with a post-beam monochrometer. Six peaks in the 70° to 150° 2θ range were used to calculate γ′ phase extraction lattice parameters with the Le Bail full profile fitting method (Ref. 14) employing fundamental parameters peak fitting (Ref. 15) as implemented in TOPAS v.4 software (Bruker AXS). Results are shown in Table 2(a). This technique was first qualified through lattice parameter measurements of a certified NIST sample of known lattice parameter (NIST SRM660a, LaB6). Analysis of repeated measurements of the NIST standard yielded a 95 percent confidence interval of 0.0001 Å for a future singleton measurement.
Lattice mismatch measurements were performed on multiple samples heat treated at very fast and very slow cooling rates (Table 2(b)). A Bruker D8 Advance diffractometer equipped with a linear position sensitive detector and a Ni β-filter was used to gather data over the 40° to 150° 2θ range of metallographically polished samples. Lattice parameters were obtained with TOPAS via both the Fundamental Parameters and Split Pearson VII approaches using the (331) peak, which provided the best combination of intensity and resolution between γ and γ′ peaks. For single peak fitting, the procedure is interactive where the initial peak positions are set by the user. The output of the data fitting step consisted of peak positions for the γ and γ′ phases, which were used to calculate the lattice parameter of each phase and the lattice mismatch as shown in Table 2(b). This single-peak fitting approach for lattice mismatch measurements was chosen over multiple-peak fitting after examining the results of the two methods. Comparison of the fitting results of these two models led to the conclusion that single peak fitting provided the best lattice mismatch values. With the multiple peak fitting approach, the significantly higher intensities of the lower angle peaks where γ and γ’ are unresolved influenced the least-squares fitting such that noticeably poorer fitting occurred for high angle peaks where γ and γ′ are resolved. Although absolute lattice parameter accuracy might be lower by fitting only a single peak, better relative lattice parameter values were obtained, which is more important for lattice mismatch calculations. Development of this approach for nickel-based superalloy single crystal samples indicated lattice mismatch error bars (1σ) in the range of ± 0.002 to ± 0.07 percent for repeat measurements where the error increased with decreasing difference between γ and γ′ lattice parameters. For some samples, the lattice mismatch was so small that the separate lattice parameters could not be measured with confidence. This was indicated by the results being highly dependent on the user-defined starting lattice parameters. For these samples, a composite, averaged lattice parameter is reported in Table 2(b). It was not possible from XRD data alone to determine which peak belonged to which phase in a given sample. However, comparison of results from Table 2(a) and (b) indicates that the a1 phase in Table 2(b) corresponds to γ′ for samples where both lattice parameters could be measured. Lattice mismatch was calculated using the following relationship:
( )
γγ
γγ
+
−=δ
aaaa
'
'2
NASA/TM—2016-218936 4
Here, a is the lattice parameter and the subscripts identify different phases (Ref. 16).
Differential Thermal Analyses
Differential thermal analysis (DTA) experiments were performed using a Netzsch STA 409C. Some of the LSHR results on the same tool were previously reported elsewhere (Ref. 17). Triple cycle experiments were used to help estimate the transformation temperatures that the γ′ phase precipitates and borides dissolve on heating and form on cooling, while single cycle experiments were used to estimate the solidus and liquidus temperatures on heating. Cylindrical samples were extracted from as-forged disks. The majority of these samples were 5 mm in diameter, ~8 mm in length, and weighed approximately 1400 to 1600 mg (see Table 3). The only exception was the LSHR sample for the single cycle solidus / liquidus experiment, which was 5 mm in diameter, ~4 mm in length and weighed 683.1 mg. The DTA chamber was backfilled twice with inert He to remove oxygen before starting to heat for all experiments.
Samples for triple-cycle experiments under a 40 to 60 mL/min He flow were heated quickly, either at 20 or at 10 °C/min, to a starting temperature of 1000 °C for LSHR and ME3 and 1030 °C for Alloy 10 to minimize weight gains. Then, using slower rates selected among 10, 5, and 2 °C/min (Table 3), they were heated and cooled three times between the starting tempeature and maximum temperature of 1200 to 1220 °C for LSHR and ME3, and 1250 °C for Alloy 10. The samples were quickly cooled, at either 20 °C/min or 10 °C/min, to room temperature. The weight gains after the triple cycle DTA experiments ranged between 0.1 to 0.3 mg (see Table 3), which gives confidence that any surface oxidation due to residual oxygen in the inert environment did not influence DTA measurements. The transformation temperatures of each cycle were determined from the intersections of tangential lines at the onset and at the tail of the transformation in the thermograms. The peaks were distinct for the boride transformation on cooling, while the γ′ phase transformations exhibited more gradual slopes with temperature. A mean and standard deviation value were determined from the three thermal cycles during the DTA experiment on one disk sample. Mean values as a function of temperature rate were extrapolated linearly to 0 °C/min as described in more detail in the Results section below.
The maximum temperature for the single-cycle experiments was 1370 °C, where samples were run continuously at 5 °C/min in the temperature range of interest (Table 3) under a 40 to 60 mL/min He flow. The liquidus on heating was determined from the intersections of tangential lines at the onset and at the tail of each transformation in the thermograms. Since the change in heat capacity at the solidus temperature is gradual, the solidus is difficult to determine from DTA measurements. Solidus was thus determined by inspecting in an enlarged view the intersection of the base line and the extrapolated tangent approximation of the thermogram. The weight gains after the single cycle DTA experiments were also reasonalbly small and ranged between 0.4 to 0.7 mg (Table 3).
Heat Treatments to Quantify γ′ Coarsening as Functions of Temperature and Time
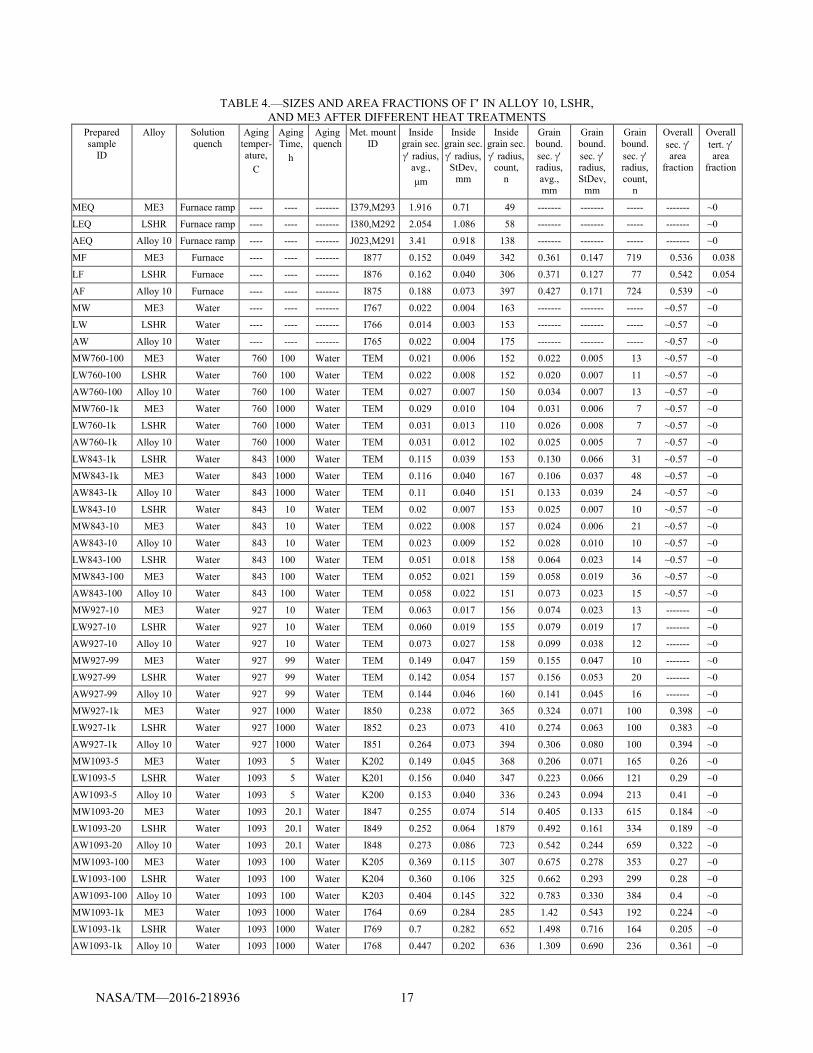
Numerous cylindrical samples 3.2 mm diameter and 22 mm long of Alloy 10, LSHR, and ME3 were extracted by electro-discharge machining from the as-forged disks for heat treatments, listed in Table 4. Several pins were solution heat treated in argon atmosphere at 1199 °C for 1 h, and water quenched or furnace cooled for examination, as shown in the temperature-time cooling curves of Figure 1. The average cooling rate to 650 °C of water quenched specimens was 5,000 °C/min. Several other specimens were cooled in the furnace by simply turning the furnace off. The average cooling rate of specimens cooled with the furnace power off was 25 °C/min to 870 °C. Finally, several specimens were given a very slow controlled furnace cooling ramp at a constant cooling rate 2 °C/h (0.033 °C/min) to 870 °C followed by a constant cooling rate of 0.19 °C/h (0.0032 °C/min) to 650 °C, in an attempt to allow cooling
NASA/TM—2016-218936 5
conditions to approach equilibrium. Additional solution heat treated and water quenched pins were given aging heat treatments in argon at 760, 843, 927, and 1093 °C for 1,000 h and water quenched, to determine γ′ phase content and size at long term aging conditions approaching equilibrium. Aging heat treatments were also performed at these temperatures for shorter times, in conditions diverging from equilibrium. Sections of each sample were metallographically prepared, then etched with a solution of 33 mL HCl - 33 mL HNO3 - 33 mL acetic acid - 33 mL H2O - 1 mL HF for examining γ′. These sections were examined in a Hitachi S-4700 Field Emission scanning electron microscope (SEM). For conditions producing very fine γ′ sizes, thin disks of 3 mm diameter and ~ 0.5 mm thick were sliced and mechanically ground and polished. These disks were then electrochemically thinned to electron transparency using a solution of 10 percent perchloric acid and 90 percent methanol cooled to –30 °C. A FEI CM200 Transmission Electron Microscope (TEM) operating at 200 kV was used for imaging γ′ precipitates in these cases.
SEM and TEM evaluations were performed in a complementary manner. For γ′ phase quantification, TEM was used to image γ′ precipitates when they were less than 0.5 μm in diameter. TEM dark field imaging conditions were used on grains oriented with the [001] crystallographic direction near normal to the electron beam, to illuminate the γ′ phase at very thin locations of the foil. SEM was used to image γ′ precipitates when they were larger. Precipitates were measured within the grains having more cuboidal precipitate morphologies, signifying grains oriented with the [001] crystallographic direction near normal to the electron beam. Precipitates along those grain boundaries were also measured and tabulated separately. While their limited numbers prevented construction of size-frequency histograms, mean sizes could still be determined for initial comparisons.
Particle sizes were measured using SigmaScan Pro image analysis software. The difference in brightness between γ′ and γ phases enabled brightness-based local thresholding. γ′ precipitates residing at grain boundaries were thresholded separately from those within grains, to enable separate evaluations of precipitate sizes. Major axis, minor axis, and area were determined for each particle and tabulated. Phase area fraction was determined by combining the areas of all particles within an image.
Results Phase Compositions
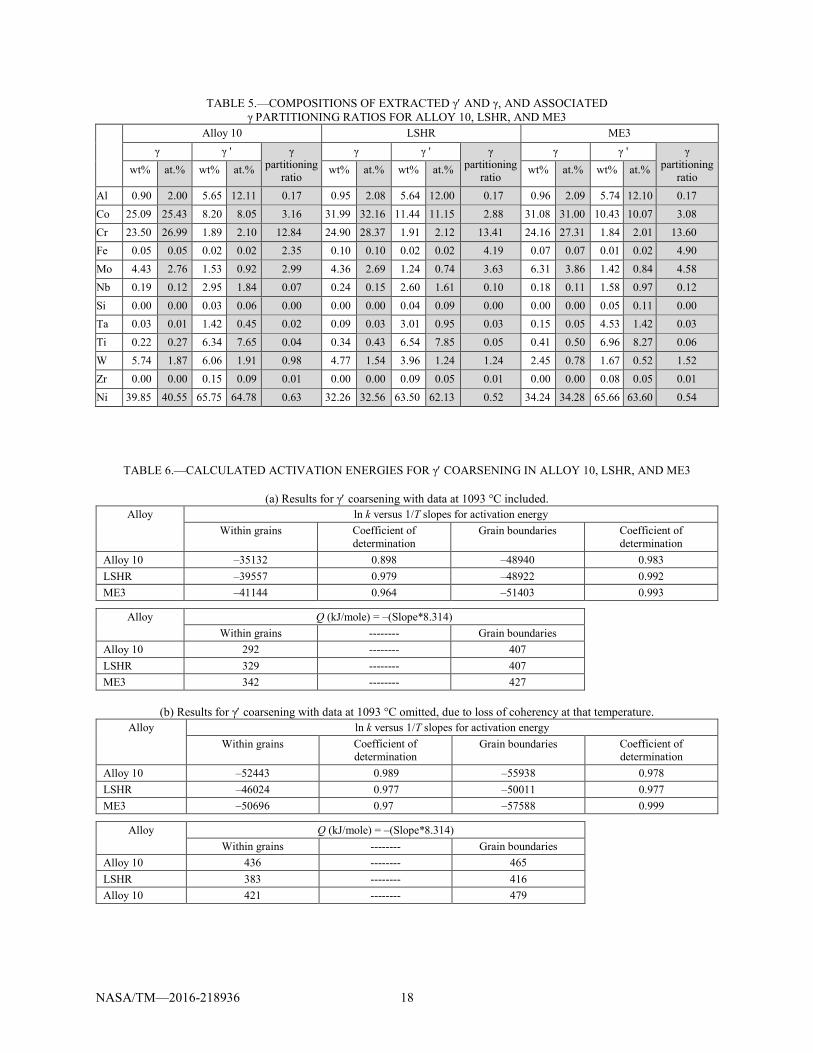
The microstructures of samples used in phase extractions are shown in Figure 2. Both cuboidal secondary γ′ phase precipitates of 0.1 to 0.25 μm width and spherical tertiary γ′ phase precipitates near 0.01 to 0.03 μm diameter were observed in all three alloys. Analyses by x-ray diffraction indicated the γ′ phase extractions were very clean, and did not contain other phases in significant quantities. Due to the pore size of the filter paper, this is expected to be mostly made up of secondary γ′ precipitates. Therefore, compositions of the γ′ phase extractions were measured as a representation of average chemistry for secondary γ′, Table 5. The solvent of the remaining phase extraction solution was evaporated away, and the solid remains were analyzed to determine average γ phase compositions, also compared in Table 5. Resulting partitioning ratios are also included. The measured γ and γ′ compositions closely agree with prior measurements on the three alloys using an atom probe (Ref. 8), and the associated partitioning ratios. Al, Ti, Ta, and Nb consistently partitioned preferentially to the γ′, while Cr, Co, Mo partitioned more to the γ phase, consistent with results reported on other superalloys (Refs. 1 and 18). As also reported before, W was near evenly partitioned between the γ and γ′ phases.
NASA/TM—2016-218936 6
γ- γ′ Lattice Parameters and Mismatch
The clean γ′ phase extractions for each alloy allowed refined measurement of their lattice parameters using multiple peaks. These should be considered unconstrained lattice parameters, as the γ′ precipitates were extracted, and not constrained by the surrounding γ matrix phase. Unconstrained lattice parameters of the γ phase are compared for the alloys in Table 2. LSHR had the largest γ′ phase lattice parameter, followed in decreasing order by ME3 and Alloy 10.
It would be expected that such constraint is a function of heat treatment (Ref. 19).Therefore, samples of all three alloys were solution heat treated at 1199 °C and then given highly divergent cooling paths as shown in the temperature-time cooling curves of Figure 1, and measured for lattice mismatch (Table 2(a)).The lattice mismatch values in the samples quenched at 5,000 °C/min (AW, LW, MW in Table 2(b)) were too small for our program to distinguish between peaks for the γ and γ′ phases. These results indicate the lattice mismatch magnitudes were less than 0.02 percent, the estimated limit of peak resolution at room temperature. Companion samples were given a very slow cooling rate of 2 °C/h (0.033 °C/min) to 870 °C followed by 0.19 °C/h (0.003 °C/min) from 870 to 650 °C. Microstructural examinations of the latter very slowly cooled specimens indicated the γ′ phase precipitates no longer consistently had a regular cuboidal morphology, and showed coalescence of the γ′ phase precipitates along grain boundaries, as seen in Figure 3. This indicated a loss of coherency between the phases, with reduced constraint between phases. The lattice parameters of phase 1 in the mismatch measurements of these specimens approached that of the extracted γ′ phase for each alloy. This suggested that phase 1 having the larger lattice parameter was the γ′ phase in each alloy, and that all three alloys had small positive values of lattice mismatch at room temperature that ranged from +0.19 to +0.27 percent. Alloy 10 had the lowest mismatch, with LSHR and ME3 having similar, slightly higher values of mismatch, Table 2(b).
γ′ Dissolution and Formation Temperatures
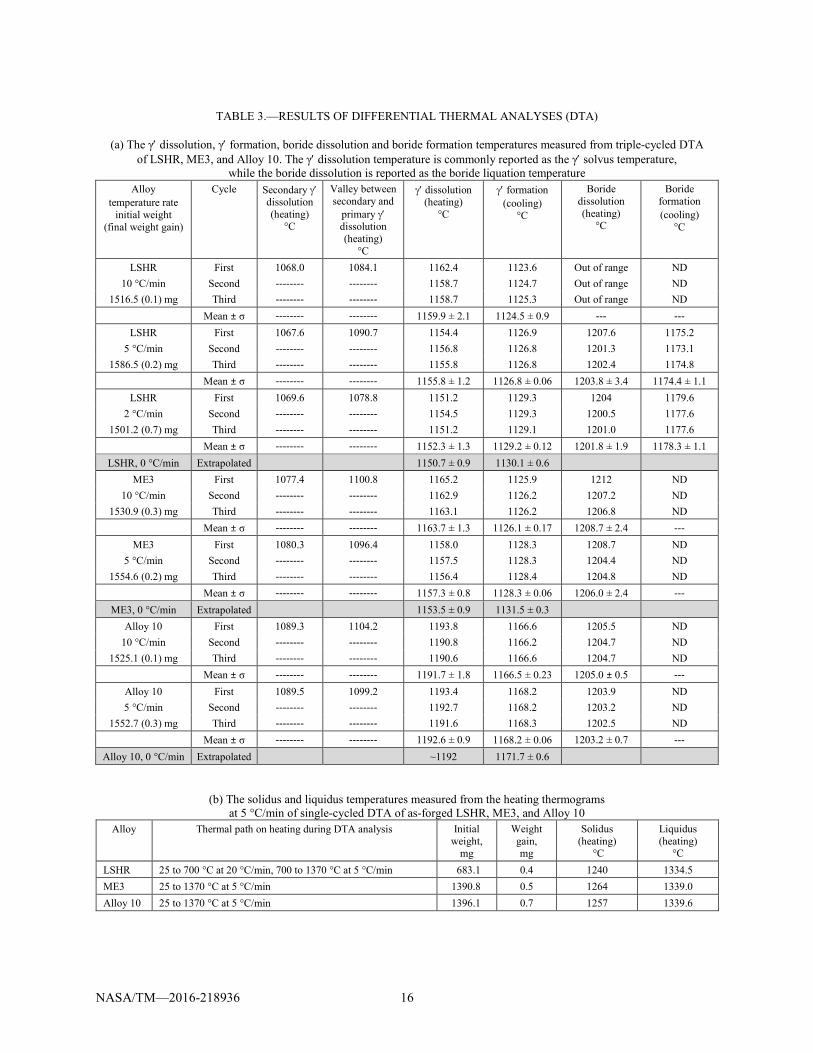
Heating and cooling curves from the cycling DTA experiments are shown in Figure 4 for as-forged LSHR, ME3 and Alloy 10 samples. The measured γ′ and boride transformation temperatures from these curves are listed in Table 3, where both the temperatures for the γ′ dissolution on heating and γ′ formation on cooling temperatures are reported. Note, the dissolution temperatures are most commonly reported as the γ′-solvus temperature and boride liquation temperature.
On the first pass of cycling DTA (Figure 4), broad peaks at approximately 1070, 1080, and 1090 °C are observed for the as-forged LSHR, ME3 and Alloy 10, respectively. These peaks are associated with a smaller population of secondary γ′ precipitates from the native bimodal distribution in the as-forged alloys. Then, with cooling from the first pass and continued cycling with the second and third passes, no such peaks are observed indicating that the γ′ precipitate distribution is or is nearly unimodal. The maximum temperature that was reached for the LSHR sample cycled at 10 °C/min was only 1200 °C, which meant the boride dissolution temperature was out of range. It followed that the borides were still intact on cooling. The boron content is higher in LSHR than in the Alloy 10 and ME3 alloys that were examined here (Table 1). Accordingly, LSHR was the only alloy where the boride formation temperatures were observable on cooling, as the volume fraction of borides that form on cooling is smaller.
In all three alloys, the fastest heating rate of 10 °C/min for the cycling DTA consistently gave the highest dissolution temperatures for both the γ′ precipitates and borides, where these temperatures decreased as the heating rate decreased. Accordingly, the faster the cooling rates, the lower the formation temperatures during cooling were. LSHR and ME3 had very similar responses for the γ′ phase, with γ′ dissolution temperatures ranging from 1151 to 1162 °C, and γ′ formation temperatures ranging from 1129
NASA/TM—2016-218936 7
to 1123 °C. For the γ′ phase, Alloy 10 had consistently higher temperatures, with a γ′ dissolution temperature ranging from 1190 to 1193 °C, and a γ′ formation temperatures ranging from 1168 to 1166 °C. The γ′ dissolution temperature for Alloy 10 is close to the boride dissolution temperature, where the former is only 10 to 13 °C lower than the latter, while for LSHR and ME3 they are 48 to 54 °C lower, Table 3. For the Alloy 10, the proximity of the boride dissolution peak led to overlap with the γ′ dissolution peak. The two measured γ′ dissolution values for Alloy 10 instead of decreasing with the slower rate like the other alloys are about same, ~ 1192 °C. This is shown clearly in Figure 4, which plots the mean transformation temperatures for all the γ′ dissolution and γ′ formation temperature measured by DTA as a function of temperature rate.
The as-forged LSHR was the only condition where three different temperture rates (x) were anlayzed with the cycling DTA, which allowed the mean transformation temperatures (y) to be extrapolated linearly, y = mx + b, to 0 °C/min (b) in Figure 4(b). The slope (m) of LSHR γ′-dissolution temperature and LSHR γ′-formation temperature were determined to be 0.94 ± 0.09 min and 0.57 ± 0.09 min, respectively. Since the as-forged ME3 and Alloy 10 were only analyzed at two temperature rates, the slopes determined for LSHR were employed for linear extrapolation of data from ME3. For Alloy 10, a γ′ dissolution temperature where a slope equal to zero was used. Extrapolated values are listed in Table 3a, and shown in Figure 4(b) with a fitting error.
The solidus and liquidus temperatures were determined for all three alloys using DTA, Figure 4 and Table 3(b). The solidus values were 1240, 1264 and 1257 °C for LSHR, ME3 and Alloy 10, respectively. The liquidus temperatures were extremely close for ME3 and Alloy 10, 1339.0 and 1339.6 °C, and slightly lower for LSHR at 1334.5 °C. The chemistry of ME3 more closely resembles LSHR than Alloy 10, so closer agreement in liquidus measurements might be expected. The observation that LSHR’s liquidus is 5 °C lower may be due to the fact that the sample size is nearly three times smaller than the other two samples. Such an effect was observed in a prior report with LSHR DTA, where some of the results presented here were previously reported (Ref. 17).
γ′ Phase Morphology Versus Cooling Rate
Typical images of the γ′ microstructures are compared for water quenched, furnace cooled, and very slowly cooled specimens in Figure 5, Figure 6, and Figure 2. Water quenched specimens cooled at 5,000 °C/min had uniform, very small spherical precipitates. Specimens cooled in the furnace at 25 °C/min had larger precipitates that were more cuboidal, yet the cubes were sometimes segmented into octets. Precipitates coarsened faster at grain boundaries than within grains for the slower cooling rate of the latter furnace cooled specimens. Very slowly cooled specimens had a complex morphology of γ′ sizes within grains, with large precipitates of several microns diameter and smaller precipitates at less than 1 μm observed in the grains of each alloy. Excessive precipitate coarsening along as well as across the grain boundaries was also observed here. Water quenched specimens had the smallest, most uniform γ′ size for each alloy, and had equivalent radius versus frequency that could be approximated as normal distributions. Therefore, this solution quenching heat treatment was selected for subsequent coarsening experiments.
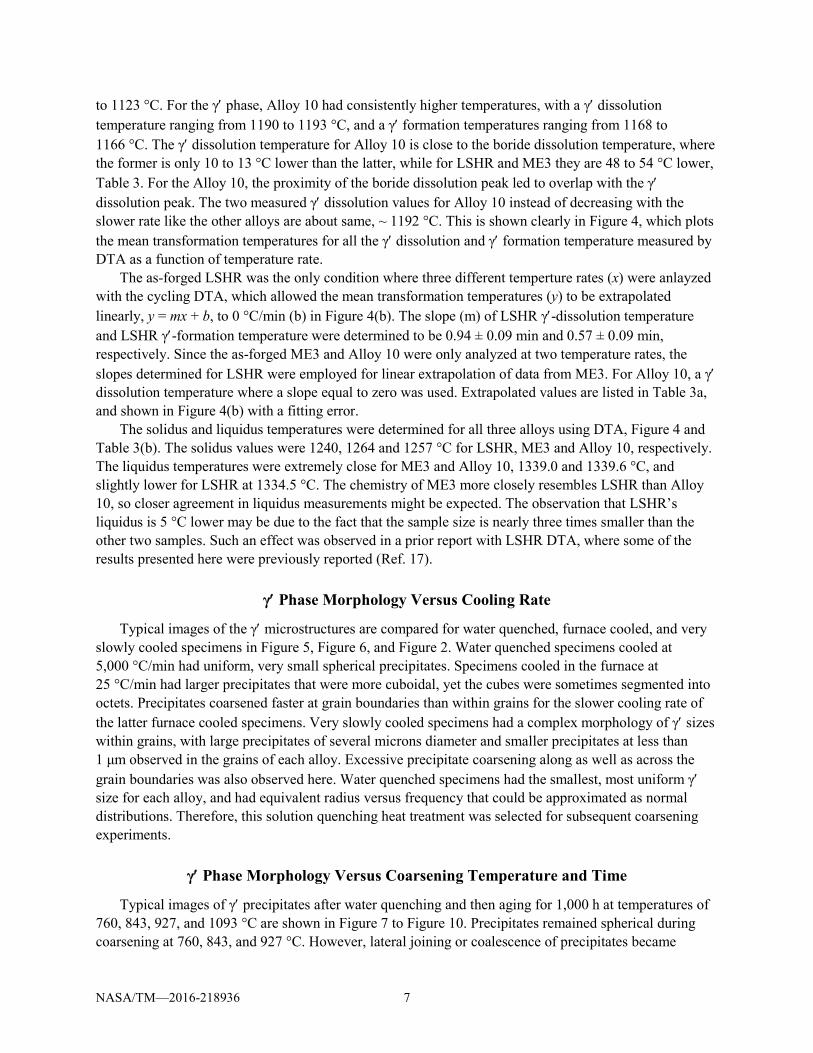
γ′ Phase Morphology Versus Coarsening Temperature and Time
Typical images of γ′ precipitates after water quenching and then aging for 1,000 h at temperatures of 760, 843, 927, and 1093 °C are shown in Figure 7 to Figure 10. Precipitates remained spherical during coarsening at 760, 843, and 927 °C. However, lateral joining or coalescence of precipitates became
NASA/TM—2016-218936 8
evident at 1093 °C, especially for LSHR and ME3. Brief evaluations using transmission electron microscopy of the later specimen aged 1,000 h at 1093 °C indicated misfit dislocations were arranged along the precipitate-matrix interfaces, Figure 11.
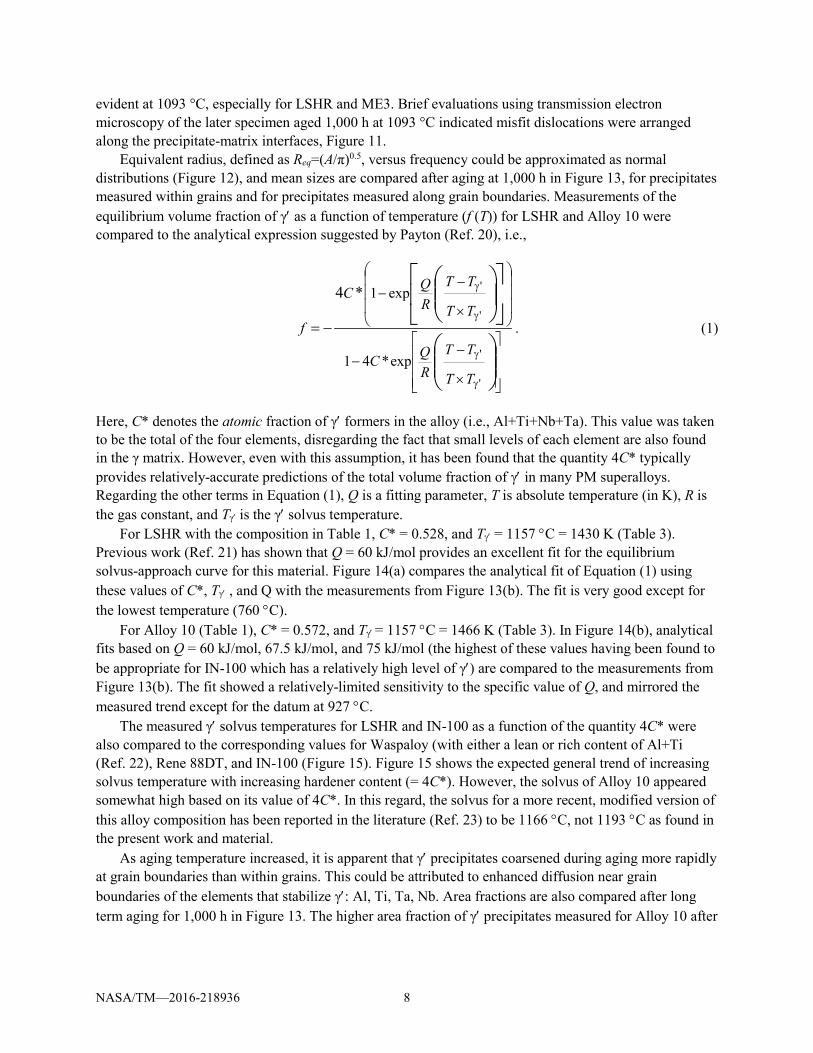
Equivalent radius, defined as Req=(A/π)0.5, versus frequency could be approximated as normal distributions (Figure 12), and mean sizes are compared after aging at 1,000 h in Figure 13, for precipitates measured within grains and for precipitates measured along grain boundaries. Measurements of the equilibrium volume fraction of γ′ as a function of temperature (f (T)) for LSHR and Alloy 10 were compared to the analytical expression suggested by Payton (Ref. 20), i.e.,
×
−−
×
−−
γ
γ
γ
γ
−=
'
'
'
'
exp*41
exp1*4
TT
TTRQC
TT
TTRQC
f . (1)
Here, C* denotes the atomic fraction of γ′ formers in the alloy (i.e., Al+Ti+Nb+Ta). This value was taken to be the total of the four elements, disregarding the fact that small levels of each element are also found in the γ matrix. However, even with this assumption, it has been found that the quantity 4C* typically provides relatively-accurate predictions of the total volume fraction of γ′ in many PM superalloys. Regarding the other terms in Equation (1), Q is a fitting parameter, T is absolute temperature (in K), R is the gas constant, and Tγ′ is the γ′ solvus temperature.
For LSHR with the composition in Table 1, C* = 0.528, and Tγ′ = 1157 °C = 1430 K (Table 3). Previous work (Ref. 21) has shown that Q = 60 kJ/mol provides an excellent fit for the equilibrium solvus-approach curve for this material. Figure 14(a) compares the analytical fit of Equation (1) using these values of C*, Tγ′ , and Q with the measurements from Figure 13(b). The fit is very good except for the lowest temperature (760 °C).
For Alloy 10 (Table 1), C* = 0.572, and Tγ′ = 1157 °C = 1466 K (Table 3). In Figure 14(b), analytical fits based on Q = 60 kJ/mol, 67.5 kJ/mol, and 75 kJ/mol (the highest of these values having been found to be appropriate for IN-100 which has a relatively high level of γ′) are compared to the measurements from Figure 13(b). The fit showed a relatively-limited sensitivity to the specific value of Q, and mirrored the measured trend except for the datum at 927 °C.
The measured γ′ solvus temperatures for LSHR and IN-100 as a function of the quantity 4C* were also compared to the corresponding values for Waspaloy (with either a lean or rich content of Al+Ti (Ref. 22), Rene 88DT, and IN-100 (Figure 15). Figure 15 shows the expected general trend of increasing solvus temperature with increasing hardener content (= 4C*). However, the solvus of Alloy 10 appeared somewhat high based on its value of 4C*. In this regard, the solvus for a more recent, modified version of this alloy composition has been reported in the literature (Ref. 23) to be 1166 °C, not 1193 °C as found in the present work and material.
As aging temperature increased, it is apparent that γ′ precipitates coarsened during aging more rapidly at grain boundaries than within grains. This could be attributed to enhanced diffusion near grain boundaries of the elements that stabilize γ′: Al, Ti, Ta, Nb. Area fractions are also compared after long term aging for 1,000 h in Figure 13. The higher area fraction of γ′ precipitates measured for Alloy 10 after
NASA/TM—2016-218936 9
1,000 h at 1093 °C is consistent with this alloy’s higher γ′ solvus temperature measured in DTA, in comparison to LSHR and ME3.
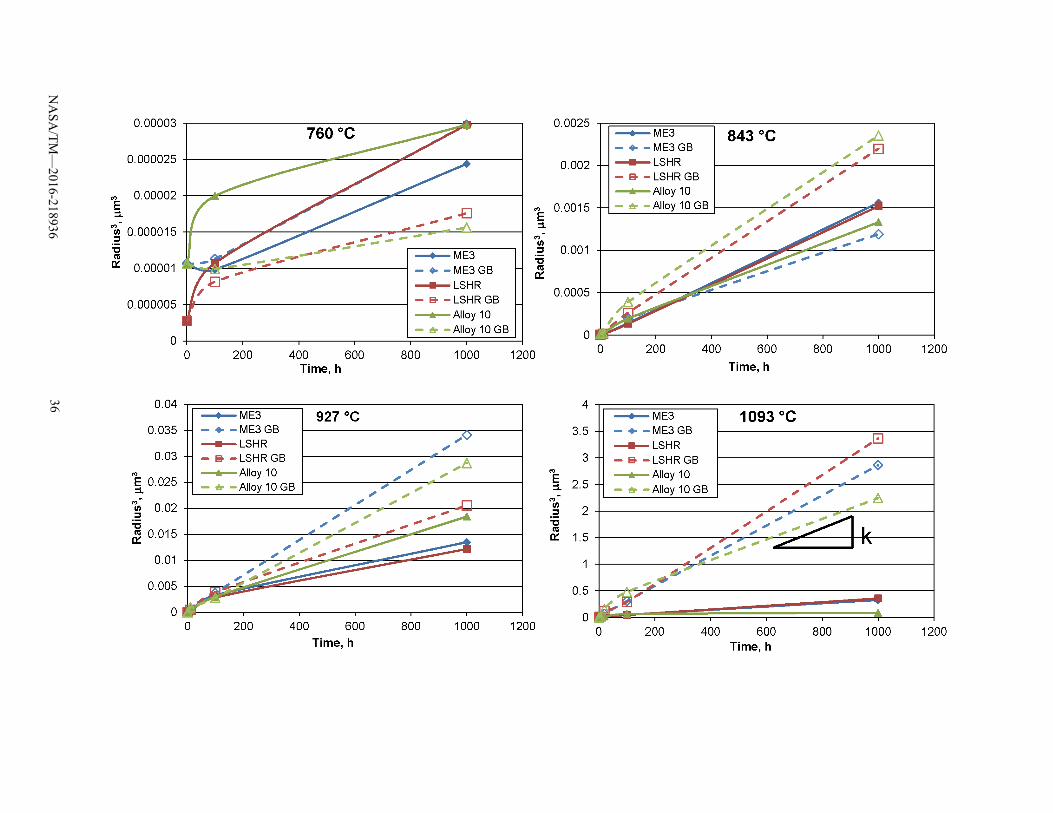
Mean γ′ precipitate sizes separately measured within grains and along grain boundaries are compared for all coarsening test temperatures and times in Figure 16. Coarsening rates were approximated using the LSW theory (Ref. 24) on the mean equivalent radius measurements, where rt
3 – ro3= k t, as shown in
Figure 17. The resulting coarsening constant k is shown for each alloy and temperature, in the form log k versus 1/T, in Figure 18. The slope of this relationship represented the activation energy for coarsening of coherent precipitates. This relationship diverged from linearity for each alloy at the highest temperature of 1093 °C, where precipitates were observed to coalescence and lose coherency (Figure 10 and Figure 11). Such divergence has been observed in other superalloys when precipitates coalescence and lose their coherency (Ref. 25). This divergence in linearity is reflected in the lower coefficients of determination calculated when including the results at 1093 °C. Activation energies were determined both with and without inclusion of the results at 1093 °C, Table 6.
The resulting activation energies are compared in Table 6, along with the slopes and associated coefficients of determination (R2). The activation energies calculated with the results from 760 to 1093 °C were slightly higher than published values of 127 to 280 J/mole-K reported in References 26 and 27. The activation energies calculated from only the results from 760 to 927 °C were consistently higher than these values. The values calculated for grain boundaries were higher than those calculated for within grains in both cases, for all three alloys.
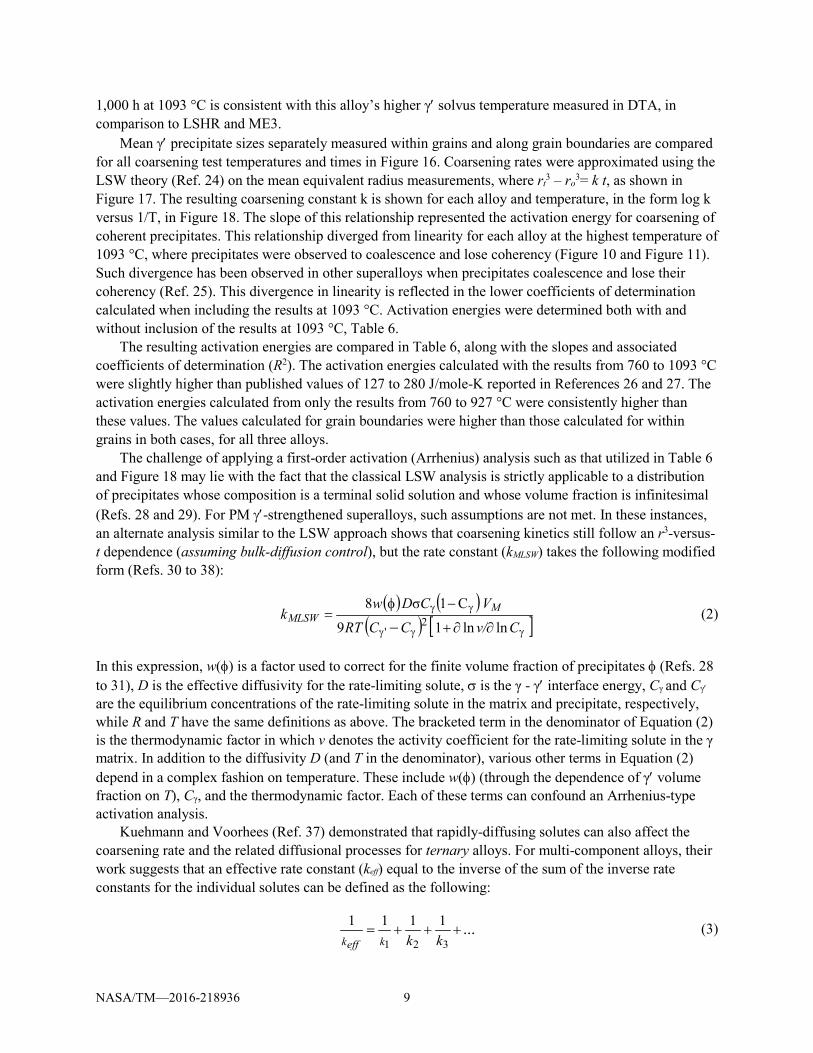
The challenge of applying a first-order activation (Arrhenius) analysis such as that utilized in Table 6 and Figure 18 may lie with the fact that the classical LSW analysis is strictly applicable to a distribution of precipitates whose composition is a terminal solid solution and whose volume fraction is infinitesimal (Refs. 28 and 29). For PM γ′-strengthened superalloys, such assumptions are not met. In these instances, an alternate analysis similar to the LSW approach shows that coarsening kinetics still follow an r3-versus-t dependence (assuming bulk-diffusion control), but the rate constant (kMLSW) takes the following modified form (Refs. 30 to 38):
( ) ( )
( ) [ ]γγγ
γγ
∂∂+
−φ=
− Cv/CCRT
VCDwk M
MLSWlnln19
C1σ82
' (2)
In this expression, w(φ) is a factor used to correct for the finite volume fraction of precipitates φ (Refs. 28 to 31), D is the effective diffusivity for the rate-limiting solute, σ is the γ - γ′ interface energy, Cγ and Cγ′ are the equilibrium concentrations of the rate-limiting solute in the matrix and precipitate, respectively, while R and T have the same definitions as above. The bracketed term in the denominator of Equation (2) is the thermodynamic factor in which v denotes the activity coefficient for the rate-limiting solute in the γ matrix. In addition to the diffusivity D (and T in the denominator), various other terms in Equation (2) depend in a complex fashion on temperature. These include w(φ) (through the dependence of γ′ volume fraction on T), Cγ, and the thermodynamic factor. Each of these terms can confound an Arrhenius-type activation analysis.
Kuehmann and Voorhees (Ref. 37) demonstrated that rapidly-diffusing solutes can also affect the coarsening rate and the related diffusional processes for ternary alloys. For multi-component alloys, their work suggests that an effective rate constant (keff) equal to the inverse of the sum of the inverse rate constants for the individual solutes can be defined as the following:
...321
1111+++=
kkkeffk (3)
NASA/TM—2016-218936 10
Input Data
Theoretical estimates of the rate of coarsening of intragranular precipitates were obtained for LSHR and Alloy 10. Because of its similarity to LSHR in terms of composition, alloying-element partition ratios, solvus temperature, and observed coarsening rates, such calculations were not done for ME3. The values of the various material coefficients needed to apply Equation (2) were obtained from the present measurements (i.e., the overall alloy and precipitate compositions) and the data in References 21 and 33. Specifically, w(φ) was taken to be that derived by Voorhees and Glicksman (Ref. 33) as depicted in Figure 19, and σ was assumed to be 23 mJ/m2 (Ref. 21). The molar volume VM was estimated as 7.22×10⁻⁶ and 7.04×10⁻⁶ m3/mol for LSHR and Alloy 10, respectively. In addition, chromium was taken to be the rate-limiting solute for coarsening, and its “effective” diffusivity was assumed to be one-third that of Cr in the Ni-Cr binary, per Reference 21.
Deff (m2/s) = A × DB = 0.33 × 0.00036 exp (–34278/T(K)). (4)
The activation energy for diffusion of Cr in Ni (285 kJ/mol) is similar to the values in Table 6(a) for intragranular coarsening. The diffusivities of the various other solutes in each alloy were taken to be in the ratios (relative to that of Cr) suggested by the work of Campbell, et al. (Ref. 39). The thermodynamic factors for Equation (2) were estimated using the commercial code Pandat (CompuTherm LLC, Madison, WI).
Coarsening-Rate Predictions
Calculated per Equation (2), the coarsening rate constant at 1093 °C for each substitutional solute in LSHR is summarized in Table 7. The results indicated that the rate constant for chromium (1.81×10⁻⁷ µm3/s) was indeed smaller than those for each of the other elements by a factor of four or more. Hence, as has been found for both the nucleation and growth of γ′ precipitates in LSHR (Ref. 21), the diffusion of chromium was concluded to be the principal alloying element which limits the rate of coarsening of the intragranular precipitates in LSHR (and the other program materials). When the effect of all of the solutes on the coarsening rate was taken into account (Eq. (3)), an effective rate constant of 1.14×10⁻⁷ µm3/s was estimated. This value is approximately 37 percent lower than that associated with Cr alone.
Based on Equation (2) for chromium, without or with the contribution of the other solutes taken into account via Equation (3), predicted rate constants for both LSHR and Alloy 10 for the three highest heat-treatment temperatures (843, 927, and 1093 °C) were estimated and are summarized in Table 8. These values are compared in the table to the measured rate constants based on the measured average radii from the TEM and SEM observations in Table 4. In these instances, it was assumed that the measured radii were the true 3D values. This assumption is valid for observations taken from TEM foils. For the SEM observations on 2D sections, on the other hand, the actual 3D radius is more difficult to determine. For a distribution of mono-size spheres, the true 3D radii are larger (by a factor of approximately 22 percent) than the average deduced from a 2D section. However, recent geometric analysis by Payton (Ref. 40) for distributions that have finite breadth, as is pertinent for a distribution of precipitates undergoing coarsening, suggests that such a correction provides a large overestimation of the actual average 3D size. Hence, as a first approximation, the radii from SEM observations were not corrected for stereological effects in obtaining the measured coarsening rates listed in Table 8. Furthermore, the measurements in Table 8 were based on data for the 0 to 1000 h or 0 to 100 h time intervals. In all cases, except the 1093 °C heat treatment of Alloy 10, the measurements for the two different intervals were very similar to
NASA/TM—2016-218936 11
each other. The divergence for Alloy 10 at the highest test temperature merits further investigation; the datum for the longest time (1000 h) appeared to be the source of the discrepancy.
The results in Table 8 exhibited good to excellent agreement between the measured and predicted rate constants, especially for comparisons using predictions incorporating all of the solutes. For LSHR, the agreement was excellent at 843 and 1093 °C. For 927 °C, the prediction also showed excellent agreement with the measurement based on the 0 to 1000 h interval, but was high by a factor of ~2, when compared to the measurement for the 0 to 100 h interval; such behavior can still be considered reasonable based on typical differences cited in the coarsening literature. For Alloy 10, the agreement was very good at 843 and 927 °C. At 1093 °C, the predicted value showed excellent agreement with the measurement based on the 0 h to 100 h interval, but a noticeable difference from the measurement based on the 0 to 1000 h interval.
The predicted rate constants were also compared to measurements for which the radii determined specifically from SEM 2D sections were corrected to 3D using a factor of 1.225, which would provide an upper bound for the stereological adjustment. Such comparisons Table 9 provided agreement between measurements and predictions which is reasonable but not as good as that in Table 8.
At 760 °C, the predicted coarsening rate constant for LSHR (from Eq. (2)) overestimated the measurement by approximately a factor of 5. This difference was likely due to a change in the coarsening mechanism from bulk-diffusion-control (at the higher temperatures) to more sluggish trans-interface-diffusion-control (Ref. 41) which typifies behavior at temperatures comparable those seen during jet-engine service.
Summary The phase microstructures of powder metal (PM) disk superalloys Alloy 10, LSHR, and ME3 were
quantitatively evaluated. The γ and γ′ phase transformation temperatures, compositions, lattice parameters, and morphologies were first assessed. Alloy 10 had higher γ′ dissolution and formation temperatures than LSHR and ME3, but a lower lattice mismatch at room temperature. Yet, all three alloys had slightly positive lattice mismatch at room temperature. Solution heat treatments with varied cooling rates and coarsening heat treatments were performed at multiple temperatures and time intervals, to enable assessments of γ′ morphology and size. γ′ coarsening rates were then compared. Coarsening rates were very similar for all three alloys in the heat treatment conditions examined. Higher coarsening rates were observed for γ′ precipitates residing along grain boundaries than for those within grains in all three alloys, during slow-moderate quenching from supersolvus solution heat treatments, and during aging at temperatures of 843 °C and higher. The γ′ precipitates of Alloy 10 appeared to remain coherent to higher temperatures than for LSHR and ME3.
Conclusions 1. For powder metal superalloys having similar γ′ contents, alloys having higher γ′ solvus temperature
can have a higher content of γ′ precipitates at 900 to 1000 °C, which remain coherent up to these high temperatures.
2. For such alloys having similar γ′ contents and γ- γ′ lattice mismatches, in spite of the different γ′ solvus temperatures, coarsening rates of γ′ precipitates within grains can be quite comparable. The coarsening rates can be estimated well using static coarsening experiments, and agree well with theoretical predictions.
NASA/TM—2016-218936 12
3. The coarsening rate of γ′ precipitates along the grain boundaries in these alloys can be significantly higher than for that within grains, with the enhancement of coarsening rate at grain boundaries increasing with temperature.
References 1. C.T. Sims, N.S. Stoloff, W.C. Hagel, ed., Superalloys II, John Wiley & Sons, New York, 1987. 2. R.C. Reed, The Superalloys, Cambridge University Press, 2006. 3. R.F. Decker, “Strengthening Mechanisms in Nickel-Base Superalloys,” Steel Strengthening
Mechanisms Symposium, Climax Molybdenum Company, 1969. 4. J.J. Schirra, S.H. Goetschius, “Development of an Analytical Model Predicting Microstructure and
Properties Resulting From the Thermal Processing of a Wrought Powder Nickel-base Superalloy Component,” Superalloys 1992, ed. S.D. Antolovich, R.W. Stusrud, R.A. MacKay, D.L. Anton, T. Khan, R.D. Kissinger, D.L. Klarstrom, The Minerals, Metals, and Materials Society, Warrendale, PA, 1992, pp. 437-446.
5. N. Saunders, “Phase Diagram Calculations for Ni-Based Superalloys,” Superalloys 1996, ed. R.D. Kissinger, D.J. Deye, D.L. Anton, A.D. Cetel, M.V. Nathal, T.M. Pollock, D.A. Woodford, The Minerals, Metals, and Materials Society, Warrendale, PA, 1996, pp. 101-110.
6. N. Saunders, Z. Guo, X. Li, A.P. Miodownik, J.-P. Schille, “Modelling The Material Properties and Behavior of Ni-Based Superalloys,” Superalloys 2004, ed. K.A. Green, T.M. Pollock, H. Harada, T.E. Howson, R.C. Reed, J.J. Schirra, The Minerals, Metals, and Materials Society, Warrendale, PA, 2004, pp. 849-858.
7. F.W. Cao, S.-L. Chen, F. Zhang, K. Wu, Y. Yang, Y.A. Chang, R. Schmid-Fetzer, W.A. Oates, “PANDAT Software with PanEngine, PanOptimizer and PanPrecipitation for Multi-Component Phase Diagram Calculation and Materials Property Simulation,” Calphad, V. 33(2), 2009, pp. 328-342.
8. G. Olson, H.-J. Jou, J. Jung, J.T. Sebastian, A. Misra, I. Locci, D. Hull, “Precipitation Model Validation in 3rd Generation Aeroturbine Disc Alloys,” Superalloys 2008, ed. R.C. Reed, K.A. Green, P. Caron, T.P. Gabb, M.G. Fahrmann, E.S. Huron, S.A. Woodard, The Minerals, Metals, and Materials Society, Warrendale, PA, 2008, pp.
9. H. Merrick, R.C. Benn, P.R. Bhowal, “High Strength Powder Metallurgy Nickel Base Alloy,” U.S. Patent 6,468,368 B1, U.S. Patent Office, Washington D.C., Oct. 2002.
10. J. Gayda, “Fatigue Characterization of Alloy 10: A 1300F Disk Alloy for Small Gas Turbine Engines,” NASA/TM—2000-210576, NASA, Washington, D.C., November, 2000.
11. T.P. Gabb, J. Gayda, J. Telesman, P.T. Kantzos, “Thermal and Mechanical Property Characterization of the Advanced Disk Alloy LSHR,” NASA/TM—2005-213645, NASA, Washington, D.C., June, 2005.
12. D.P. Mourer, J.L. Williams, “Dual Heat Treat Process Development for Advanced Disk Applications,” Superalloys 2004, ed. K.A. Green, H. Harada, T.E. Howson, T.M. Pollock, R.C. Reed, J.J. Schirra, S. Walston, TMS, Warrendale, PA, 2004, pp. 401-407.
13. J. Groh, D.P. Mourer, “Alternate Material For Elevated Temperature Turbine Cooling Plate Applications,” Superalloys 2004, ed. K.A. Green, H. Harada, T.E. Howson, T.M. Pollock, R.C. Reed, J.J. Schirra, S. Walston, TMS, Warrendale, PA, 2004, pp. 101-108.
14. Le Bail, H. Duroy, and J.L. Fourquet, “Ab Initio Structure Determination of LiSbWO6 by X-ray Powder Diffraction,” Materials Research Bulletin, V.23(3) (1988), p. 447-52.
15. R. W. Cheary and A. A. Coelho, “A Fundamental Parameters Approach of X-ray Line-Profile Fitting”, J. Appl. Cryst., V.25 (1992), pp. 109-121.
16. M.V. Nathal, R.A. MacKay, and R.G. Garlick, “Temperature Dependence of γ-γ′ Lattice Mismatch in Nickel-base Superalloys,” Materials Science and Engineering, V. 75, 1985, pp. 195-205. And Erratum, Materials Science and Engineering, V.80 (1986), p.101.
NASA/TM—2016-218936 13
17. T.P. Gabb, A. Garg, D.R. Miller, C. K. Sudbrack, D.R. Hull, D. Johnson, R.B. Rogers, J. Gayda, S.L. Semiatin, “Formation of Minor Phases in a Nickel-Based Superalloy,” NASA/TM—2012-217604, NASA, Washington, D.C., July, 2012.
18. T.P. Gabb, A. Garg, D.L. Ellis, “Microstructural Evaluation of Baseline HSR/EPM Disk Alloys,” NASA/TM—2004-213123, NASA, Washington, D.C., Aug. 2004.
19. R.J. Mitchell, M. Preuss, “Inter-Relationships Between Composition, γ′ Morphology, Hardness, and γ-γ′ Mismatch in Advanced Polycrystalline Nickel-base Superalloys During Aging at 800 °C,” Met. Trans. A, V. 38A, 2007, pp. 615-627.
20. E.J. Payton, Characterization and Modeling of Grain Coarsening in Powder Metallurgical Nickel-Base Superalloys, PhD Dissertation, The Ohio State University, Columbus, OH, 2009.
21. S.L. Semiatin, S-L. Kim, F. Zhang, J.S. Tiley, “An Investigation of High-Temperature Precipitation in Powder-Metallurgy, Gamma/Gamma-Prime Nickel-Base Superalloys,” Metall. Mater. Trans. A, Vol. 46A, 2015, pp. 1715-1730.
22. D.R. Muzyka, “Physical Metallurgy and Effects of Process Variables on the Microstructure of Wrought Superalloys,” MiCon 78: Optimization of Processing, Properties, and Service Performance through Microstructural Control, ASTM STP 672, ed. H. Abrams, G.N. Maniar, D.A. Nail, and H. D. Solomon, American Society for Testing and Materials, Philadelphia, 1979, pp. 526-576.
23. D. Rice, P. Kantzos, B. Ham, J. Neumann, R. Helmink, “P/M Alloy 10 - A 700°C Capable Nickel-Base Superalloy for Turbine-Disk Applications,” Superalloys 2008, ed. R.C. Reed, K.A. Green, P. Caron, T.P. Gabb, M.G. Fahrmann, E.S. Huron, S.A. Woodard, The Minerals, Metals, and Materials Society, Warrendale, PA, 2008, pp. 139-147.
24. M.Lifshitz, V.V.Slyozov, “The Kinetics of Precipitation From Supersaturated Solid Solutions,” J.Phvs. Chem. Solids, V. 19, 1961, pp. 35-50.
25. R.A. MacKay, M.V. Nathal, “γ′ Coarsening in High Volume Fraction Nickel-base Alloys,” Acta Metallurgica, V. 38, No. 6, 1990, pp. 993-1006.
26. D. Hadjiapostolidou, B.A. Shollock, “Long Term Coarsening in Rene′ 80 Ni-base Superalloy,” Superalloys 2008, ed. R.C. Reed, K.A. Green, P. Caron, T.P. Gabb, M.G. Fahrmann, E.S. Huron, S.A. Woodard, The Minerals, Metals, and Materials Society, Warrendale, PA, 2008, pp. 733-739.
27. J. Tiley, G. B. Viswanathan, R. Srinivasan, R. Banerjee, D.M. Dimiduk, H.L. Fraser, “Coarsening Kinetics of γ′ Precipitates in the Commercial Nickel Base Superalloy Rene′ 88 DT,” Acta Materialia, V. 57, No. 8, 2009, pp. 2538-2549.
28. R.D. Doherty, in Physical Metallurgy, R.W. Cahn and P. Haasen, eds., North-Holland, Amsterdam, 1996, Ch. 15.
29. J.W. Martin, R.D. Doherty, B. Cantor, Stability of Microstructure in Metallic Systems, Cambridge University Press, Cambridge, UK, 1997.
30. A.J. Ardell, “The Effect of Volume Fraction on Particle Coarsening: Theoretical Considerations,” Acta Metall., vol. 20, 1972, pp. 61-71.
31. A.D. Brailsford, P. Wynblatt, “The Dependence of Ostwald ripening Kinetics on Particle Volume Fraction,” Acta Metall., Vol. 27, 1979, pp. 489-497.
32. P.W. Voorhees and M.E. Glicksman, “Solution to the Multi-Particle Diffusion Problem with Applications to Ostwald Ripening – I. Theory,” Acta Metall., Vol. 32, 1984, pp. 2001-2011.
33. P.W. Voorhees, M.E. Glicksman, “Solution to the Multi-Particle Diffusion Problem with Applications to Ostwald Ripening – II. Computer Simulations,” Acta Metall., Vol. 32, 1984, pp. 2013-2030.
34. H.A. Calderon, P.W. Voorhees, J.L. Murray, G. Kostorz, “Ostwald Ripening in Concentrated Alloys,” Acta Metall. et Mater., Vol. 42, 1994, pp. 991-1000.
35. Umantsev, G.B. Olson, “Ostwald Ripening in Multicomponent Alloys,” Scripta Metall. et Mater., Vol. 29, 1993, pp. 1135-1140.
36. J.E. Morral, G.R. Purdy, “Particle Coarsening in Binary and Multicomponent Alloys,” Scripta Metall. et Mater., Vol. 30, 1994, pp. 905-908.
NASA/TM—2016-218936 14
37. C.J. Kuehmann, P.W. Voorhees, “Ostwald Ripening in Ternary Alloys,” Metall. Mater. Trans A, Vol. 27A, 1996, pp. 937-943.
38. S.L. Semiatin, B.C. Kirby, G.A. Salishchev, “Coarsening Behavior of an Alpha-Beta Titanium Alloy,” Metall. Mater. Trans. A, Vol. 35A, 2004, pp. 2809-2819.
39. C.E. Campbell, J.C. Zhao, M.F. Henry, “Comparison of Experimental and Simulated Multicomponent Ni-Base Superalloy Diffusion Couples,” J. of Phase Equilibria and Diffusion, Vol. 25, 2004, pp. 6-15.
40. E.J. Payton, Alfred University, unpublished research, 2015. 41. A.J. Ardell, V. Ozolins, “Trans-Interface Diffusion-Controlled Coarsening,” Nature Materials, Vol. 4,
2005, pp. 309-316.
NASA/TM—2016-218936 15
TABLE 1.—COMPOSITIONS OF ALLOY 10, LSHR, AND ME3 FORGING SAMPLES,
USING INDUCTIVELY COUPLED PLASMA MASS SPECTROMETRY MEASUREMENTS wt% ME3 LSHR Alloy 10
Al 3.36 3.4 3.73
B 0.02 0.03 0.022
C 0.053 0.024 0.033
Co 21.04 21.3 15.23
Cr 12.95 12.9 10.66
Fe 0.036 0.056 0.027
Mo 3.71 2.66 2.64
N 0.0021 NR 0.0015
Nb 0.8 1.35 1.68
Ni 49.6 48.5 54.9
O 0.02155 0.0215 0.0125
S 0.0003 0.002 <0.0001
Si 0.033 0.035 0.023
Ta 2.4 1.66 0.88
Ti 3.83 3.67 4
W 2.07 4.3 6.06
Zr 0.045 0.048 0.093
TABLE 2.—LATTICE PARAMETERS OF AND ASSOCIATED MISMATCH VALUES OF THE ALLOYS
(a) γ′ extracted from Alloy 10, LSHR, and ME3 specimens solution heat treated 1199 °C for 1.17 h, furnace off cooled
at an average cooling rate of 25 °C/min, then aging heat treated at 855 °C for 4 h followed by 775 °C for 8 h Sample Alloy GP-1x
(Å) GP-2x
(Å) GP-3x
(Å) Mean (Å)
95% conf. interval on mean (Å)
8045-1 Alloy 10 3.59400 3.59400 3.59396 3.59399 0.00006
8045-2 LSHR 3.59559 3.59561 3.59559 3.59560 0.00003
8045-3 ME3 3.59452 3.59452 3.59456 3.59453 0.00005
(b) Mismatch of γ and γ′ lattice parameters within Alloy 10, LSHR, and ME3 after solution heat treatment and water
quenching or very slow furnace ramp cool. Based on comparison of the results for AEQ, LEQ, and MEQ and the results for extracted γ′ in Table 2(a), a1 corresponds to the γ′ phase, and a2 corresponds to the γ phase
Alloy Heat Treatment Sample Fundamental parameters Split-Pearson VII
a1 (Å)
a2 (Å)
δ (%)
a1 (Å)
a2 (Å)
δ (%)
Alloy 10 1199 °C/1 h/quenched 5,000 °C/min to 650 °C AW (M294) 3.59946 3.59904
Alloy 10 1199 °C /1 h/quenched 0.033 °C/min to 870 °C + 0.003 °C/min to 650 °C
AEQ (M291) 3.59592 3.5899 0.16739 3.59592 3.58899 0.19307
LSHR 1199 °C/1 h/quenched 5,000 °C/min to 650 °C LW (M295) 3.59912 3.59871
LSHR 1199 °C /1 h/quenched 0.033 °C/min to 870 °C + 0.003 °C/min to 650 °C
LEQ (M292) 3.59882 3.5904 0.23448 3.59918 3.58959 0.26662
ME3 1199 °C/1 h/quenched 5,000 °C/min to 650 °C MW (M296) 3.59789 3.59764
ME3 1199 °C/1 h/quenched 0.033 °C/min to 870 °C + 0.003 °C/min to 650 °C
MEQ (M293) 3.59709 3.5884 0.24178 3.59736 3.58911 0.22949
NASA/TM—2016-218936 16
TABLE 3.—RESULTS OF DIFFERENTIAL THERMAL ANALYSES (DTA)
(a) The γ′ dissolution, γ′ formation, boride dissolution and boride formation temperatures measured from triple-cycled DTA
of LSHR, ME3, and Alloy 10. The γ′ dissolution temperature is commonly reported as the γ′ solvus temperature, while the boride dissolution is reported as the boride liquation temperature
Alloy temperature rate
initial weight (final weight gain)
Cycle Secondary γ′ dissolution (heating)
°C
Valley between secondary and
primary γ′ dissolution (heating)
°C
γ′ dissolution (heating)
°C
γ′ formation (cooling)
°C
Boride dissolution (heating)
°C
Boride formation (cooling)
°C
LSHR First 1068.0 1084.1 1162.4 1123.6 Out of range ND 10 °C/min Second -------- -------- 1158.7 1124.7 Out of range ND
1516.5 (0.1) mg Third -------- -------- 1158.7 1125.3 Out of range ND Mean ± σ -------- -------- 1159.9 ± 2.1 1124.5 ± 0.9 --- ---
LSHR First 1067.6 1090.7 1154.4 1126.9 1207.6 1175.2 5 °C/min Second -------- -------- 1156.8 1126.8 1201.3 1173.1
1586.5 (0.2) mg Third -------- -------- 1155.8 1126.8 1202.4 1174.8 Mean ± σ -------- -------- 1155.8 ± 1.2 1126.8 ± 0.06 1203.8 ± 3.4 1174.4 ± 1.1
LSHR First 1069.6 1078.8 1151.2 1129.3 1204 1179.6 2 °C/min Second -------- -------- 1154.5 1129.3 1200.5 1177.6
1501.2 (0.7) mg Third -------- -------- 1151.2 1129.1 1201.0 1177.6 Mean ± σ -------- -------- 1152.3 ± 1.3 1129.2 ± 0.12 1201.8 ± 1.9 1178.3 ± 1.1
LSHR, 0 °C/min Extrapolated 1150.7 ± 0.9 1130.1 ± 0.6 ME3 First 1077.4 1100.8 1165.2 1125.9 1212 ND
10 °C/min Second -------- -------- 1162.9 1126.2 1207.2 ND 1530.9 (0.3) mg Third -------- -------- 1163.1 1126.2 1206.8 ND
Mean ± σ -------- -------- 1163.7 ± 1.3 1126.1 ± 0.17 1208.7 ± 2.4 --- ME3 First 1080.3 1096.4 1158.0 1128.3 1208.7 ND
5 °C/min Second -------- -------- 1157.5 1128.3 1204.4 ND 1554.6 (0.2) mg Third -------- -------- 1156.4 1128.4 1204.8 ND
Mean ± σ -------- -------- 1157.3 ± 0.8 1128.3 ± 0.06 1206.0 ± 2.4 --- ME3, 0 °C/min Extrapolated 1153.5 ± 0.9 1131.5 ± 0.3
Alloy 10 First 1089.3 1104.2 1193.8 1166.6 1205.5 ND 10 °C/min Second -------- -------- 1190.8 1166.2 1204.7 ND
1525.1 (0.1) mg Third -------- -------- 1190.6 1166.6 1204.7 ND Mean ± σ -------- -------- 1191.7 ± 1.8 1166.5 ± 0.23 1205.0 ± 0.5 ---
Alloy 10 First 1089.5 1099.2 1193.4 1168.2 1203.9 ND 5 °C/min Second -------- -------- 1192.7 1168.2 1203.2 ND
1552.7 (0.3) mg Third -------- -------- 1191.6 1168.3 1202.5 ND Mean ± σ -------- -------- 1192.6 ± 0.9 1168.2 ± 0.06 1203.2 ± 0.7 --- Alloy 10, 0 °C/min Extrapolated ~1192 1171.7 ± 0.6
(b) The solidus and liquidus temperatures measured from the heating thermograms at 5 °C/min of single-cycled DTA of as-forged LSHR, ME3, and Alloy 10
Alloy Thermal path on heating during DTA analysis Initial weight,
mg
Weight gain, mg
Solidus (heating)
°C
Liquidus (heating)
°C LSHR 25 to 700 °C at 20 °C/min, 700 to 1370 °C at 5 °C/min 683.1 0.4 1240 1334.5 ME3 25 to 1370 °C at 5 °C/min 1390.8 0.5 1264 1339.0 Alloy 10 25 to 1370 °C at 5 °C/min 1396.1 0.7 1257 1339.6
NASA/TM—2016-218936 17
TABLE 4.—SIZES AND AREA FRACTIONS OF Γ′ IN ALLOY 10, LSHR, AND ME3 AFTER DIFFERENT HEAT TREATMENTS
Prepared sample
ID
Alloy Solution quench
Aging temper-ature,
C
Aging Time,
h
Aging quench
Met. mount ID
Inside grain sec. γ′ radius,
avg., μm
Inside grain sec. γ′ radius, StDev,
mm
Inside grain sec. γ′ radius,
count, n
Grain bound. sec. γ′ radius, avg., mm
Grain bound. sec. γ′ radius, StDev,
mm
Grain bound. sec. γ′ radius, count,
n
Overall sec. γ′ area
fraction
Overall tert. γ′ area
fraction
MEQ ME3 Furnace ramp ---- ---- ------- I379,M293 1.916 0.71 49 ------- ------- ----- ------- ~0
LEQ LSHR Furnace ramp ---- ---- ------- I380,M292 2.054 1.086 58 ------- ------- ----- ------- ~0
AEQ Alloy 10 Furnace ramp ---- ---- ------- J023,M291 3.41 0.918 138 ------- ------- ----- ------- ~0
MF ME3 Furnace ---- ---- ------- I877 0.152 0.049 342 0.361 0.147 719 0.536 0.038
LF LSHR Furnace ---- ---- ------- I876 0.162 0.040 306 0.371 0.127 77 0.542 0.054
AF Alloy 10 Furnace ---- ---- ------- I875 0.188 0.073 397 0.427 0.171 724 0.539 ~0
MW ME3 Water ---- ---- ------- I767 0.022 0.004 163 ------- ------- ----- ~0.57 ~0
LW LSHR Water ---- ---- ------- I766 0.014 0.003 153 ------- ------- ----- ~0.57 ~0
AW Alloy 10 Water ---- ---- ------- I765 0.022 0.004 175 ------- ------- ----- ~0.57 ~0
MW760-100 ME3 Water 760 100 Water TEM 0.021 0.006 152 0.022 0.005 13 ~0.57 ~0
LW760-100 LSHR Water 760 100 Water TEM 0.022 0.008 152 0.020 0.007 11 ~0.57 ~0
AW760-100 Alloy 10 Water 760 100 Water TEM 0.027 0.007 150 0.034 0.007 13 ~0.57 ~0
MW760-1k ME3 Water 760 1000 Water TEM 0.029 0.010 104 0.031 0.006 7 ~0.57 ~0
LW760-1k LSHR Water 760 1000 Water TEM 0.031 0.013 110 0.026 0.008 7 ~0.57 ~0
AW760-1k Alloy 10 Water 760 1000 Water TEM 0.031 0.012 102 0.025 0.005 7 ~0.57 ~0
LW843-1k LSHR Water 843 1000 Water TEM 0.115 0.039 153 0.130 0.066 31 ~0.57 ~0
MW843-1k ME3 Water 843 1000 Water TEM 0.116 0.040 167 0.106 0.037 48 ~0.57 ~0
AW843-1k Alloy 10 Water 843 1000 Water TEM 0.11 0.040 151 0.133 0.039 24 ~0.57 ~0
LW843-10 LSHR Water 843 10 Water TEM 0.02 0.007 153 0.025 0.007 10 ~0.57 ~0
MW843-10 ME3 Water 843 10 Water TEM 0.022 0.008 157 0.024 0.006 21 ~0.57 ~0
AW843-10 Alloy 10 Water 843 10 Water TEM 0.023 0.009 152 0.028 0.010 10 ~0.57 ~0
LW843-100 LSHR Water 843 100 Water TEM 0.051 0.018 158 0.064 0.023 14 ~0.57 ~0
MW843-100 ME3 Water 843 100 Water TEM 0.052 0.021 159 0.058 0.019 36 ~0.57 ~0
AW843-100 Alloy 10 Water 843 100 Water TEM 0.058 0.022 151 0.073 0.023 15 ~0.57 ~0
MW927-10 ME3 Water 927 10 Water TEM 0.063 0.017 156 0.074 0.023 13 ------- ~0
LW927-10 LSHR Water 927 10 Water TEM 0.060 0.019 155 0.079 0.019 17 ------- ~0
AW927-10 Alloy 10 Water 927 10 Water TEM 0.073 0.027 158 0.099 0.038 12 ------- ~0
MW927-99 ME3 Water 927 99 Water TEM 0.149 0.047 159 0.155 0.047 10 ------- ~0
LW927-99 LSHR Water 927 99 Water TEM 0.142 0.054 157 0.156 0.053 20 ------- ~0
AW927-99 Alloy 10 Water 927 99 Water TEM 0.144 0.046 160 0.141 0.045 16 ------- ~0
MW927-1k ME3 Water 927 1000 Water I850 0.238 0.072 365 0.324 0.071 100 0.398 ~0
LW927-1k LSHR Water 927 1000 Water I852 0.23 0.073 410 0.274 0.063 100 0.383 ~0
AW927-1k Alloy 10 Water 927 1000 Water I851 0.264 0.073 394 0.306 0.080 100 0.394 ~0
MW1093-5 ME3 Water 1093 5 Water K202 0.149 0.045 368 0.206 0.071 165 0.26 ~0
LW1093-5 LSHR Water 1093 5 Water K201 0.156 0.040 347 0.223 0.066 121 0.29 ~0
AW1093-5 Alloy 10 Water 1093 5 Water K200 0.153 0.040 336 0.243 0.094 213 0.41 ~0
MW1093-20 ME3 Water 1093 20.1 Water I847 0.255 0.074 514 0.405 0.133 615 0.184 ~0
LW1093-20 LSHR Water 1093 20.1 Water I849 0.252 0.064 1879 0.492 0.161 334 0.189 ~0
AW1093-20 Alloy 10 Water 1093 20.1 Water I848 0.273 0.086 723 0.542 0.244 659 0.322 ~0
MW1093-100 ME3 Water 1093 100 Water K205 0.369 0.115 307 0.675 0.278 353 0.27 ~0
LW1093-100 LSHR Water 1093 100 Water K204 0.360 0.106 325 0.662 0.293 299 0.28 ~0
AW1093-100 Alloy 10 Water 1093 100 Water K203 0.404 0.145 322 0.783 0.330 384 0.4 ~0
MW1093-1k ME3 Water 1093 1000 Water I764 0.69 0.284 285 1.42 0.543 192 0.224 ~0
LW1093-1k LSHR Water 1093 1000 Water I769 0.7 0.282 652 1.498 0.716 164 0.205 ~0
AW1093-1k Alloy 10 Water 1093 1000 Water I768 0.447 0.202 636 1.309 0.690 236 0.361 ~0
NASA/TM—2016-218936 18
TABLE 5.—COMPOSITIONS OF EXTRACTED γ′ AND γ, AND ASSOCIATED γ PARTITIONING RATIOS FOR ALLOY 10, LSHR, AND ME3
Alloy 10 LSHR ME3 γ γ ' γ
partitioning ratio
γ γ ' γ partitioning
ratio
γ γ ' γ partitioning
ratio wt% at.% wt% at.% wt% at.% wt% at.% wt% at.% wt% at.%
Al 0.90 2.00 5.65 12.11 0.17 0.95 2.08 5.64 12.00 0.17 0.96 2.09 5.74 12.10 0.17 Co 25.09 25.43 8.20 8.05 3.16 31.99 32.16 11.44 11.15 2.88 31.08 31.00 10.43 10.07 3.08 Cr 23.50 26.99 1.89 2.10 12.84 24.90 28.37 1.91 2.12 13.41 24.16 27.31 1.84 2.01 13.60 Fe 0.05 0.05 0.02 0.02 2.35 0.10 0.10 0.02 0.02 4.19 0.07 0.07 0.01 0.02 4.90 Mo 4.43 2.76 1.53 0.92 2.99 4.36 2.69 1.24 0.74 3.63 6.31 3.86 1.42 0.84 4.58 Nb 0.19 0.12 2.95 1.84 0.07 0.24 0.15 2.60 1.61 0.10 0.18 0.11 1.58 0.97 0.12 Si 0.00 0.00 0.03 0.06 0.00 0.00 0.00 0.04 0.09 0.00 0.00 0.00 0.05 0.11 0.00 Ta 0.03 0.01 1.42 0.45 0.02 0.09 0.03 3.01 0.95 0.03 0.15 0.05 4.53 1.42 0.03 Ti 0.22 0.27 6.34 7.65 0.04 0.34 0.43 6.54 7.85 0.05 0.41 0.50 6.96 8.27 0.06 W 5.74 1.87 6.06 1.91 0.98 4.77 1.54 3.96 1.24 1.24 2.45 0.78 1.67 0.52 1.52 Zr 0.00 0.00 0.15 0.09 0.01 0.00 0.00 0.09 0.05 0.01 0.00 0.00 0.08 0.05 0.01 Ni 39.85 40.55 65.75 64.78 0.63 32.26 32.56 63.50 62.13 0.52 34.24 34.28 65.66 63.60 0.54
TABLE 6.—CALCULATED ACTIVATION ENERGIES FOR γ′ COARSENING IN ALLOY 10, LSHR, AND ME3
(a) Results for γ′ coarsening with data at 1093 °C included.
Alloy ln k versus 1/T slopes for activation energy Within grains Coefficient of
determination Grain boundaries Coefficient of
determination Alloy 10 –35132 0.898 –48940 0.983 LSHR –39557 0.979 –48922 0.992 ME3 –41144 0.964 –51403 0.993
Alloy Q (kJ/mole) = –(Slope*8.314) Within grains -------- Grain boundaries
Alloy 10 292 -------- 407 LSHR 329 -------- 407 ME3 342 -------- 427
(b) Results for γ′ coarsening with data at 1093 °C omitted, due to loss of coherency at that temperature.
Alloy ln k versus 1/T slopes for activation energy Within grains Coefficient of
determination Grain boundaries Coefficient of
determination Alloy 10 –52443 0.989 –55938 0.978 LSHR –46024 0.977 –50011 0.977 ME3 –50696 0.97 –57588 0.999
Alloy Q (kJ/mole) = –(Slope*8.314) Within grains -------- Grain boundaries
Alloy 10 436 -------- 465 LSHR 383 -------- 416 Alloy 10 421 -------- 479
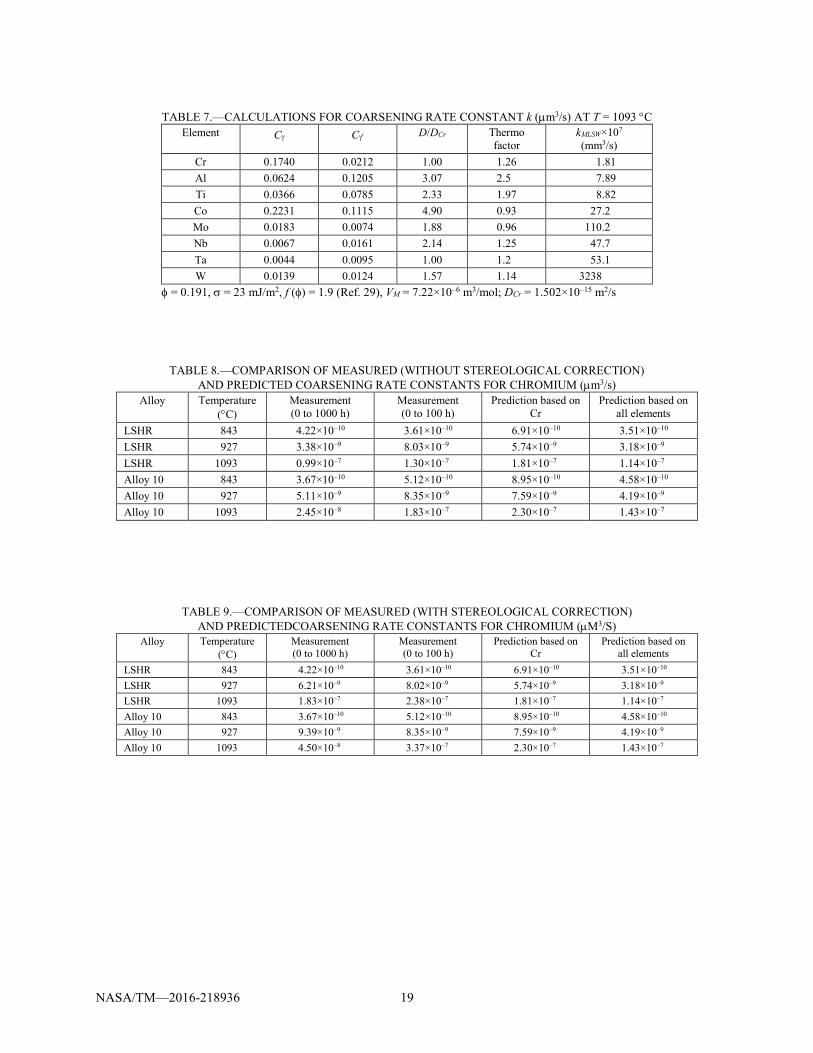
NASA/TM—2016-218936 19
TABLE 7.—CALCULATIONS FOR COARSENING RATE CONSTANT k (µm3/s) AT T = 1093 °C
Element Cγ Cγ′ D/DCr Thermo factor
kMLSW×107
(mm3/s) Cr 0.1740 0.0212 1.00 1.26 1.81 Al 0.0624 0.1205 3.07 2.5 7.89 Ti 0.0366 0.0785 2.33 1.97 8.82 Co 0.2231 0.1115 4.90 0.93 27.2 Mo 0.0183 0.0074 1.88 0.96 110.2 Nb 0.0067 0.0161 2.14 1.25 47.7 Ta 0.0044 0.0095 1.00 1.2 53.1 W 0.0139 0.0124 1.57 1.14 3238
φ = 0.191, σ = 23 mJ/m2, f (φ) = 1.9 (Ref. 29), VM = 7.22×10⁻⁶ m3/mol; DCr = 1.502×10⁻¹⁵ m2/s
TABLE 8.—COMPARISON OF MEASURED (WITHOUT STEREOLOGICAL CORRECTION) AND PREDICTED COARSENING RATE CONSTANTS FOR CHROMIUM (µm3/s)
Alloy Temperature (°C)
Measurement (0 to 1000 h)
Measurement (0 to 100 h)
Prediction based on Cr
Prediction based on all elements
LSHR 843 4.22×10⁻¹⁰ 3.61×10⁻¹⁰ 6.91×10⁻¹⁰ 3.51×10⁻¹⁰ LSHR 927 3.38×10⁻⁹ 8.03×10⁻⁹ 5.74×10⁻⁹ 3.18×10⁻⁹ LSHR 1093 0.99×10⁻⁷ 1.30×10⁻⁷ 1.81×10⁻⁷ 1.14×10⁻⁷ Alloy 10 843 3.67×10⁻¹⁰ 5.12×10⁻¹⁰ 8.95×10⁻¹⁰ 4.58×10⁻¹⁰ Alloy 10 927 5.11×10⁻⁹ 8.35×10⁻⁹ 7.59×10⁻⁹ 4.19×10⁻⁹ Alloy 10 1093 2.45×10⁻⁸ 1.83×10⁻⁷ 2.30×10⁻⁷ 1.43×10⁻⁷
TABLE 9.—COMPARISON OF MEASURED (WITH STEREOLOGICAL CORRECTION) AND PREDICTEDCOARSENING RATE CONSTANTS FOR CHROMIUM (µM3/S)
Alloy Temperature (°C)
Measurement (0 to 1000 h)
Measurement (0 to 100 h)
Prediction based on Cr
Prediction based on all elements
LSHR 843 4.22×10⁻¹⁰ 3.61×10⁻¹⁰ 6.91×10⁻¹⁰ 3.51×10⁻¹⁰ LSHR 927 6.21×10⁻⁹ 8.02×10⁻⁹ 5.74×10⁻⁹ 3.18×10⁻⁹ LSHR 1093 1.83×10⁻⁷ 2.38×10⁻⁷ 1.81×10⁻⁷ 1.14×10⁻⁷ Alloy 10 843 3.67×10⁻¹⁰ 5.12×10⁻¹⁰ 8.95×10⁻¹⁰ 4.58×10⁻¹⁰ Alloy 10 927 9.39×10⁻⁹ 8.35×10⁻⁹ 7.59×10⁻⁹ 4.19×10⁻⁹ Alloy 10 1093 4.50×10⁻⁸ 3.37×10⁻⁷ 2.30×10⁻⁷ 1.43×10⁻⁷
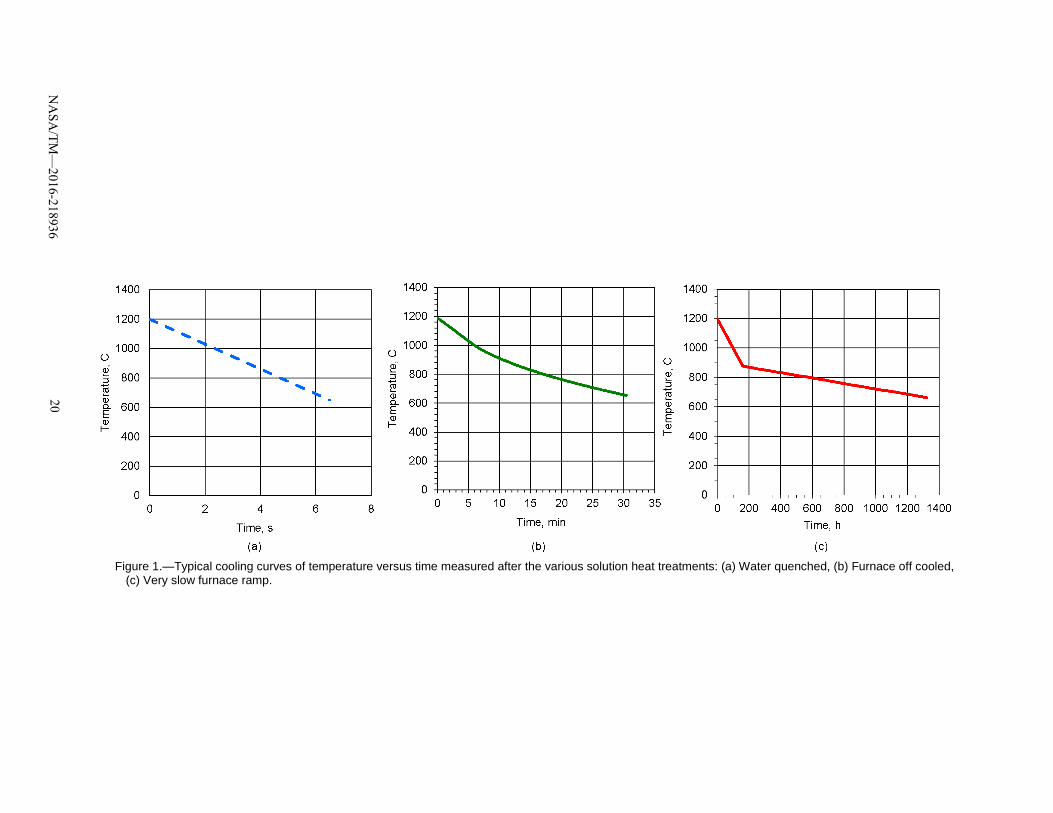
Figure 1.—Typical cooling curves of temperature versus time measured after the various solution heat treatments: (a) Water quenched, (b) Furnace off cooled,
(c) Very slow furnace ramp.
NA
SA/TM
—2016-218936
20
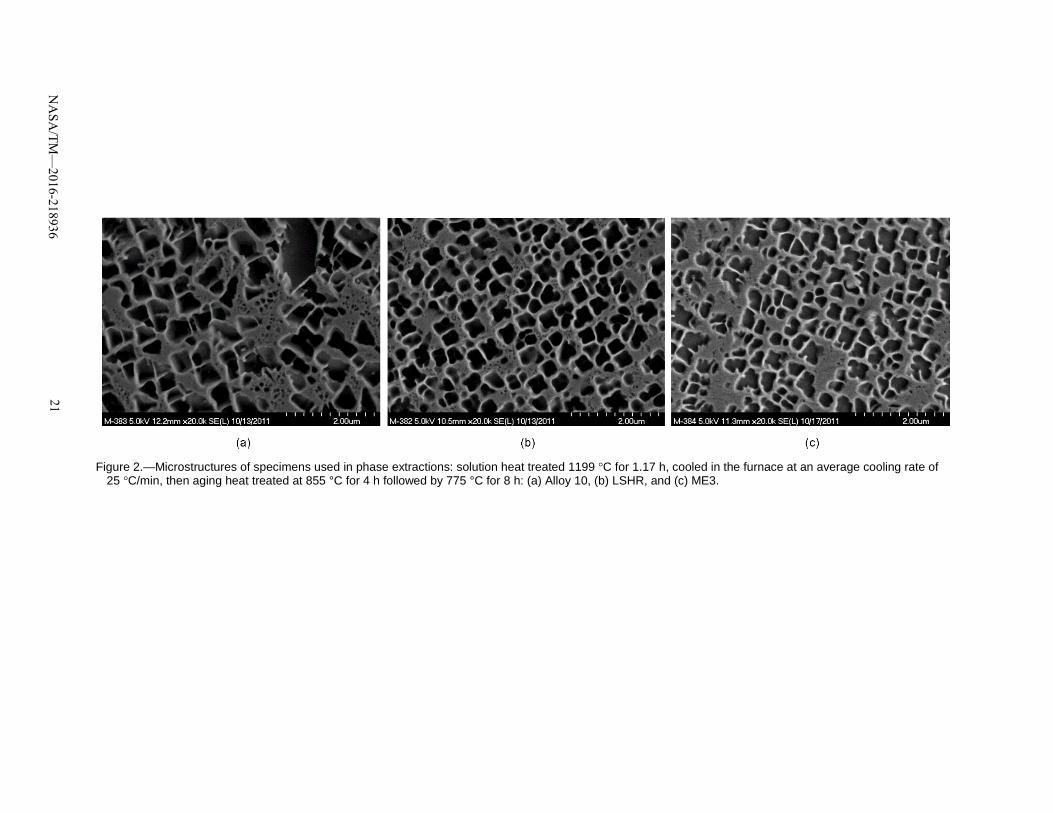
Figure 2.—Microstructures of specimens used in phase extractions: solution heat treated 1199 °C for 1.17 h, cooled in the furnace at an average cooling rate of
25 °C/min, then aging heat treated at 855 °C for 4 h followed by 775 °C for 8 h: (a) Alloy 10, (b) LSHR, and (c) ME3.
NA
SA/TM
—2016-218936
21
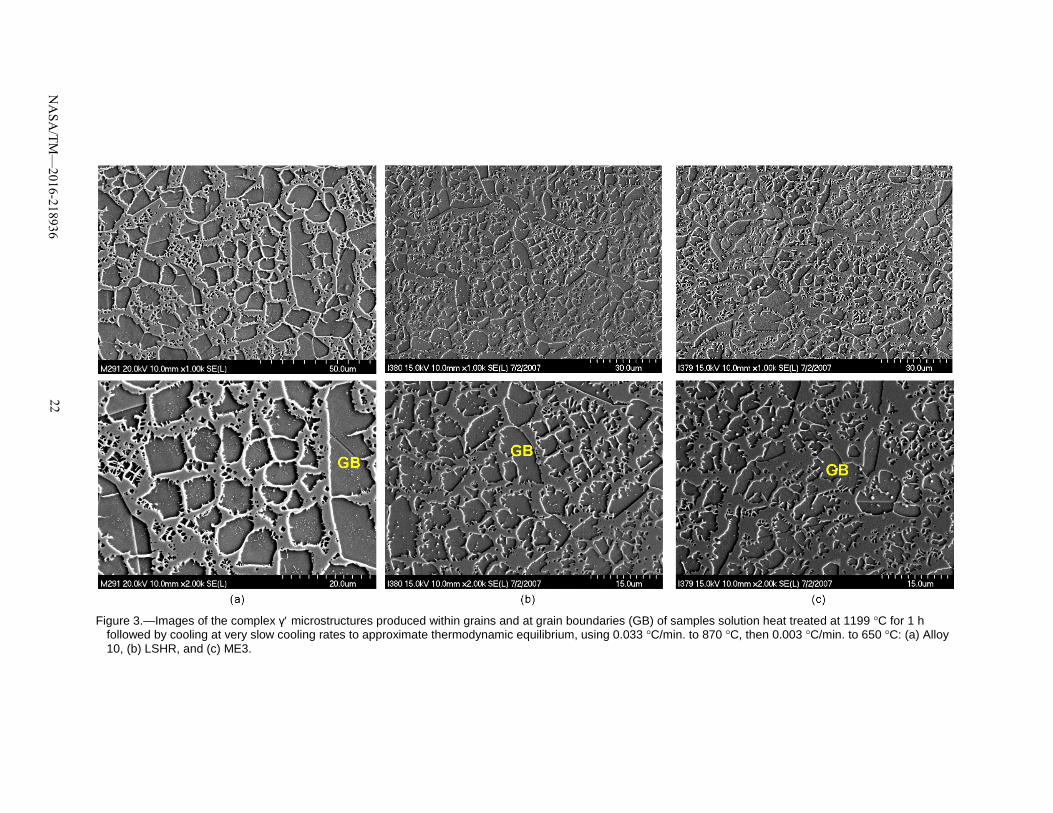
Figure 3.—Images of the complex γ′ microstructures produced within grains and at grain boundaries (GB) of samples solution heat treated at 1199 °C for 1 h
followed by cooling at very slow cooling rates to approximate thermodynamic equilibrium, using 0.033 °C/min. to 870 °C, then 0.003 °C/min. to 650 °C: (a) Alloy 10, (b) LSHR, and (c) ME3.
NA
SA/TM
—2016-218936
22
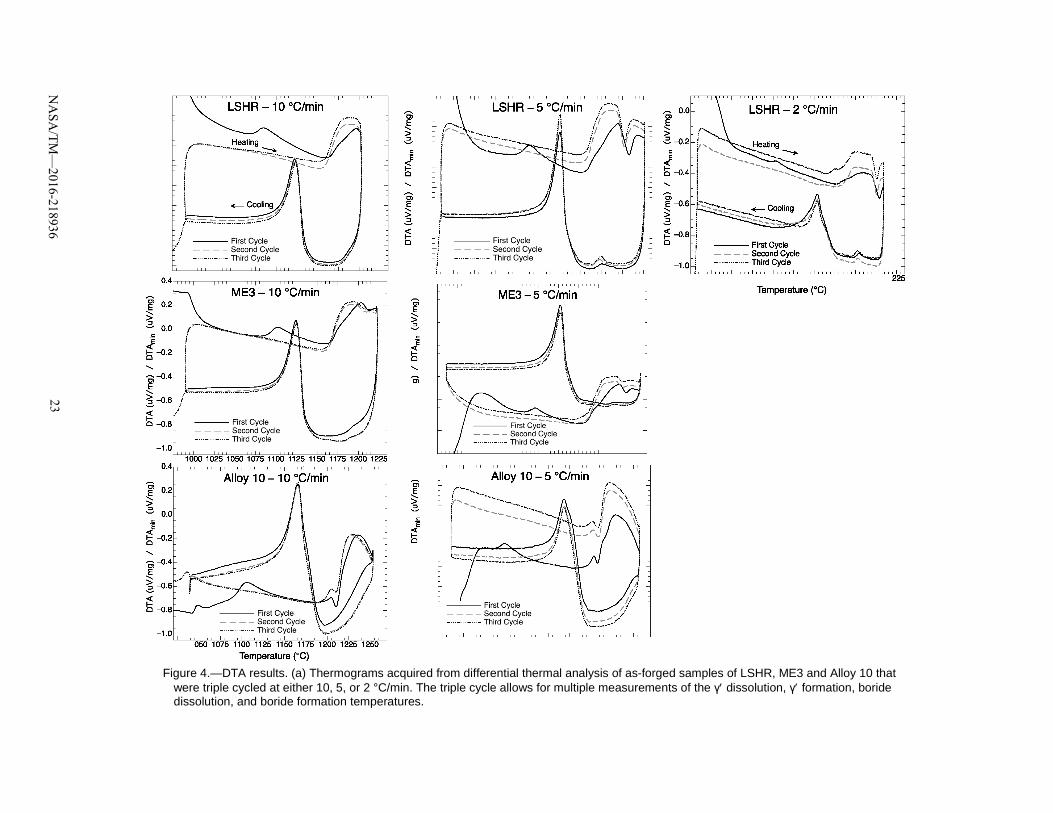
Figure 4.—DTA results. (a) Thermograms acquired from differential thermal analysis of as-forged samples of LSHR, ME3 and Alloy 10 that
were triple cycled at either 10, 5, or 2 °C/min. The triple cycle allows for multiple measurements of the γ′ dissolution, γ′ formation, boride dissolution, and boride formation temperatures.
NA
SA/TM
—2016-218936
23
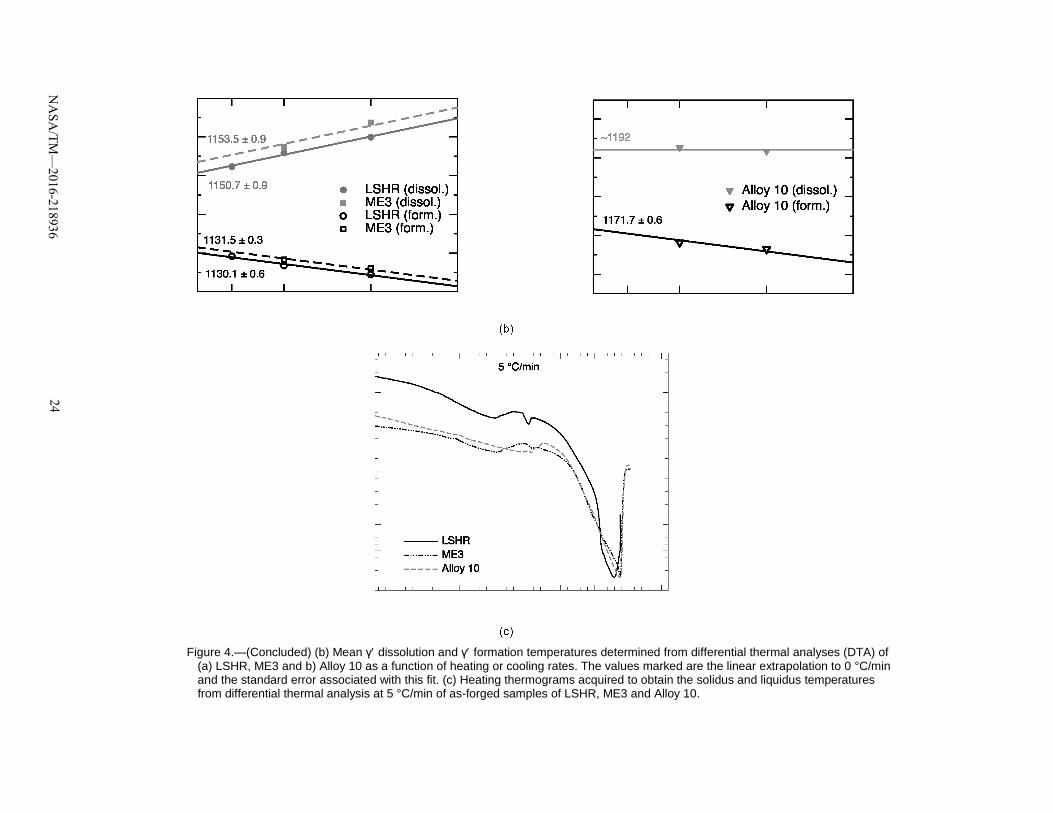
Figure 4.—(Concluded) (b) Mean γ′ dissolution and γ′ formation temperatures determined from differential thermal analyses (DTA) of
(a) LSHR, ME3 and b) Alloy 10 as a function of heating or cooling rates. The values marked are the linear extrapolation to 0 °C/min and the standard error associated with this fit. (c) Heating thermograms acquired to obtain the solidus and liquidus temperatures from differential thermal analysis at 5 °C/min of as-forged samples of LSHR, ME3 and Alloy 10.
NA
SA/TM
—2016-218936
24
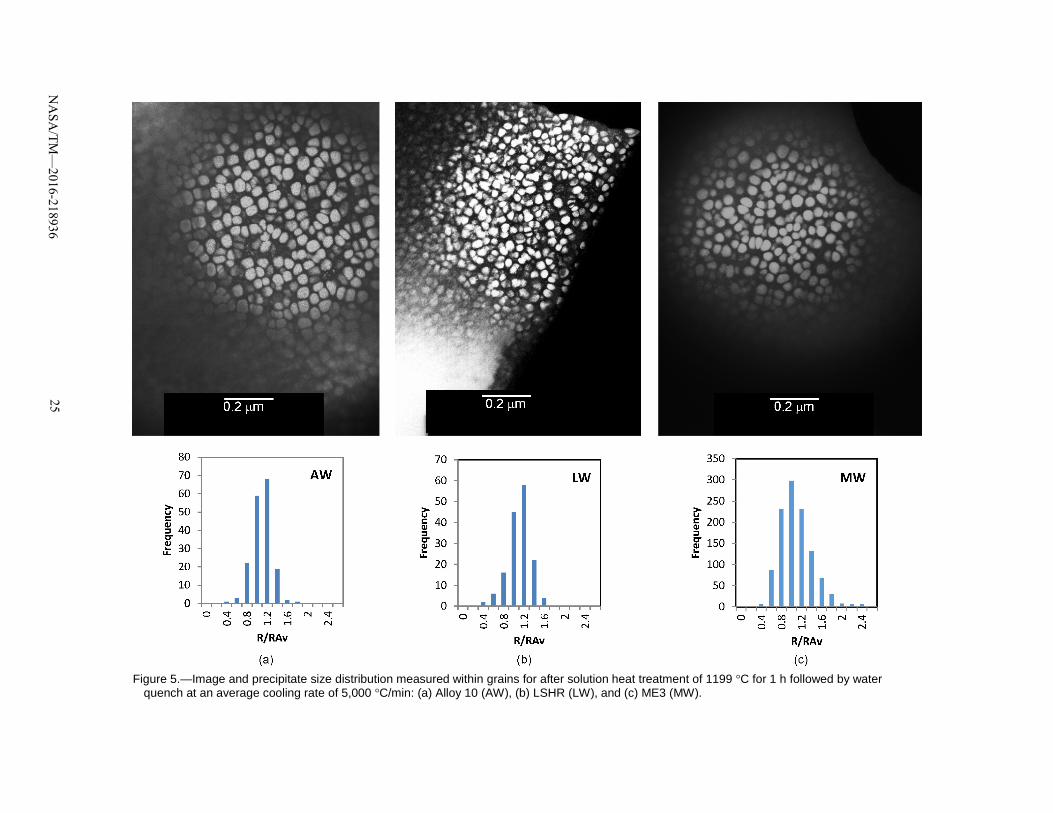
Figure 5.—Image and precipitate size distribution measured within grains for after solution heat treatment of 1199 °C for 1 h followed by water
quench at an average cooling rate of 5,000 °C/min: (a) Alloy 10 (AW), (b) LSHR (LW), and (c) ME3 (MW).
NA
SA/TM
—2016-218936
25
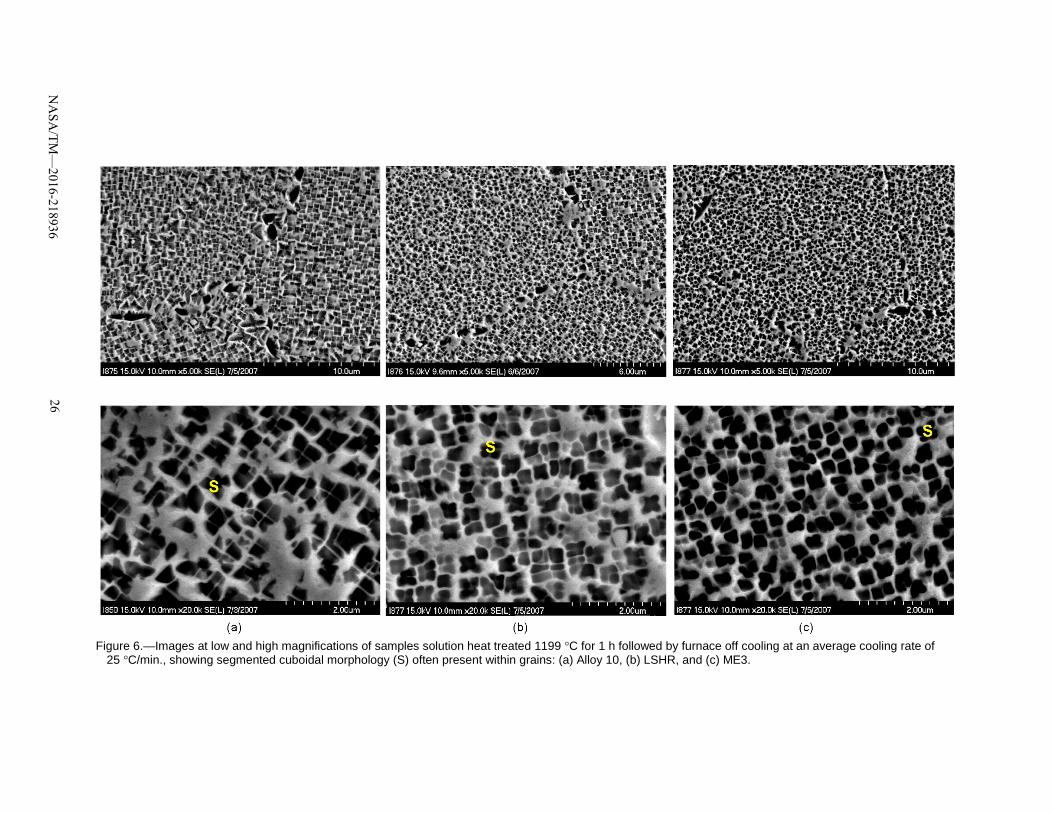
Figure 6.—Images at low and high magnifications of samples solution heat treated 1199 °C for 1 h followed by furnace off cooling at an average cooling rate of
25 °C/min., showing segmented cuboidal morphology (S) often present within grains: (a) Alloy 10, (b) LSHR, and (c) ME3.
NA
SA/TM
—2016-218936
26
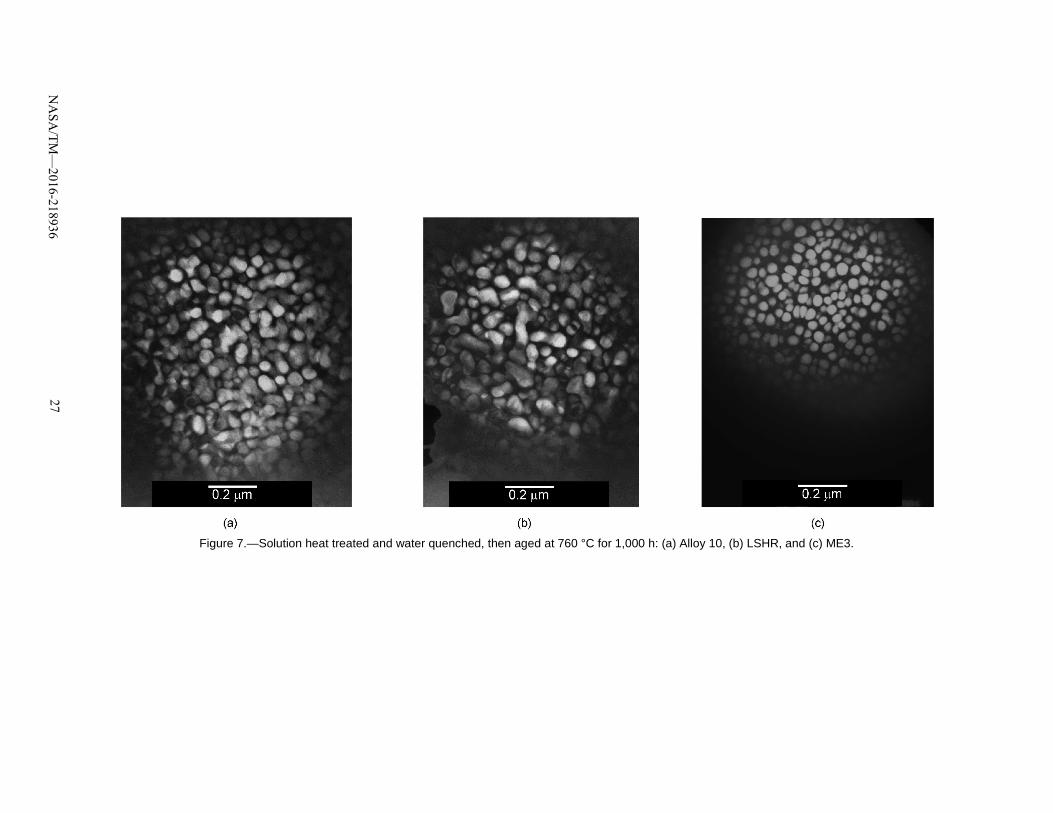
Figure 7.—Solution heat treated and water quenched, then aged at 760 °C for 1,000 h: (a) Alloy 10, (b) LSHR, and (c) ME3.
NA
SA/TM
—2016-218936
27
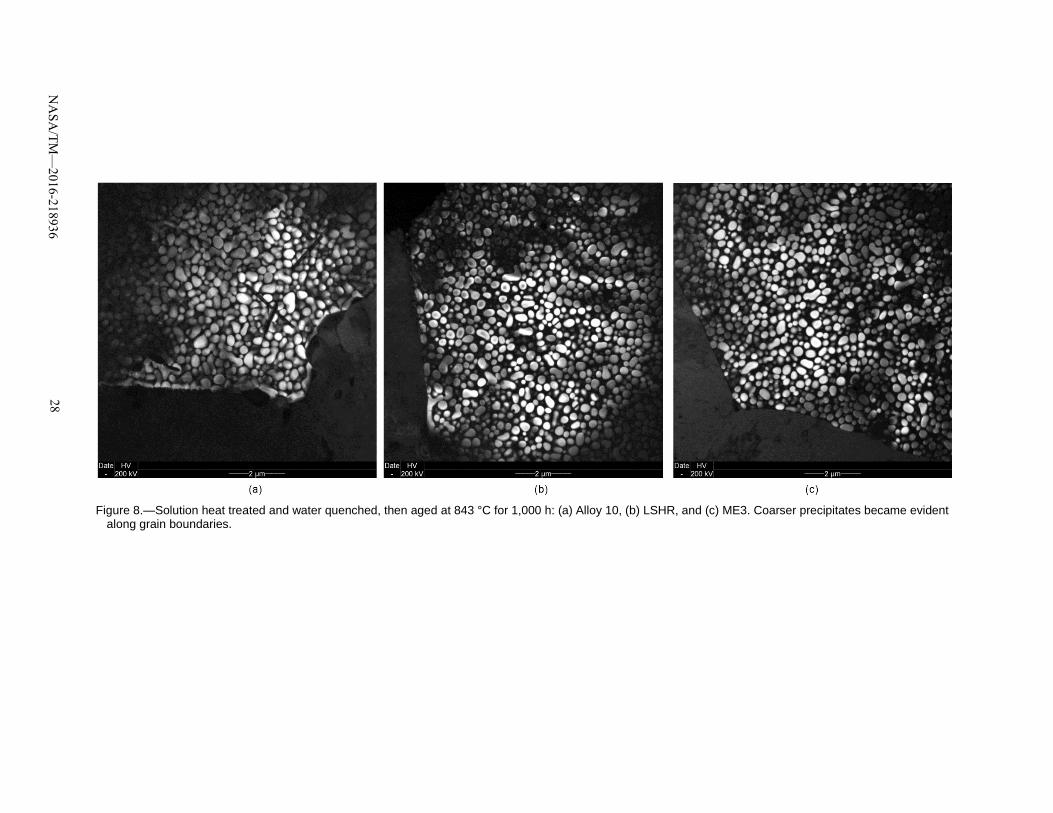
Figure 8.—Solution heat treated and water quenched, then aged at 843 °C for 1,000 h: (a) Alloy 10, (b) LSHR, and (c) ME3. Coarser precipitates became evident
along grain boundaries.
NA
SA/TM
—2016-218936
28
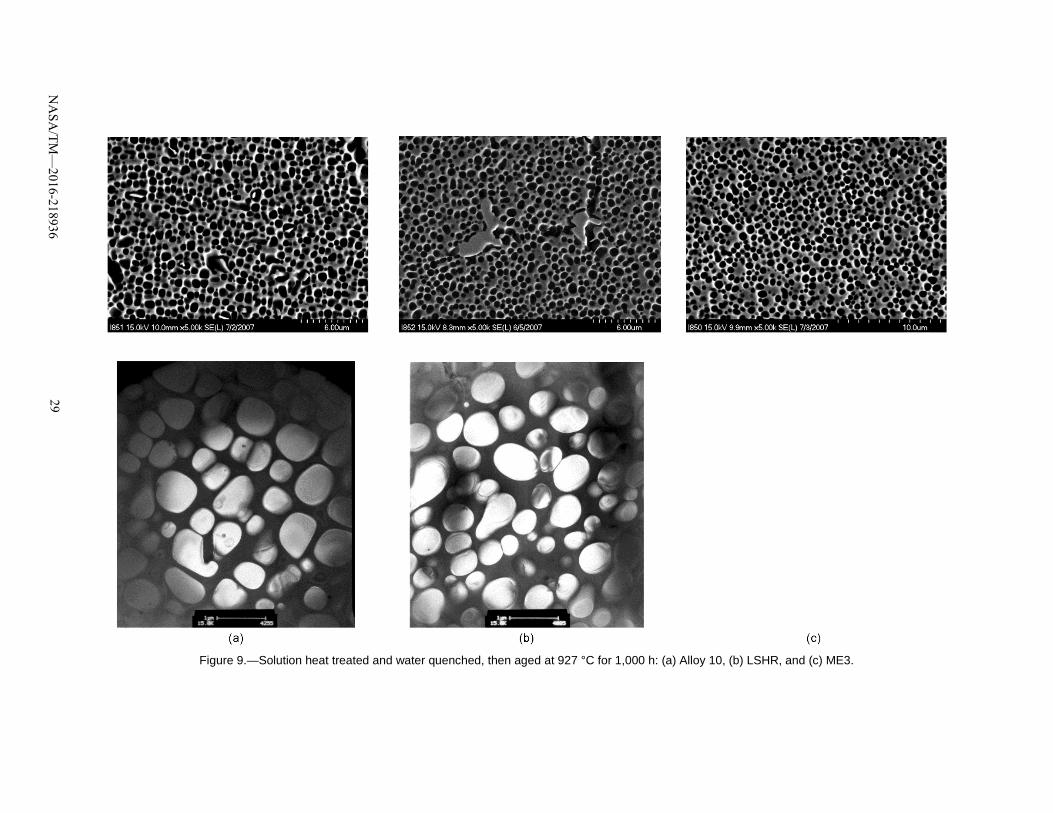
Figure 9.—Solution heat treated and water quenched, then aged at 927 °C for 1,000 h: (a) Alloy 10, (b) LSHR, and (c) ME3.
NA
SA/TM
—2016-218936
29
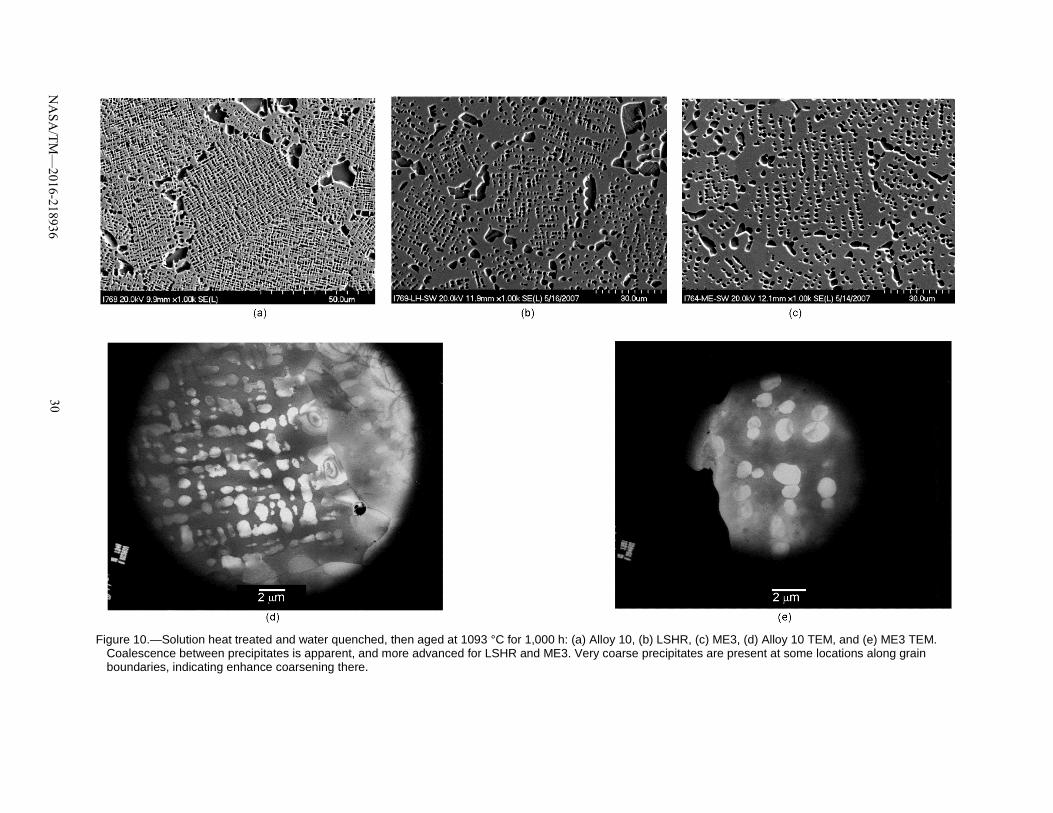
Figure 10.—Solution heat treated and water quenched, then aged at 1093 °C for 1,000 h: (a) Alloy 10, (b) LSHR, (c) ME3, (d) Alloy 10 TEM, and (e) ME3 TEM.
Coalescence between precipitates is apparent, and more advanced for LSHR and ME3. Very coarse precipitates are present at some locations along grain boundaries, indicating enhance coarsening there.
NA
SA/TM
—2016-218936
30
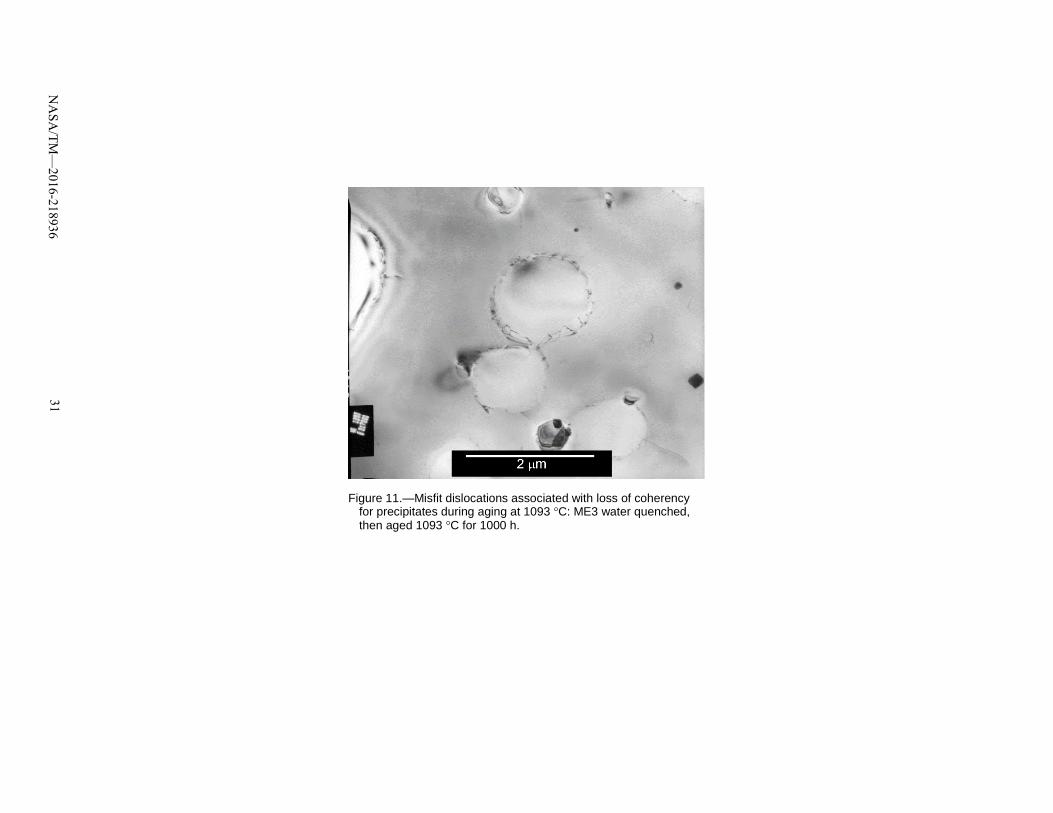
Figure 11.—Misfit dislocations associated with loss of coherency
for precipitates during aging at 1093 °C: ME3 water quenched, then aged 1093 °C for 1000 h.
NA
SA/TM
—2016-218936
31
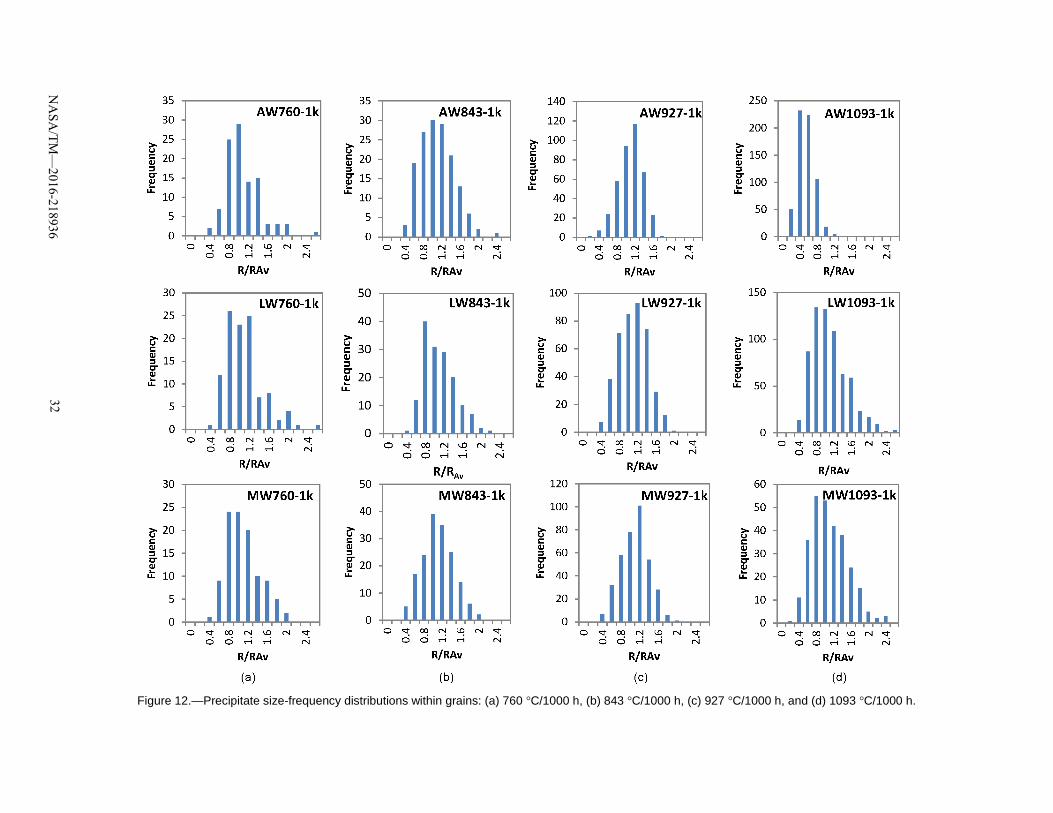
Figure 12.—Precipitate size-frequency distributions within grains: (a) 760 °C/1000 h, (b) 843 °C/1000 h, (c) 927 °C/1000 h, and (d) 1093 °C/1000 h.
NA
SA/TM
—2016-218936
32
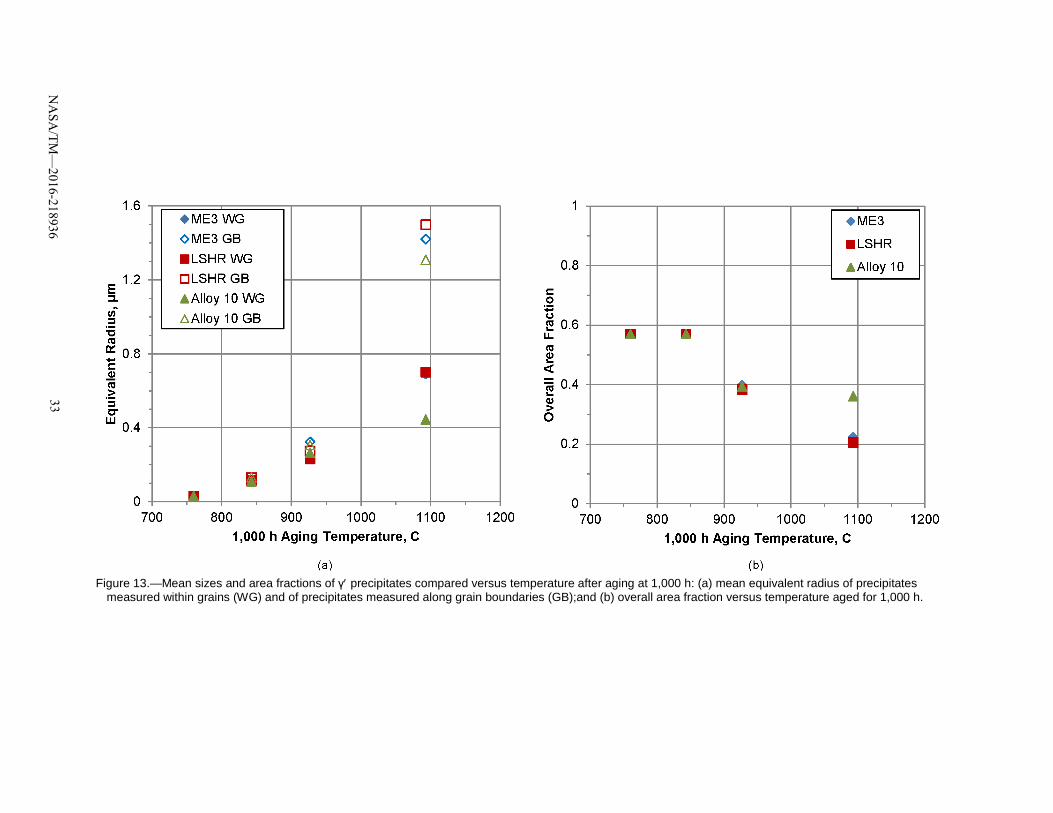
Figure 13.—Mean sizes and area fractions of γ′ precipitates compared versus temperature after aging at 1,000 h: (a) mean equivalent radius of precipitates
measured within grains (WG) and of precipitates measured along grain boundaries (GB);and (b) overall area fraction versus temperature aged for 1,000 h.
NA
SA/TM
—2016-218936
33
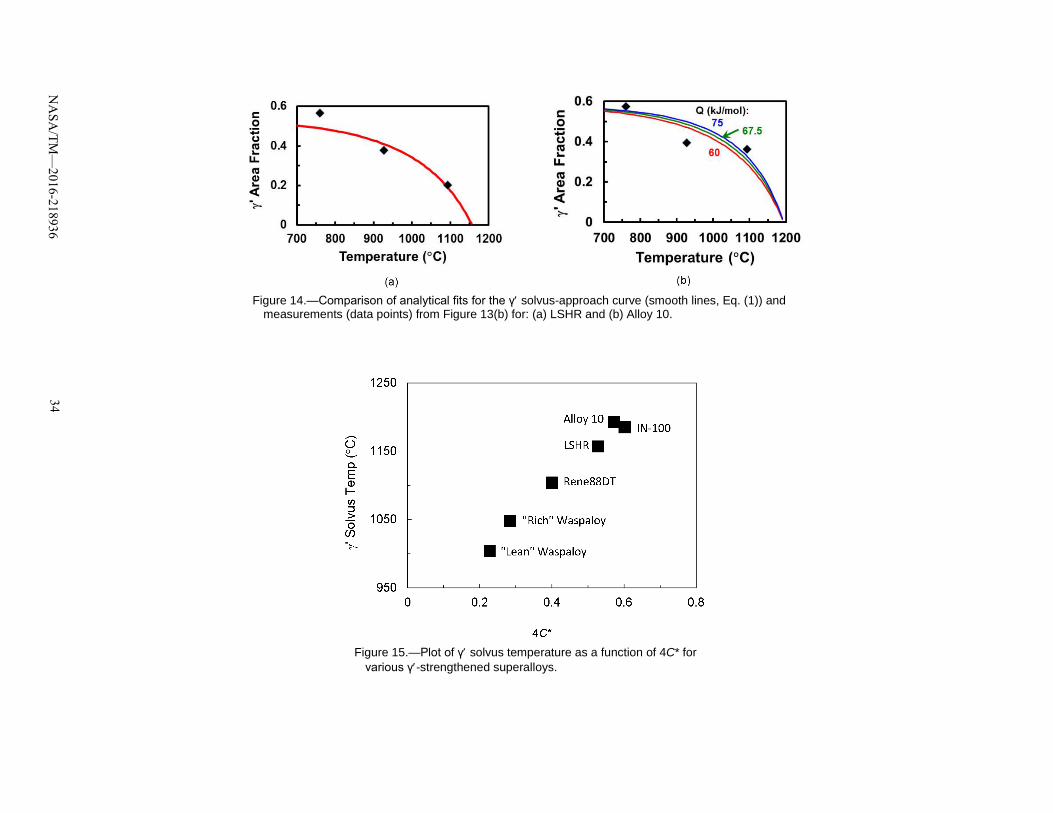
Figure 14.—Comparison of analytical fits for the γ′ solvus-approach curve (smooth lines, Eq. (1)) and
measurements (data points) from Figure 13(b) for: (a) LSHR and (b) Alloy 10.
Figure 15.—Plot of γ′ solvus temperature as a function of 4C* for
various γ′-strengthened superalloys.
NA
SA/TM
—2016-218936
34
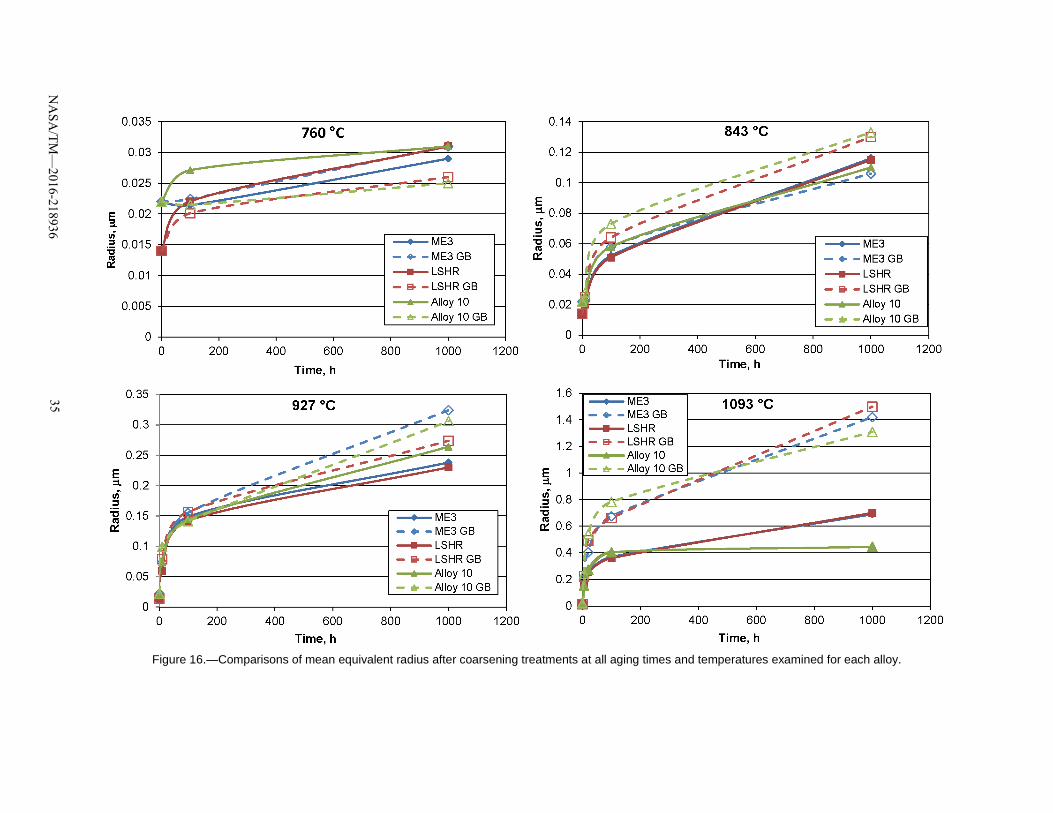
Figure 16.—Comparisons of mean equivalent radius after coarsening treatments at all aging times and temperatures examined for each alloy.
NA
SA/TM
—2016-218936
35
NA
SA/TM
—2016-218936
36
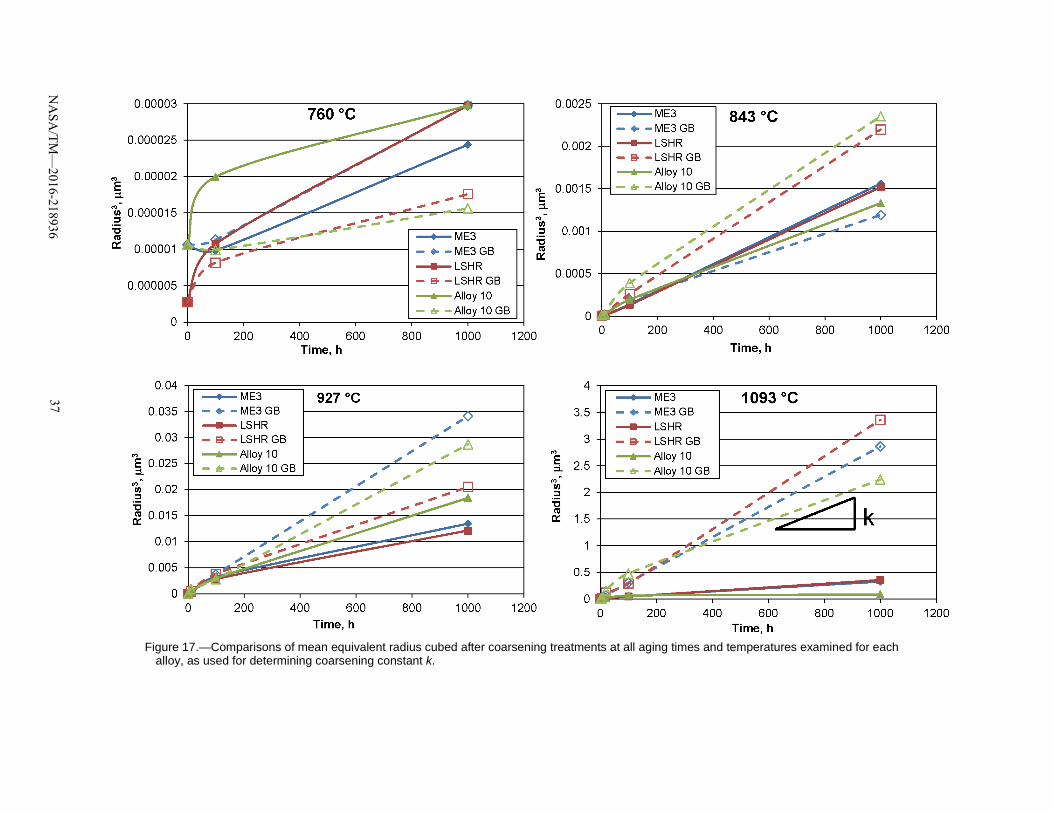
Figure 17.—Comparisons of mean equivalent radius cubed after coarsening treatments at all aging times and temperatures examined for each
alloy, as used for determining coarsening constant k.
NA
SA/TM
—2016-218936
37
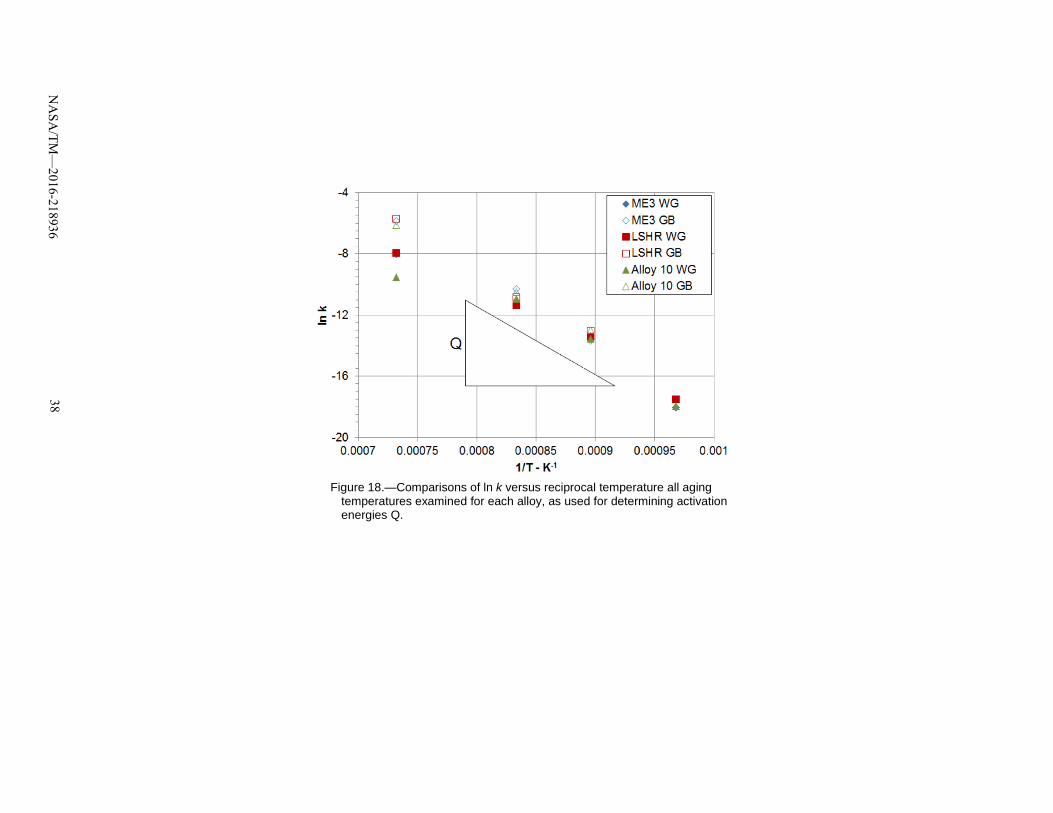
Figure 18.—Comparisons of ln k versus reciprocal temperature all aging
temperatures examined for each alloy, as used for determining activation energies Q.
NA
SA/TM
—2016-218936
38


![Structure and function of a lignostilbene-α,β-dioxygenase ...most recently, an SCO from Novosphingobium aromatici-vorans,(NOV1;PDB:5J53)[13] have been reported. Des-pite varied amino](https://static.fdocument.org/doc/165x107/5e38f6f9c82bed43cc3255fe/structure-and-function-of-a-lignostilbene-dioxygenase-most-recently-an.jpg)


![Diet is a chimera - Cook inc. · 2020. 4. 24. · Diet, noun. [from lat. diaeta, gr. δίαιτα] «a way of life». Variable, varied and more or less balanced ... everyone follows](https://static.fdocument.org/doc/165x107/613a6c480051793c8c0108be/diet-is-a-chimera-cook-inc-2020-4-24-diet-noun-from-lat-diaeta-gr.jpg)