University of Groningen Form, formation, and deformation ... · Microcrystalline cellulose (MCC),...
17
University of Groningen Form, formation, and deformation Bouwman, Anneke Margriet IMPORTANT NOTE: You are advised to consult the publisher's version (publisher's PDF) if you wish to cite from it. Please check the document version below. Document Version Publisher's PDF, also known as Version of record Publication date: 2005 Link to publication in University of Groningen/UMCG research database Citation for published version (APA): Bouwman, A. M. (2005). Form, formation, and deformation: the influence of material properties and process conditions on the shape of granules produced by high shear granulation s.n. Copyright Other than for strictly personal use, it is not permitted to download or to forward/distribute the text or part of it without the consent of the author(s) and/or copyright holder(s), unless the work is under an open content license (like Creative Commons). Take-down policy If you believe that this document breaches copyright please contact us providing details, and we will remove access to the work immediately and investigate your claim. Downloaded from the University of Groningen/UMCG research database (Pure): http://www.rug.nl/research/portal. For technical reasons the number of authors shown on this cover page is limited to 10 maximum. Download date: 05-06-2018
Transcript of University of Groningen Form, formation, and deformation ... · Microcrystalline cellulose (MCC),...

University of Groningen
Form, formation, and deformationBouwman, Anneke Margriet
IMPORTANT NOTE: You are advised to consult the publisher's version (publisher's PDF) if you wish to cite fromit. Please check the document version below.
Document VersionPublisher's PDF, also known as Version of record
Publication date:2005
Link to publication in University of Groningen/UMCG research database
Citation for published version (APA):Bouwman, A. M. (2005). Form, formation, and deformation: the influence of material properties and processconditions on the shape of granules produced by high shear granulation s.n.
CopyrightOther than for strictly personal use, it is not permitted to download or to forward/distribute the text or part of it without the consent of theauthor(s) and/or copyright holder(s), unless the work is under an open content license (like Creative Commons).
Take-down policyIf you believe that this document breaches copyright please contact us providing details, and we will remove access to the work immediatelyand investigate your claim.
Downloaded from the University of Groningen/UMCG research database (Pure): http://www.rug.nl/research/portal. For technical reasons thenumber of authors shown on this cover page is limited to 10 maximum.
Download date: 05-06-2018
Chapter 6 The use of Stokes deformation number as a predictive tool for material exchange behaviour of granules in the ’equilibrium phase’ in high shear granulation
6.1 Summary The objective of this study was threefold; to investigate the different mechanisms of material exchange during the equilibrium phase of the granulation process and whether these mechanisms are consistent with the mechanisms described in the growth regime map, to study how material properties and process conditions affect these exchange mechanisms, and to correlate Stokes deformation number to the exchange mechanisms.
Microcrystalline cellulose (MCC), α-lactose, microfine cellulose (MFC), and dextrin were granulated using water as a binding agent. Once in the equilibrium phase, 5% (w/w) of the granular mass was replaced with wet tracer granules, after which the granulation process was continued.
Tracer experiments show indeed solid material exchange can take place in the equilibrium phase of the high shear granulation process. Tracer material was equally dispersed throughout the whole batch for all materials tested. However, the granulation time needed to reach this homogeneous distribution varied with material and granulation conditions. Three different mechanisms of material exchange were identified; exchange by disintegration, where granules are rapidly crushed and formed to granules again, exchange by deformation, where abraded granule fragments immediately fuse with other granules, and exchange by distribution, where there is a prolonged period over which both tracer and standard granules stay intact, followed by uncontrolled growth and exchange of material. It was found that it is possible to shift between the mechanisms by changing the process conditions, e.g., changing viscosity or amount of binder liquid. These observations indicate that by choosing the appropriate process conditions improved distribution of small amounts of insoluble materials in the granules can be obtained.

Chapter 6
88
A relation exists between the exchange mechanisms and the growth regime map: The disintegration mechanism resembles ‘crumb behaviour’, the deformation mechanism resembles ‘steady growth’, and the distribution mechanism resembles ‘nucleation’ and ‘induction growth’. Unfortunately, Stokes deformation number cannot be used as a predictive tool when low viscosity binders like water are used, due to the importance of viscosity in the equation. However, this number is one of the variables of the growth regime map. Since the exchange mechanisms correspond to the granule growth mechanisms in the regime map, alternatively colour experiments might be used to reveal the granulation regime.

The use of Stokes deformation number as a predictive tool for material exchange behaviour of granules in the ’equilibrium phase’ in high shear granulation
89
6.2 Introduction
6.2.1 Granulation High shear granulation is a technique used in many different industries to obtain dense, spherical granules. Although this technique has been used for several decades, the process is still not completely understood. This understanding is nonetheless a requirement to guarantee product quality (e.g. homogeneity, size distribution or sphericity) and batch-to-batch reproducibility.
The high shear granulation process can be described in different stages. The first stage is wetting and nucleation, followed by consolidation and coalescence, and finally attrition and breakage [1, 2].
During nucleation wetted particles stick together to form primary nuclei. Subsequently consolidation and coalescence occur; nuclei are swept through the bowl and collide with each other, resulting in coalescence. The impacts of the impeller also force the granules to densify. This densification pushes liquid to the granule surface. When enough binder liquid is present at the surface, further growth by coalescence can occur, called steady growth [2], or layering of fine material around the granule surface can occur, called induction growth, after which coalescence will occur [3]. Upon collision, particle rearrangement may occur resulting in the formation of a sphere. At the end of the coalescence regime, crushing and layering will be the predominant process. The last stage is now reached: granules become too large to withstand the high shear forces. Breakage and attrition takes place, the broken pieces can be layered around existing granules, or can be coalesced. Vonk et al. showed that in this stage an equilibrium between growth and breakage is obtained [4]. If this equilibrium can exist for a prolonged period, material exchange would be possible, which can lead to a homogeneous granular mixture.
6.2.2 Stokes deformation number To predict wet granule breakage, Stokes deformation number can be used. This deformation number is defined as the ratio between the externally applied kinetic energy and the energy dissipated by the liquid bonds between the particles [5, 6]. Breakage is dependent on wet granule strength, and on forces imposed on the granules within the granulator. If the granules cannot withstand the shear and impaction forces, they will break. The critical deformation number above which granules will break is 0.04 according to Iveson et al. [7], and 0.01 according to van den Dries et al. [8]. This Stokes deformation number is also used in the growth regime map, where it is one of the parameters determining the granulation regime.
Chapter 6
90
6.2.3 Objectives The objective of this study was threefold; to investigate the different mechanisms of material exchange during the equilibrium phase of granulation and whether these mechanisms are consistent with the mechanisms described in the growth regime map, secondly to study how material and process conditions affect these exchange mechanisms, and finally to correlate Stokes deformation number to the exchange mechanisms.
6.3 Materials and methods
6.3.1 Materials Microcrystalline Cellulose (MCC) (Pharmacel® 101, DMV International, Veghel, the Netherlands), Microfine Cellulose (MFC) (Elcema P100, Degussa AG., Frankfurt, Germany), α-lactose 450M (Pharmatose® 450M, DMV International, Veghel, the Netherlands), and dextrin (Primogran W (lot 45P/EP), Avebe, Foxhol, the Netherlands) were granulated using water as a binding agent. Lactose was also granulated with an aqueous HPC solution (17% HPC solution, with a viscosity of 3 Pa·s) (Hydroxypropylcellulose, lot 59H0637, Sigma-Aldrich Chemie GmbH, Steinheim, Germany).
The water insoluble Sudan (III) red (Chroma-Gesellschaft Schmid GmbH & Co, Stuttgart-Untertürkheim, Germany) was used as tracer material.
6.3.2 Methods
High shear granulation Granules were made in a small scale high shear granulator (MiPro 250, ProCepT, Zelzate, Belgium) using a glass vessel. Microcrystalline cellulose, α-lactose, microfine cellulose and dextrin were agglomerated using water as a binding agent. Liquid was added as a continuous flow through a tube with a 1 mm orifice by a computer controlled dosimat (765 Dosimat, Metrohm Ltd., Hensau, Switzerland). In Table 1a and 1b the granulation method of each material are shown. For the different excipients the process conditions chosen, with respect to the amount of liquid, liquid addition rate, impeller speed, and chopper speed, were optimised causing the most spherical granules with the smallest granule size distribution. Granulation took place until equilibrium was reached. Equilibrium was considered to be reached when granule size had not changed anymore for a period of at least 300 seconds.
Tracer granules Tracer granules were produced by dry mixing 1 % (w/w) of water insoluble Sudan (III) red with the primary powder for 2 minutes in the high shear granulator. After

The use of Stokes deformation number as a predictive tool for material exchange behaviour of granules in the ’equilibrium phase’ in high shear granulation
91
that, liquid was added and the granulation procedure as given in Table 1 was followed. The resulting dark red coloured granules were stored in a closed container to prevent them from drying. The granulator was cleaned and a batch without tracer material was produced.
Tracer experiments When granules were in the equilibrium phase, the granulation procedure was stopped. At this moment 5% of the wet mass was exchanged by wet (red coloured) tracer granules. The impeller and chopper were switched on again and the equilibrium phase of granulation was continued. Samples were taken at t=0, 30, 60, 100, 200, 500, 1000, 2000, and 5000s after the addition of the tracer granules. The granules were dried overnight and pictures were taken. All experiments were performed at least in triplicate.
Microscopy, imaging, and particle size measurement Microscopic pictures of the granules were taken with a Nikon DN 100 Digital Net camera. Pixel size equalled 2 µm in both directions. Particle size (d50) was measured by laser diffraction, type HELOS KA/LA, dispersed with dispersion system RODOS (Sympatec GmbH, Clausthal-Zellerfeld, Germany)
Porosity measurements To determine wet granule porosity, wet granules were freeze dried to retain the wet granule size and shape. The granules were instantly frozen in liquid nitrogen and then placed within the freeze dryer (Christ Alpha 2-4, Salm and Kipp, Breukelen, The Netherlands) for 24 hours. The dried granules were weighed and the size was measured using image analysis. From these results the dry density was calculated. Wet density was calculated from the true densities of the ingredients. From these results, granule porosity was calculated.
6.4 Results and discussion Tracer experiments show that indeed material exchange takes place in the equilibrium phase of the high shear granulation process. A complete distribution of tracer material over all granules was found for all materials tested. However, the granulation time needed to reach this evenly distributed colour varied strongly (See Figures 1-6).
The effect that tracer material becomes equally dispersed throughout the whole batch during the granulation process has already been shown by Ramaker et al. [9]. However, in this study a water-soluble colorant was used as tracer. A water-soluble compound can be transported along with water when contact between granules occurs. Also diffusion of the dissolved tracer may have occurred in this study. To prevent these material transport phenomena we used a water insoluble

Chapter 6
92
tracer in our studies. Only when an insoluble tracer is used it is sure that the observed exchange of tracer is indeed caused by material exchange. Table 1a: The production processes of granules prepared from the different materials Excipient Impeller speed
(rpm) Chopper speed (rpm)
Liquid addition speed (ml/min)
MCC (75%) 1000 1500 48
MCC (100%) 1000 1500 48
MCC (125%) 1000 1500 48
α-Lactose 750 750 12
α-Lactose 750 750 All at once
MFC 1000 1500 40
Dextrin (38.3 %) 1000 1000 3
Dextrin (40%) 1000 1000 3
Impeller speed of 1000 rpm equals 3.1 m/s Table 1b: The production processes of granules prepared from the different materials -continued Excipient Granulation
time (s) Amount of powder (g)
Amount and type of binder liquid
MCC (75%) 900 24 18 ml water
MCC (100%) 900 24 24 ml water
MCC (125%) 900 24 30 ml water
α-Lactose 900 24 4.3 ml water
α-Lactose 900 24 4.3 g aqueous HPC solution
MFC 900 10 18 ml water
Dextrin (38.3 %) 450 30 11.5 ml water
Dextrin (40%) 450 30 12 ml water

The use of Stokes deformation number as a predictive tool for material exchange behaviour of granules in the ’equilibrium phase’ in high shear granulation
93
Figure 1: α-Lactose granules in the equilibrium phase, plain granules mixed with tracer granules for different periods (tmix=0 s (A), at tmix=100 s (B), and at tmix=500 s (C)). Water was used as a binding agent. Bar represents 1 mm.
Figure 2: MCC granules (100% w/w water) in the equilibrium phase, plain granules mixed with tracer granules for different periods (tmix=0 s (A), at tmix=100 s (B) , and at tmix=500 s (C)). Bar represents 1 mm.
Figure 3: Dextrin granules (38.3% w/w water) in the equilibrium phase, plain granules mixed with tracer granules for different periods (tmix=0 s (A), at tmix=60 s (B) , and at tmix=200 s (C)). Bar represents 1 mm.
Figure 4: α-lactose granules in the equilibrium phase, plain granules mixed with tracer granules for different periods (tmix=0 s (A), at tmix=100 s (B), and at tmix=500 s (C)). A high viscosity aqueous HPC solution (viscosity of 3 Pa·s) was used as a binding agent.
Chapter 6
94
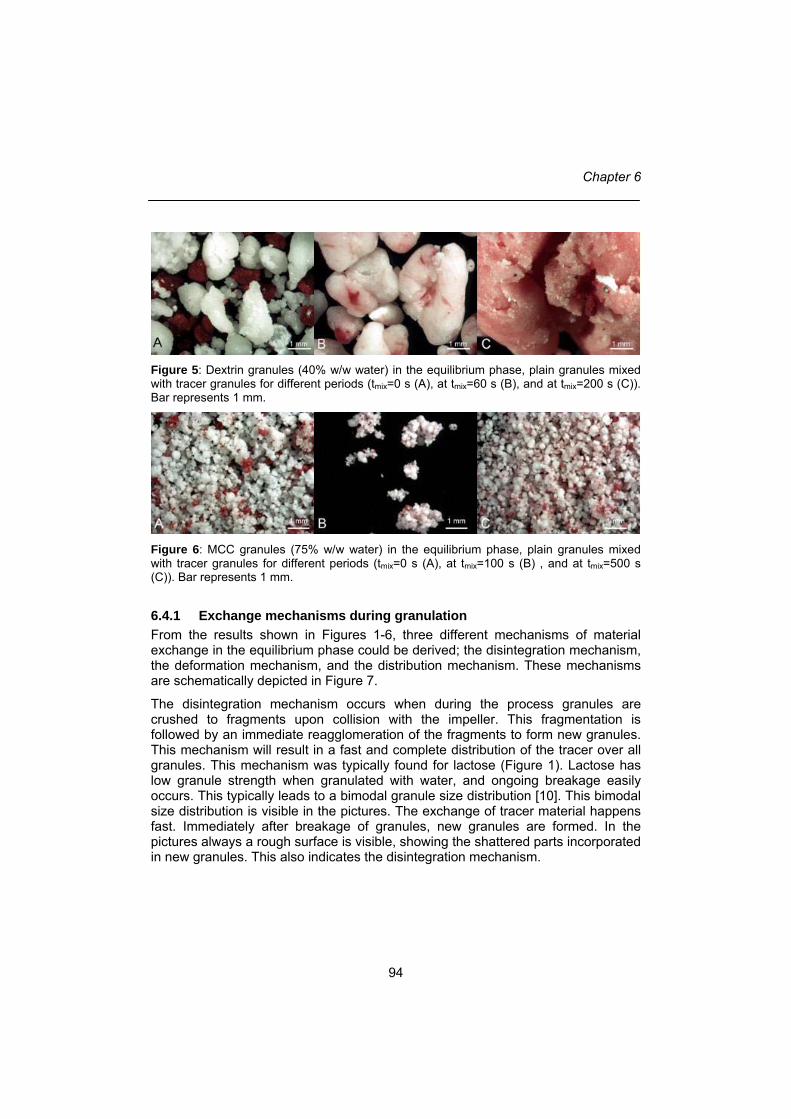
Figure 5: Dextrin granules (40% w/w water) in the equilibrium phase, plain granules mixed with tracer granules for different periods (tmix=0 s (A), at tmix=60 s (B), and at tmix=200 s (C)). Bar represents 1 mm.
Figure 6: MCC granules (75% w/w water) in the equilibrium phase, plain granules mixed with tracer granules for different periods (tmix=0 s (A), at tmix=100 s (B) , and at tmix=500 s (C)). Bar represents 1 mm.
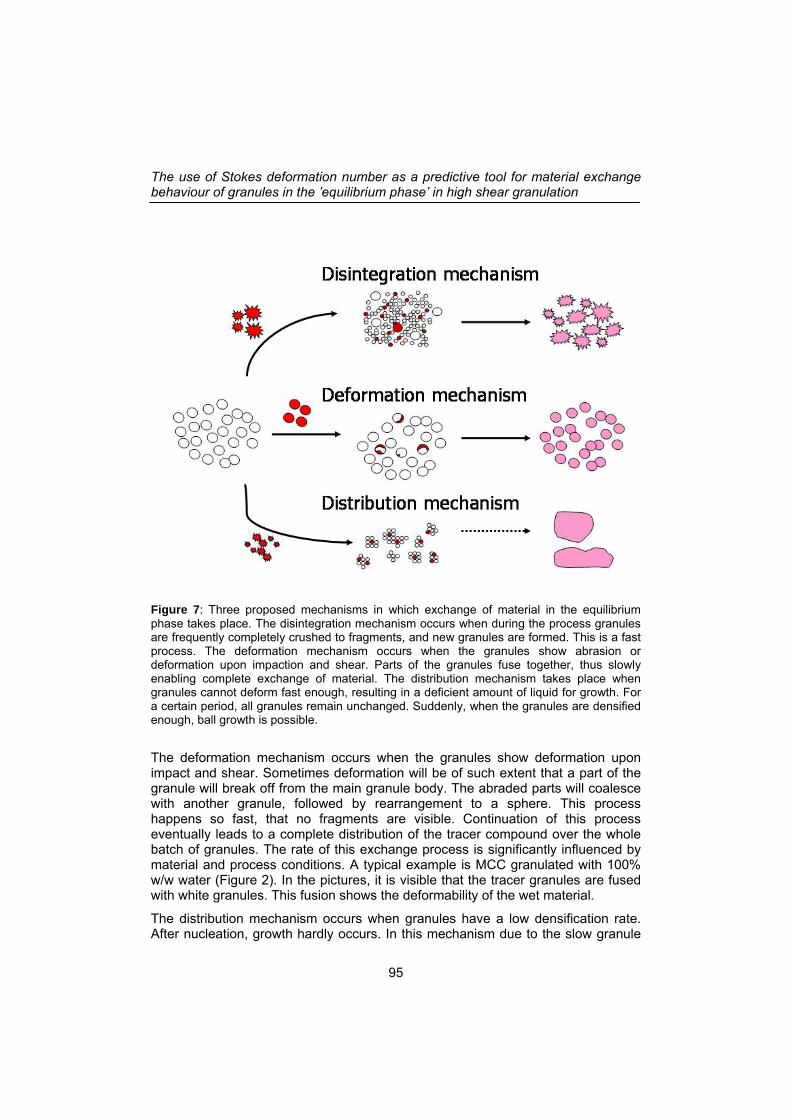
6.4.1 Exchange mechanisms during granulation From the results shown in Figures 1-6, three different mechanisms of material exchange in the equilibrium phase could be derived; the disintegration mechanism, the deformation mechanism, and the distribution mechanism. These mechanisms are schematically depicted in Figure 7.
The disintegration mechanism occurs when during the process granules are crushed to fragments upon collision with the impeller. This fragmentation is followed by an immediate reagglomeration of the fragments to form new granules. This mechanism will result in a fast and complete distribution of the tracer over all granules. This mechanism was typically found for lactose (Figure 1). Lactose has low granule strength when granulated with water, and ongoing breakage easily occurs. This typically leads to a bimodal granule size distribution [10]. This bimodal size distribution is visible in the pictures. The exchange of tracer material happens fast. Immediately after breakage of granules, new granules are formed. In the pictures always a rough surface is visible, showing the shattered parts incorporated in new granules. This also indicates the disintegration mechanism.
The use of Stokes deformation number as a predictive tool for material exchange behaviour of granules in the ’equilibrium phase’ in high shear granulation
95
Figure 7: Three proposed mechanisms in which exchange of material in the equilibrium phase takes place. The disintegration mechanism occurs when during the process granules are frequently completely crushed to fragments, and new granules are formed. This is a fast process. The deformation mechanism occurs when the granules show abrasion or deformation upon impaction and shear. Parts of the granules fuse together, thus slowly enabling complete exchange of material. The distribution mechanism takes place when granules cannot deform fast enough, resulting in a deficient amount of liquid for growth. For a certain period, all granules remain unchanged. Suddenly, when the granules are densified enough, ball growth is possible.
The deformation mechanism occurs when the granules show deformation upon impact and shear. Sometimes deformation will be of such extent that a part of the granule will break off from the main granule body. The abraded parts will coalesce with another granule, followed by rearrangement to a sphere. This process happens so fast, that no fragments are visible. Continuation of this process eventually leads to a complete distribution of the tracer compound over the whole batch of granules. The rate of this exchange process is significantly influenced by material and process conditions. A typical example is MCC granulated with 100% w/w water (Figure 2). In the pictures, it is visible that the tracer granules are fused with white granules. This fusion shows the deformability of the wet material.
The distribution mechanism occurs when granules have a low densification rate. After nucleation, growth hardly occurs. In this mechanism due to the slow granule
Chapter 6
96
growth rates it is possible that although particle size has not changed for over 300 s, due to long induction times equilibrium has not been reached yet when the tracer granules are added. Tracer granules are distributed over the whole batch, but they can be retrieved unchanged for long periods. If eventually densification has occurred to such an extent that growth may occur, the process often becomes uncontrollable (and ball growth is often observed). An example of this mechanism is seen in Figure 3, where the granulation of dextrin with 38% w/w water is shown. The first 100 seconds after addition of tracer granules, all granules remain unchanged. After this period, ball growth is observed.
The underlying cause for the differences in the material exchange mechanism can be found in the differences in wet granule deformability and wet granule strength. Granules in the deformation mechanism deform so fast, that newly formed fragments immediately fuse with other granules. No fragments are visible at any time. Granules in the disintegration mechanism show a high fragmentation propensity: upon impact, they crush into many small fragments. These fragments can be found in the samples for a long time, even when granules are formed, again an irregular surface is visible. Finally, the granules in the distribution mechanism do deform slowly or do not deform at all. These granules stay small. However, after a certain period ball growth can be observed. A remark should be made that since the distinction is based on images, it can be non-conclusive and it is therefore supported by circumstantial evidence such as granule surface roughness and material exchange rates.
When differences in strength and deformability are indeed the underlying mechanism for differences in exchange mechanism, a change in deformability or strength could change the material exchange mechanism. For instance, when a high viscosity binder is added as a binder fluid, the granules become more resistant to shear. Using a high viscosity solution when granulating lactose (HPC solution with a viscosity of 3 Pa·s), indeed resulted in a different exchange mechanism (Figure 4). Not only the material exchange rate slowed down (after 5000 s red and white granules were still present) but also instead of shattering of the granules, abrasion took place. Intact pieces and deformed pieces of red granule were visible on and in the white granules, indicating the occurrence of the deformation mechanism. Another remarkable finding was the extremely smooth surface area, which also indicates highly deformable material.
In Figure 3 and Figure 5 dextrin granules are shown, containing 38.3% (w/w) water and 40% (w/w) water respectively. Although the difference in liquid content is small, the effect of this difference is large. For the material in Figure 3 clearly the distribution mechanism is observed. The coloured granules are distributed evenly over the batch, but hardly any newly formed granules were visible. When a little more liquid was added, the exchange mechanism is changed into the deformation mechanism (Figure 5). Parts of coloured granules fuse into white granules. Apparently, it is possible to switch between the mechanisms by changing the amount of liquid. Again this is easily explained by the differences in strength and deformability of granules with different liquid amounts.

The use of Stokes deformation number as a predictive tool for material exchange behaviour of granules in the ’equilibrium phase’ in high shear granulation
97
In Figure 2 and Figure 6, MCC granules are shown, granulated with 100% (w/w) water and 75% (w/w) water, respectively. Again a change in liquid content results in a change in material exchange mechanism. The low water amount (Figure 6) shows the distribution mechanism, whereas the larger water amount shows the deformation mechanism (Figure 2). Upon addition of more binding fluid (125% w/w water) the material exchange was even faster (results not shown).
The deformation mechanism was also observed when MFC (microfine cellulose) was granulated with 180% (w/w) water (results not shown). The exchange rate was high, which can be ascribed to the high amount of water, making the material deformable.
In summary, we found that material exchange in the equilibrium phase can occur according to three distinguishable mechanisms, the distribution mechanism, the deformation mechanism, and the disintegration mechanism. It is possible to vary the exchange mechanism by changing the process conditions such as the viscosity of the liquid binder or the amount of liquid binder.
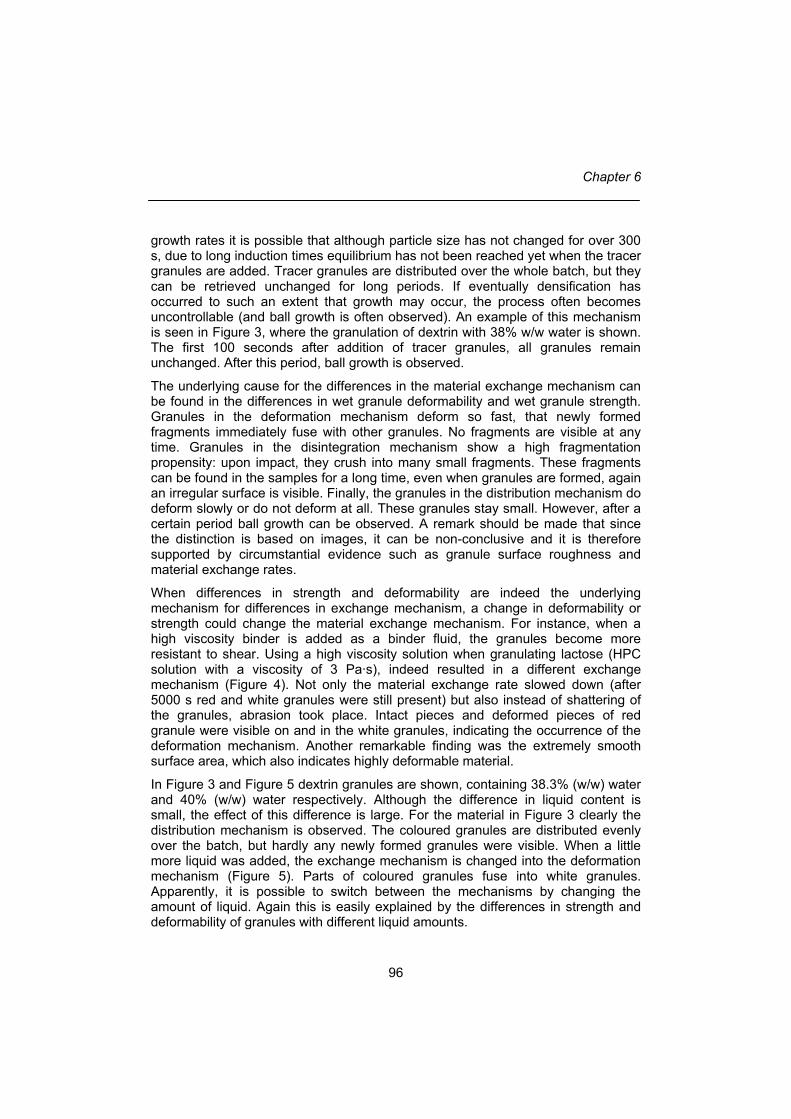
6.4.2 Stokes deformation number The material exchange mechanisms for the equilibrium phase in granulation described above could also be placed in the growth regime map of Iveson and Litster [7, 11], as shown in Figure 8. The disintegration mechanism is typically found for materials and conditions that show the so-called ‘crumb behaviour’, which was seen in the above described experiments with lactose. The deformation mechanism would best be compared to ‘steady growth’, which was typically seen in the above described experiments with MCC 100% w/w liquid. Finally, the distribution mechanism contains both ‘nucleation only’ and ‘induction growth’ regimes, which was shown in the above described experiments with dextrin 38% w/w liquid.
In the growth regime map Stokes deformation number is used as a measure for the deformability of the wet material. Since both the granulation regimes and the exchange mechanisms are determined by the granule deformability, a correlation between the growth regimes and the exchange mechanisms is expected. How Stokes deformation number is calculated is shown in Equation 1, where granular density (ρg), representative collision velocity (vc) and granule strength (σ) are used. The representative collision velocity vc was calculated, according to Knight et al., to be about 20% of the impeller tip speed [12].
Chapter 6
98
Figure 8: The three material exchange mechanisms during granulation placed in the growth regime map [7].
σρ
2
2cg
def
vSt
⋅= Equation 1
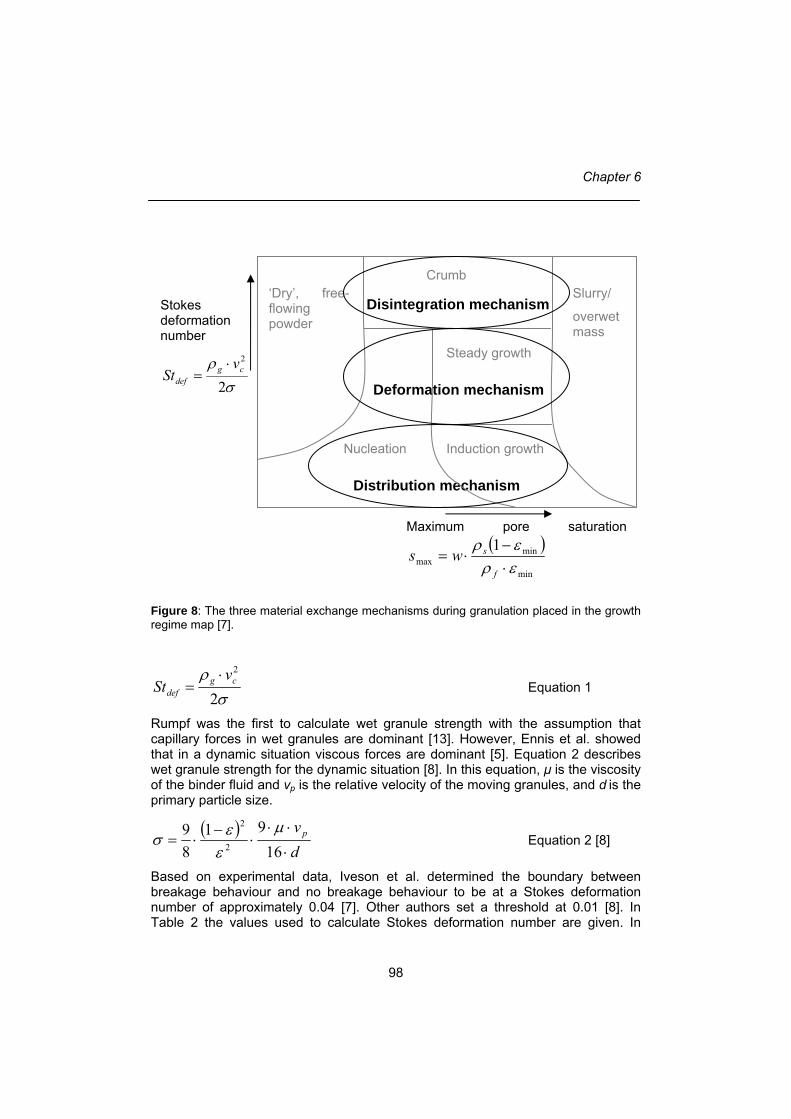
Rumpf was the first to calculate wet granule strength with the assumption that capillary forces in wet granules are dominant [13]. However, Ennis et al. showed that in a dynamic situation viscous forces are dominant [5]. Equation 2 describes wet granule strength for the dynamic situation [8]. In this equation, µ is the viscosity of the binder fluid and vp is the relative velocity of the moving granules, and d is the primary particle size.
( )dv p
⋅
⋅⋅⋅
−⋅=
1691
89
2
2 µεεσ Equation 2 [8]
Based on experimental data, Iveson et al. determined the boundary between breakage behaviour and no breakage behaviour to be at a Stokes deformation number of approximately 0.04 [7]. Other authors set a threshold at 0.01 [8]. In Table 2 the values used to calculate Stokes deformation number are given. In
Deformation mechanism
Distribution mechanism
Disintegration mechanism
Induction growth
CrumbSlurry/
overwet mass
Steady growth
Nucleation
‘Dry’, free-flowing powder
Stokes deformation number
σρ
2
2cg
def
vSt
⋅=
Maximum pore saturation ( )
min
minmax
1ερερ
⋅−
⋅=f
sws

The use of Stokes deformation number as a predictive tool for material exchange behaviour of granules in the ’equilibrium phase’ in high shear granulation
99
Figure 9 the results of Stokes deformation number determination for the granules used in this manuscript are shown. When lactose is granulated using a viscous binder instead of water, Stokes deformation number is lowered. This is in accordance with the difference in material exchange mechanism (from the disintegration mechanism to the deformation mechanism), and the expectations shown in Figure 8. However, the cluster of values of the processes showing exchange by deformation is not lower than the value of lactose-water (disintegration mechanism) or higher than dextrin granulated with 38% w/w water (distribution mechanism). The question arises whether the values of Stokes deformation number are correct. These numbers largely exceed the values found by other authors [5, 7, 8]. The reason for this anomaly is the use of water as a binding agent, whereas in most cases in literature, a viscous binder is used. We calculated Stokes deformation number for several porosities and several viscosities of the binder fluid, as shown in Figure 10. It shows (left) that when using MCC particles of 52 µm, using an impeller speed of 3 m/s, and using water as a binder fluid, breakage would always occur. However, in the results shown this appears not to be the case. The same is true for lactose particles of 16 µm, using an impeller speed of 3 m/s, and using water as a binder fluid. Table 2: Granule properties and their tensile strengths used to calculate Stokes deformation number MCC
(100%) MCC (125%)
α-Lactose
MFC Dextrin (38.3%)
Dextrin (40%)
ε (-) 0.427 0.496 0.530 0.735 0.491 0.423
ρg (kg/m3)
1265 1236 1456 1170 1351 1346
d50 (m) 5.1 *10-5 5.1 *10-5 1.5 *10-5 4.2 *10-5 1.4*10-5 1.4*10-5
σ (Pa) 2.790 0.613 25.99 0.769 24.27 33.07
Particle velocity is calculated as 20% of impeller speed
Several phenomena may explain the deviation found when water is used as a binder liquid. First of all, the powder can dissolve in the binder liquid. This is what happens with lactose, for example. If we assume that maximum solubility of lactose in water is reached immediately, we can calculate the viscous tensile strength using the viscosity of a saturated lactose solution. The resulting Stokes deformation number then was 0.7 in that case, which is more comparable to results of others [7, 8, 11]. However, the other powders tested do not dissolve in water, and a satisfying explanation for these materials is still missing. Secondly, the contribution of the interparticle frictional forces and the cohesive forces to granule strength are neglected in equation 2, which might result in different Stokes numbers.

Chapter 6
100
lactose -water
dextrin (38.3%)
MFC
MCC (100%)
MCC (125%)
dextrin (40%)
lactose-viscous binder
1.E-03
1.E-02
1.E-01
1.E+00
1.E+01
1.E+02
1.E+03
0.0 0.2 0.4 0.6 0.8 1.0
Saturation (-)
Sto
kes
defo
rmat
ion
num
ber (
-)
Figure 9: The granules placed in the growth regime map. The lactose-water (○) granulation process shows the disintegration mechanism, dextrin (38.3% w/w liquid) (٭) shows the distribution mechanism and the group with MCC (100 & 125% w/w liquid), MFC, dextrin (40% w/w liquid), and lactose with the viscous binder (■) show the deformation mechanism. MCC (75% w/w liquid) is not shown in this figure, since the porosity of the granules could not be determined. These granules show the distribution mechanism. When calculating saturation for the lactose-water granules, the solid fraction change due to the dissolution of lactose in the binder was accounted for by the method presented by Hoornaert et al. [14].
0
1
2
3
1.E-03 1.E-02 1.E-01 1.E+00Viscosity (Pa s)
Stok
es d
efor
mat
ion
num
ber (
-)
ε =0.4
ε =0.6ε =0.5
ε =0.8ε =0.7
0
1
2
3
1.E-03 1.E-02 1.E-01 1.E+00Viscosity (Pa s)
Sto
kes
defo
rmat
ion
num
ber (
-)
ε =0.4
ε =0.8ε =0.7ε =0.6
ε =0.5
Figure 10: Stokes deformation number for MCC 101 (A) calculated with d = 52 µm, v =0.63 m/s and ρ =1265 kg/m , and α-lactose 450M (B) calculated with d = 16 µm, v =0.47 m/s and ρ =1456 kg/m
p
particle wet mass3
p
particle wet mass3
Low viscosity binders result in high Stokes deformation numbers (Figure 10). Therefore, calculation of Stokes deformation numbers for these systems will not

The use of Stokes deformation number as a predictive tool for material exchange behaviour of granules in the ’equilibrium phase’ in high shear granulation
101
reveal the granulation regime. For low viscosity binders, Stokes deformation number is not a good tool to analyse the deformation behaviour of the wet granules. However, colour experiments do give a clear indication of the type of behaviour of the wet material in the equilibrium phase of the granulation process. Therefore, in case of a low viscosity binder, the easiest way to determine the accompanying granulation regime is by performing material exchange experiments. It only takes two granulation procedures to provide the results.
6.5 Conclusion Exchange of solid material occurs during the equilibrium phase of wet granulation. Three different mechanisms of material exchange were identified; exchange by disintegration, where granules are rapidly crushed and formed to granules again, exchange by deformation, where abraded granule fragments immediately fuse with other granules, and exchange by distribution, a mechanism during which granules remain intact over a prolonged period during which hardly any material exchange occurs which after a slight densification is followed by uncontrolled growth and exchange of material.
It was found that it was possible to shift between these mechanisms by changing the process conditions, which influences wet granule strength and deformability. For example, more liquid binder results in more deformable granules, which may result in a shift to the deformation mechanism. This knowledge can be used to control quality attributes of the produced granules. When for example the appropriate process conditions are chosen, a fast exchange of material may result in an improved distribution of a low dosed drug in the granular mass.
When water is used as a binder liquid, and the solubility of the solid is low in water, Stokes deformation number cannot be used as a predictive tool for the granulation regime. The method to calculate wet granule strength is not accurate when using low viscosity binders. A better way to determine the deformation behaviour that determines the granulation regime is to perform exchange mechanism experiments. It only takes two granulation procedures to visualize the granulation mechanism in the equilibrium phase.
6.6 Symbols d Primary particle size smax Maximum pore saturation Stdef Stokes deformation number vc Representative collision velocity vp Relative velocity of the moving granules w Mass ratio liquid to solid

Chapter 6
102
Greek symbols ε Granular porosity εmin Minimum porosity reached in a particular powder-liquid combination µ Viscosity of the binder fluid ρf Liquid density ρg Granular density ρs Density of the solid particles σ Wet granule strength
6.7 References 1. Holm, P., High Shear Mixer Granulators, in Handbook of Pharmaceutical
Granulation Technology, D.M. Parikh, Editor. 1997, Marcel Dekker, INC.: New York. p. 151-204.
2. Iveson, S.M., et al., Nucleation, growth and breakage phenomena in agitated wet granulation processes: a review. Powder Technol., 2001. 117: p. 3-39.
3. Wauters, P.A.L., et al., Growth and compaction behaviour of copper concentrate granules in a rotating drum. Powder Technol., 2002. 124: p. 230-237.
4. Vonk, P., et al., Growth mechanisms of high-shear pelletisation. Int. J. of Pharm., 1997. 157: p. 93-102.
5. Ennis, B.J., G. Tardos, and R. Pfeffer, A microlevel-based characterization of granulation phenomena. Powder Technol., 1991. 65: p. 257-272.
6. Tardos, G.I., M.I. Khan, and P.R. Mort, Critical parameters and limiting conditions in binder granulation of fine powders. Powder Technol., 1997. 94: p. 245-258.
7. Iveson, S.M., et al., Growth regime map for liquid-bound granules: further development and experimental validation. Powder Technol., 2001. 117: p. 83-97.
8. Dries van den, K., et al., Granule breakage phenomena in a high shear mixer; influence of process and formulation variables and consequences on granule homogeneity. Powder Technol., 2003. 133: p. 228-236.
9. Ramaker, J.S., et al., Scale-down of a high-shear pelletisation process: Flow profile and growth kinetics. Int. J. of Pharm., 1998. 166: p. 89-97.
10. Schæfer, T., Growth mechanisms in melt agglomeration in high shear mixers. Powder Technol., 2001. 117: p. 68-82.
11. Iveson, S.M. and J.D. Litster, Growth regime map for liquid-bound granules. AIChE Journal, 1998. 44(7): p. 1510-1518.
12. Knight, P.C., et al., Prediction of impeller torque in high shear powder mixers. Chem. Eng. Sci., 2001. 56: p. 4457-4471.
13. Rumpf, H., The strength of granules and agglomerates, in Agglomeration, W.A. Knepper, Editor. 1962, Wiley: New York. p. 379-418.
14. Hoornaert, F., et al., Agglomeration behaviour of powders in a Lödige mixer granulator. Powder Technol., 1998. 96: p. 116-128.