University of Cyprus Biomedical Imaging and Applied ... Beer-Lambert law applies • Magnitude of...
32
University of Cyprus Biomedical Imaging and Applied Optics Biomedical Imaging and Applied Optics Fluorescence Spectroscopy Fluorescence Spectroscopy
Transcript of University of Cyprus Biomedical Imaging and Applied ... Beer-Lambert law applies • Magnitude of...
University of CyprusBiomedical Imaging and Applied OpticsBiomedical Imaging and Applied Optics
Fluorescence SpectroscopyFluorescence Spectroscopy
Principles of Fluorescence
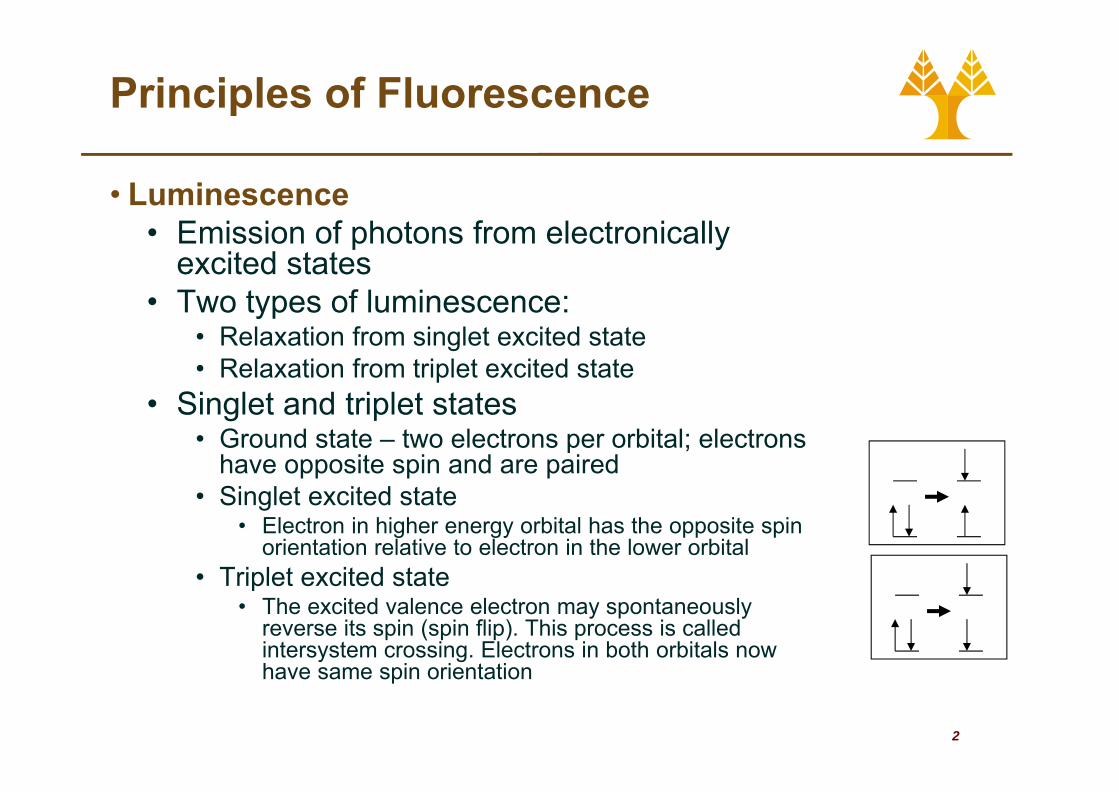
• Luminescence• Emission of photons from electronically
excited states• Two types of luminescence:Two types of luminescence:
• Relaxation from singlet excited state• Relaxation from triplet excited state
Si l t d t i l t t t• Singlet and triplet states• Ground state – two electrons per orbital; electrons
have opposite spin and are paired• Singlet excited state
• Electron in higher energy orbital has the opposite spin orientation relative to electron in the lower orbital
• Triplet excited state• Triplet excited state • The excited valence electron may spontaneously
reverse its spin (spin flip). This process is called intersystem crossing. Electrons in both orbitals now h i i t ti
2
have same spin orientation
Principles of Fluorescence
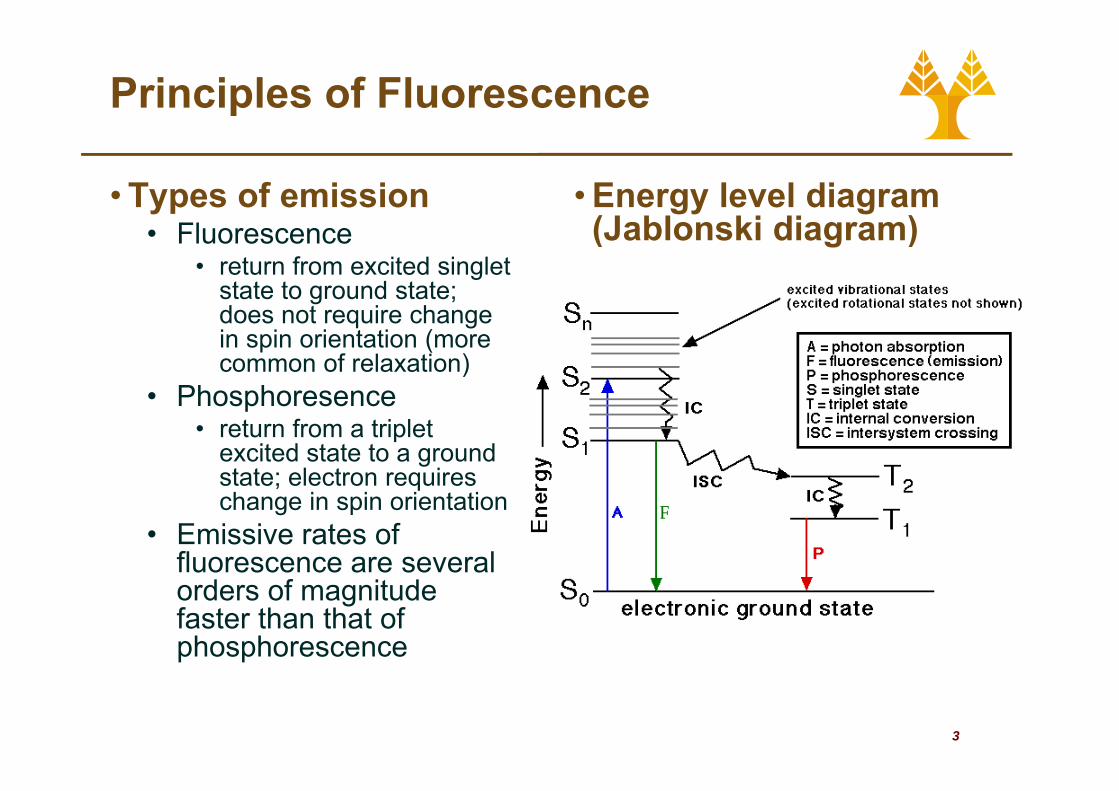
• Types of emission • Energy level diagram (J bl ki di )• Fluorescence
• return from excited singlet state to ground state; d t i h
(Jablonski diagram)
does not require change in spin orientation (more common of relaxation)
• Phosphoresence• Phosphoresence• return from a triplet
excited state to a ground state; electron requiresstate; electron requires change in spin orientation
• Emissive rates of fluorescence are several orders of magnitude faster than that of phosphorescence
3
Principles of Fluorescence
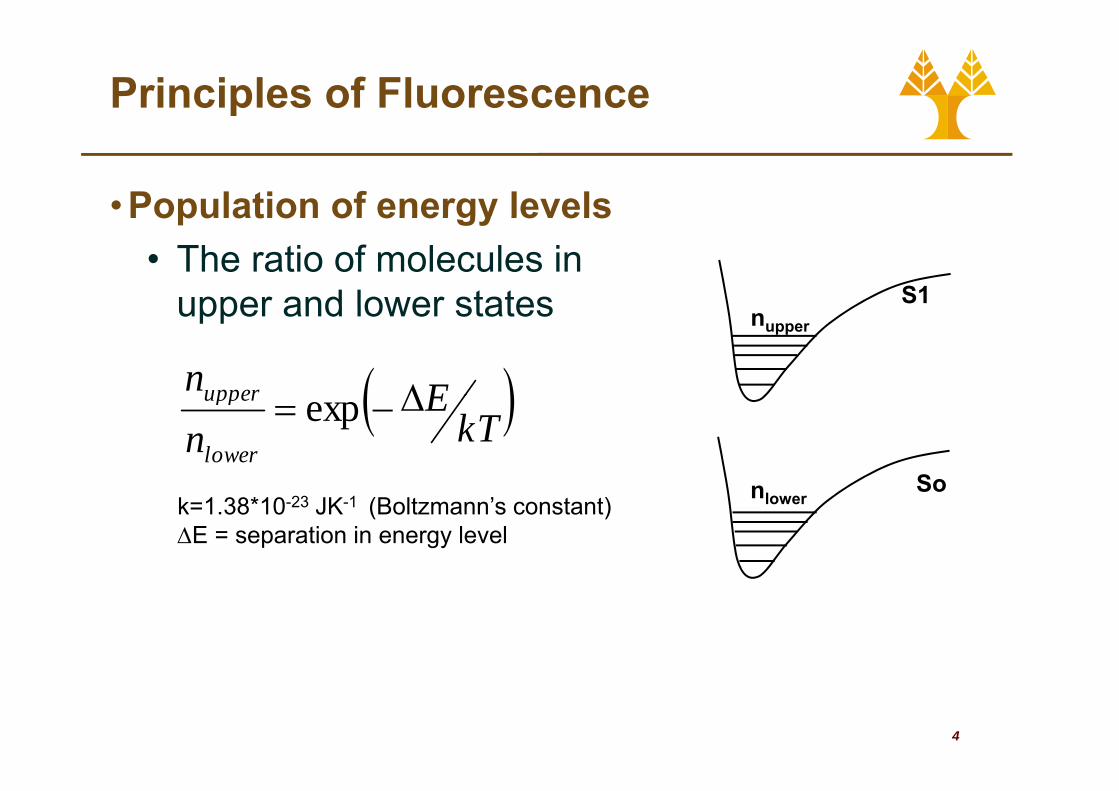
• Population of energy levelsPopulation of energy levels• The ratio of molecules in
upper and lower states S1upper and lower states
( )Enupper Δ
nupper
( )kTE
nlower
upper Δ−= exp
Sok=1.38*10-23 JK-1 (Boltzmann’s constant)ΔE = separation in energy level
Sonlower
4
Principles of Fluorescence
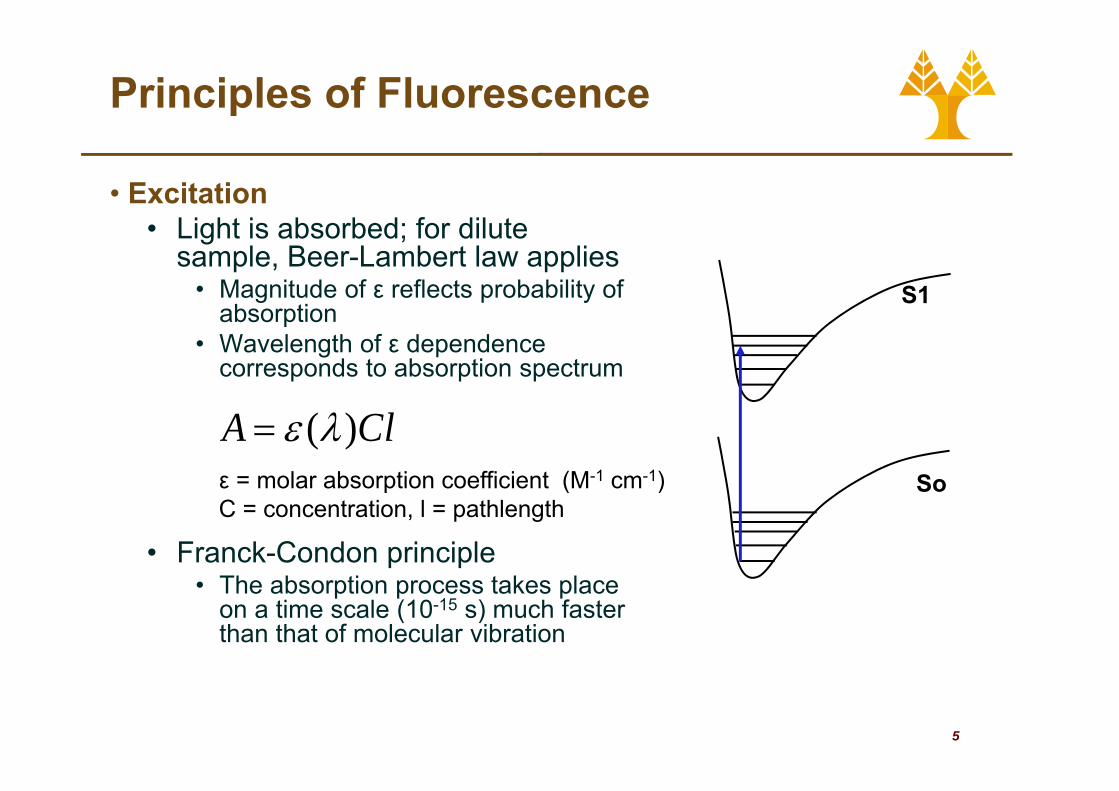
• Excitation• Light is absorbed; for dilute
sample, Beer-Lambert law applies• Magnitude of ε reflects probability of
b tiS1
absorption • Wavelength of ε dependence
corresponds to absorption spectrum
( )A Clε λ=ε = molar absorption coefficient (M-1 cm-1) So
• Franck-Condon principle
ε molar absorption coefficient (M cm )C = concentration, l = pathlength
So
• The absorption process takes place on a time scale (10-15 s) much faster than that of molecular vibration
5
Principles of Fluorescence
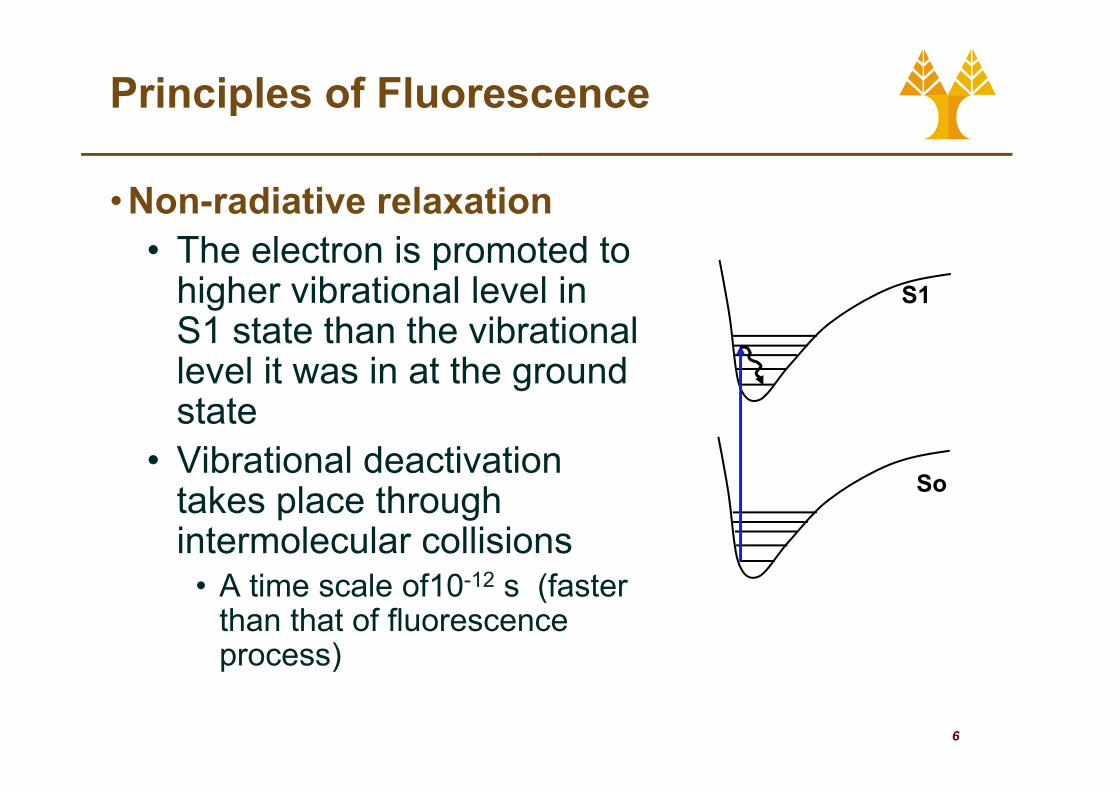
• Non-radiative relaxation• The electron is promoted to
higher vibrational level in S1gS1 state than the vibrationallevel it was in at the ground state
• Vibrational deactivation Sotakes place through
intermolecular collisions A ti l f10 12 (f t
So
• A time scale of10-12 s (faster than that of fluorescence process)
6
process)
Principles of Fluorescence
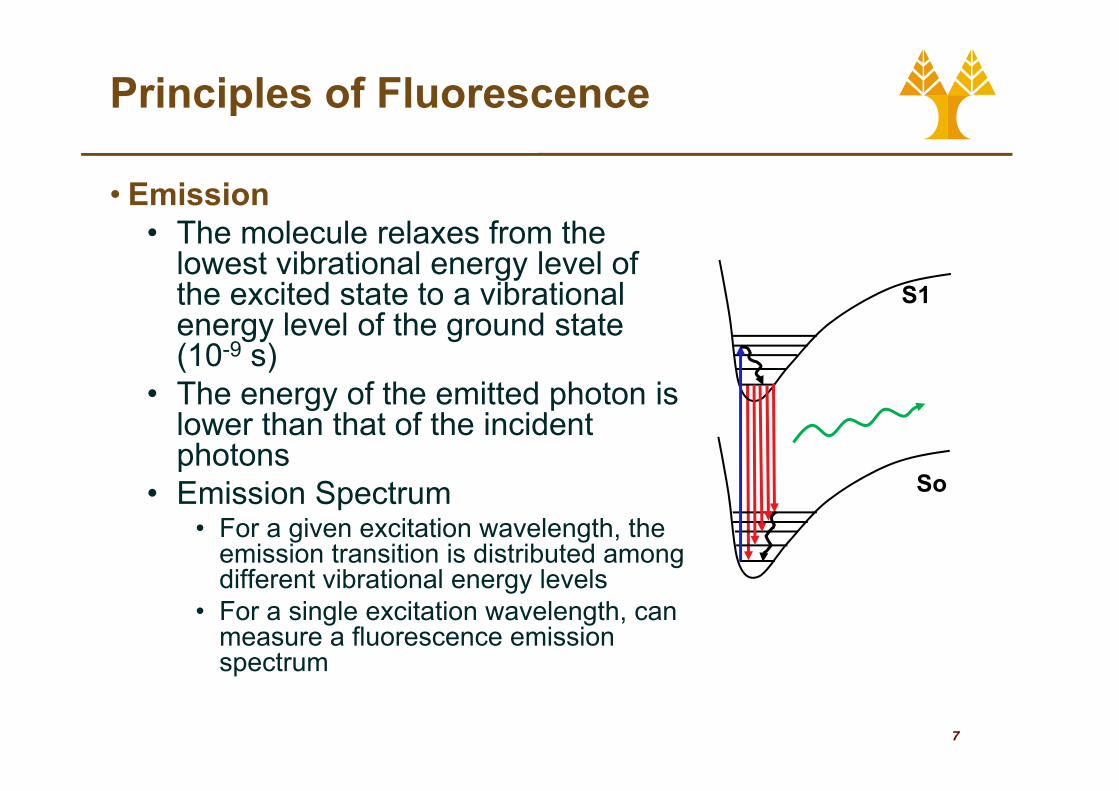
• Emission• The molecule relaxes from the
lowest vibrational energy level of the excited state to a vibrational S1energy level of the ground state (10-9 s)
• The energy of the emitted photon is• The energy of the emitted photon is lower than that of the incident photonsE i i S t So• Emission Spectrum
• For a given excitation wavelength, the emission transition is distributed among different vibrational energy levels
So
different vibrational energy levels• For a single excitation wavelength, can
measure a fluorescence emission spectrum
7
spectrum
Principles of Fluorescence
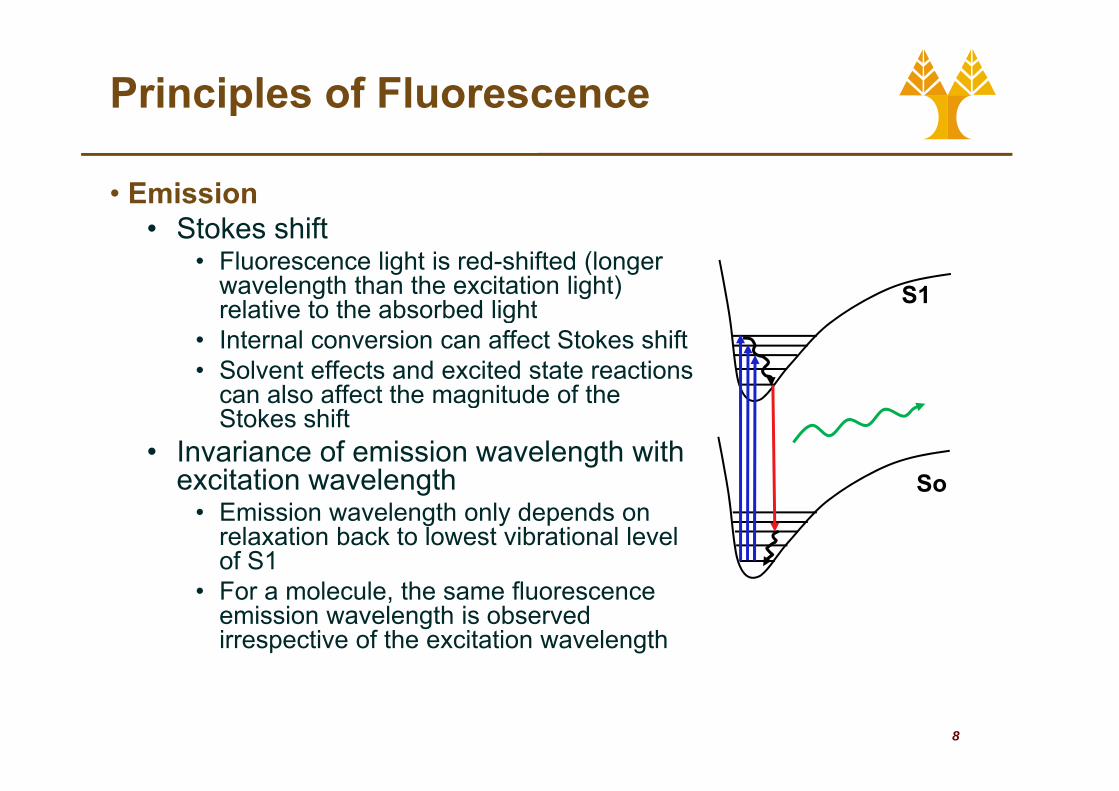
• Emission• Stokes shift
• Fluorescence light is red-shifted (longer wavelength than the excitation light) relative to the absorbed light S1relative to the absorbed light
• Internal conversion can affect Stokes shift• Solvent effects and excited state reactions
can also affect the magnitude of thecan also affect the magnitude of the Stokes shift
• Invariance of emission wavelength with excitation wavelength Soexcitation wavelength
• Emission wavelength only depends on relaxation back to lowest vibrational level of S1
So
• For a molecule, the same fluorescence emission wavelength is observed irrespective of the excitation wavelength
8
Principles of Fluorescence
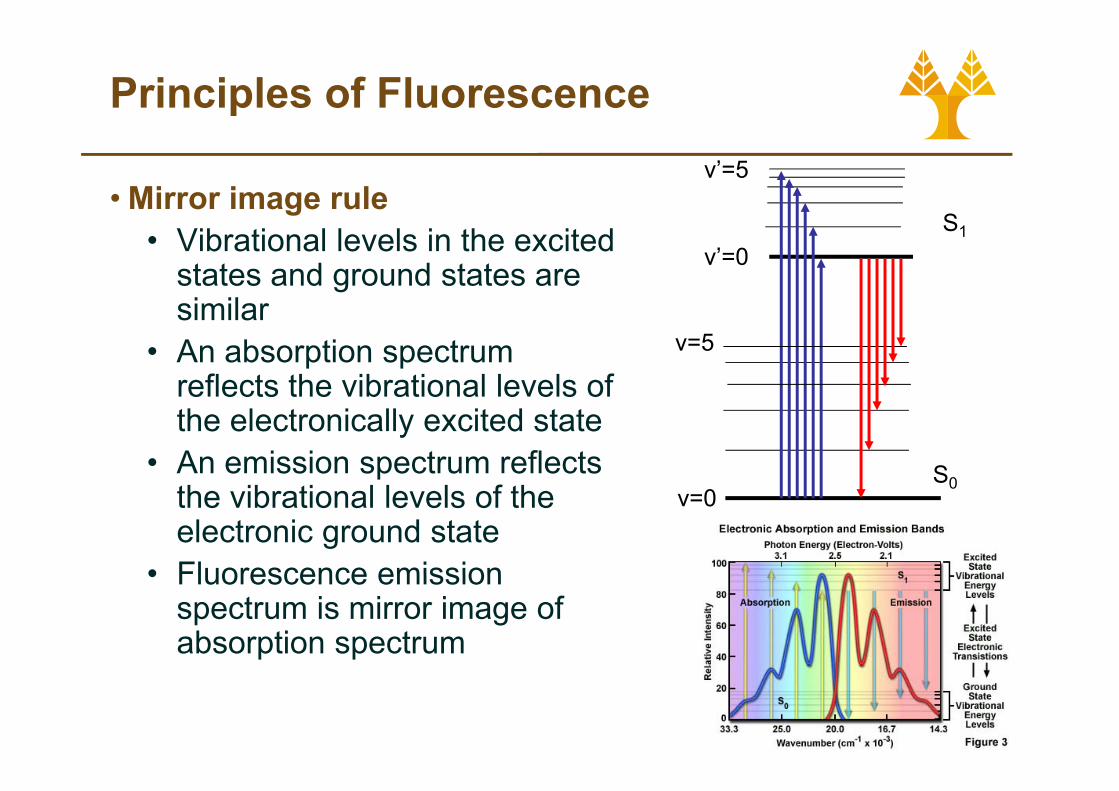
• Mirror image ruleS
v’=5
• Vibrational levels in the excited states and ground states are similar
S1
v’=0
similar• An absorption spectrum
reflects the vibrational levels ofv=5
reflects the vibrational levels of the electronically excited state
• An emission spectrum reflects h ib i l l l f h
S0the vibrational levels of the electronic ground state
• Fluorescence emission
0v=0
• Fluorescence emission spectrum is mirror image of absorption spectrum
9
Principles of Fluorescence
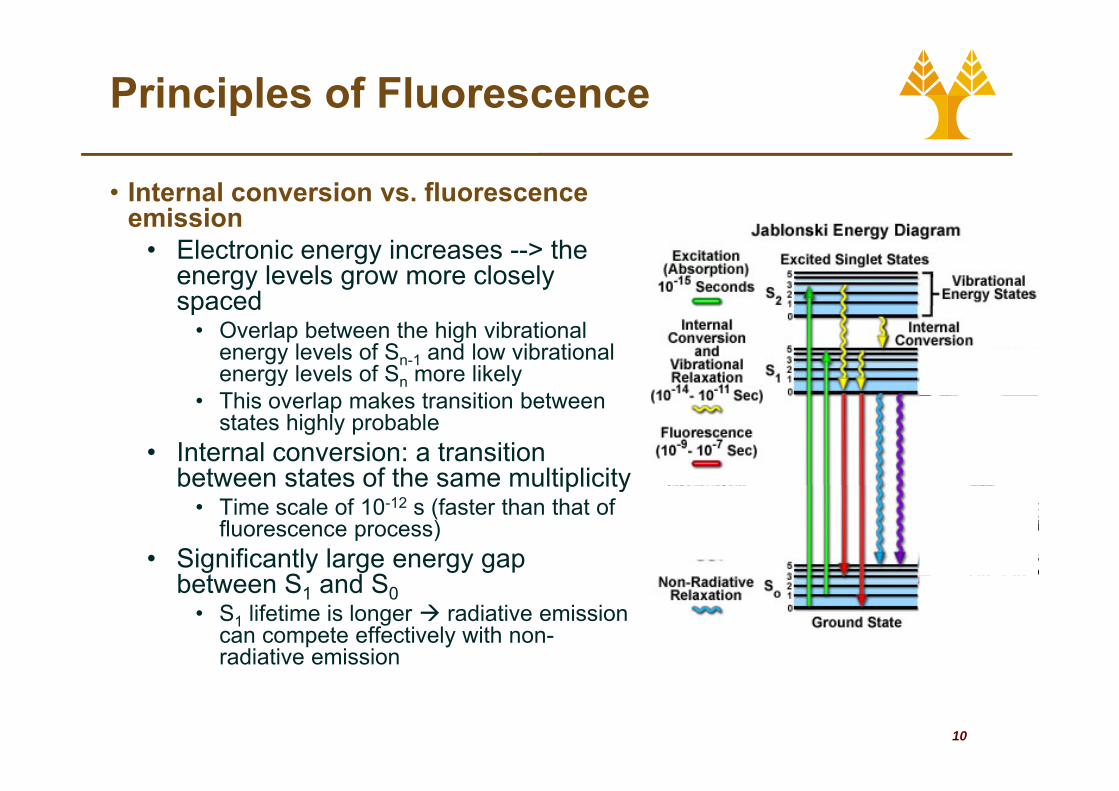
• Internal conversion vs. fluorescence emissionemission
• Electronic energy increases --> the energy levels grow more closely spacedspaced
• Overlap between the high vibrationalenergy levels of Sn-1 and low vibrationalenergy levels of Sn more likelyThi l k t iti b t• This overlap makes transition between states highly probable
• Internal conversion: a transition between states of the same multiplicitybetween states of the same multiplicity
• Time scale of 10-12 s (faster than that of fluorescence process)
• Significantly large energy gap b t S d Sbetween S1 and S0
• S1 lifetime is longer radiative emission can compete effectively with non-radiative emission
10
Principles of Fluorescence
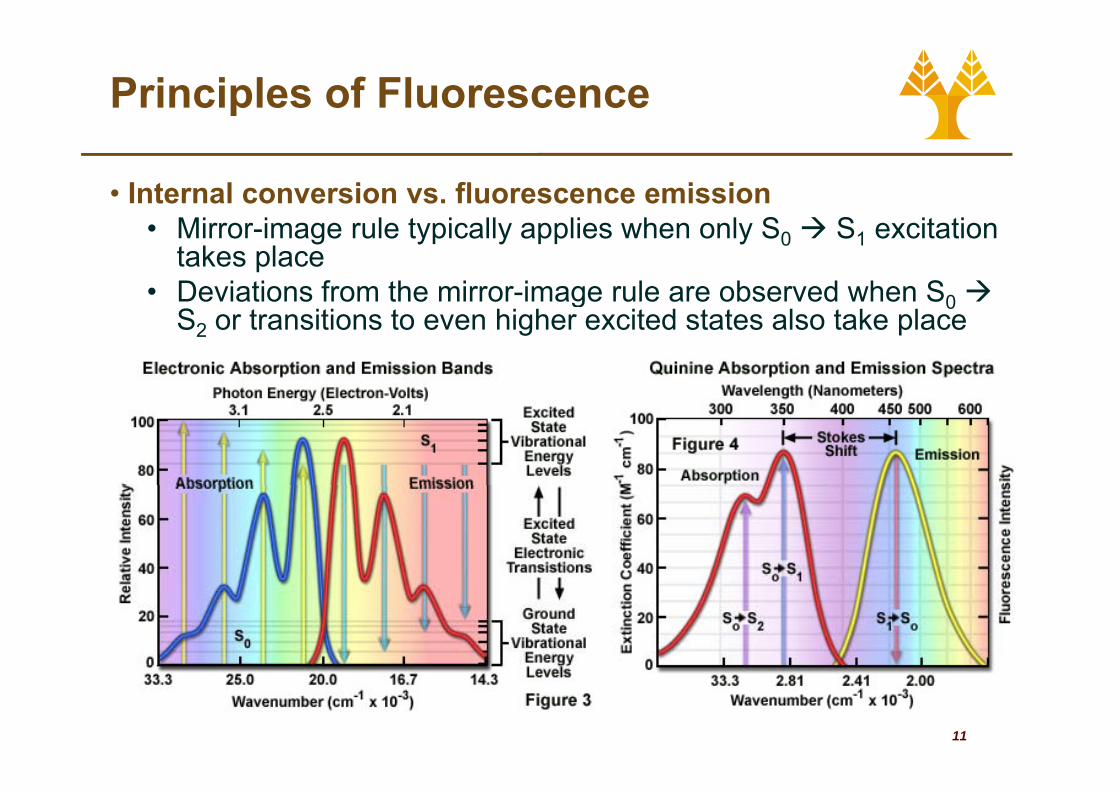
• Internal conversion vs. fluorescence emission• Mirror-image rule typically applies when only S0 S1 excitation
takes place• Deviations from the mirror-image rule are observed when S0g 0
S2 or transitions to even higher excited states also take place
11
Principles of fluorescence
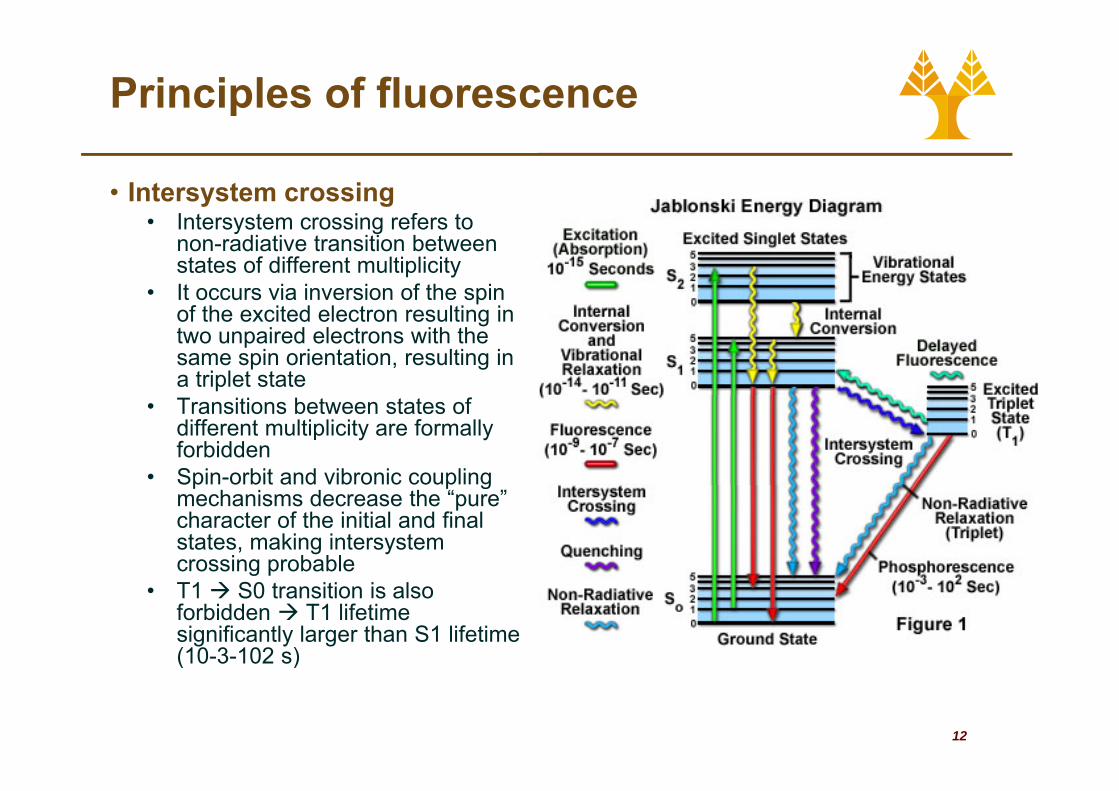
• Intersystem crossingI t t i f t• Intersystem crossing refers to non-radiative transition between states of different multiplicity
• It occurs via inversion of the spin f th it d l t lti iof the excited electron resulting in
two unpaired electrons with the same spin orientation, resulting in a triplet state
• Transitions between states of different multiplicity are formally forbidden
• Spin-orbit and vibronic coupling p p gmechanisms decrease the “pure” character of the initial and final states, making intersystem crossing probableg p
• T1 S0 transition is also forbidden T1 lifetime significantly larger than S1 lifetime (10-3-102 s)
12
( )
Quantum yield and life time
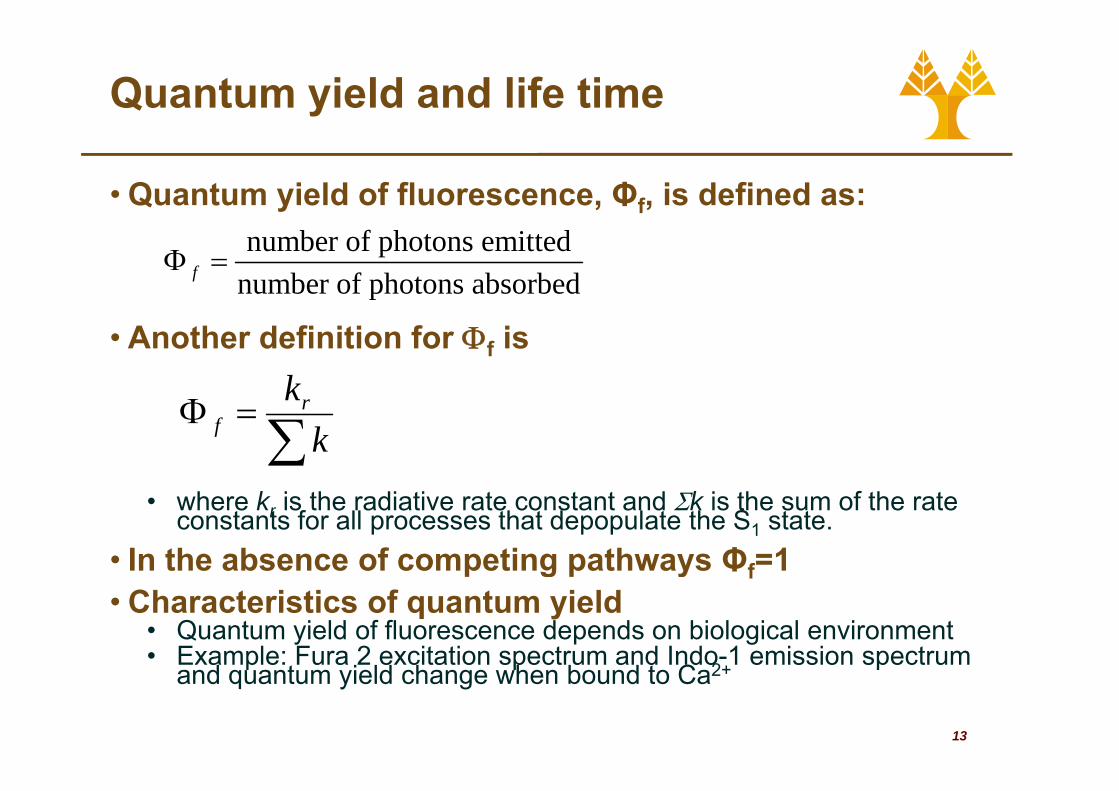
• Quantum yield of fluorescence, Φf, is defined as:number of photons emitted
number of photons absorbedfΦ =
• Another definition for Φf isk
∑=Φ
kkr
f
• where kr is the radiative rate constant and Σk is the sum of the rate constants for all processes that depopulate the S1 state.
• In the absence of competing pathways Φf=1p g p y f• Characteristics of quantum yield
• Quantum yield of fluorescence depends on biological environment• Example: Fura 2 excitation spectrum and Indo-1 emission spectrum
d i ld h h b d C 2
13
a p e u a e c a o spec u a d do e ss o spec uand quantum yield change when bound to Ca2+
Quantum yield and life time
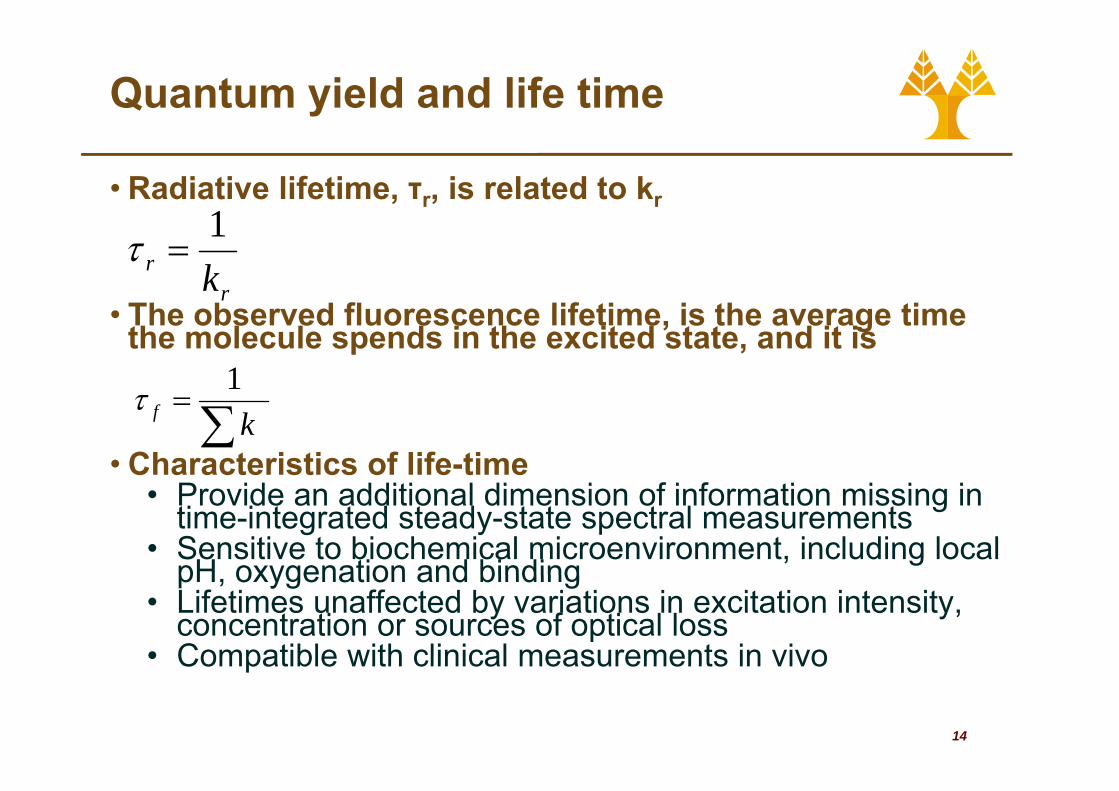
• Radiative lifetime, τr, is related to kr1
Th b d fl lif ti i th tir
r k1
=τ
• The observed fluorescence lifetime, is the average time the molecule spends in the excited state, and it is
1τ
• Characteristics of life-time P id dditi l di i f i f ti i i i
∑=
kfτ
• Provide an additional dimension of information missing in time-integrated steady-state spectral measurements
• Sensitive to biochemical microenvironment, including local pH oxygenation and bindingpH, oxygenation and binding
• Lifetimes unaffected by variations in excitation intensity, concentration or sources of optical loss
• Compatible with clinical measurements in vivo
14
Compatible with clinical measurements in vivo
Quantum yield and life time
• Fluorescence life-time methods• Short pulse excitation followed by an interval during
which the resulting fluorescence is measured as a function of time
• Provide an additional dimension of information i i i ti i t t d t d t t t lmissing in time-integrated steady-state spectral
measurements• Sensitive to biochemical microenvironment including• Sensitive to biochemical microenvironment, including
local pH, oxygenation and binding• Lifetimes unaffected by variations in excitationLifetimes unaffected by variations in excitation
intensity, concentration or sources of optical loss• Compatible with clinical measurements in vivo
15
p
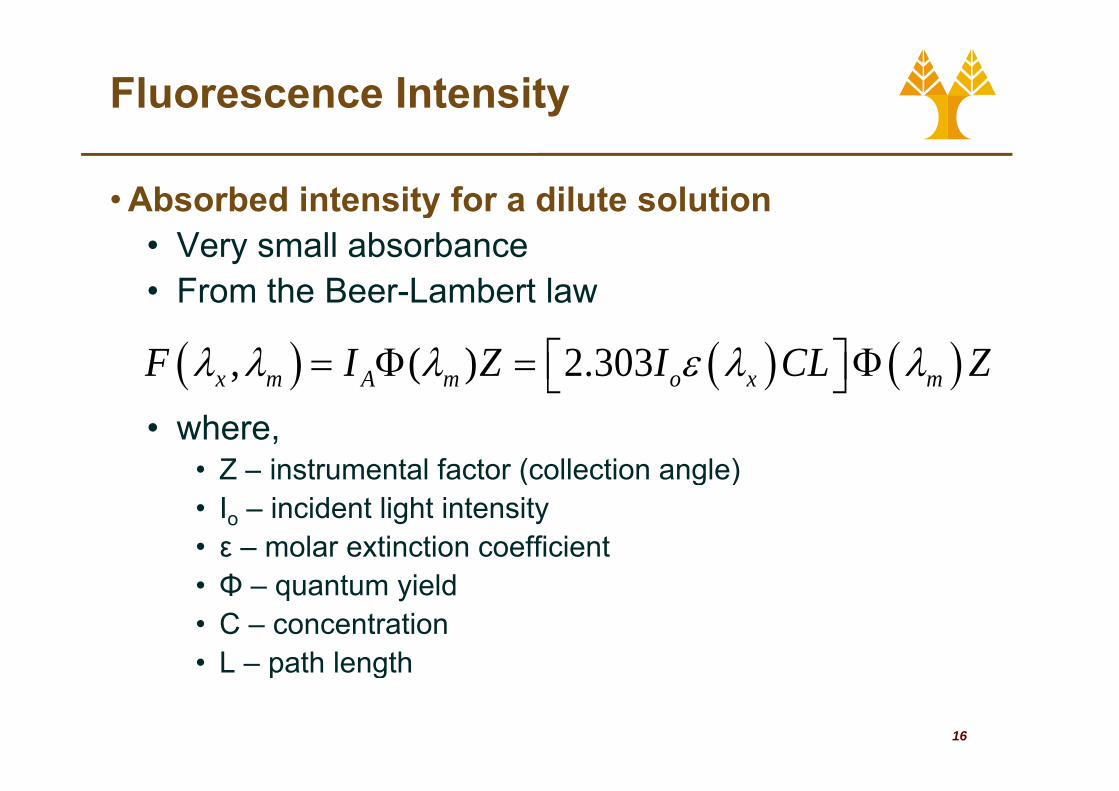
Fluorescence Intensity
• Absorbed intensity for a dilute solutiony• Very small absorbance• From the Beer-Lambert law
( ) ( ) ( ), ( ) 2.303x m A m o x mF I Z I CL Zλ λ λ ε λ λ= Φ = Φ⎡ ⎤⎣ ⎦• where,
• Z – instrumental factor (collection angle)( g )• Io – incident light intensity• ε – molar extinction coefficientΦ t i ld• Φ – quantum yield
• C – concentration• L – path length
16
• L – path length
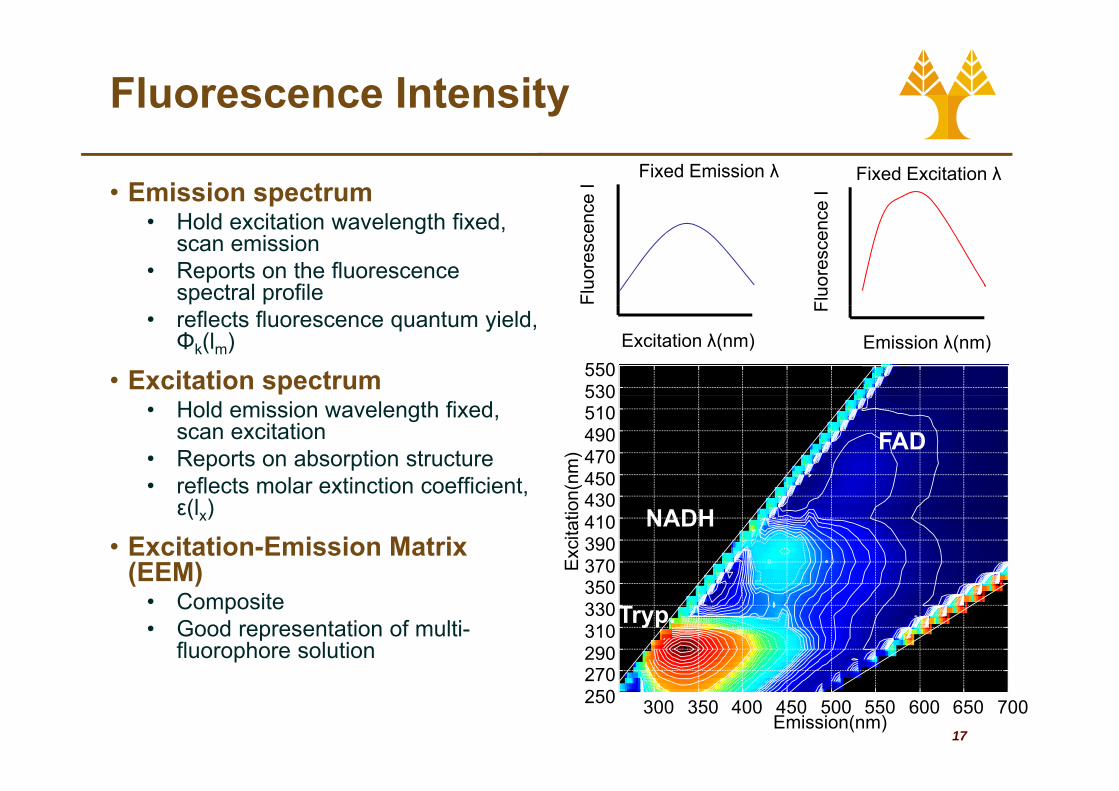
Fluorescence Intensity
• Emission spectrumH ld it ti l th fi d ce
Ι
Fixed Excitation λ
nce Ι Fixed Emission λ
• Hold excitation wavelength fixed, scan emission
• Reports on the fluorescence spectral profile Fl
uore
scen
c
Fluo
resc
en
• reflects fluorescence quantum yield, Φk(lm)
• Excitation spectrum
F
Emission λ(nm)Excitation λ(nm)
530550
• Hold emission wavelength fixed, scan excitation
• Reports on absorption structure • reflects molar extinction coefficient (n
m)
450470490510530
FAD
• reflects molar extinction coefficient, ε(lx)
• Excitation-Emission Matrix (EEM) E
xcita
tion(
370390410430
50
NADH
(EEM)• Composite• Good representation of multi-
fluorophore solution 290310330350
Tryp.
17Emission(nm)
300 350 400 450 500 550 600 650 700250270
Quenching, Bleaching & Saturation
• QuenchingQuenching • Excited molecules relax to ground states via
nonradiative pathways avoiding fluorescencenonradiative pathways avoiding fluorescence emission (vibration, collision, intersystem crossing)crossing)
• Molecular oxygen quenches by increasing the probability of intersystem crossingprobability of intersystem crossing
• Polar solvents such as water generally quench fluorescence by orienting around the exited state dipoles
18
Quenching, Bleaching & Saturation
• Photobleaching• Defined as the irreversible destruction of an excited
fluorophore• Photobleaching is not a big problem as long as the timePhotobleaching is not a big problem as long as the time
window for excitation is very short (a few hundred microseconds)
• Excitation Saturation• The rate of emission is dependent upon the time the
molecule remains within the excitation state (the excitedmolecule remains within the excitation state (the excited state lifetime �f)
• Optical saturation occurs when the rate of excitation e ceeds the reciprocal of �fexceeds the reciprocal of �f
• Molecules that remain in the excitation beam for extended periods have higher probability of interstate crossings and
19
p g p y gthus phosphorescence
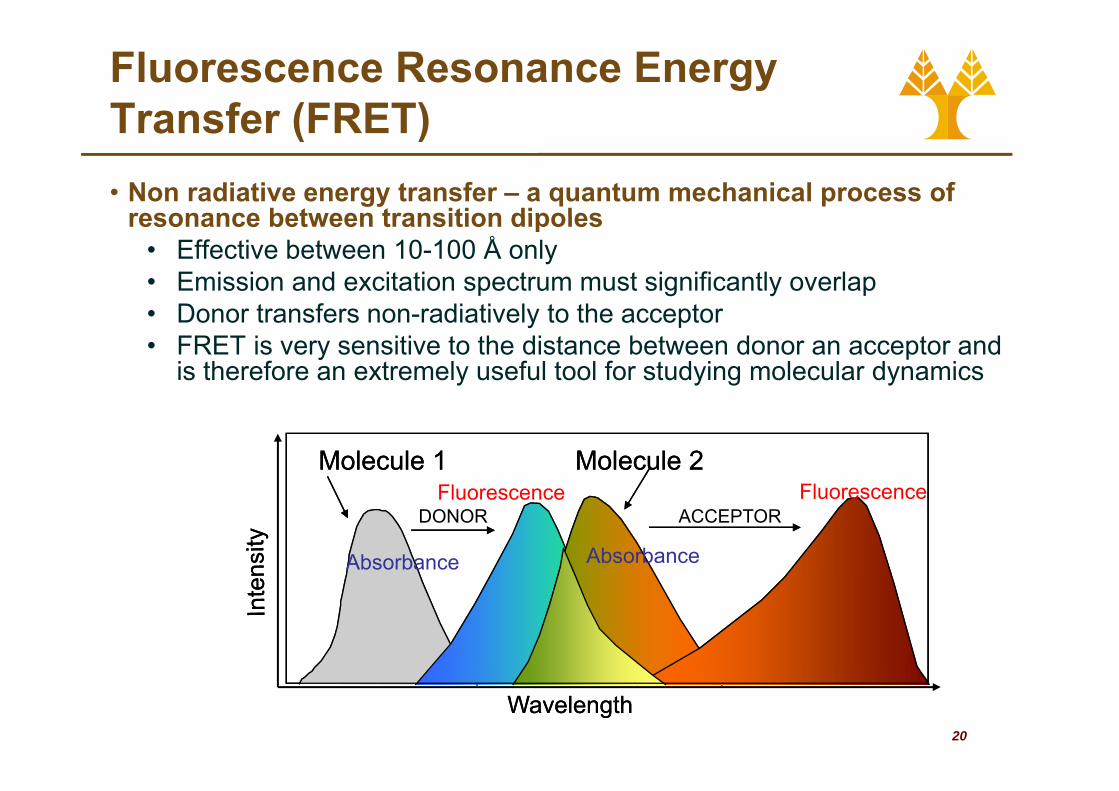
Fluorescence Resonance Energy Transfer (FRET)Transfer (FRET)• Non radiative energy transfer – a quantum mechanical process of
resonance between transition dipolesresonance between transition dipoles• Effective between 10-100 Å only• Emission and excitation spectrum must significantly overlap
D t f di ti l t th t• Donor transfers non-radiatively to the acceptor• FRET is very sensitive to the distance between donor an acceptor and
is therefore an extremely useful tool for studying molecular dynamics
Molecule 1 Molecule 2Fl Fl
Molecule 1 Molecule 2
DONOR ACCEPTOR
Absorbance Absorbance
Fluorescence Fluorescence
20
WavelengthWavelength
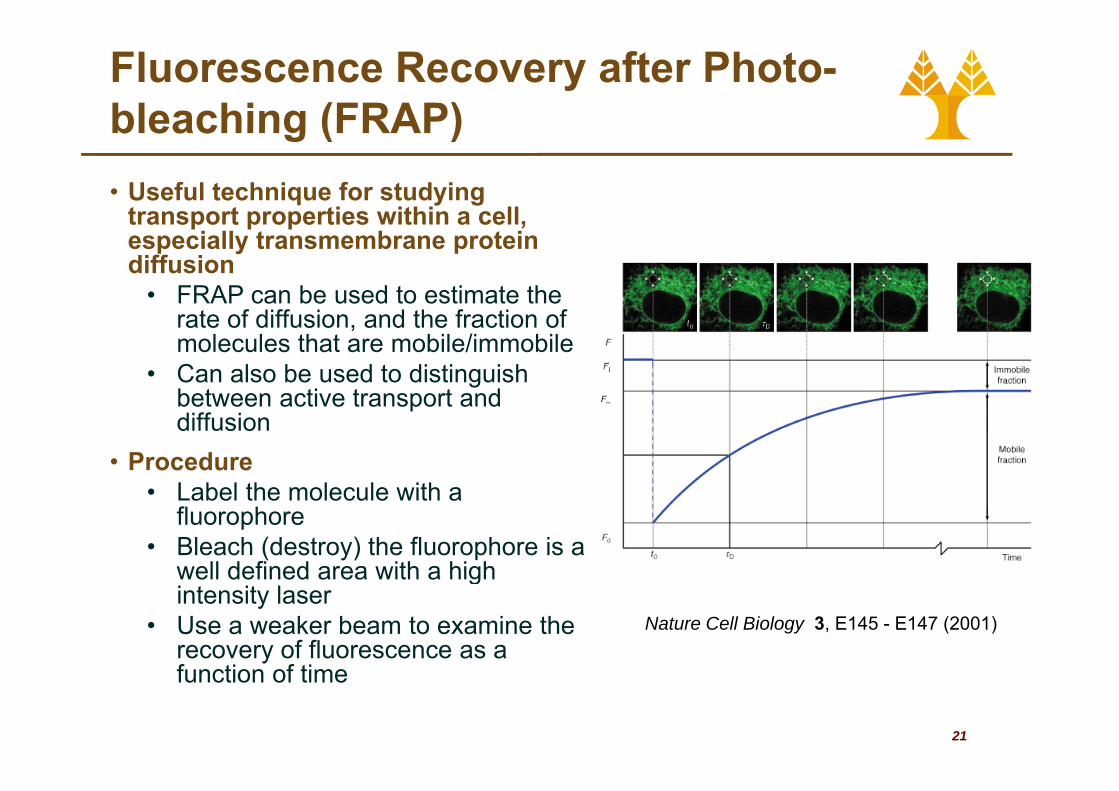
Fluorescence Recovery after Photo-bleaching (FRAP)bleaching (FRAP)• Useful technique for studying
transport properties within a celltransport properties within a cell, especially transmembrane protein diffusion
• FRAP can be used to estimate the rate of diffusion, and the fraction of molecules that are mobile/immobile
• Can also be used to distinguish between active transport andbetween active transport and diffusion
• ProcedureL b l th l l ith• Label the molecule with a fluorophore
• Bleach (destroy) the fluorophore is a well defined area with a highwell defined area with a high intensity laser
• Use a weaker beam to examine the recovery of fluorescence as a f ti f ti
Nature Cell Biology 3, E145 - E147 (2001)
21
function of time
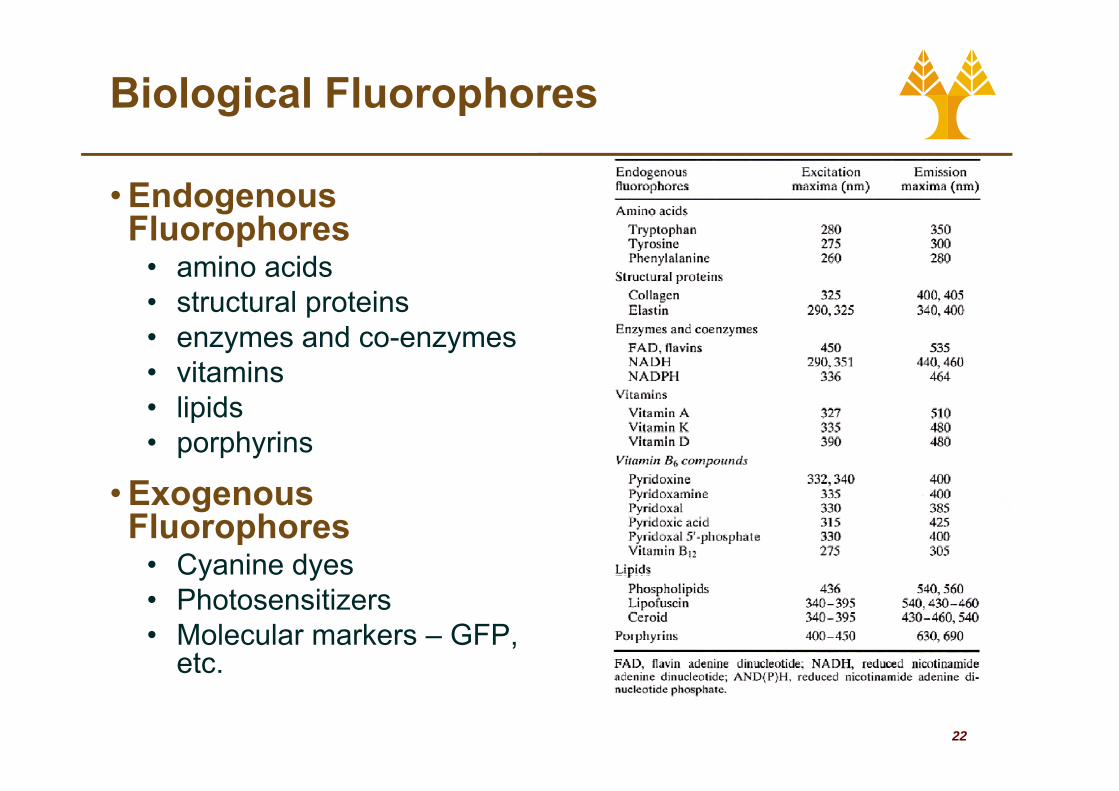
Biological Fluorophores
• Endogenous Fl hFluorophores
• amino acids• structural proteinsstructural proteins• enzymes and co-enzymes• vitamins• lipids• porphyrins
E• Exogenous Fluorophores
• Cyanine dyesy y• Photosensitizers• Molecular markers – GFP,
etc
22
etc.
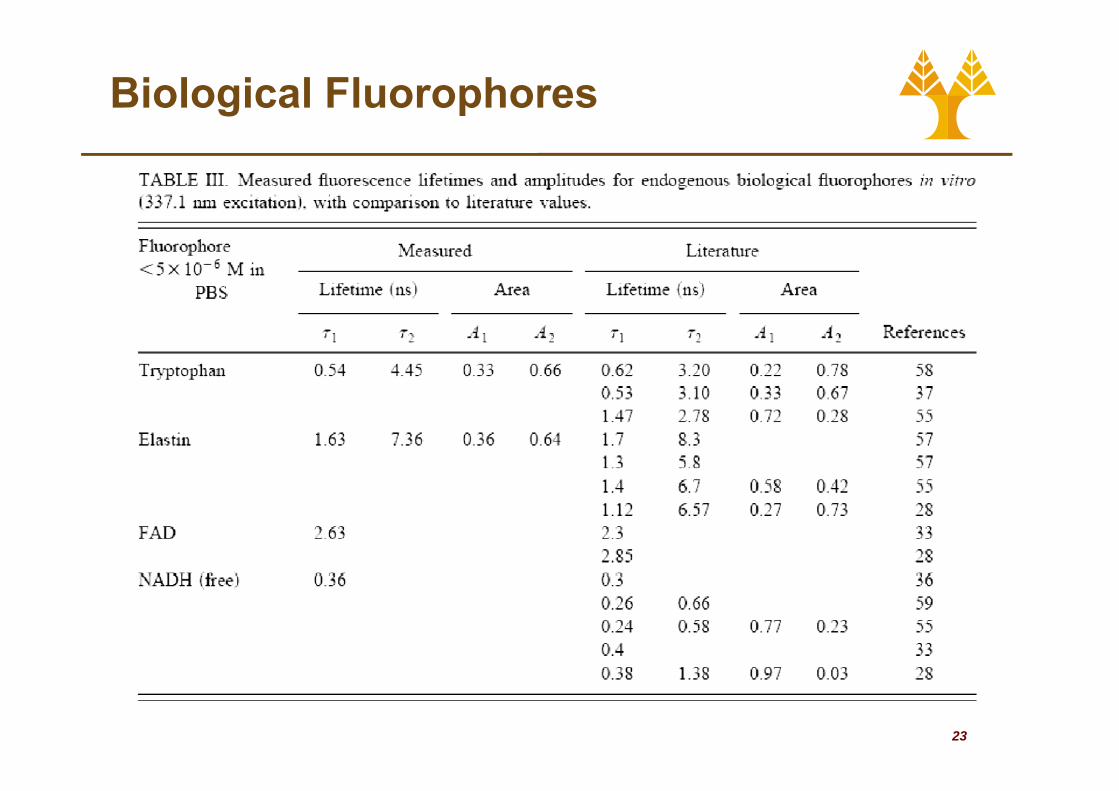
Biological Fluorophores
23
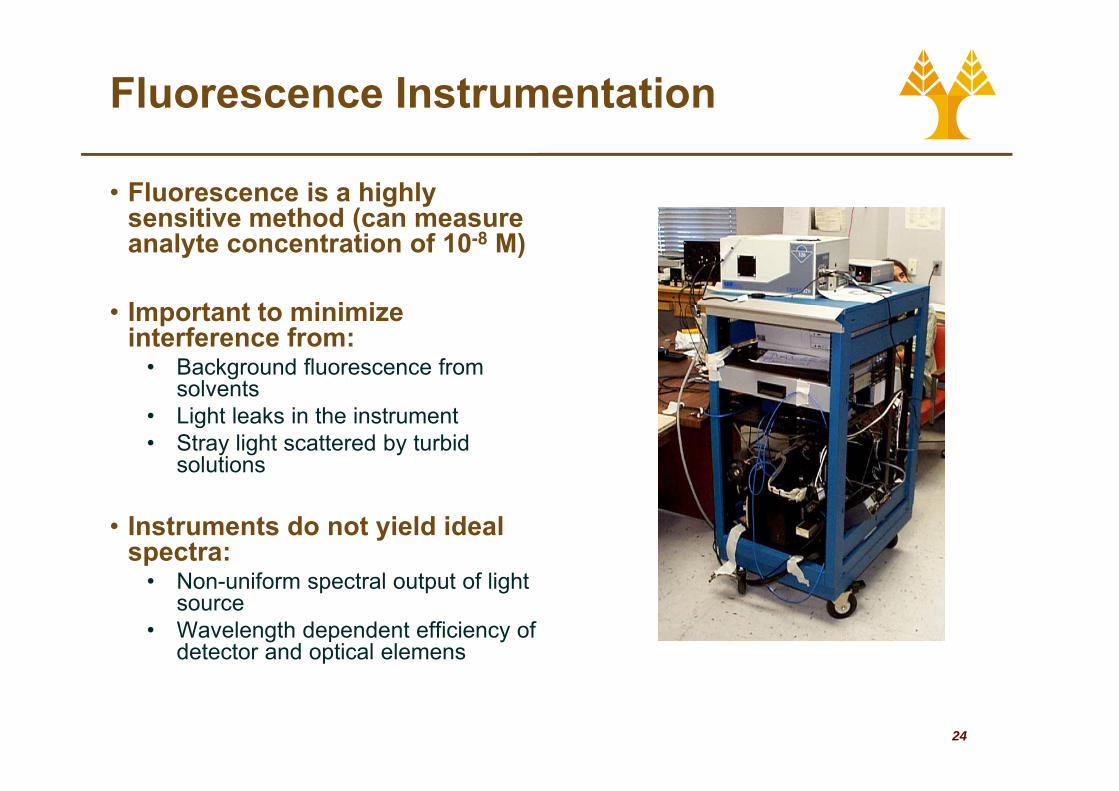
Fluorescence Instrumentation
• Fluorescence is a highly sensitive method (can measuresensitive method (can measure analyte concentration of 10-8 M)
I t t t i i i• Important to minimize interference from:
• Background fluorescence from solventssolvents
• Light leaks in the instrument• Stray light scattered by turbid
solutions
• Instruments do not yield ideal spectra:
N if t l t t f li ht• Non-uniform spectral output of light source
• Wavelength dependent efficiency of detector and optical elemens
24
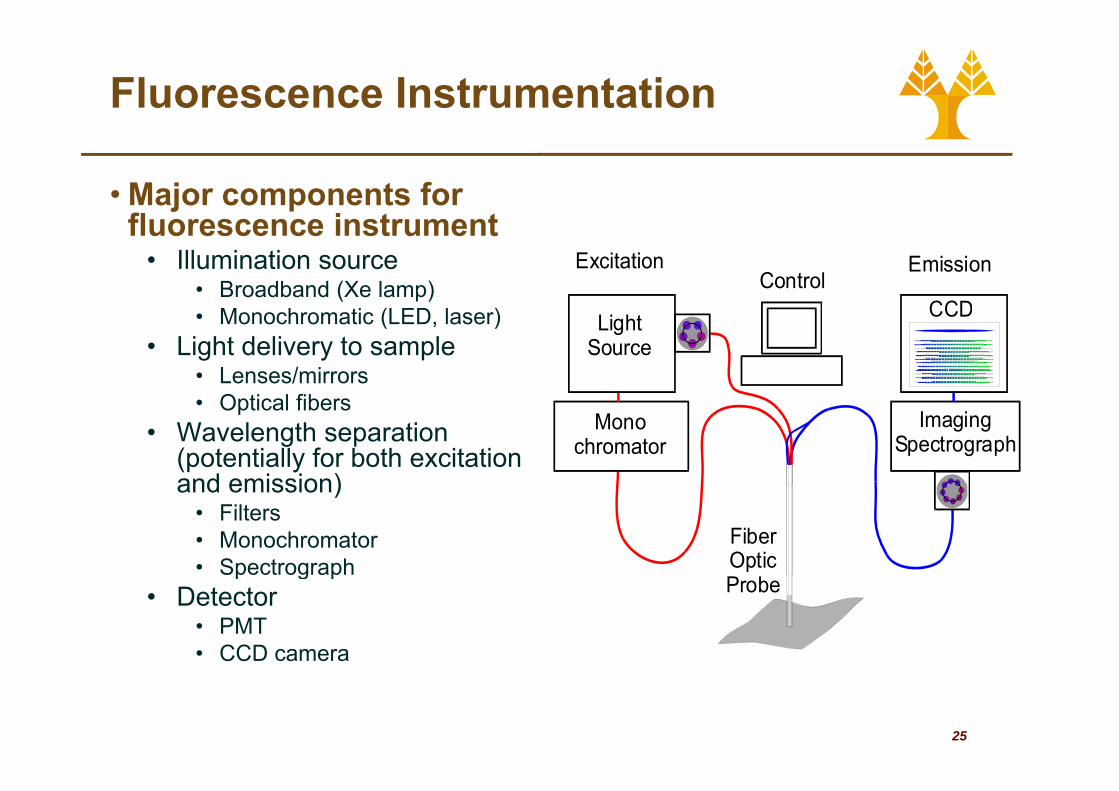
Fluorescence Instrumentation
• Major components for fl i t tfluorescence instrument
• Illumination source • Broadband (Xe lamp)
CCD
Excitation EmissionControl
• Monochromatic (LED, laser)• Light delivery to sample
• Lenses/mirrorsO ti l fib
Light Source
CCD
• Optical fibers• Wavelength separation
(potentially for both excitation and emission)
Monochromator
ImagingSpectrograph
and emission)• Filters• Monochromator• Spectrograph
Fiber Optic p g p
• Detector• PMT• CCD camera
Probe
25
Applications
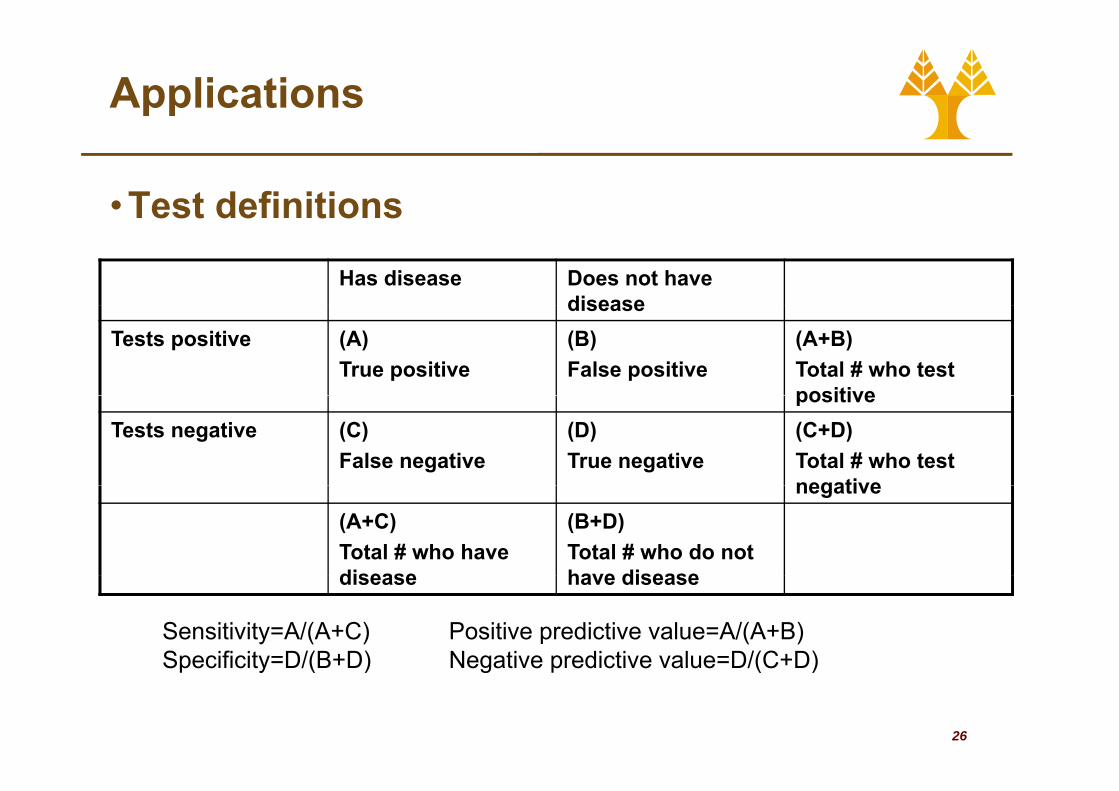
• Test definitionsTest definitions
Has disease Does not have diseasedisease
Tests positive (A)True positive
(B)False positive
(A+B)Total # who test positivepositive
Tests negative (C)False negative
(D)True negative
(C+D)Total # who test negativenegative
(A+C)Total # who have disease
(B+D)Total # who do not have disease
Sensitivity=A/(A+C)Specificity=D/(B+D)
Positive predictive value=A/(A+B)Negative predictive value=D/(C+D)
disease have disease
26
Specificity D/(B+D) Negative predictive value D/(C+D)
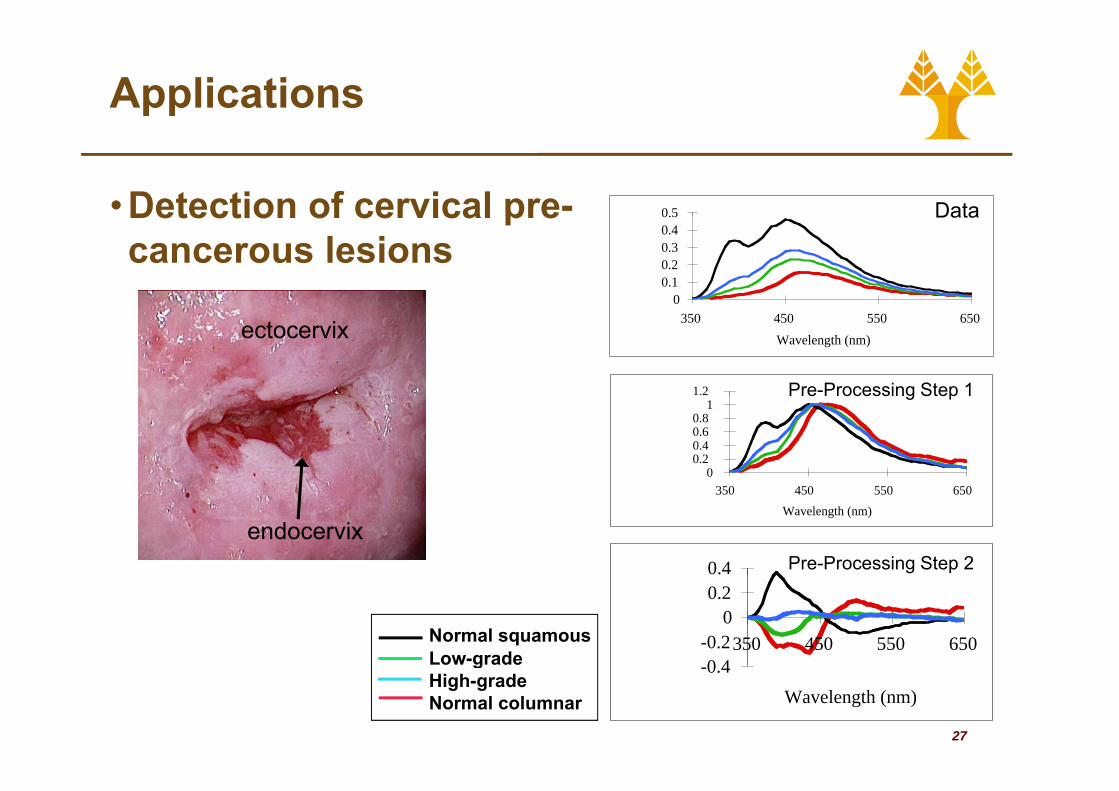
Applications
• Detection of cervical pre- 0.5 DataDetection of cervical precancerous lesions
00.10.20.30.40.5 Data
ectocervix 350 450 550 650Wavelength (nm)
1.2 Pre-Processing Step 1
00.20.40.60.8
1Pre Processing Step 1
endocervix
350 450 550 650Wavelength (nm)
0.4 Pre-Processing Step 2
0 4-0.2
00.2
350 450 550 650Normal squamousLow-grade
27
-0.4Wavelength (nm)
gHigh-gradeNormal columnar
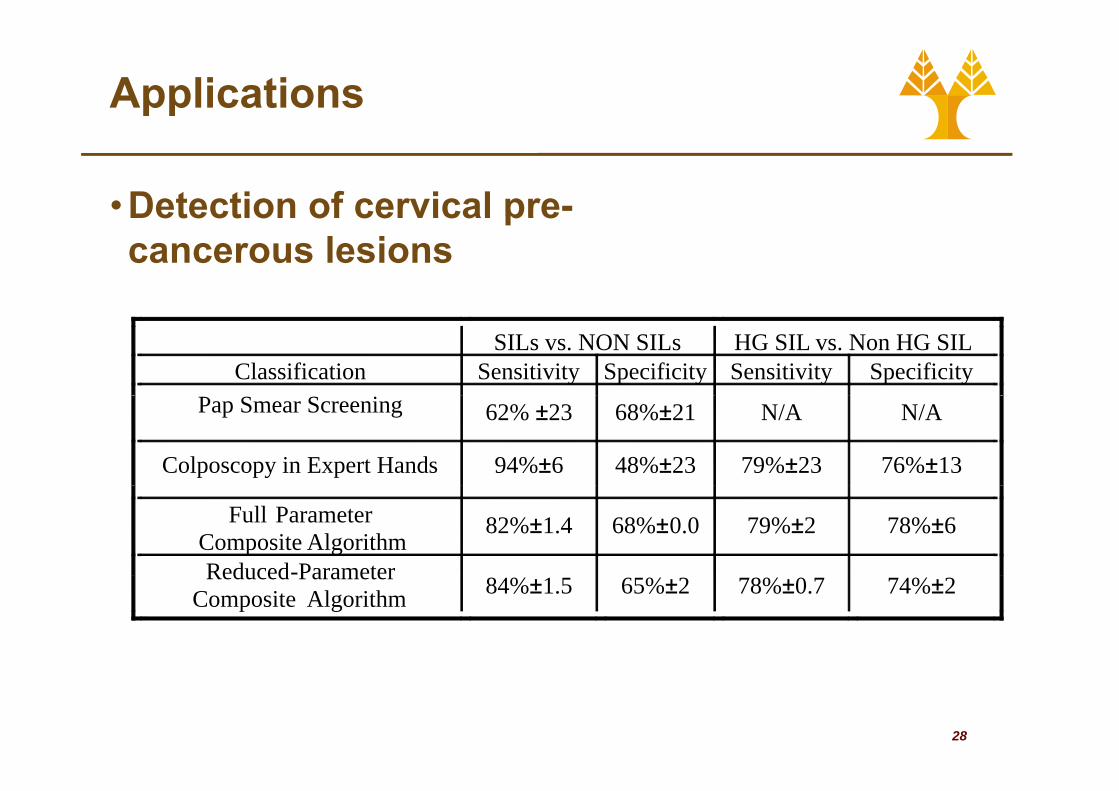
Applications
• Detection of cervical pre-Detection of cervical precancerous lesions
SILs vs. NON SILs HG SIL vs. Non HG SILClassification Sensitivity Specificity Sensitivity Specificity
Pap Smear Screening 62% ±23 68%±21 N/A N/A
Colposcopy in Expert Hands 94%±6 48%±23 79%±23 76%±13
Full ParameterComposite Algorithm
82%±1.4 68%±0.0 79%±2 78%±6
Reduced-ParameterReduced Parameter Composite Algorithm 84%±1.5 65%±2 78%±0.7 74%±2
28
Applications
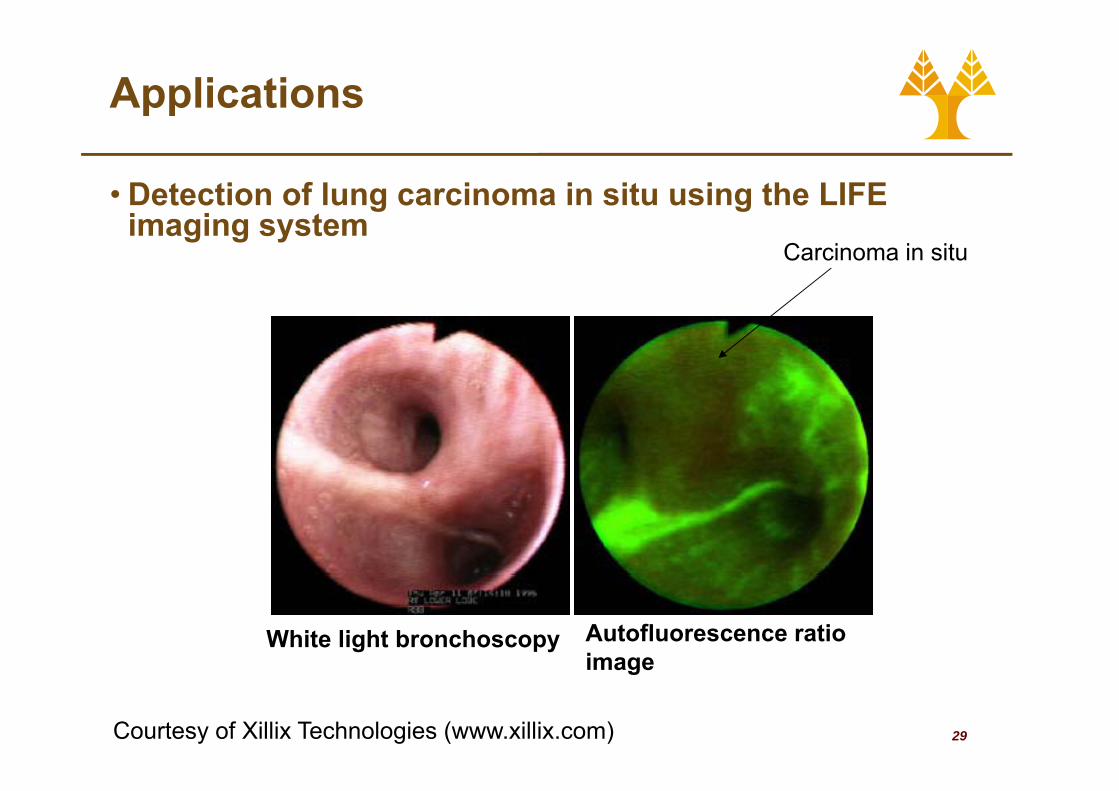
• Detection of lung carcinoma in situ using the LIFE i i timaging system
Carcinoma in situ
White light bronchoscopy Autofluorescence ratioimage
29Courtesy of Xillix Technologies (www.xillix.com)
image
Applications
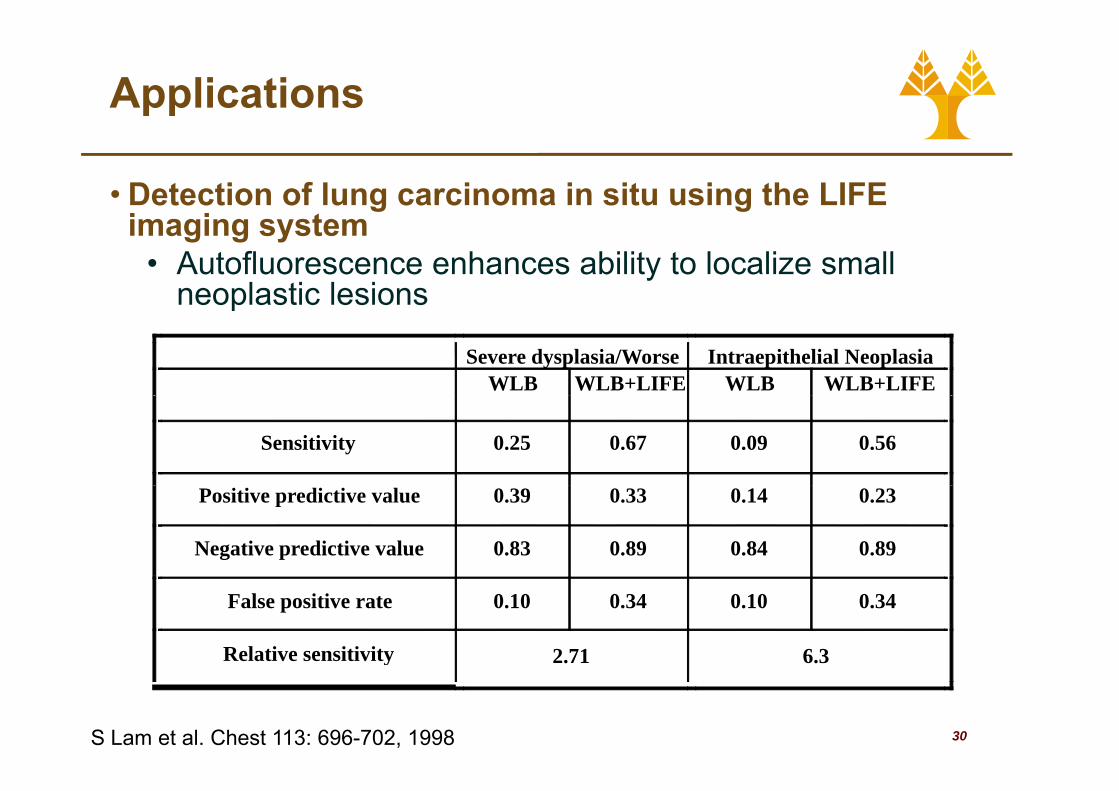
• Detection of lung carcinoma in situ using the LIFE i i timaging system
• Autofluorescence enhances ability to localize small neoplastic lesionsp
Severe dysplasia/Worse Intraepithelial NeoplasiaWLB WLB+LIFE WLB WLB+LIFE
Sensitivity 0.25 0.67 0.09 0.56
Positive predictive value 0.39 0.33 0.14 0.23
Negative predictive value 0.83 0.89 0.84 0.89
False positive rate 0.10 0.34 0.10 0.34
Relative sensitivity 2.71 6.3
30
y
S Lam et al. Chest 113: 696-702, 1998
Applications
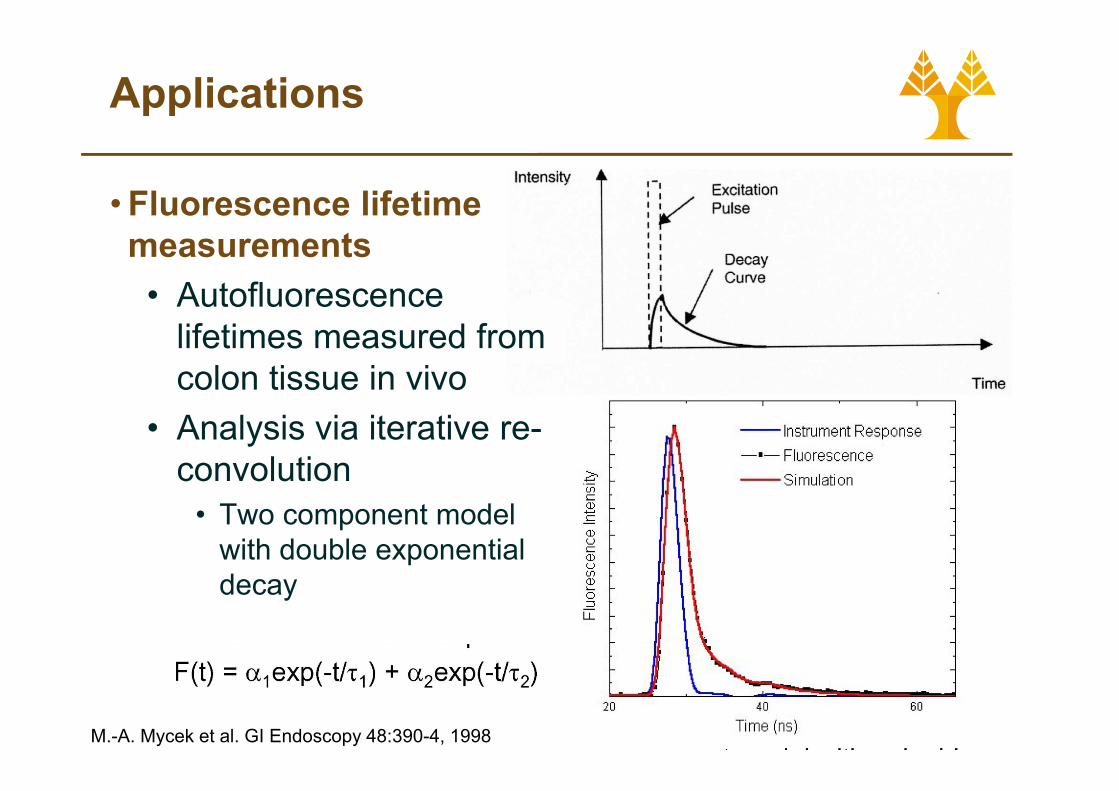
• Fluorescence lifetime measurements• AutofluorescenceAutofluorescence
lifetimes measured from colon tissue in vivo
• Analysis via iterative re-convolution
• Two component model with double exponential ddecay
•
31
•
M.-A. Mycek et al. GI Endoscopy 48:390-4, 1998
Applications
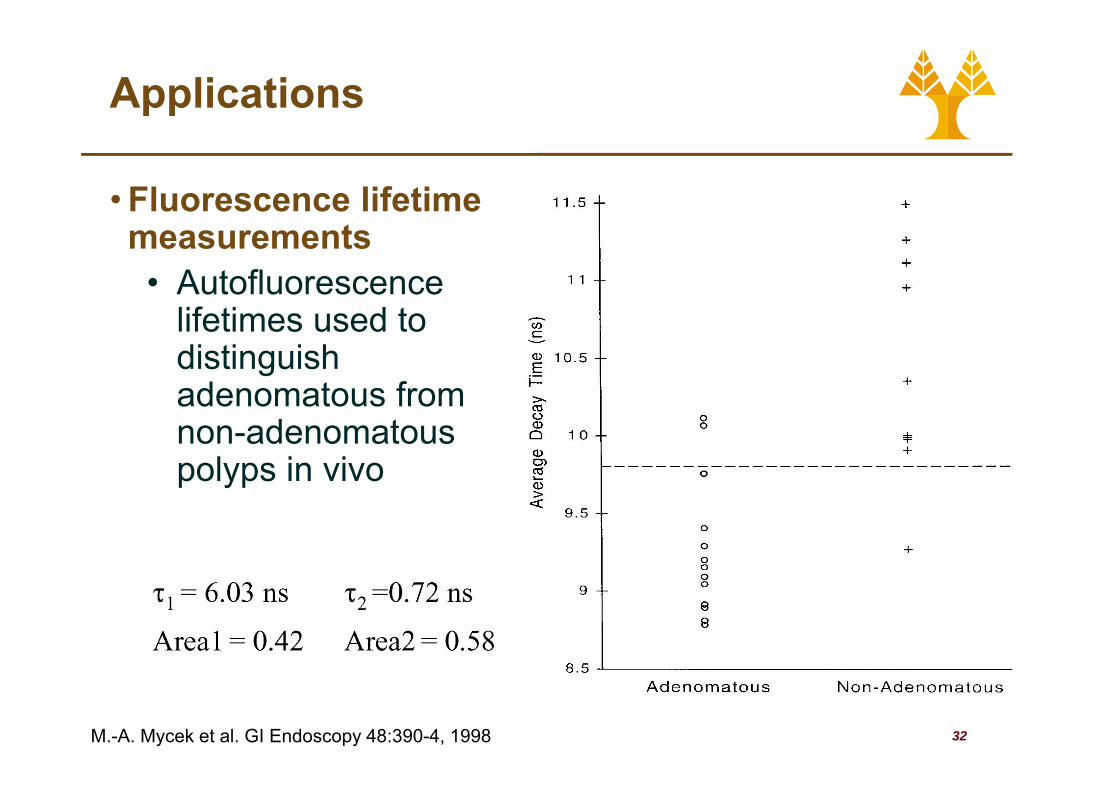
• Fluorescence lifetime measurements• Autofluorescence
lifetimes used to distinguish adenomatous fromadenomatous from non-adenomatouspolyps in vivop yp
32M.-A. Mycek et al. GI Endoscopy 48:390-4, 1998