UNIVERSITA’ DEGLI STUDI DI PARMA - Cinecadspace-unipr.cineca.it/bitstream/1889/2247/3/PhD thesis...
71
UNIVERSITA’ DEGLI STUDI DI PARMA PhD Course in Molecular Biology and Pathology XXIV Cycle HYPOXIA-INDUCIBLE FACTOR (HIF)-1α AS A THERAPEUTICAL TARGET IN MYELOMA INDUCED ANGIOGENESIS AND BONE DESTRUCTION IN VITRO AND IN VIVO Coordinator: Chiar.ma Prof.ssa Valeria Dall’Asta Tutor: Chiar.mo Prof. Nicola Giuliani Candidate: Paola Storti
Transcript of UNIVERSITA’ DEGLI STUDI DI PARMA - Cinecadspace-unipr.cineca.it/bitstream/1889/2247/3/PhD thesis...
UNIVERSITA’ DEGLI STUDI DI PARMA
PhD Course in Molecular Biology and Pathology
XXIV Cycle
HYPOXIA-INDUCIBLE FACTOR (HIF)-1αααα
AS A THERAPEUTICAL TARGET IN MYELOMA
INDUCED ANGIOGENESIS AND BONE DESTRUCTION
IN VITRO AND IN VIVO
Coordinator: Chiar.ma Prof.ssa Valeria Dall’Asta
Tutor: Chiar.mo Prof. Nicola Giuliani
Candidate: Paola Storti

I
The research reported in this Doctoral Thesis is published in international scientific peer-
reviewed journal:
� HYPOXIA-INDUCIBLE FACTOR (HIF)-1α SUPPRESSION IN MYELOMA CELLS BLOCKS
TUMORAL GROWTH IN VIVO INHIBITING ANGIOGENESIS AND BONE DESTRUCTION.
Paola Storti, Marina Bolzoni, Gaetano Donofrio, Irma Airoldi, Daniela Guasco, Denise Toscani, Eugenia Martella, Mirca Lazzaretti, Cristina Mancini, Luca Agnelli, Ken Patrene, Sophie Maïga, Valentina Franceschi, Simona Colla, Judith Anderson, Antonino Neri, Martine Amiot, Franco Aversa, G. David Roodman, and Nicola Giuliani , Leukemia 2013 (accepted for pubblication)
PhD researches and studies of Dr. Paola Storti were funded by two research fellowships of the
University of Parma (Italy) and ParmAIL (Italy) and were conducted in the Department of
Clinical and Experimental Medicine of the University Of Parma.
II
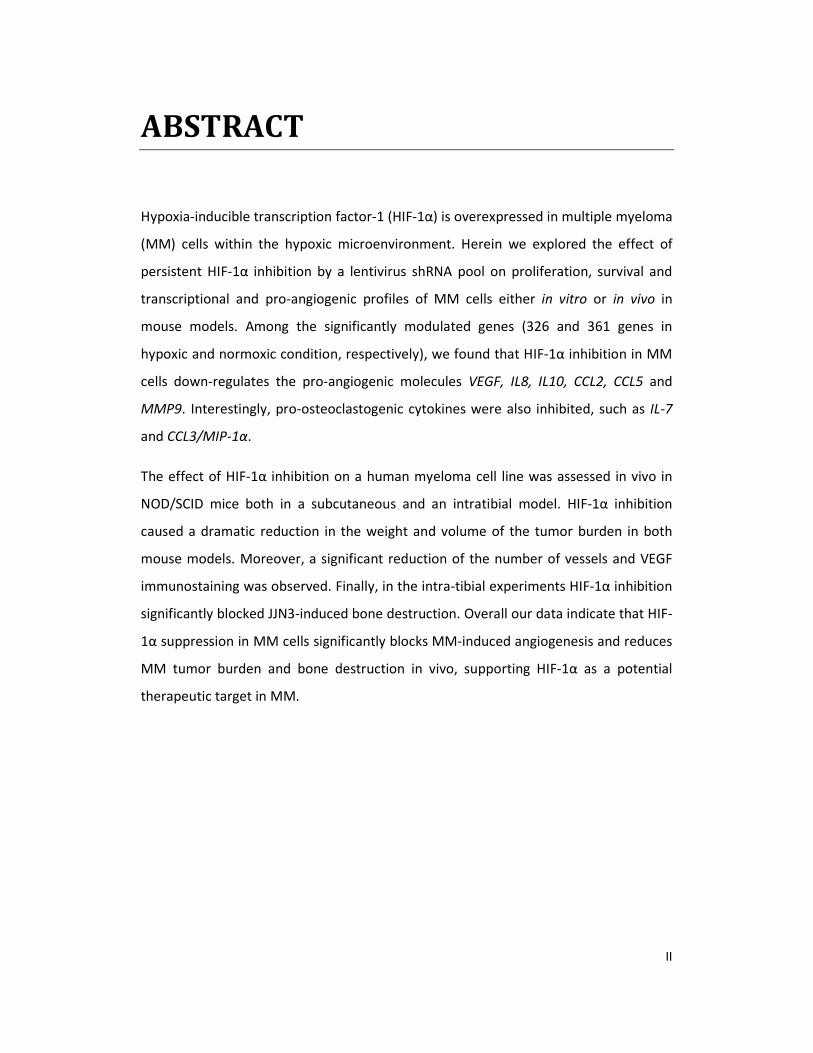
ABSTRACT
Hypoxia-inducible transcription factor-1 (HIF-1α) is overexpressed in multiple myeloma
(MM) cells within the hypoxic microenvironment. Herein we explored the effect of
persistent HIF-1α inhibition by a lentivirus shRNA pool on proliferation, survival and
transcriptional and pro-angiogenic profiles of MM cells either in vitro or in vivo in
mouse models. Among the significantly modulated genes (326 and 361 genes in
hypoxic and normoxic condition, respectively), we found that HIF-1α inhibition in MM
cells down-regulates the pro-angiogenic molecules VEGF, IL8, IL10, CCL2, CCL5 and
MMP9. Interestingly, pro-osteoclastogenic cytokines were also inhibited, such as IL-7
and CCL3/MIP-1α.
The effect of HIF-1α inhibition on a human myeloma cell line was assessed in vivo in
NOD/SCID mice both in a subcutaneous and an intratibial model. HIF-1α inhibition
caused a dramatic reduction in the weight and volume of the tumor burden in both
mouse models. Moreover, a significant reduction of the number of vessels and VEGF
immunostaining was observed. Finally, in the intra-tibial experiments HIF-1α inhibition
significantly blocked JJN3-induced bone destruction. Overall our data indicate that HIF-
1α suppression in MM cells significantly blocks MM-induced angiogenesis and reduces
MM tumor burden and bone destruction in vivo, supporting HIF-1α as a potential
therapeutic target in MM.
III
TABLE OF CONTENT
1. Introduction............................................................................................................................... 1
1.1 Multiple Myeloma ............................................................................................................... 1
1.2 Physiopathology .................................................................................................................. 2
1.2.1 Genetic alterations ...................................................................................................... 2
1.2.2 Role and modifications of bone marrow microenvironment ...................................... 3
1.3 Osteolytic lesions ................................................................................................................ 5
1.4 Osteoclast activation in MM ............................................................................................... 6
1.5 Normal osteoblast biology and role in MM ........................................................................ 7
1.6 Multiple Myeloma and Angiogenesis .................................................................................. 9
1.6.1 Angiogenesis in Multiple Myeloma Patients ............................................................. 10
1.6.2 Production of Pro-angiogenic Factors by Myeloma Cells and the Microenvironment
................................................................................................................................................. 11
1.7 Hypoxia and Hypoxia-Inducible Factor-1 .......................................................................... 15
1.7.1 Hypoxia and Cancer .................................................................................................... 16
1.7.2 Hypoxia and Hypoxia-Inducible Factor-1 in Myeloma-Induced Angiogenesis ........... 18
2. AIM OF STUDY ......................................................................................................................... 20
3. MATERIALS AND METHODS .................................................................................................... 21
3.1 Cells and cell culture conditions ........................................................................................ 21
3.1.1 Cell lines ...................................................................................................................... 21
3.1.2 HIF-1α knock-down..................................................................................................... 21
3.1.3 Hypoxic and drugs treatments ................................................................................... 21
3.1.4 Cell proliferation and viability assays ......................................................................... 22
3.2 In vivo studies .................................................................................................................... 22
3.3 Gene expression profiling and microarray analysis .......................................................... 23
3.4 RNA isolation and reverse-transcriptase polymerase chain reaction (RT-PCR)
amplification............................................................................................................................ 24
3.5 Real time quantitative PCR and angiogenesis PCR array .................................................. 24
3.6 Western blot analysis ........................................................................................................ 25
3.7 HIF-1α activity .................................................................................................................. 26
3.8 ELISA assays ....................................................................................................................... 26
3.9 Histological and Immunohistochemical analysis............................................................... 26
4. RESULTS ................................................................................................................................... 28
4.1 Permanent HIF-1α silencing in HMCLs: effects on MM cell proliferation, survival and drug
sensitivity. ............................................................................................................................... 28
4.2 HIF-1α suppression affects the transcriptional profile of HMCLs: inhibitory effect on the
pro-angiogenic and pro-osteoclastogenic genes. ................................................................... 29
4.3 HIF-1α suppression in JJN3 cells blocks the growth of subcutaneous MM in SCID-NOD
mice and inhibits angiogenesis. .............................................................................................. 30
4.4 HIF-1α suppression in JJN3 cells blunts angiogenesis and bone destruction in an intra-
tibial mouse model. ................................................................................................................. 30
5. DISCUSSION ............................................................................................................................. 32
REFERENCES ................................................................................................................................ 35
TABLE AND FIGURES .................................................................................................................... 44
1
1. INTRODUCTION
1.1 Multiple Myeloma
Multiple Myeloma (MM) is the most common form of plasma cell dyscrasia, affecting B-cells
that have traversed the postgerminal center. It is characterized by clonal proliferation, in bone
marrow microenvironment, of malignant plasma cells that secrete a monoclonal
immunoglobulin called M-protein, usually IgG or IgA and detectable by serum protein
electrophoresis, or only circulating k or λ-free light chains.
Various distinct clinical phases of myeloma can be recognized, including monoclonal
gammopathy of undetermined significance (MGUS) and smoldering multiple myeloma (SMM;
also known as asymptomatic myeloma).1 Although both of these disease phases lack the
clinical features of MM they share some of the genetic features of myelomas that require
treatment, supporting a multistep development model where MGUS progresses to smoldering
myeloma and finally to symptomatic intramedullary MM.2 Then, during the progression of the
disease clonal cells develop the ability to proliferate at sites outside of the bone marrow,
manifesting as extramedullary myeloma and plasma cell leukaemia. These cells constitute the
end stages in the multistep transformation process from normal to malignant plasma cells.3,
Symptomatic MM is characterized by a high capacity to induce osteolytic bone lesions because
of an increased bone resorption and deacresed bone formation, which result in bone pain,
pathological fractures, spinal cord compression and hypercalcemia; others symptoms include
myelosuppression, immunosuppression and renal failure.4
2
1.2 Physiopathology
In the last few years many studies have focalized their attention on biological and
physiopathological features of MM to better understand the mechanism involved in the
disease and to identify new possible therapeutic targets. The basic premise underlying the
initiation and progression of myeloma is that multiple mutations in different pathways
deregulate the intrinsic biology of the plasma cell, changing it in ways that generate the
features of myeloma.5 Various evidences suggest that in MM pathology we can distinguish two
major moments: primary, the acquisition of chromosomic aberrations by plasma cells,
secondary, microenviroment modification leading to neoangiogenesis process and to an
increased bone resorption.
1.2.1 Genetic alterations
Several genetic abnormalities that occur in tumor plasma cells play major roles in the
pathogenesis of multiple myeloma.6 Some of these alterations are already detectable at MGUS
level while others arise later, supporting, also in this case, a multistep development of MM.
Primary early translocations involving the immunoglobulin switch region on chromosome 14
(q32.33) are a genetic hallmark of myeloma and are mediated by errors in IgH switch
recombination during B-cell development in germinal centers. As a consequence of these
chromosomal translocations, the proto-oncogenes located on the partners chromosome of 14
(q32.33) are placed under the control of the strong enhancers of the Ig loci, leading to their
deregulation:7,8
t(11;14)(q13;q32) and t(6;14)(p21;q32) induce, respectively, overexpression of cyclin D1 and
cyclin D3 both implicated in cell cycle.
t(4;14)(p16.3;q32) deregulates the multiple myeloma SET domain (MMSET; also known as
WHSC1) and leads to the inhibition of fibroblast growth factor receptor 3 (FGFR3) inducing
plasma cells differentiation and apoptosis.
t(14;16)(q32;q23) dysregulates the oncogene MAF, a transcription factor that promotes MM
proliferation and increases myeloma cells adhesion to bone marrow stromal cells.
3
Many studies have highlighted that chromosomal translocations represent an important
prognostic value in multiple myeloma: t(14;16) and t(4;14) are associated with a poor
prognosis, whereas a better prognosis is observed in patients carrying the t(11;14).
1.2.2 Role and modifications of bone marrow microenvironment
Bone marrow microenvironment modifications play a key role in the pathogenesis of MM and
they are implicated in the growth, survival and migration of malignant plasma cells. Although
the BM microenvironment is commonly referred to as the “non-tumor” entity, it has to be kept
in mind that it is a complex network including a broad range of cells and factors. Indeed, the
BM microenvironment consist of three components: the cellular component, including
hematopoietic stem cells (HSCs), erythroid cells, immune cells, as well as bone marrow stromal
cells (BMSC) like mesenchymal stem cells (MSCs), marrow adipocytes, fibroblasts, osteoblasts,
osteoclasts and endothelial cells; the extracellular matrix (ECM) component (fibrous proteins,
proteoglycans, glycosaminoglycans) and the soluble component (cytokines, growth factors and
adhesion molecules).9
Malignant plasma cells interact with BM cells and ECM cells inducing microenvironment
modifications that, viceversa, support the growth and survival of myeloma cells (Figure 1).
These interactions are mediated through cell-surface receptors such as integrins, cadherins,
selectins and cell-adhesion molecules, which not only support the survival of the myeloma
clone but also mediate drug resistance, a process termed cell-adhesion-mediated drug
resistance (CAMDR).10
Furthermore the adhesion of myeloma cells to hematopoietic and
stromal cells induces the secretion of cytokines and growth factors whereas the adhesion of
MM cells to extracellular matrix proteins triggers the up-regulation of cell-cycle regulatory
proteins and anti-apoptotic proteins.11
The most frequently cytokines involved are:
� Interleukin-6 (IL-6)
� Insuline-like growth factor-1 (IGF-1)
� Fibroblast growth factor (FGF)
� Vascular endothelial growth factor (VEGF)
� Interleukin-1β (IL-1 β)
� Transforming growth factor β (TGF-β)
� Hepatocyte growth factor (HGF)
4
As previously described, cell-to-cell interactions play a fundamental role in the
physiopathology of MM. The main adhesion molecules involved are:
� β1-integrins: VLA-1 (very late antigen-1), VLA-4, VLA-5
� β2-integrins: LFA-1 (lymphocyte function-associated antigen-1)
� Immunoglobulin superfamily: NCAM (neural cell adhesion molecule), VCAM-1
(vascular cell adhesion molecule), ICAM-1 (intercellular cell adhesion molecule-1),
ICAM-2, ICAM-3
� CD44
� Syndecan-1 (CD138)
� Collagen-1 binding protein
� MCP-1 (monocyte chemotactic protein-1)
� CD21
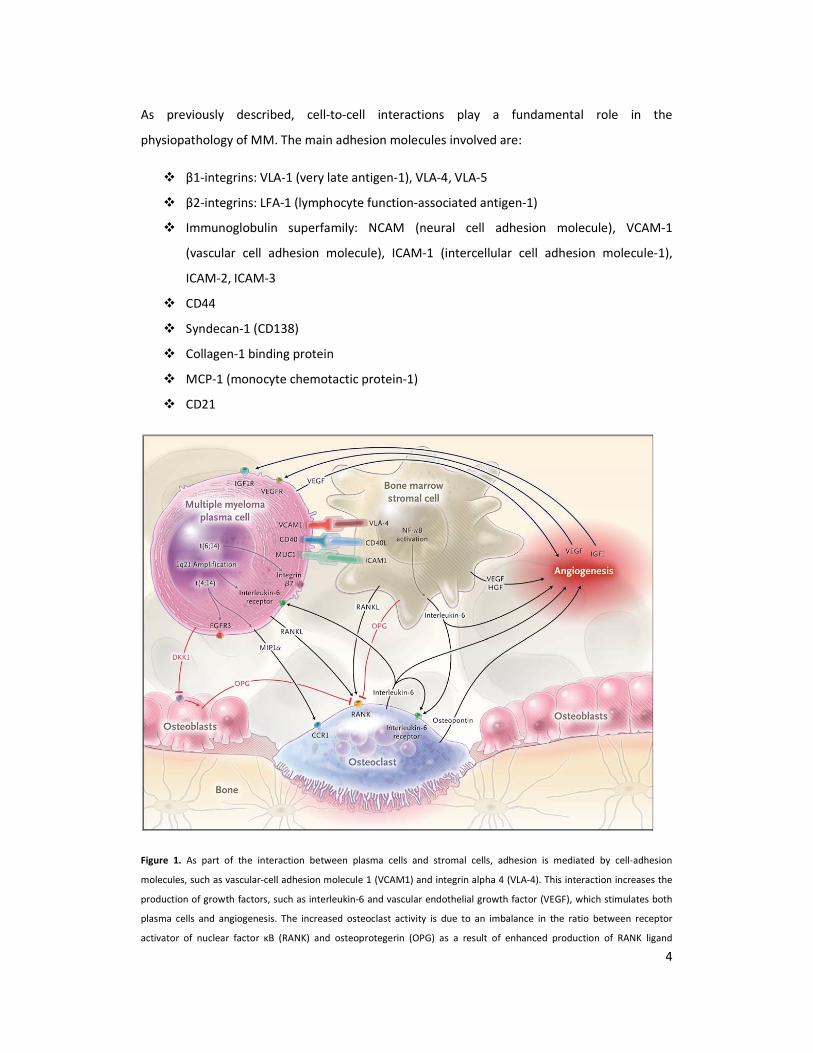
Figure 1. As part of the interaction between plasma cells and stromal cells, adhesion is mediated by cell-adhesion
molecules, such as vascular-cell adhesion molecule 1 (VCAM1) and integrin alpha 4 (VLA-4). This interaction increases the
production of growth factors, such as interleukin-6 and vascular endothelial growth factor (VEGF), which stimulates both
plasma cells and angiogenesis. The increased osteoclast activity is due to an imbalance in the ratio between receptor
activator of nuclear factor κB (RANK) and osteoprotegerin (OPG) as a result of enhanced production of RANK ligand
5
(RANKL) and reduced production of OPG. Osteoblast activity is also suppressed by the production of dickkopf homolog 1
(DKK1) by plasma cells. Moreover, plasma cells can inhibit a key transcription factor for osteoblasts, runt-related
transcription factor 2, causing a reduction in differentiation from precursors to mature osteoblasts. The adhesion of
plasma cells to stromal cells up-regulates many cytokines with angiogenic activity, in particular interleukin-6 and VEGF.
Osteoclasts that are ac- tivated by stromal cells can also sustain angiogenesis by secreting osteopontin. Chromosomal
abnormalities can cause overproduction of receptors on myeloma cells. The 1q21 amplification causes an increase in
interleukin-6 receptor and consequently an increase in growth mediated by interleukin-6. CCR1 denotes chemokine
receptor 1, CD40L (or CD40LG) CD40 ligand, FGFR3 fibroblast growth factor receptor 3, HGF hepatocyte growth factor,
ICAM1 intercellular adhesion molecule 1, IGF1 insulin-like growth factor 1, MIP1α macrophage inflammatory protein 1α,
MUC1 cell-surface–associated mucin 1, and NF-κB nuclear factor κB.
1.3 Osteolytic lesions
In the normal adult, bone is continuously destroyed and rebuilt to maintain calcium/phosphate
homeostasis, control bone volume in response to mechanical load, and in fracture healing. On
a cellular level, bone homeostasis is regulated by the function of osteoclast (OC) and
osteoblast (OB), which mediate bone resorption and formation, respectively.
Osteoclasts are derived from hematopoietic cells in the monocyte/macrophage lineage and
are the bone-resorbing cells. Osteoclast precursors fuse to form multinucleated cells, which
then differentiate to have bone-resorbing capacity.
Osteoblasts are derived from an undifferentiated, pluripotent mesenchymal cell, which can
also give rise to chondrocytes, myocytes, or adipocytes.
Bone formation results from the following sequence of events: stimulus (e.g. mechanical load),
stimulation of stromal cells, osteoclastogenesis, bone resorption, osteoblastogenesis, and
finally bone formation.12
Bone disease is a hallmark of multiple myeloma. Histomorphometric studies have
demonstrated that in MM patients with bone lesions there is uncoupled or severely
imbalanced bone remodeling with increased bone resorption and decreased or absent bone
formation.13
In contrast, MM patients without bone lesions display balanced bone remodeling
with increased osteclastogenesis and normal or increased bone formation rate.14
Furthermore,
histologic studies of bone biopsies from patients with MM show that increased OCL activity
6
occurs mainly adjacent to myeloma cells, suggesting that local factors rather than systemic
mechanism are involved in the pathogenesis of osteolytic lesions.15,16
1.4 Osteoclast activation in MM
Adhesive interactions between marrow stromal cells and myeloma cells play a critical role in
the bone destructive process. When MM cells home to the marrow, they adhere to bone
marrow stromal cells through binding of VCAM-1 on stromal cells and α4β1 integrin on MM
cells. These adhesive interactions increase production of a multiplicity of factors, called
osteoclast-activating factor (OAFs), including TNF-α, IL-1, IL-3,IL-6, IL-11, MIP-1α, SDF-1α,
which enhance OCL formation.17,18
However, the major event seems to be the deregulation of
the (OPG)/RANK/RANKL signaling pathway that is a critical component of the normal and
malignant bone remodeling process.
RANK (receptor activator of NF-kβ) is a transmembrane signaling receptor, which is a member
of the tumor necrosis receptor superfamily and is found on the surface of OCL precursors.
It has been demonstrated that stromal/osteoblastic cells express RANKL in response either to
systemic factors such as PTH, dexamethasone and vitamin D3 or local osteoclastogenic
cytokines IL-1, TNF and IL-11.19,20
RANKL (RANK Ligand) directly induces osteoclastogenesis
together with M-CSF and inhibits osteoclast apoptosis by binding to its specific receptor
RANK.21,22,23
It has been suggested that activated T- lymphocytes, other than
stromal/osteoblastic cells, produce RANKL and may maintain bone homeostasis through the
cross-talk between RANKL production and interferon-γ (IFN-γ) secretion.24
OPG (osteoprotegerin) is a soluble decoy receptor produced by stromal cells and osteoblasts,
which antagonizes the effect of RANKL on osteoclastic cells inhibiting bone resorption.25,26
Indeed, it has been shown that OPG binds RANKL and prevents the interaction of RANKL with
RANK thereby blocking osteoclast formation. Other evidences have demonstrated that RANKL
is not expressed, or directly produced, by human MM cells. It seems that human myeloma cells
induce RANKL expression in stromal cells and they decrease OPG expression and secretion by
osteoblastic cells, inducing an imbalance of OPG/RANKL ratio in favor of RANKL.27,28,29,
Furthermore it has been shown that circulating levels of OPG and RANKL correlate with both
7
clinical activity of MM, severity of bone disease and poor prognosis. On the other side RANKL
does not have a direct effect on MM cells proliferation and survival, because of the lack of
RANK on myeloma cells, even though it may contribute to myeloma cell stimulation via
induction of IL-6 in the BM microenvironment.30
The cell-to-cell contact, particularly mediated
by VLA-4/VCAM-1 integrin system is critical in the induction of RANKL in human BMSC by
myeloma cells, as demonstrated by the lack of effect on RANKL in transwell system without
cellular contact. However, RANKL is not the only OCL stimulating factor involved in multiple
myeloma.
MIP-1α is a chemokine that is directly produced by malignant plasma cells in the majority of
MM patients and acts as a potent inducer of OCL formation. This factor can increase OCL
formation31
independently of RANKL and can enhance both RANKL and IL-6 stimulated OCL
formation. Further, it has been reported that elevated serum levels of MIP-1α portended an
extremely poor prognosis in MM.32
In addition MIP-1α also plays an important role in
lodgment of MM cells in the bone marrow. This chemokine increases adhesive interaction
between myeloma cells and marrow stromal cells by increasing expression of β1 integrins on
MM cells. This results in increased production of RANKL, IL-6, VEGF and TNFα by marrow
stromal cells, which further enhances MM cell growth, angiogenesis and bone destruction.33
IL-3, in addition to RANKL and MIP-1α, is also significantly elevated in bone marrow plasma of
MM patients as compared to normal controls. Interleukin-3 can induce OCL formation in
human bone marrow cultures at levels similar to those measured in MM patients and OCL
formation induced by marrow plasma from MM patients can be inhibited using a blocking
antibody to IL-3. Finally, IL-3 also can enhance the effects of RANKL and MIP-1α on the growth
and development of OCLs as well as stimulates myeloma cell growth.34
1.5 Normal osteoblast biology and role in MM
In addition to increased OCL activity, osteoblast activity is markedly suppressed in MM.35
In
fact, even if in the early stages of MM an increased recruitment and activity of osteoblasts are
observed, the later stages are characterized by a significant reduction in the OB cells number
leading to a decline of osteolytic bone lesions. This is supported by clinical studies showing
8
that MM patients with bone lesions have reduced bone formation markers, such as alkaline
phosphatase (ALP) and osteocalcin (OCN), together with the increased bone resorption
markers. Similarly, marked osteoblastopenia and reduced bone formation have also been
reported in murine models of MM that develop bone lesions.36
These data suggest that
myeloma cells are able to suppress osteoblasts and thereby inhibit bone formation.
In the last few years, signaling pathways involved in osteoblastic differentiation have been
identified, which provide a better understanding of how osteoblast activity is inhibited in MM.
The osteoblastic lineage cells that mediate bone formation comprise the following
phenotypes: mesenchimal stem cells that give rise to osteoprogenitor cells as well as the cells
of other lineage; osteoprogenitor cells that contribute to maintain the osteoblast population
and bone mass; pre-osteoblasts, cells that have started differentiation process but not yet
synthetize bone matrix; osteoblasts that synthetize the bone matrix on bone forming surfaces;
osteocytes, organized throughout the mineralized bone matrix that support bone structure;
and the lining cells that protect the bone surface. So, OBs originate from MSCs and are
responsible for bone matrix synthesis by secreting collagen, which form strands called
osteoids.37
Osteoblasts cause calcium salts and phosphorus to precipitate from the blood and
bond with the newly formed osteoid to mineralize the bone tissue. As new bone layers form,
osteoblasts become trapped in the osteoids and differentiate into osteocytes.
Under physiological conditions, the osteogenic differentiation of MSCs is tightly regulated
either by system hormones, such as parathyroid hormone (PTH), estrogens, and
glucocorticoids or by local growth factors, including the bone morphogenetic protein (BMP)
family, TGF-β, and FGF-2.38
Moreover, these factors activate specific intracellular signal
pathways that modify the expression and activity of several transcription factors in
mesenchymal and osteoprogenitor cells, which result in osteoblastic differentiation.39
Subsequently, they exit mitosis, transit to express genes such as alkaline phosphatase (ALP),
bone sialoprotein (BSP) and type I collagen, as they commence to produce and mature
osteogenic extracellular matrix. Finally, they express genes involved in mineralization of the
extracellular matrix such as osteocalcin, osteopontin. This highly regulated program of gene
expression and cellular differentiation is governed by the expression and activity of different
transcription factors. These factors do not act alone but interact with each other to integrate
diverse signals and fine-tune gene expression.40
9
Runt-related transcription factor 2 (Runx2), also named Cbfa1 or AML3, is the major
transcription factor regulating osteoblast commitment and osteogenic differentiation of
mesenchymal cells. This has been demonstrated in Runx2/Cbfa1-deficient mice, which
completely lack osteoblasts and bone formation.41,42,
The potential involvement of Runx2/Cbfa1-mediated transcription in MM-induced osteoblast
inhibition has recently been reported. When human MM cells were co-cultured with
osteoprogenitor cells, they inhibited osteoblast differentiation in long-term bone marrow
cultures, reducing the number of both early osteoblast precursors, CFU-F, and the more
differentiated osteoblast precursor, the colony forming units-osteoblast (CFU-OB).43
This effect
was mediated by blocking Runx2/Cbfa1 activity in human osteoprogenitor cells. In addition,
since Runx2/Cbfa1 stimulates secretion of the RANKL decoy receptor, OPG, in osteoprogenitor
cells, it is possible that inhibition of Runx2/Cbfa1 activity also increases osteoclastogenesis.44
The interaction between Runx2/Cbfa1 and MM cells is mediated both by cell-to-cell interaction
between MM cells and osteoprogenitors and soluble factors produced by myeloma cells
Interleukin-7 decreases Runx2/Cbfa-1 promoter activity in osteoblastic cells and the expression
of osteoblast markers. Moreover, IL-7 can inhibit bone formation in vivo in mice, as well as
both CFU-F and CFU-OB formation in human bone marrow cultures, and finally reduces
Runx2/Cbfa1 activity in human osteoprogenitor cells. The potential involvement of IL-7 in MM
has been supported by the demonstration of higher IL-7 plasma levels in MM patients
compared with healthy subjects and by the capacity of blocking antibodies to IL-7 to partially
blunt the inhibitory effects of MM cells on osteoblast differentiation.45,46
In addition, other
soluble factors are involved in MM-induced osteoblast suppression like IL3, HGF and TNF-α
47,48,49.
1.6 Multiple Myeloma and Angiogenesis
Angiogenesis refers to the process of new blood vessel formation from a pre-existing
vasculature which occurs in either physiological or pathological conditions.50,51
Angiogenesis
develops in a multi-step process comprising perivascular detachment of existing vessels, matrix
degradation, migration of EC and formation of a functional vascular plexus which is supported
10
by perivascular apposition of pericytes and basement membrane constituents.52,53
Tumor
angiogenesis develops through the same steps but shows markedly increased proliferative
activity of EC and has significant functional and structural differences in the vascular plexus 54,55
In solid tumours angiogenesis is well characterized as a critical step for growth, invasion and
metastasis.55
The ‘‘angiogenic switch’’, i.e. the transition from an avascular to a vascular phase
of tumour growth is caused by an imbalance of pro- and anti-angiogenic factors in the tumour
microenvironment. 56,57
In the last years, increased angiogenesis has been demonstrated in the bone marrow (BM)
microenvironment in hematologic malignancies, including multiple myeloma (MM), suggesting
a potential pathophysiologic role for angiogenesis in MM. MM is a plasma cell malignancy
characterized by a tight relationship between tumor cells and the BM microenvironment that
supports myeloma cell growth and survival 58,59
. In MM, as in solid tumors, disease progression
is characterized by a pre-angiogenic stage of slow tumor progression followed by an
angiogenic switch and a subsequent angiogenic stage associated with progressive tumor
growth 60
.
1.6.1 Angiogenesis in Multiple Myeloma Patients
Increased BM angiogenesis in patients MM was dimostrated as an increased in vitro pro-
angiogenic activity of isolated plasma cells from patients with active MM as compared with
inactive MM and monoclonal gammopathy of undetermined significance (MGUS).61,93
Thereafter, others confirmed this observation, showing that MM patients with active disease
have increased BM angiogenesis compared to patients with smoldering MM or early stage MM
62,63. In a large cohort of patients with monoclonal gammopathies it has been shown that BM
microvessel density (MVD) as assessed by immunohistochemical staining for CD 34 was
significantly higher in patients with symptomatic MM as compared to MGUS and healthy
controls. An increased incidence of high-grade angiogenesis was also demonstrated in patients
with relapsed MM as compared to newly diagnosed MM63
. Others studies showed a
correlation between MVD, the proliferation index Ki-67 and plasma cells burden 64
. Overall
these results suggest that increased BM angiogenesis correlates with the progression of
monoclonal gammopathy to overt MM and the extent of plasma cell infiltration.
11
Several groups have demonstrated a significant relationship between increased BM
angiogenesis and prognosis in MM patients 63, 64-68
. In multivariate analysis of separate cohorts
of MM patients, MVD emerged as an independent prognostic factor for overall survival
together with beta2-microglobulin and C-reactive protein 63, 64-68
. A relationship between the
increased BM microcirculation and the presence of deletion 13 69
and the gain of 1q21 has also
been demonstrated, but no relationship has been identified with the deletion of 17p13 70
. The
prognostic impact of angiogenesis in solitary bone plasmacytoma has been reported, showing
that patients with high MVD were more likely to progress to MM with a shorter event-free
survival 67
. Moreover, a significant relationship between increased angiogenesis, as assessed
by immunohistochemistry, and a diffuse magnetic resonance imaging (MRI) pattern of
infiltration was recently reported in newly diagnosed MM patients treated with novel agents
and correlates with poor prognosis MVD has been also identified as a good predictor of
complete response to therapy in MM 65
.
1.6.2 Production of Pro-angiogenic Factors by Myeloma Cells and the
Microenvironment
The increased BM angiogenesis in MM is sustained by an imbalance between the production
of pro-angiogenic and anti-angiogenic factors by both myeloma cells and the
microenvironment. Myeloma cells interact with several BM microenvironment cells including
stromal cells, fibroblasts, osteoblasts, osteoclasts, T lymphocytes, monocytes/macrophages
and mast cells that produce growth and survival factors that sustain myeloma cell survival and
trigger endothelial cell proliferation and angiogenesis.59
Fig.2
12
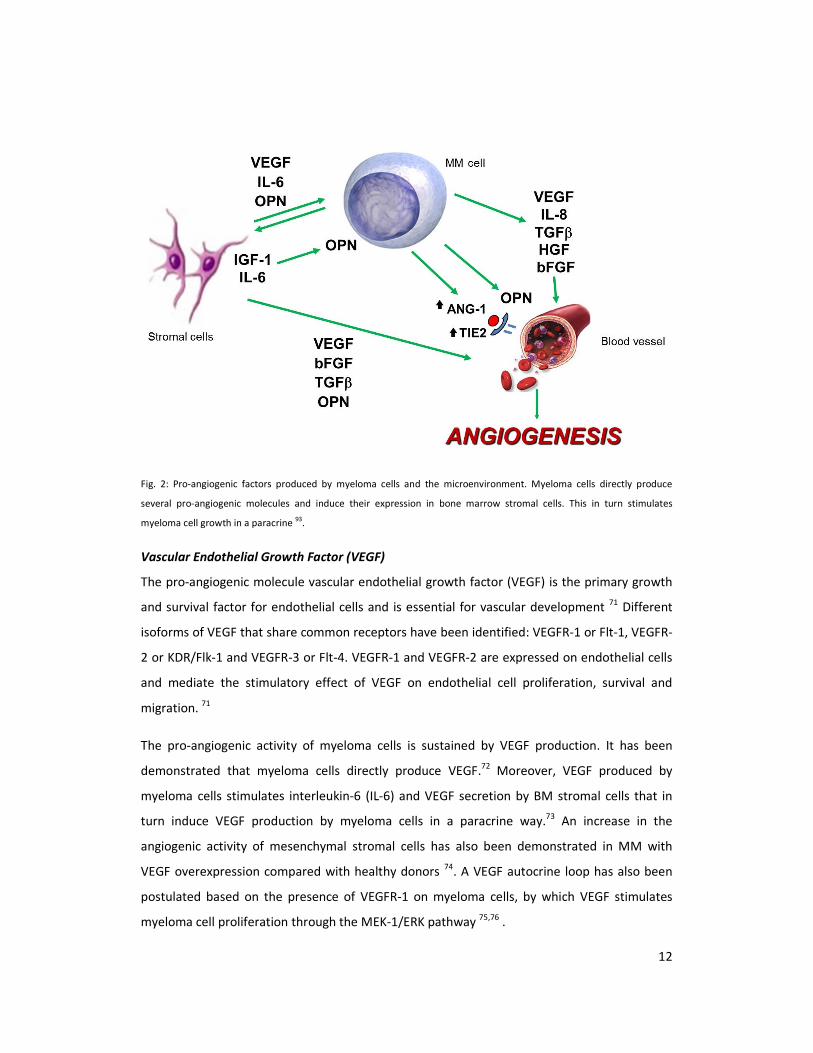
Fig. 2: Pro-angiogenic factors produced by myeloma cells and the microenvironment. Myeloma cells directly produce
several pro-angiogenic molecules and induce their expression in bone marrow stromal cells. This in turn stimulates
myeloma cell growth in a paracrine 93
.
Vascular Endothelial Growth Factor (VEGF)
The pro-angiogenic molecule vascular endothelial growth factor (VEGF) is the primary growth
and survival factor for endothelial cells and is essential for vascular development 71
Different
isoforms of VEGF that share common receptors have been identified: VEGFR-1 or Flt-1, VEGFR-
2 or KDR/Flk-1 and VEGFR-3 or Flt-4. VEGFR-1 and VEGFR-2 are expressed on endothelial cells
and mediate the stimulatory effect of VEGF on endothelial cell proliferation, survival and
migration. 71
The pro-angiogenic activity of myeloma cells is sustained by VEGF production. It has been
demonstrated that myeloma cells directly produce VEGF.72
Moreover, VEGF produced by
myeloma cells stimulates interleukin-6 (IL-6) and VEGF secretion by BM stromal cells that in
turn induce VEGF production by myeloma cells in a paracrine way.73
An increase in the
angiogenic activity of mesenchymal stromal cells has also been demonstrated in MM with
VEGF overexpression compared with healthy donors 74
. A VEGF autocrine loop has also been
postulated based on the presence of VEGFR-1 on myeloma cells, by which VEGF stimulates
myeloma cell proliferation through the MEK-1/ERK pathway 75,76
.
13
Purified CD138+ myeloma cells express VEGF mRNA in almost all MM patients (80–90%) and
high VEGF levels are detected in BM samples of MM patients 72,77,78
. However, only a few MM
patients produce the VEGF soluble antagonist sVEGFR-1 and have a higher VEGF/sVEGFR-1
ratio as compared to healthy subjects This further supports the importance of VEGF in the
increased BM angiogenesis in MM patients. 77
Basic-Fibroblast Growth Factor-2 (bFGF)
Basic fibroblast growth factor (bFGF) is another pro-angiogenic molecule that stimulates
endothelial cell proliferation, survival, migration and mobilization in vascular development. 58
In our cohort of newly diagnosed MM patients we have demonstrated that 11 out of 35
patients expressed bFGF mRNA and a lower number of patients produced bFGF protein. it has
been clearly shown that BM stromal cells express b-FGF that contributes to the pro-angiogenic
activity of the microenvironment cells in MM patients. 79
Angiopoietins
The maturation and stabilization of the vascular wall is critical and is regulated by angiopoietin-
1 (Ang-1), a factor that binds primarily to Tie2 receptor expressed on the endothelium .80
Ang-
1 does not induce endothelial cell proliferation directly but acts as a survival factor for
endothelial cells, induces vessel stabilization, tubule formation and plays a key role in
mediating interactions between endothelial and matrix cells . Ang-1 is also produced by mast
cells in the microenvironment that promotes plasma cell growth and stimulates angiogenesis
together with tumor-derived VEGF. 81, 82, 83
Angiopoietin-2 (Ang-2) is the natural antagonist of Ang-1, and blocks Ang-1 mediated Tie2
activation on endothelial cells and induces vessel destabilization. 93,81
This process may lead
either to vessel regression or promote angiogenesis. 93
Because Ang-1 has a critical role in the
angiogenic switch its potential role in myeloma-induced angiogenesis has been investigated
First, it has been shown that myeloma cells express and secrete Ang-1 but not its antagonist
Ang-2. Ang-1 is expressed in about 47% of patients of newly diagnosed MM patients. However,
Ang-2 is not present in any patients tested. In addition, the potential role of Ang-1 in MM-
induced angiogenesis has been confirmed in an experimental model of angiogenesis. In this
system, the conditioned medium of myeloma cells increased vessel formation in comparison
with either control or VEGF treatment. The presence of an anti-Tie-2 blocking antibody
completely blunted tubule formation induced by myeloma cells. 83
14
Interleukin-8
IL-8, also called CXCL8, is a chemokine that exerts potent angiogenic activity through binding to
the CXCR1 and CXCR2 receptors present on endothelial cells 88
. Studies indicate that myeloma
cells and BM stromal cells directly produce IL-8, and elevated BM levels of IL-8 have been
demonstrated in MM patients.89
Tumor cell expression of IL-8 has been linked to the
metastatic potential of many solid tumors 90
. In myeloma cells, IL-8 expression has also been
correlated with aberrant CD28 expression and consequently with MM progression and extra-
medullary localization 91
.
Matrix Metalloproteinases
Matrix metalloproteinases (MMPs) are a family of enzymes that proteolytically degrade
components of the extracellular matrix (ECM) promoting tumor invasion, metastasis and
angiogenesis 84
. MMPs enhance angiogenesis by detaching pericytes from vessels undergoing
angiogenesis, releasing and activating ECM-bound angiogenic factors, exposing cryptic pro-
angiogenic integrin binding sites in the ECM, and by cleaving endothelial cell-cell adhesions.
MMPs also negatively regulate angiogenesis through the generation of endogenous
angiogenesis inhibitors by proteolytic cleavage. 85
Myeloma cells produce both MMP-2 and MMP-9. MMP-2 expression by plasma cells from MM
patients with active disease in increased as compared to patients with MGUS. However MMP-
9 expression is similar between MM and MGUS patients 61.
MMP-9 secretion by myeloma cells
is enhanced by their interaction with endothelial cells in the microenvironment 85, 86
Myeloma
cells also upregulate MMP-1 secretion by BM stromal cells and MMP-7 secreted by MM cells
induces activation of the pro-MMP-2 86-87
.
In addition, other pro-angiogenic factors are producted by MM cells as:
� Interleukin-6
� Osteopontin
� Hepatocyte Growth Factor (HGF),
� Syndecan-1
� Heparanase
Different studies have investigated the potential relationship between the production of pro-
angiogenic factors by myeloma cells and the increased BM angiogenesis observed in MM
patients. Although VEGF and bFGF are considered the primary angiogenic growth factors
15
produced by myeloma cells, recent evidence indicates that there is not a significant difference
in the plasma cell expression levels of bFGF and VEGF and their receptor amongst MGUS,
smoldering MM and active MM patients. This suggests that the increased BM angiogenesis
occurring in MM patients as compared to MGUS could be due to the higher numbers of plasma
cells rather than the overexpression of pro-angiogenic molecules by myeloma cells 93,92
.
1.7 Hypoxia and Hypoxia-Inducible Factor-1
A major feature of solid tumours is hypoxia, decreased availability of oxygen, which increases
patient treatment resistance and favours tumour progression.
Tumor adaptation to hypoxia is mainly due to the hypoxia-inducible factors (HIFs): HIF-1α, HIF-
1β, HIF-2α, HIF-2β, e HIF-3α.
HIF-1 is a heterodimeric DNA binding complex composed of two basic helix-loop-helix proteins,
including the constitutively expressed HIF-1β and the hypoxia-inducible α-subunit HIF-1α . HIF-
1α is over-expressed in many tumors. 93,98
Under normoxic conditions, HIF-1α has a very short
life and undergoes proteosomal degradation by oxygen-dependent hydroxylation.In contrast
under hypoxic conditions, hydroxylation is suppressed and HIF-1α protein escapes
proteasomal destruction and accumulates and translocates to the nucleus 94-97
.
16
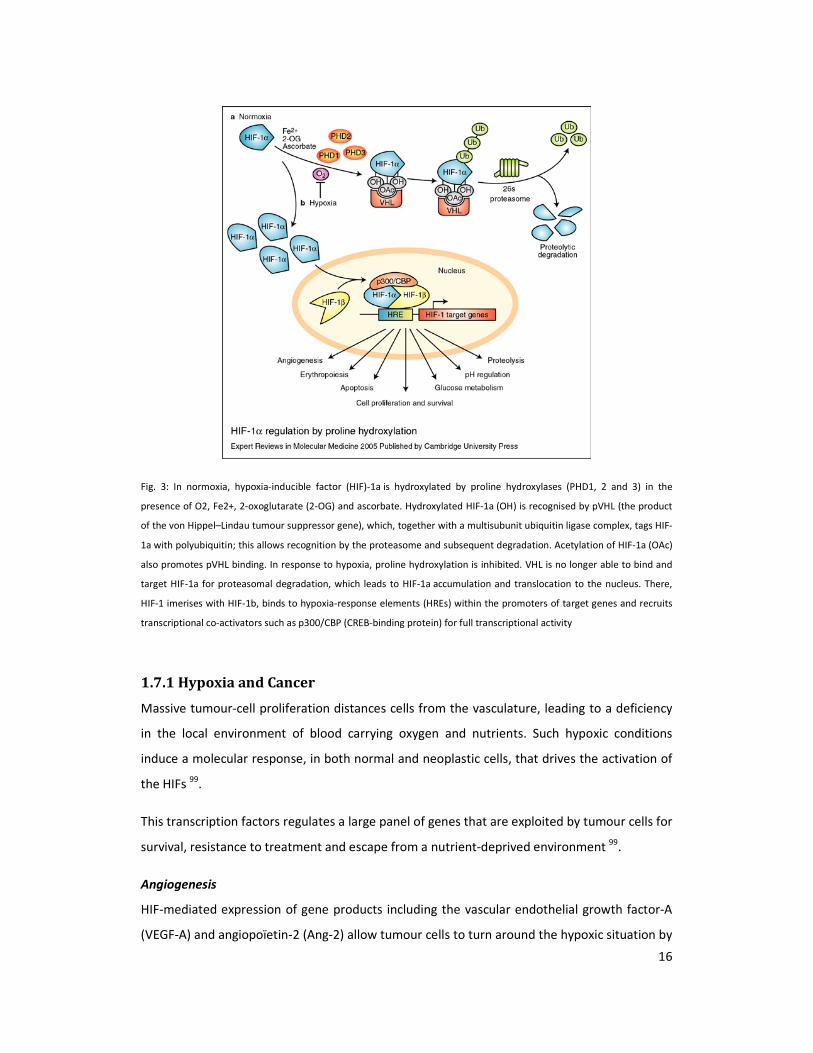
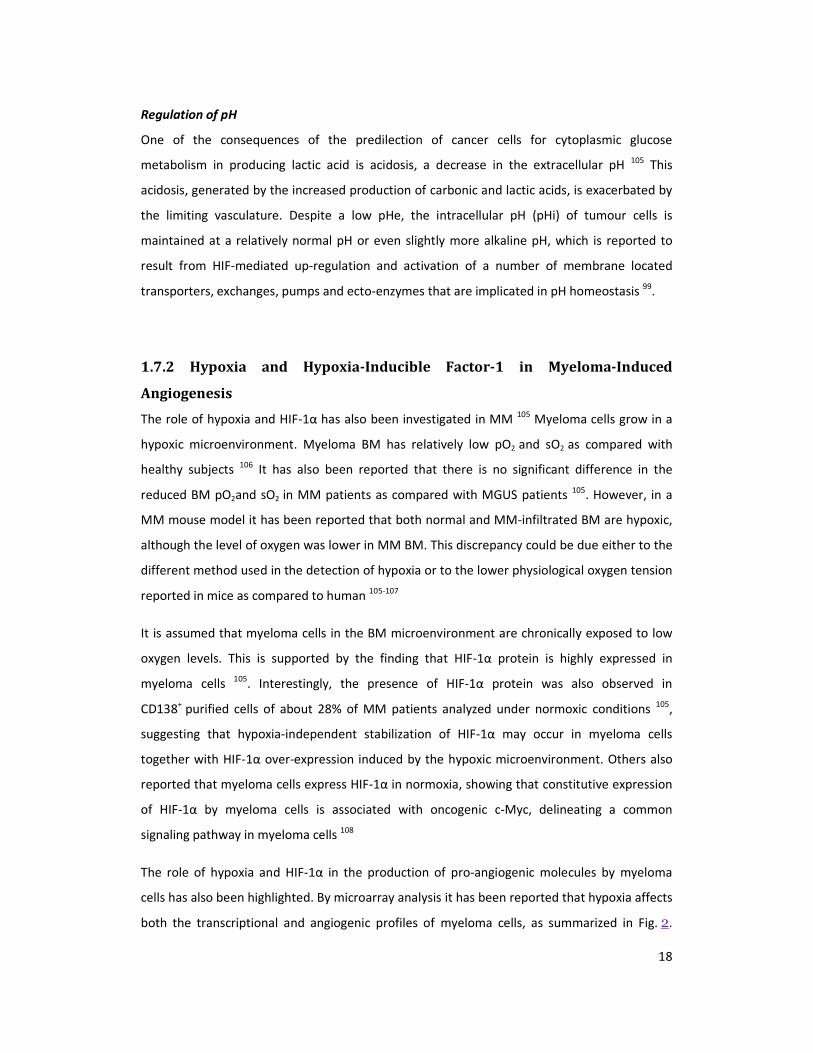
Fig. 3: In normoxia, hypoxia-inducible factor (HIF)-1a is hydroxylated by proline hydroxylases (PHD1, 2 and 3) in the
presence of O2, Fe2+, 2-oxoglutarate (2-OG) and ascorbate. Hydroxylated HIF-1a (OH) is recognised by pVHL (the product
of the von Hippel–Lindau tumour suppressor gene), which, together with a multisubunit ubiquitin ligase complex, tags HIF-
1a with polyubiquitin; this allows recognition by the proteasome and subsequent degradation. Acetylation of HIF-1a (OAc)
also promotes pVHL binding. In response to hypoxia, proline hydroxylation is inhibited. VHL is no longer able to bind and
target HIF-1a for proteasomal degradation, which leads to HIF-1a accumulation and translocation to the nucleus. There,
HIF-1 imerises with HIF-1b, binds to hypoxia-response elements (HREs) within the promoters of target genes and recruits
transcriptional co-activators such as p300/CBP (CREB-binding protein) for full transcriptional activity
1.7.1 Hypoxia and Cancer
Massive tumour-cell proliferation distances cells from the vasculature, leading to a deficiency
in the local environment of blood carrying oxygen and nutrients. Such hypoxic conditions
induce a molecular response, in both normal and neoplastic cells, that drives the activation of
the HIFs 99
.
This transcription factors regulates a large panel of genes that are exploited by tumour cells for
survival, resistance to treatment and escape from a nutrient-deprived environment 99
.
Angiogenesis
HIF-mediated expression of gene products including the vascular endothelial growth factor-A
(VEGF-A) and angiopoïetin-2 (Ang-2) allow tumour cells to turn around the hypoxic situation by
17
inducing regrowth of the vascular network, a phenomenon termed angiogenesis.100
Thereby an
oxygenated and nutritional environment is reestablished for maintenance of growth. However,
the neo-vessels formed are often distorted and irregular and thus less efficient in oxygen,
nutrient transport and drug delivery.
Cell survival or death
Thus, hypoxia initiates a cascade of events that allows tumour cells to continue to proliferate;
however, if too severe, hypoxia can also lead to cell death as shown by the presence in
tumours of a central necrotic zone. Interplay between FIH and the transcriptional activation
domains of HIF-1α, based on the degree of oxygen dependence of FIH for activity, has been
proposed to select for different gene profiles that determine cell fate. The genes bNIP3, Bcl-
2/adenovirus EIB 19 kDa-interacting protein 3, and bnip3L (bnip3-like), the products of which
are members of the BH3-only protein family of cell death factors, are highly induced in
hypoxia.
Metabolism
A substantial number of genes involved in cellular metabolism, in particular those of glucose,
are HIF-mediated. It has been known for many years that cancer cells divert pyruvate
metabolism away from mitochondrial oxidative phosphorylation (OXPHOS) toward cytoplasmic
conversion of pyruvate to lactic acid.99
This is made possible through an increase in HIF-
mediated expression of both glucose transporters and enzymes of the glycolytic pathway,
giving tumours a “glycolytic” phenotype. Diversion of pyruvate toward lactate and away from
OXPHOS is also promoted through increased HIF-mediated expression of two key enzymes;
lactate dehydrogenase A (LDH-A) 101
and pyruvate dehydrogenase kinase 1 (PDK1).102
This
strategy not only makes respiration more efficient but may also protect cells from oxidative
damage under hypoxic conditions. Metabolic regulation via HIF also brings into play products
of tumour suppressors and oncogenes such as p53, c-Myc, Ras and Akt 99, 103
.
Another pathway related to nutrient availability, which is modified by HIF, is that of
mammalian target of rapamycin (mTOR). On the one hand, growth factors and nutrients
potentiate the mTOR pathway in conveying signals of growth and survival through increased
protein synthesis, and on the other hand, energy depletion and hypoxia suppress mTOR,
saving on energy-consuming protein synthesis, allowing for cellular adaptation and subsequent
survival .104
18
Regulation of pH
One of the consequences of the predilection of cancer cells for cytoplasmic glucose
metabolism in producing lactic acid is acidosis, a decrease in the extracellular pH 105
This
acidosis, generated by the increased production of carbonic and lactic acids, is exacerbated by
the limiting vasculature. Despite a low pHe, the intracellular pH (pHi) of tumour cells is
maintained at a relatively normal pH or even slightly more alkaline pH, which is reported to
result from HIF-mediated up-regulation and activation of a number of membrane located
transporters, exchanges, pumps and ecto-enzymes that are implicated in pH homeostasis 99
.
1.7.2 Hypoxia and Hypoxia-Inducible Factor-1 in Myeloma-Induced
Angiogenesis
The role of hypoxia and HIF-1α has also been investigated in MM 105
Myeloma cells grow in a
hypoxic microenvironment. Myeloma BM has relatively low pO2 and sO2 as compared with
healthy subjects 106
It has also been reported that there is no significant difference in the
reduced BM pO2and sO2 in MM patients as compared with MGUS patients 105
. However, in a
MM mouse model it has been reported that both normal and MM-infiltrated BM are hypoxic,
although the level of oxygen was lower in MM BM. This discrepancy could be due either to the
different method used in the detection of hypoxia or to the lower physiological oxygen tension
reported in mice as compared to human 105-107
It is assumed that myeloma cells in the BM microenvironment are chronically exposed to low
oxygen levels. This is supported by the finding that HIF-1α protein is highly expressed in
myeloma cells 105
. Interestingly, the presence of HIF-1α protein was also observed in
CD138+ purified cells of about 28% of MM patients analyzed under normoxic conditions
105,
suggesting that hypoxia-independent stabilization of HIF-1α may occur in myeloma cells
together with HIF-1α over-expression induced by the hypoxic microenvironment. Others also
reported that myeloma cells express HIF-1α in normoxia, showing that constitutive expression
of HIF-1α by myeloma cells is associated with oncogenic c-Myc, delineating a common
signaling pathway in myeloma cells 108
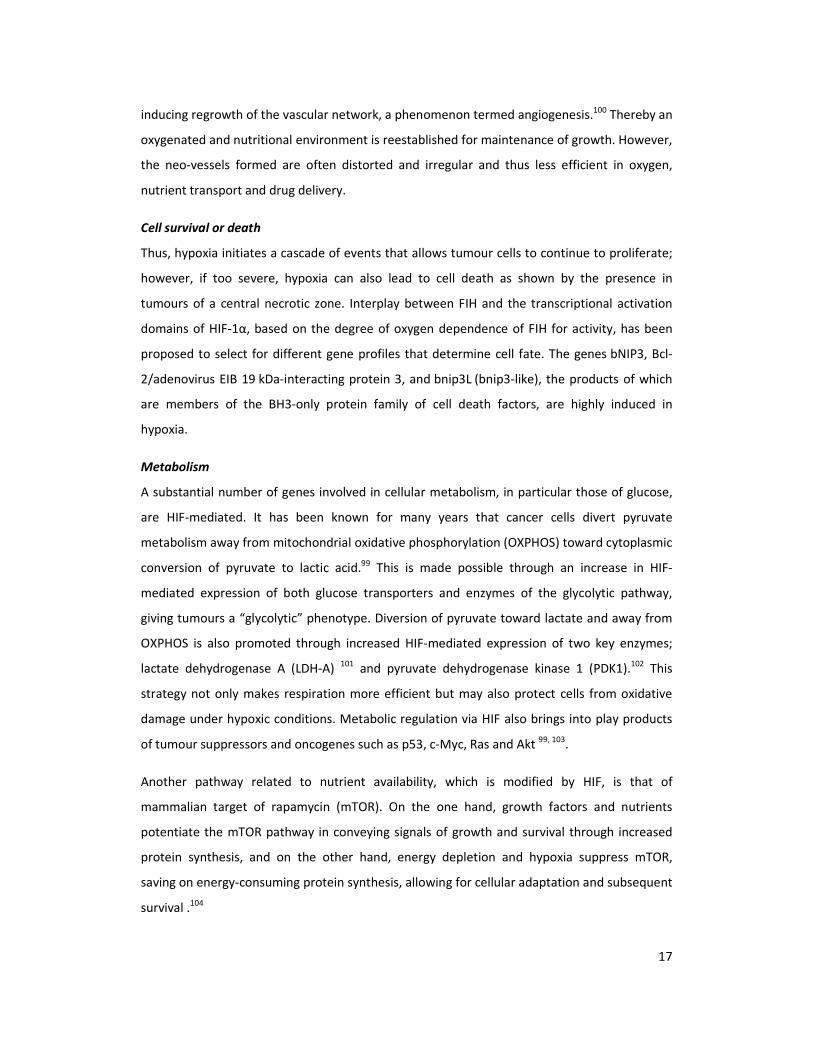
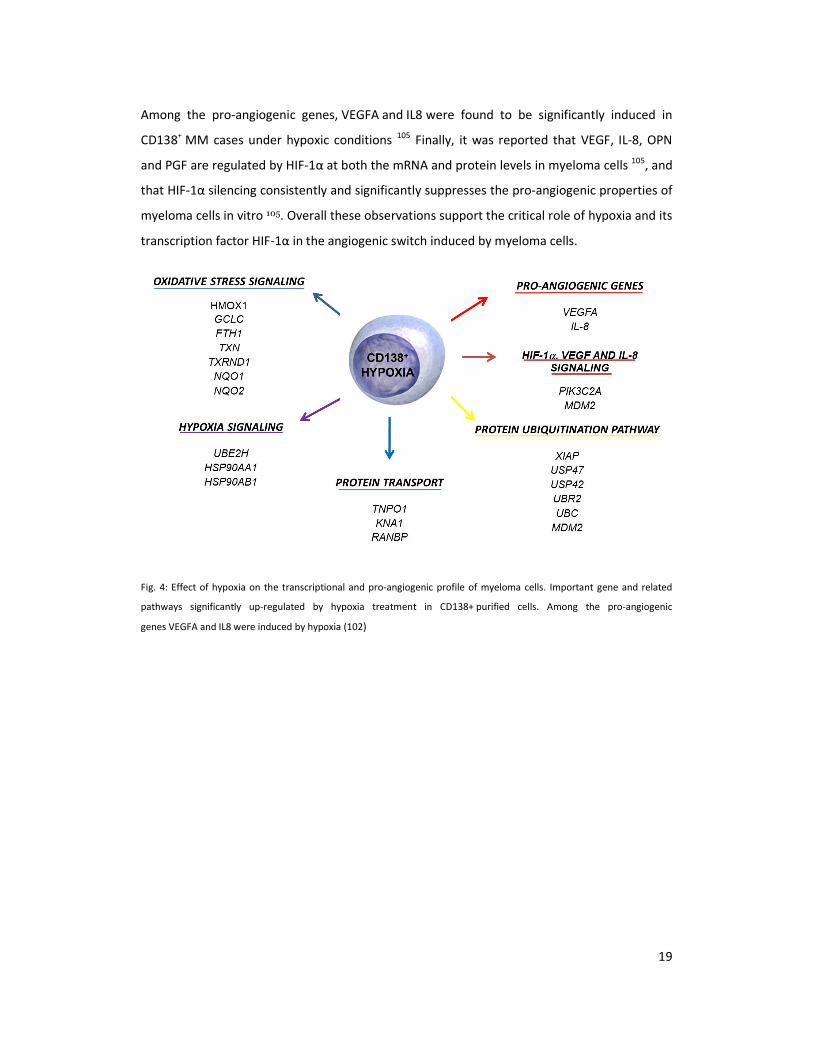
The role of hypoxia and HIF-1α in the production of pro-angiogenic molecules by myeloma
cells has also been highlighted. By microarray analysis it has been reported that hypoxia affects
both the transcriptional and angiogenic profiles of myeloma cells, as summarized in Fig. 2.
19
Among the pro-angiogenic genes, VEGFA and IL8 were found to be significantly induced in
CD138+ MM cases under hypoxic conditions
105 Finally, it was reported that VEGF, IL-8, OPN
and PGF are regulated by HIF-1α at both the mRNA and protein levels in myeloma cells 105
, and
that HIF-1α silencing consistently and significantly suppresses the pro-angiogenic properties of
myeloma cells in vitro 105. Overall these observations support the critical role of hypoxia and its
transcription factor HIF-1α in the angiogenic switch induced by myeloma cells.
Fig. 4: Effect of hypoxia on the transcriptional and pro-angiogenic profile of myeloma cells. Important gene and related
pathways significantly up-regulated by hypoxia treatment in CD138+ purified cells. Among the pro-angiogenic
genes VEGFA and IL8 were induced by hypoxia (102)

20
2. AIM OF STUDY
As described before, it has been previously reported that bone marrow microenvironment is
hypoxic in multiple myeloma patients and that HIF-1α is overexpressed by MM cells. However,
the potential role of HIF-1α as a therapeutic target in MM is not known and is currently under
investigation. In this study we investigate the effect of a stable HIF-1α inhibition in MM cells on
cell proliferation, survival and on MM-induced angiogenesis and osteolysis either in vitro,
analizing the espression profile of pro-angiogenic and pro-osteoclastogenic molecules, or in
vivo using a plasmocytoma xenograft and intra-tibial mouse models.
21
3. MATERIALS AND METHODS
3.1 Cells and cell culture conditions
3.1.1 Cell lines
Human myeloma cell lines (HMCLs) JJN3, RPMI-8226 and OPM-2 were purchased from DSMZ
(Braunschweig, Germany) while the U266 was obtained from the ATCC (LGC Standards S.r.l.,
Venezia, Italy). HMCLs were cultured in RPMI media at 10% fetal bovine serum (FBS) with 2nM
of glutamine and antibiotics (Invitrogen Life Technologies, Milan, Italy).
3.1.2 HIF-1α knock-down
Lentivirus shRNA pool anti-HIF-1α (Sigma Aldrich, Milan, Italy) was used for HIF-1α stable
knock-down in HMCLs whereas the pLKO.1 lentiviral vector was the empty control.
Recombinant lentivirus was produced by transient transfection of 293T cells following a
standard protocol. HMCLs were infected as previously described32
and selected in culture by
the presence of 4 ug/ml puromycin for 21 days. Selected clones of HMCLs were then screened
for HIF-1α, HIF-1β, HIF-2α and HIF-3α mRNA and/or protein expression. Stably transfected
HMCLs were maintained in RPMI medium containing 10% of FBS with 4 ug/ml puromycin until
use.
3.1.3 Hypoxic and drugs treatments
HMCLs stably transfected with pLKO.1 or anti-HIF-1α shRNAl were incubated in the presence
or absence of hypoxic conditions (1%O2, 5%CO2) or treated with the hypoxic mimetic drug
CoCl2 at 100µM (Sigma Aldrich, St. Louis, MO) or vehicle for 12-24 hours. In selected
experiments HMCLs stably transfected with pLKO.1 or anti-HIF-1α were treated either in
normoxic or in hypoxic conditions in the presence of the absence of Bortezomib (supplied from
Janssen-Cilag; Milan, Italy) at concentrations ranging from 1 nM to 50 nM of Lenalidomide
(supplied by Celgene Italy srl, MiIan, Italy) (0.2-10mM) or vehicle (DMSO) for 24-72 hours.
22
3.1.4 Cell proliferation and viability assays
HMCLs transfected with pLKO.1 or anti-HIF-1α were cultured in 96-well microtiter plates for
48-96 hours in the presence of 3H-thymidine (3H-TdR) (Biocompare South San Francisco, CA)
and thymidine incorporation was detected by liquid scintillation spectroscopy (1205 Betaplate;
Wallac; Markham, Ontario Canada). Viability of HMCLs stablytransfected with pLKO.1 or anti-
HIF-1α was evaluated under both normoxic and hypoxic conditions after 24-72 hours of culture
by adapted MTT test assay (Cell Counting Kit-8; Alexis,Vinci-Biochem srl, Italy). Cell apoptosis
was determined by Apo 2.7 mAb staining (Immunotech, Fullerton, CA, USA) and verified by
FACScan, (BD Biosciences Italy, Milan, Italy).
3.2 In vivo studies
Four-to six week-old males and females SCID-NOD mice (Harlan Laboratories, Udine, Italy)
were housed under specific pathogen-free conditions. All procedures involving animals were
performed in accordance with the National and International current regulations (D.l.vo
27/01/1992, n.116, European Economic Community Council Directive 86/609, OJL 358, Dec. 1,
1987). Three groups of 6 animals each were injected subcutaneously with 5x10⁶
JJN3 cells
stably transfected with anti-HIF1α containing plasmid vectors (JJN3-anti-HIF-1 α), or with JJN3
stably transfected with empty vector (JJN3-pLKO.1), or JJN3 wild type (JJN3). Twenty days after
tumor cell inoculation, mice were sacrificed and autopsies were performed. Tumor mass was
measured as previously described.32
Maximum length and width of the tumor masses were
measured with a caliper, and tumor volume (mm3) was calculated according to the following
formula: 0.523 x length x width2. Tumors were removed and subjected to
immunohistochemical staining.
In a separate set of experiments SCID and NIH-III nude mice (4 weeks of age) were injected
intratibially with 20 μL of 5 × 10⁴
cells of JJN3-anti-HIF-1α or JJN3-pLKO.1 or JJN3 or saline
alone. All research protocols were approved by the Pittsburgh VA Healthcare System
Institutional Animal Care and Use Committee. Four weeks after injection, the animals were
sacrificed and the tibias were dissected out. Images of dissected tibias were acquired on a
vivaCT 40 scanner (Scanco Medical) at resolution of 21-μm isotropic, reconstructed, and
23
segmented for 3-dimensional display using the instrument's analysis algorithm software.
Tissue samples and cell extracts were obtained for immunohistochemical staining.
3.3 Gene expression profiling and microarray analysis
The transcriptional profiles of JJN3-anti-HIF-1α and JJN3-pLKO.1 cells exposed to hypoxic or
normoxic conditions were analyzed. To perform gene expression profiles, total RNA was
purified using the RNeasy® total RNA Isolation Kit (Qiagen, Valencia, CA). Preparation of biotin-
labeled cRNA, hybridization to GeneChip® Human Genome U133 Plus2.0 Arrays and scanning
(GeneChip® Scanner 3000 7G, Affymetrix Inc.) were performed according to manufacturer’s
protocols. The raw intensity signals were extracted from CEL files and normalized using the
RMA package for Bioconductor and custom GeneAnnot-based Chip Definition Files version
2.2.0 in R7 software. The most differentially expressed genes between two experimental
conditions were defined as follows: for each gene, the ratio between the difference and the
average value in the expression signals under the two conditions was calculated. Those genes
with a minimum of 1.5 absolute fold change between hypoxic and normoxic conditions were
selected for further analysis. Then, those genes with ratios exceeding two standard deviations
from the mean were considered differentially expressed. NetAffx
(https://www.affymetrix.com/analysis/netaffx/) and DAVID (http://david.abcc.ncifcrf.gov)
tools were used for the functional annotation studies of the selected lists
24
3.4 RNA isolation and reverse-transcriptase polymerase
chain reaction (RT-PCR) amplification
Total RNA was extracted from the cells using the RNeasy total RNA isolation kit (Qiagen,
Valencia, CA), and then quantified using a Nanodrop ND-100 (Celbio S.p.A., Milan, Italy). 1 μg
of RNA was reverse- transcribed with 400 U Moloney murine leukemia reverse transcriptase
(Applied, Biosciences, Life Sciences, Carlsbad, CA) in accordance with the manufacturer’s
protocol.
The cDNAs were amplified by means of PCR using the following specific primer pairs:
� HIF1A: F: 5’-CTCAAAGTCGGACAGCCTCA-3’; R: 5’-CCCTGCAGTAGGTTTCTGCT-3’
� VEGFA: F:5’-CGAAGTGGTGAAGTTCATGGATG-3’; R: 5’-TTCTGTTCAGTCTTTCCTGGTGAG-3’
� IL8: F: 5’-TACTCCAAACCTTTCCACCC-3’; R: 5’-AACTTCTCCACAACCCTCTG-3’
� MMP9: F: 5’-CGCAGACATCGTCATCCAGT-3’; R: 5’-GGATTGGCCTTGGAAGATGA-3’
� CCL2: F: 5’-ACTGAAGCTCGTACTCTC-3’; R: 5’- CTTGGGTTGTGGAGTGAG-3’
� GAPDH: F 5'-CAACGGATTTGGTCGTATTG-3'; R: 5'-GGAAGATGGTGATGGGATTT-3'
Annealing temperature: HIF1A: 59°C; VEGFA: 66°C; IL8: 64°C; CCL2: 60°C; MMP9: 58°C, GAPDH:
58°C. Product size: HIF1A: 454 bp; VEGFA: 375 bp; IL8: 158 bp; CCL2: 354 MMP9: 369 GAPDH:
209 bp. Pictures of the electrophoresed cDNAs were recorded with a digital DC 120 Kodak
camera and quantified.
3.5 Real time quantitative PCR and angiogenesis PCR
array
Real-time PCR was performed using the TaqMan Gene Expression Assay (Applied
BiosystemsApplera, Milan, Italy), starting from 1 μg of RNA, for the following genes:
� HIF1A: HS00936379_M1,
� HIF-1beta (ARNT): HS00231048_M1,
25
� HIF2A (EPAS1): HS01026149_M1,
� HIF2B (ARNT2): HS00208298_M1,
� HIF3A: HS00223818_M1,
� BNIP3: HS00969291_M1,
� VEGFA: HS99999034_M1,
� IL8: Hs99999034_M1,
� CCL2: HS00234140_M1,
� MIP1A: Hs00234142_M1.
� IL7: Hs00174202_M1.
� DKK1: Hs00183740_M1.
The PCR amplifications were performed in duplicate using the iCycler iQ Real-Time Detection
System (Bio-Rad, Milan, Italy). The comparative Ct method was applied to normalize the
differences in the quantity and quality of RNA, and mRNA was quantified using the
comparative ΔCt method using the endogenous reference gene ABL (ΔCt= mean Ct gene –
mean Ct ABL); ΔΔCt was evaluated as the difference between the ΔCt of a sample and the ΔCt
of the control. The fold-change in mRNA expression was calculated as 2- ΔΔCt
.
The expression levels of the pro-angiogenic molecules were evaluated on mRNA extracted
from tumors removed from SCID-NOD mice with the Human Angiogenesis RT2 Profiler PCR
Array and RT2 Real-Timer SyBR Green/ROX PCR Mix (PAHS-024, Superarray, SABiosciences,
Frederick, MD) that profiles the expression of 84 key genes involved in modulating the
biological processes of angiogenesis.
3.6 Western blot analysis
Western blot analysis was performed as previously described. Nuclear extracts were prepared
using the Nuclear Extraction kit (Active Motive) according to the manufacturer's protocol. 40μg
of nuclear extracts were tested. A polyclonal goat anti-HIF-1α Ab (R&D system, Minneapolis,
MN) or anti-HIF-1β or anti-HIF-2α or anti-HIF-3α (1:500; Novus Biologicals) were used to
detect HIF-1α, HIF-1β, HIF-2α and HIF-3α, respectively whereas anti-Histone H1 mAb was used
as internal control (Upstate, Lake Placid, NY). A monoclonal anti-p27 (BD, Pharmingen) was
26
used as primary antibody to detect p27 on whole lysates. Appropriate secondary antibodies
that were used: antigoat IgG (Rockland Immunochemicals, Gilberrtsville, PA) for HIF-1α, anti-
mouse IgG (BD biosciences) for HIF-1β, HIF-2α and p27 and anti-rabbit IgG (Chemicon
International, Millipore) for HIF-3α.
3.7 HIF-1α activity
HIF-1α activation in nuclear extracts of HMCLs was evaluated using an ELISA based method
(TransAM HIF-1 kit, Active Motive, Carlsbad, CA) according to the manufacturer’s procedures.
3.8 ELISA assays
Soluble VEGF, IL-8. IL-7 and CCL3 proteins were detected in the conditioned media of HMCLs
using ELISA assays purchased from R&D system according to the manufacturer’s protocols.
Cytokine levels in the conditioned media were normalized to the number of cells at the end of
culture period.
3.9 Histological and Immunohistochemical analysis.
Tissue samples obtained from tumors removed from mice injected either subcutaneously or
intratibially with JJN3-pLKO.1, JJN3-anti-HIF-1α and JJN3 were fixed in 10% neutral buffered
formalin, embedded in paraffin, sectioned at 3 μm, and stained with hematoxylin and eosin or
with Toluidine blu and Gomori’s three-chromic methods. Tumors obtained from intratibial
injections underwent EDTA decalcification before embedding in paraffin. On the basis of cell
location and morphology, the number of all Osteoclasts (OCLs) and active prismatic
osteoblasts (OBs) was evaluated on the bone surface of each section (3x10mm2). Osteocyte
number and vitality were recorded on a total of 500 lacunae per histological section. Sections
27
were immuno-stained either with mouse monoclonal anti-HIF-1α Ab (NOVUS Biologicals
Littleton, CO; Working dilution 1:100) or mouse anti-human VEGF (R&D; dilution 1:20) or with
1:100 diluted mouse anti-Ki67 primary antibody (Clone MIB-1, Dako, Carpinteria, CA) for 30
min. HIF-1α and VEGF staining was revealed using the UltraVision LP Large Volume Detection
System HRP polymer (Thermo Scientific) and quantified according to semiquantitative
immunohistochemical score. Detection of Ki-67 was performed using a high-sensitive
detection system (Advance-HRP, Dako Carpinteria, CA) and 3,3-diaminobenzidine was
employed as chromogen substrate. Angiogenesis was evaluated on frozen tissues samples
obtained from both series of mice. Tissues were fixed in acetone and treated with rabbit anti-
mouse CD34 (1:100, Santa Cruz Biotechnology, Santa Cruz, CA). After washing sections were
incubated with a secondary antibody (Rat anti-IgG HRP; Millipore; 1:250) and reaction revealed
with a solution of 3’-diaminobenzidine tetrahydrochloride (liquid DAB substrate chromogen
system, DAKO, Glostrup,DK).
28
4. RESULTS
4.1 Permanent HIF-1αααα silencing in HMCLs: effects on MM
cell proliferation, survival and drug sensitivity.
HMCLs were initially checked for HIF1A mRNA and HIF-1α protein expression under normoxic
conditions (Figure 1a). All HMCLs tested expressed HIF1A mRNA whereas HIF-1α protein was
present at low levels in JJN3 and U266 but not in RPMI-8226 and OPM-2 (Figure 5a). All HMCLs
overexpressed HIF-1α protein upon hypoxic treatment. The JJN3 and RPMI-8226 were used as
cell lines for HIF-1α inhibition studies. The selected clones were screened both under normoxic
and hypoxic conditions for HIF1A mRNA by qualitative PCR (Figure 5b), and for HIF1A, BNIP3,
HIF1B, HIF2A, HIF2B and HIF3A mRNA levels by real time PCR. These studies showed a selective
inhibition of HIF1A and its target gene BNIP3 by the shRNA pool used (Figure 5c left panel).
HIF1B, HIF2A, HIF2B and HIF3A were not inhibited by the shRNA pool (Figure 5c). Western blot
for HIF-1α, HIF-1β, and HIF-3α proteins showed specific inhibition of HIF-1α protein under both
normoxia and hypoxia (Figure 5d). HIF-2α and HIF2 β were not expressed either in normoxia or
in hypoxia (data not shown). Consistently HIF-1α activity was significantly inhibited in JJN3
anti-HIF-1α as compared to JJN3 pLKO.1 under hypoxic conditions (Figure 5e). Similar results
were obtained with RPMI-8226 (data not shown).
The effect of HIF-1α suppression on HMCLs proliferation and survival was next investigated.
Interestingly, there was no significant inhibition of cell proliferation either with JJN3 or RPMI-
8226 (Figure 6a) at different time points. Cell viability was not significantly changed by HIF-1α
suppression when checked at 12 and 24 hours either under normoxia or in hypoxia (Figure 6b).
In contrast cell viability was significantly decreased by HIF-1α suppression at 48 and 72 hours
and was statistically significant at 72 hours for JJN3 cells (P= 0.01) (Figure 6c upper panel) but
not RPMI-8226 cells (Figure 6c, lower panel). Treatment with lenalidomide at a wide range of
concentrations induced a significantly higher inhibition of cell proliferation in JJN3 anti-HIF-1α
as compared to JJN3 pLKO.1 (P=0.01) (Figure 5d) without significantly changing their viability
29
(data not shown). In contrast Bortezomib at apoptotic doses (4-10 nM) induced a similar rate
of cell death in JJN3 anti-HIF-1α and JJN3 pLKO.1 (Figure 6d).
4.2 HIF-1αααα suppression affects the transcriptional profile
of HMCLs: inhibitory effect on the pro-angiogenic and
pro-osteoclastogenic genes.
The transcriptional profiles of JJN3 cells transduced with shRNA anti-HIF-1α (JJN3-anti-HIF-1α)
were compared to those infected with the control vector pLKO.1 (JJN3-pLKO.1) either under
hypoxic or normoxic conditions. Among the significantly modulated genes (326 and 361 genes
under hypoxic and normoxic condition, respectively), we found down-regulation of the pro-
angiogenic molecules VEGFA, IL8, CCL2, MMP9 in JJN3-anti-HIF-1α cells with both hypoxic and
normoxic conditions. Microarray data were further validated by both qualitative PCR (Figure
7a) and Real-time Quantitative PCR, which showed that VEGFA and IL8 were induced by
hypoxia and inhibited by HIF-1α suppression (Figure 7b) whereas CCL2 mRNA was not induced
by hypoxia but was inhibited by HIF-1α suppression either under normoxia or hypoxia. Finally,
other genes with pro-angiogenic properties, such as IL10 and CCL5, were inhibited by HIF-1α
suppression in JJN3 under both normoxic and hypoxic conditions (Table S1). Consistently as
previously reported with siRNA anti-HIF-1α27
, stable HIF-1α suppression by shRNA significantly
blunted vessels formation induced by the conditioned media of HMCLs as determined by
AngioKit (TCS Biologies, London UK).
The effect of HIF-1α suppression on the production of pro-osteoclastogenic cytokines by
HMCLs was then investigated. A significant inhibitory effect was observed for both
MIP1A/CCL3 and IL7 mRNA levels either under normoxia or in hypoxia as shown for JJN3
(Figure 7c). This inhibitory effect was also confirmed at the protein level under normoxia as
shown for JJN3 (Figure 7d). In contrast, no significant effect was observed on the expression of
the osteoblast inhibitor gene DKK1 by JJN3 with HIF-1α suppression (data not shown).

30
4.3 HIF-1αααα suppression in JJN3 cells blocks the growth of
subcutaneous MM in SCID-NOD mice and inhibits
angiogenesis.
We next investigated whether inhibition of HIF1α in JJN3 may influence tumor growth in vivo.
Therefore, we analyzed the tumorigenicity of JJN3 wild type, JJN3 transfected with a plasmid
with silenced HIF1α (JJN3-anti-HIF-1α) and JJN3 with empty vector (JJN3-pLKO.1) cells injected
subcutaneously into SCID-NOD animals. Twenty days after cell inoculation, mice were
sacrificed, tumors removed and measured. At this time point, all animals developed tumors
that grew at the site of injection in the absence of metastases to distant sites. Mice injected
with the JJN3-anti-HIF-1α cells developed significantly smaller tumors than mice inoculated
with the JJN3-pLKO.1 (P=0.00018) or with JJN3 (P=0.032) (Figure 8a-b). Both weight and
volume of the tumors in JJN3-anti-HIF-1α mice were significantly reduced as compared to
JJN3-pLKO.1 (Figure 4 c-d). The median weight of tumors formed by JJN3-anti-HIF-1α 1 was
0.3 g vs 0.05 g for JJN3-pLKO (P=0.0007) (Figure 8c). The median volume of tumors formed by
JJN3-anti-HIF-1α was 72.6 mm3 (range 3-221 mm
3) and that of JJN3-pLKO.1 was 369.8 mm
3
(range 221.8-671 mm3) (P=0.0012) (Figure 8d). Interestingly in the tumoral mass removed from
JJN3-anti-HIF-1α mice the microvascular density (number of vessels positive for CD34/mm3)
was significantly reduced as compared to that obtained from JJN3-pLKO.1 (JJN3-anti-HIF-1α vs.
JJN3-pLO.1: -76%; P=0.003). Two representative samples are shown in Figure 4a. Similarly
VEGF immunostaining was reduced in JJN3-anti-HIF-1α derived tumors as compared to JJN3
pLKO.1 injected mice (Figure 8f).
4.4 HIF-1αααα suppression in JJN3 cells blunts angiogenesis
and bone destruction in an intra-tibial mouse model.
The effect of HIF-1α suppression in MM cells was further investigated in vivo in an intra-tibial
mouse model. The SCID mice were injected intratibially with saline or JJN3-pLKO.1 or JJN3-anti-
31
HIF-1α cells in saline, and lytic lesions were allowed to develop for 2 to 4 weeks before the
mice were analyzed. Histological analysis showed a significant reduction in the tumor mass
with an increase in the bone thickness in JJN3-anti-HIF-1α as compared to JJN3 pLKO.1 injected
animals (Figure 9a). However, immunostaining for Ki67 showed a reduction in the number of
Ki67 positive cells in JJN3-anti-HIF-1α as compared to JJN3 pLKO.1 mice although the
difference did not reach statistical significance (Figure 9b). However immunostaining for CD34
showed a significant reduction in the number of CD34 positive vessels in JJN3-anti-HIF-1α as
compared to JJN3 pLKO.1 mice (median number of vessels positive for CD34/mm3 22 vs 64,
p=0.001) (Figure 9c) similarly to that observed in the sub-cutaneous model. Finally by micro-
QCT analysis demonstrated that mice injected with JJN3-pLKO.1 cells began developing
detectable lytic lesions at 2 weeks after cell injection with continued further bone
deterioration through the 4 weeks that ultimately involved the entire tibia, leading to animal
death from advanced disease. In contrast, the saline injected controls at 4 weeks were similar
to the 0-week time point, demonstrating that the effects detected were not the result of the
injection process. Interestingly mice injected with JJN3-anti-HIF-1α cells showed a dramatic
reduction of osteolytic lesions (Figure 9d).
32
5. DISCUSSION
It is well established that intratumoral hypoxia and consequently HIF-1α activation in solid
tumors critically trigger the angiogenic switch and induce modifications of cancer cell
metabolism leading to tumor progression and metastasis.99, 98, 109,95
HIF-1α is over-expressed in
many tumors 95
including some hematological malignancies such as acute lymphoblastic
leukemia107
, lymphoma111
and MM.105,108,110
We and others105,112
have recently shown that BM
microenvironment is hypoxic both in MM patients105
and in mice.112
In addition HIF-1α also
may be overexpressed by MM cells under normoxic conditions105, 108
dependent at least in part
on c-myc up-regulation.105
Finally it has been reported that hypoxia modulates the expression
of pro-angiogenic genes such as VEGF and IL-8 105
by MM cells and that HIF-1α is involved in
MM-induced angiogenesis in vitro1057
In turn angiogenesis is able to support MM cell growth
and survival. All these results suggest that HIF-1α could be a potential therapeutic target for
MM. To test this hypothesis,, we performed HIF-1α knockdown in HMCLs using a pool of
shRNA anti-HIF-1α and evaluated the effect permanent suppression of HIF-1α on MM cell
proliferation, survival, the pro-angiogenic profile and tumor growth in vivo. Firstly, we showed
that the inhibition of HIF-1α by shRNA was specific because no significant inhibitory effect was
demonstrated on HIF1B, HIF2A, HIF2B and HIF3A gene expression and related proteins.
Interestingly we did not find a significant inhibitory in vitro effect on MM cell proliferation by
HIF-1α suppression only showing a significant inhibitory effect on cell survival after 72 hours in
JJN3 but not in RPMI-8226. These results suggest that HIF-1α inhibition did not directly induce
a significant effect on MM cell proliferation and survival. Similarly it has been previously
reported that siRNA anti-HIF-1α alone is not able to directly affect MM cell survival but
enhanced MM cell sensitivity to melphalan.113
Therefore, we further evaluated the potential
effect of HIF-1α stable suppression onthe sensitivity of HMCLs to IMiDs® and Bortezomib in
vitro . Interestingly we found that shRNA anti-HIF-1α increased the inhibitory effect of IMiDs®
on HMCL proliferation. This result was also supported by the previous finding that the
response to lenalidomide treatment involves oxidative stress response in MM cells.89
In
contrast, we did not find any sensitization of MM cells to Bortezomib treatment. It has been
reported that anti-MM effects of Bortezomib may be increased by hypoxia and HIF-1α up-
regulation114
rather than to HIF-1α inhibition.
33
Although we did not find a significant effect on cell proliferation and survival by knowndown of
HIF-1α, stable HIF-1α suppression by shRNA modified the pro-angiogenic and osteoclastogenic
profiles of MM cells either under hypoxic or normoxic conditions. Microarray analysis and real
time PCR showed that HIF-1α suppression significantly inhibited some pro-angiogenic factor
genes such as VEGFA, IL-8, CCL2, MMP9. The capacity of HIF-1α to regulate VEGFA and IL8
gene expression by MM cells confirmed our previous data27,41
and supports HIF-1α as a key
regulator of angiogenesis also in MM cells because VEGF9-10
and at least in part of IL-8115,116
are
well known factors involved in MM-induced angiogenesis. CCL2 and MMP9 could be also
involved in the pro-angiogenic role of HIF-1α because both cytokines are produced by MM
cells and contribute to angiogenesis and BM spreading.46, 117,118
Interestingly our data suggest that other than angiogenic cytokines, HIF-1α suppression affects
expression and production of MM-derived pro-osteoclastogenic factors that are known to be
involved in osteoclast formation and bone destruction such as CCL3/MIP1α120
and IL-7.122
To
our knowledge is the first time that the capacity of HIF-1α to regulate pro-osteoclastogenic
cytokine in MM cells has been reported although the evidence that CCL3/MIP1α and IL-7 are
potential target genes of HIF-1α has been shown in other cells such as acute myeloid leukemia
cells for CCL3/MIP1α119
and mesenchymal/osteoblastic cells for IL-7120
To evaluate the role of HIF-1α as a potential target in MM we used two different in vivo
models: the subcutaneously and the intra-tibial model . A dramatic effect on tumor burden
was demonstrated in both models by HIF-1α suppression showing a significant reduction of
tumor mass. Because the lack of a significant effect of HIF-1α suppression on cell proliferation
and survival of HMCLs in vitro, we think that the anti-MM in vivo effect was mainly due to the
inhibitory effect on angiogenesis. This was supported by the capacity of HIF-1α to regulate the
pro-angiogenic profiles of HMCLs in vitro and by our previous results showing that HIF-1α
suppression blocks MM-induced in vitro angiogenesis.105
The significant inhibition of
angiogenesis both in terms of reduction in the number and length of vessels observed in mice
injected with JJN3-anti-HIF-1α as compared to JJN3-pWPI in both mouse models confirmed
that the anti-tumor effect of HIF-1α suppression was mainly due to the inhibition of
angiogenesis. In support of these data, the inhibitory effect on angiogenesis by HIF-1α
suppression was accompanied by a reduction of VEGF immunostaining and of the proliferative
index, Ki67, that could be related to angiogenesis in MM, although it did not reach a statistical

34
significance. Finally, in line with our data it has been previously reported that HIF-1α inhibition
by RNA interference inhibits in vivo angiogenesis in mice in other tumor models.122
In addition to the inhibition of angiogenesis, we showed in the intra-tibial bone model that
HIF-1α suppression also affects MM-induced in vivo formation of osteolytic bone lesions. This
could be due in part to the inhibitory effect on MM growth via the inhibition of angiogenesis
but also to a direct effect on the production of pro-osteoclastogenic cytokines as shown in
vitro. The capacity of HIF-1α suppression to block the development of osteolytic lesions in the
intra-tibial MM model may explain in turn its anti-MM effect because it is well known that
osteoclast activation supports MM cells growth in vivo.122
Similarly it has been previously
reported that hypoxia and HIF-1α lead to development of osteolytic lesions and tumor growth
in breast cancer in vivo modles.124
In conclusion, as in other tumoral models where it has been shown that HIF-1α inhibition
exerts a potent in vivo anti-tumor effect, including the squamous cell carcinoma, liver and lung
cancer,121-122,124
our data indicate that selective HIF-1α inhibition results in a potent anti-MM
effect by blocking angiogenesis and the development of osteolytic bone lesions. These results
suggest that HIF-1α is a potential therapeutic target in MM. In this context, it has been
recently reported that adaphostin inhibits HIF-1α expression and induces a significant anti-
angiogenic and anti-MM activity in a MM xenograft mouse model 108
. Further, a growing
number of novel anti-cancer agents have been demonstrated to inhibit HIF-1α with different
molecular mechanisms including histone deacetylases, molecules acting on RAS-RAK-MEK-ERK
pathways and PI3K-AKT, mTOR inhibitors that are also currently in phase I-II clinical trials in
MM.104
Our study give the rational design to clinical trial with selective inhibitors of HIF-1α
mRNA, such as EZN-2968 123
in MM patients.

35
REFERENCES
1. Gareth J. Morgan et al. The genetic architecture of multiple myeloma. Nature reviews cancer
2012; 17: 335-348.
2. Kyle R. A. et al. Clinical course and prognosis of smoldering (asymptomatic) multiple myeloma.
N. Engl. J. Med. 2007; 356; 2582-2590.
3. Palumbo A. et al. Multiple Myeloma. N. Engl. J. Med. 2011; 364; 1046-1060.
4. Edwards C. M. et al. The pathogenesis of the bone disease of multiple myeloma. Bone 2008; 42
(6): 1007-1013.
5. Chapman M. A. et al. Initial genome sequencing and analysis of multiple myeloma. Nature
2011; 471: 467-472.
6. Avet-Loiseau H. et al. Genetic abnormalities and survival in multiple myeloma: the experience
of the Intergroupe Francophone du Myélome. Blood 2007; 109: 3489-3495.
7. Kuehl W.M. et al. Multiple myeloma: evolving genetic events and host interactions. Nat. Rev.
Cancer 2002; 2: 175-187.
8. Bergsagel P. L. et al. Molecular pathogenesis and a consequent classification of multiple
myeloma. J. Clin. Oncol. 2005; 23: 6333-6338.
9. Arun Balakumaran et al. Bone marrow microenvironment in myelomagenesis: its potential role
in early diagnosis. Expert.Rev. Mol. Diagn. 2010; 10 (4): 465-480.
10. Mitsiades C. S. et al. The role of the bone microenvironment in the pathophysiology and
therapeutic management of multiple myeloma: interplay of growth factors, their receptors and
stromal interactions. Eur. J. Cancer 2006; 42: 1564-1573.
11. Hideshima T. et al. Understanding multiple myeloma pathogenesis in the bone marrow to
identify new therapeutic targets. Nat. Rev. Cancer 2007; 7: 585-598.
12. Trouvin A. P. et al. Receptor activator of nuclear factor-κB ligand and osteoprotegerin:
maintaining the balance to prevent bone loss. Clin. Interv. Aging 2010; 5: 345-354.
13. Giuliani N. et al. Osteogenic differentiation of mesenchymal stem cells in multiple myeloma:
Identification of potential therapeutic targets. Exp. Hematol. 2009; 37: 879-886.
14. Barillé-Nion S. et al. New insights in myeloma-induced osteolysis. Leuk. Lymphoma 2003; 44:
1463-1467.
15. Bataille R. et al. Quantifiable excess of bone resorption in monoclonal gammopathy is an early
symptom of malignancy: a prospective study of 87 bone biopsies. Blood 1996; 87: 4762-4769.
16. Bataille R. et al. Multiple Myeloma. N. Engl. J. Med. 1997; 336: 1657-1664.
36
17. Yaccoby S. Osteoblastogenesis and tumor growth in myeloma. Leuk Lymphoma 2010; 51(2):
213-220.
18. Raje N. et al. Advances in the biology and treatment of bone disease in multiple myeloma. Clin
Cancer Res 2011; 17: 1278-1286.
19. Khosla S. Minireview: The OPG/RANKL/RANK system. Endocrinology 2001; 142: 5050-5055.
20. Simonet W.S. et al. Osteoprotegerin: a novel secreted protein involved in the regulation of
bone density. Cell 1997; 89: 309-319.
21. Kong Y.Y. et al. OPGL is a key regulator of osteoclastogenesis, lymphocyte development and
lymph-node organogenesis. Nature 1999; 397: 315-323.
22. Burgess T.L. et al. The ligand for osteoprotegerin (OPGL) directly activates mature osteoclasts. J
Cell Biol 1999; 145: 527-538.
23. Bucay N. et al. Osteoprotegerin-deficient mice develop early onset osteoporosis and arterial
calcification. Gees Dev 1998; 12: 1260-1268
24. Takayamagi H. et al. T-cell-mediated regulation of osteoclastogenesis by signaling cross-talk
between RANKL and IFN-γ. Nature 2000; 408: 600-605.
25. Lacey D.L. et al. Osteoprotegerin ligand is a cytokine that regulates osteoclast differentiation
and activation. Cell 1998; 93: 165-176.
26. Yasuda H. et al. Osteoclast differentiation factor is a ligand for
osteoprotegerin/osteoclastogenesis-inhibitory factor and is identical to TRANCE/RANKL. Proc
Natl Acad Sci USA 1998; 95: 3597-3602.
27. Pearse R.N. et al. Multiple Myeloma disrupts the TRANCE/osteoprotegerin cytokine axis to
trigger bone destruction and promote tumor progression. Proc Natl Acad Sci USA 2001; 98:
11581-11586.
28. Giuliani N. et al. Myeloma cells induce imbalance in the osteoprotegerin/osteoprotegerin
ligand system in the human bone marrow environment. Blood 2001; 98: 3527-3533.
29. Roux S. et al. RANK and RANKL expression in multiple myeloma. BR J Haematol 2002; 117: 86-
92.
30. Giuliani N. et al. New insight in the mechanism of osteoclast activation and formation in
multiple myeloma: Focus on the receptor activator of NF-κB ligand (RANKL). Exp Hematol 2004;
32: 685-691.
31. Han J.H. et al. Macrophage inflammatory protein 1-alpha is an osteoclastogenic factor in
myeloma that is independent of receptor activator of nuclear factor Kappa B ligand. Blood
2001; 97: 3349-3353.
32. Hashimoto T. et al. Ability of myeloma cells to secrete macrophage inflammatory protein (MIP)-
1alpha and MIP-1beta correlates with lytic bone lesions in patients with multiple myeloma. Br J
Haematol 2004; 125: 38-41.
37
33. Masih-Khan E. et al. MIP-1alpha (CCL3) is a downstream target of FGFR3 and RAS-MAPK
signaling in multiple myeloma. Blood 2006; 108: 3465-3471.
34. Lee J.W. et al. IL-3 expression by myeloma cells increases both osteoclast formation and growth
of myeloma cells. Blood 2004; 103: 2308-2315.
35. Roodman G.D. Pathogenesis of Myeloma Bone Disease. J Cell Biochem 2010; 109: 283-291.
36. Hjorth-Hansen H. et al. Marked osteoblastopenia and reduced bone formation in model of
ultiple myeloma bone disease in severe combined immunodeficiency mice. J Bone Miner Res
1999; 14: 256-263.
37. Franz-Odendaal T.A. et al. Buried alive: How osteoblasts become osteocytes. Dev Dyn Advanced
electronic publication 2005.
38. Franceschi R.T. et al. Transcriptional regulation of osteoblasts. Ann NY Acad Sci 2007; 1116:
196-207.
39. Deng Z.L. et al. Regulation of osteogenic differentiation during skeletal development. Front
Biosci 2008; 13: 2001-2021.
40. Zhang C. Transcriptional regulation of bone formation by the osteoblast-specific transcription
factor Osx. J Orthop Surgery Res 2010; 5: 37.
41. Ducy P. et al. Osf2/Cbfa1: a transcriptional activator of osteoblast differentiation. Cell 1997; 89:
747-754.
42. Franceschi R.T. et al. Regulation of the osteoblast-specific transcription factor, Runx2:
responsiveness to multiple signal transduction pathways. J Cell Biochem 2003; 88: 446-454.
43. Giuliani N. et al. Myeloma cells block RUNX2/CBFA1 activity in human bone marrow osteoblast
preogenitors and inhibit osteoblast formation and differentiation. Blood 2005; 106: 2472-2483.
44. Thirunavukkarasu K. et al. The osteoblast-specific transcription factor Cbfa1 contributes to the
expression of osteoprotegerin, a potent inhibitor of osteoclast differentiation and function. J
Biol Chem 2000; 275: 25163-25172.
45. Weitzmann M.N. et al. Increased production of IL-7 uncouples bone formation from bone
resorption during estrogen deficiency. J Clin Invest 2002; 110: 1643-1650.
46. Giuliani N. et al. Human myeloma cells stimulate the receptor activator of nuclear factor-Kappa
B ligand (RANKL) in T lymphocytes: a potential role in multiple myeloma bone disease. Blood
2002; 100: 4615-4621.
47. Ehrlich L.A. et al. IL-3 is a potential inhibitor of osteoblast differentiation in multiple myeloma.
Blood 2005; 106: 1407-1414.
48. Li B. et al. Elevated tumor necrosis factor-alpha suppresses TAZ expression and impairs
osteogenic potential of Flk-1+ mesenchymal stem cells in patients with multiple myeloma. Stem
Cells Dev 2007; 16: 921-930.
38
49. Gilbert L. et al. Expression of the osteoblast differentiation factor RUNX2
(Cbfa1/AML3/Pebp2alpha A) is inhibited by tumor necrosis factor-alpha. J Biol Chem 2002; 277:
2695-2701.
50. Risau W. Mechanisms of angiogenesis. Nature 1997;386:671–4.
51. Carmeliet P. Angiogenesis in health and disease. Nat Med 2003;9:653–60.
52. Carmeliet P, Jain RK. Angiogenesis in cancer and otherdiseases. Nature 2000;407:249–57.
53. Bergers G, Benjamin LE. Tumourigenesis and the angiogenic switch. Nat Rev Cancer
2003;3:401–10.
54. Folkman J. What is the evidence that tumours are angiogenesis dependent? J Natl Cancer Inst
1990;82:4–6.
55. Weidner N, Semple JP, Welch WR, Folkman J. Tumour angiogenesis and metastasis: correlation
with invasive breast carcinoma. N Engl J Med 1991;324:1–8.
56. Folkman J, Shing Y. Angiogenesis. J Biol Chem 1992;267:10931–4.
57. Hanahan D, Folkman J. Patterns and emerging mechanisms of the angiogenic switch during
tumourigenesis. Cell 1996;86:353–64
58. Anderson KC, Carrasco RD. Pathogenesis of myeloma. Annu Rev Pathol. 2011;28(6):249–274.
59. Asosingh K, Raeve H, Menu E, Riet I, Marck E, Camp B, Vanderkerken K. Angiogenic switch
during 5T2MM murine myeloma tumorigenesis: role of CD45
heterogeneity. Blood. 2004;103:3131–3137.
60. Vacca A, Ribatti D, Presta M, Minischetti M, Iurlaro M, Ria R, Albini A, Bussolino F, Dammacco F.
Bone marrow neovascularization, plasma cell angiogenic potential, and matrix
metalloproteinase-2 secretion parallel progression of human multiple
myeloma. Blood. 1999;93:3064–3073
61. Jakob C, Sterz J, Zavrski I, Heider U, Kleeberg L, Fleissner C, Kaiser M, Sezer O. Angiogenesis in
multiple myeloma. Eur J Cancer. 2006;42:1581–1590.
62. Rajkumar SV, Mesa RA, Fonseca R, Schroeder G, Plevak MF, Dispenzieri A, Lacy MQ, Lust JA,
Witzig TE, Gertz MA, Kyle RA, Russell SJ, Greipp PR. Bone marrow angiogenesis in 400 patients
with monoclonal gammopathy of undetermined significance, multiple myeloma, and primary
amyloidosis.Clin Cancer Res. 2002;8:2210–2216.
63. Alexandrakis MG, Passam FH, Dambaki C, Pappa CA, Stathopoulos EN. The relation between
bone marrow angiogenesis and the proliferation index Ki-67 in multiple myeloma. J Clin
Pathol.2004;57:856–860.
64. Andersen NF, Standal T, Nielsen JL, Heickendorff L, Borset M, Sørensen FB, Abildgaard N.
Syndecan-1 and angiogenic cytokines in multiple myeloma: correlation with bone marrow
angiogenesis and survival. Br J Haematol. 2005;128:210–217.
65. Bhatti SS, Kumar L, Dinda AK, Dawar R. Prognostic value of bone marrow angiogenesis in
multiple myeloma: use of light microscopy as well as computerized image analyzer in the
39
assessment of microvessel density and total vascular area in multiple myeloma and its
correlation with various clinical, histological, and laboratory parameters. Am J
Hematol. 2006;81:649–656.
66. Hillengass J, Wasser K, Delorme S, Kiessling F, Zechmann C, Benner A, Kauczor HU, Ho AD,
Goldschmidt H, Moehler TM. Lumbar bone marrow microcirculation measurements from
dynamic contrast-enhanced magnetic resonance imaging is a predictor of event-free survival in
progressive multiple myeloma. Clin Cancer Res. 2007;13:475–481
67. Munshi NC, Wilson C. Increased bone marrow microvessel density in newly diagnosed multiple
myeloma carries a poor prognosis. Semin Oncol. 2001;28:565–569.
68. Sezer O, Niemöller K, Jakob C, Zavrski I, Heider U, Eucker J, Kaufmann O, Possinger K.
Relationship between bone marrow angiogenesis and plasma cell infiltration and serum beta2-
microglobulin levels in patients with multiple myeloma. Ann Hematol. 2001;80:598–601.
69. Schreiber S, Ackermann J, Obermair A, Kaufmann H, Urbauer E, Aletaha K, Gisslinger H, Chott A,
Huber H, Drach J. Multiple myeloma with deletion of chromosome 13q is characterized by
increased bone marrow neovascularization. Br J Haematol. 2000;110:605–609.
70. Hillengass J, Zechmann CM, Nadler A, Hose D, Cremer FW, Jauch A, Heiss C, Benner A, Ho AD,
Bartram CR, Kauczor HU, Delorme S, Goldschmidt H, Moehler TM. Gain of 1q21 and distinct
adverse cytogenetic abnormalities correlate with increased microcirculation in multiple
myeloma. Int J Cancer.2008;122:2871–2875.
71. Ferrara N, Gerber HP, LeCouter J. The biology of VEGF and its receptors. Nat Med. 2003;9:669–
676
72. Bellamy WT. Expression of vascular endothelial growth factor and its receptors in multiple
myeloma and other hematopoietic malignancies. Semin Oncol. 2001;28:551–559.
73. Dankbar B, Padro T, Leo R, Feldmann B, Kropff M, Mesters RM, Serve H, Berdel WE, Kienast J.
Vascular endothelial growth factor and interleukin-6 in paracrine tumor-stromal cell
interactions in multiple myeloma. Blood. 2000;95:2630–2636.
74. Wang X, Zhang Z, Yao C. Angiogenic activity of mesenchymal stem cells in multiple
myeloma. Cancer Invest. 2011;29:37–41
75. Podar K, Tai YT, Davies FE, Lentzsch S, Sattler M, Hideshima T, Lin BK, Gupta D, Shima Y,
Chauhan D, Mitsiades C, Raje N, Richardson P, Anderson KC. Vascular endothelial growth factor
triggers signaling cascades mediating multiple myeloma cell growth and
migration. Blood. 2001;98:428–435.
76. Giuliani N, Lunghi P, Morandi F, Colla S, Bonomini S, Hojden M, Rizzoli V, Bonati A.
Downmodulation of ERK protein kinase activity inhibits VEGF secretion by human myeloma
cells and myeloma-induced angiogenesis. Leukemia. 2004;18:628–635.
77. Giuliani N, Colla S, Rizzoli V. Angiogenic switch in multiple myeloma. Hematology.2004;9:377–
381.
40
78. Raimondo F, Azzaro MP, Palumbo G, Bagnato S, Giustolisi G, Floridia P, Sortino G, Giustolisi R.
Angiogenic factors in multiple myeloma: higher levels in bone marrow than in peripheral
blood. Haematologica. 2000;85:800–805.
79. Colla S, Morandi F, Lazzaretti M, Polistena P, Svaldi M, Coser P, Bonomini S, Hojden M, Martella
E, Chisesi T, Rizzoli V, Giuliani N. Do human myeloma cells directly produce basic
FGF? Blood. 2003;102:3071–3072.
80. 49. Holash J, Wiegand SJ, Yancopoulos GD. New model of tumor angiogenesis: dynamic balance
between vessel regression and growth mediated by angiopoietins and
VEGF.Oncogene. 1999;18:5356–5362.
81. 50. Davis S, Aldrich TH, Jones PF, Acheson A, Compton DL, Jain V, Ryan TE, Bruno J, Radziejewski
C, Maisonpierre PC, Yancopoulos GD. Isolation of angiopoietin-1, a ligand for the TIE2 receptor,
by secretion-trap expression cloning. Cell. 1996;87:1161–1169.
82. Papapetropoulos A, Garcia-Cardena G, Dengler TJ, Maisonpierre PC, Yancopoulos GD, Sessa
WC. Direct actions of angiopoietin-1 on human endothelium: evidence for network
stabilization, cell survival, and interaction with other angiogenic growth factors. Lab
Invest. 1999;79:213–223.
83. Giuliani N, Colla S, Lazzaretti M, Sala R, Roti G, Mancini C, Bonomini S, Lunghi P, Hojden M,
Genestreti G, Svaldi M, Coser P, Fattori PP, Sammarelli G, Gazzola GC, Bataille R, Almici C,
Caramatti C, Mangoni L, Rizzoli V. Proangiogenic properties of human myeloma cells:
production of angiopoietin-1 and its potential relationship to myeloma-induced
angiogenesis. Blood. 2003;102:638–645. doi: 10.1182/blood-2002-10-3257.
84. Kessenbrock K, Plaks V, Werb Z. Matrix metalloproteinases: regulators of the tumor
microenvironment. Cell. 2010;141:52–67.
85. Rundhaug JE. Matrix metalloproteinases and angiogenesis. J Cell Mol Med.2005;9:267–285.
86. Valckenborgh E, Bakkus M, Munaut C, Noël A, St Pierre Y, Asosingh K, Riet I, Camp B,
Vanderkerken K. Upregulation of matrix metalloproteinase-9 in murine 5 T33 multiple myeloma
cells by interaction with bone marrow endothelial cells. Int J Cancer.2002;101:512–518.
87. Valckenborgh E, Croucher PI, Raeve H, Carron C, Leenheer E, Blacher S, Devy L, Noël A, Bruyne
E, Asosingh K, Riet I, Camp B, Vanderkerken K. Multifunctional role of matrix
metalloproteinases in multiple myeloma: a study in the 5T2MM mouse model. Am J
Pathol. 2004;165:869–878. doi: 10.1016/S0002-9440(10)63349-4.
88. Belperio JA, Keane MP, Arenberg DA, Addison CL, Ehlert JE, Burdick MD, Strieter RM. CXC
chemokines in angiogenesis. J Leukoc Biol. 2000;68:1–8.
89. Colla S, Tagliaferri S, Morandi F, Lunghi P, Donofrio G, Martorana D, Mancini C, Lazzaretti M,
Mazzera L, Ravanetti L, Bonomini S, Ferrari L, Miranda C, Ladetto M, Neri TM, Neri A, Greco A,
Mangoni M, Bonati A, Rizzoli V, Giuliani N. The new tumor-suppressor gene inhibitor of growth
family member 4 (ING4) regulates the production of proangiogenic molecules by myeloma cells

41
and suppresses hypoxia-inducible factor-1 alpha (HIF-1alpha) activity: involvement in myeloma-
induced angiogenesis. Blood.2007;110:4464–4475.
90. Yuan A, Chen JJ, Yao PL, Yang PC. The role of interleukin-8 in cancer cells and microenvironment
interaction. Front Biosci. 2005;10:853–865.
91. Shapiro VS, Mollenauer MN, Weiss A. Endogenous CD28 expressed on myeloma cells up-
regulates interleukin-8 production: implications for multiple myeloma
progression. Blood.2001;98:187–193.
92. Kumar S, Witzig TE, Timm M, Haug J, Wellik L, Kimlinger TK, Greipp PR, Rajkumar SV. Bone
marrow angiogenic ability and expression of angiogenic cytokines in myeloma: evidence
favoring loss of marrow angiogenesis inhibitory activity with disease progression.Blood. 2004.
93. Giuliani N, Storti P, Bolzoni M, Palma BD, Bonomini S. Angiogenesis and multiple
Myeloma. Cancer Microenvironment. 2011;4(3):325–337.
94. Hickey MM, Simon MC. Regulation of angiogenesis by hypoxia and hypoxia-inducible
factors. Curr Top Dev Biol. 2006;76:217–257.
95. Hirota K, Semenza GL. ReguIation of angiogenesis by hypoxia-inducibIe factor 1. Crit Rev OncoI
Hematol. 2006;59:15–26.
96. Lisy K, Peet DJ. Turn me on: regulating HIF transcriptional activity. Cell Death
Differ. 2008;15:642–649.
97. Weidemann A, Johnson RS. Biology of HIF-1α Cell Death Differ. 2008;15:621–627.]
98. Rankin EB, Giaccia AJ. The role of hypoxia-inducible factors in tumorigenesis. Cell Death
Differ. 2008;15:678–685.
99. Brahimi-Horn MC, Chiche J, Pouysségur J. Hypoxia and cancer. J Mol Med.2007;85:1301–1307
100. Ferrara N, Kerbel RS (2005) Angiogenesis as a therapeutic target. Nature 438:967–974
101. Fantin VR, St-Pierre J, Leder P (2006) Attenuation of LDH-A expression uncovers a link between
glycolysis, mitochondrial physiology, and tumor maintenance. Cancer Cell 9:425–434
102. Kim JW, Tchernyshyov I, Semenza GL, Dang CV (2006) HIF-1-mediated expression of pyruvate
dehydrogenase kinase: a metabolic switch required for cellular adaptation to hypoxia. Cell
Metab 3:177–185
103. Kim JW, Gao P, Liu YC, Semenza GL, Dang CV (2007) HIF-1 and dysregulated c-Myc
cooperatively induces VEGF and metabolic switches, HK2 and PDK1. Mol Cell Biol 27:7381–7393
104. Pouyssegur J, Dayan F, Mazure NM (2006) Hypoxia signalling in cancer and approaches to
enforce tumour regression. Nature 441:437–443.
105. Colla S, Storti P, Donofrio G, Todoerti K, Bolzoni M, Lazzaretti M, Abeltino M, Ippolito L, Neri A,
Ribatti D, Rizzoli V, Martella E, Giuliani N. Low bone marrow oxygen tension and hypoxia-
inducible factor-1α overexpression characterize patients with multiple myeloma: role on the
transcriptional and proangiogenic profiles of CD138(+) cells. Leukemia.2010;24:1967–1970.
42
106. Harrison JS, Rameshwar P, Chang V, Bandari P. Oxygen saturation in the bone marrow of
healthy volunteers. Blood. 2002;99:394
107. Asosingh K, Raeve H, Ridder M, Storme GA, Willems A, Riet I, Camp B, Vanderkerken K. Role of
the hypoxic bone marrow microenvironment in 5T2MM murine myeloma tumor
progression. Haematologica. 2005;90:810–817.
108. Zhang J, Sattler M, Tonon G, Grabher C, Lababidi S, Zimmerhackl A, Raab MS, Vallet S, Zhou Y,
Cartron MA, Hideshima T, Tai YT, Chauhan D, Anderson KC, Podar K. Targeting angiogenesis via
a c-Myc/hypoxia-inducible factor-1alpha-dependent pathway in multiple myeloma. Cancer
Res. 2009;69(12):5082–5090.
109. Liao D, Johnson RS. Hypoxia: a key regulator of angiogenesis in cancer. Cancer Metastasis Rev.
2007;26: 281-90.
110. Martin SK, Diamond P, Gronthos S, Peet DJ, Zannettino AC. The emerging role of hypoxia, HIF-1
and HIF-2 in multiple myeloma. Leukemia. 2011;25:1533-42
111. Hu Y, Kirito K, Yoshida K, Mitsumori T, Nakajima K, Nozaki Y et al. Inhibition of hypoxiainducible
factor-1 function enhances the sensitivity of multiple myeloma cells to melphalan. Mol Cancer
Ther. 2009;8:2329-38.
112. Colla S, Zhan F, Xiong W, Wu X, Xu H, Stephens O et al. The oxidative stress response regulates
DKK1 expression through the JNK signaling cascade in multiple myeloma plasma cells. Blood.
2007;109:4470-77.
113. Veschini L, Belloni D, Foglieni C, Cangi MG, Ferrarini M, Caligaris-Cappio F et al. Hypoxia
inducible transcription factor-1 alpha determines sensitivity of endothelial cells to the
proteosome inhibitor bortezomib. Blood. 2007;109:2565-70.
114. Negaard HF, Iversen N, Bowitz-Lothe IM, Sandset PM, Steinsvik B, Ostenstad B et al. Increased
bone marrow microvascular density in haematological malignancies is associated with
differential regulation of angiogenic factors. Leukemia. 2009;23:162-69.
115. Arendt BK, Velazquez-Dones A, Tschumper RC, Howell KG, Ansell SM, Witzig TE, et al.
Interleukin 6 induces monocyte chemoattractant protein-1 expression in myeloma cells.
Leukemia. 2002;16:2142-47.
116. Van Valckenborgh E, Bakkus M, Munaut C, Noël A, St Pierre Y, Asosingh K et al. Upregulation of
matrix metalloproteinase-9 in murine 5T33 multiple myeloma cells by interaction with bone
marrow endothelial cells. Int J Cancer. 2002;101:512-18.
117. Purushothaman A, Chen L, Yang Y, Sanderson RD. Heparanase stimulation of protease
expression implicates it as a master regulator of the aggressive tumor phenotype in myeloma. J
Biol Chem. 2008;283:32628-36.
118. Choi SJ, Cruz JC, Craig F, Chung H, Devlin RD, Roodman GD,et al. Macrophage inflammatory
protein 1-alpha is a potential osteoclast stimulatory factor in multiple myeloma. Blood.
2000;96:671-75.
43
119. KJ, Bedringsaas SL, Ryningen A, Gjertsen BT, Bruserud O. Hypoxia increases HIF-1α expression
and constitutive cytokine release by primary human acute myeloid leukaemia cells. Eur
Cytokine Netw. 2010;21:154-64.
120. Nishida C, Kusubata K, Tashiro Y, Gritli I, Sato A, Ohki-Koizumi M et al. MT1-MMP plays a critical
role in hematopoiesis by regulating HIF-mediated chemokine/cytokine gene transcription
within niche cells. Blood. 2012;119:5405-16.
121. Krishnamachary B, Berg-Dixon S, Kelly B, Agani F, Feldser D, Ferreira G, et al. Regulation of
colon carcinoma cell invasion by hypoxia-inducible factor 1. Cancer Res. 2003;63:1138-
122. Li L, Lin X, Staver M, Shoemaker A, Semizarov D, Fesik SW, et al. Evaluating hypoxiainducible
factor-1alpha as a cancer therapeutic target via inducible RNA interference in vivo. Cancer Res.
2005 ;65:7249-58.
123. Greenberger LM, Horak ID, Filpula D, Sapra P, Westergaard M, Frydenlund HF et al. A RNA
antagonist of hypoxia-inducible factor-1alpha, EZN-2968, inhibits tumor cell growth. Mol
Cancer Ther. 2008;7:3598-608.
124. Hiraga T, Kizaka-Kondoh S, Hirota K, Hiraoka M, Yoneda T. Hypoxia and hypoxia-inducible
factor-1 expression enhance osteolytic bone metastases of breast cancer. Cancer Res.
2007;67:4157-63.
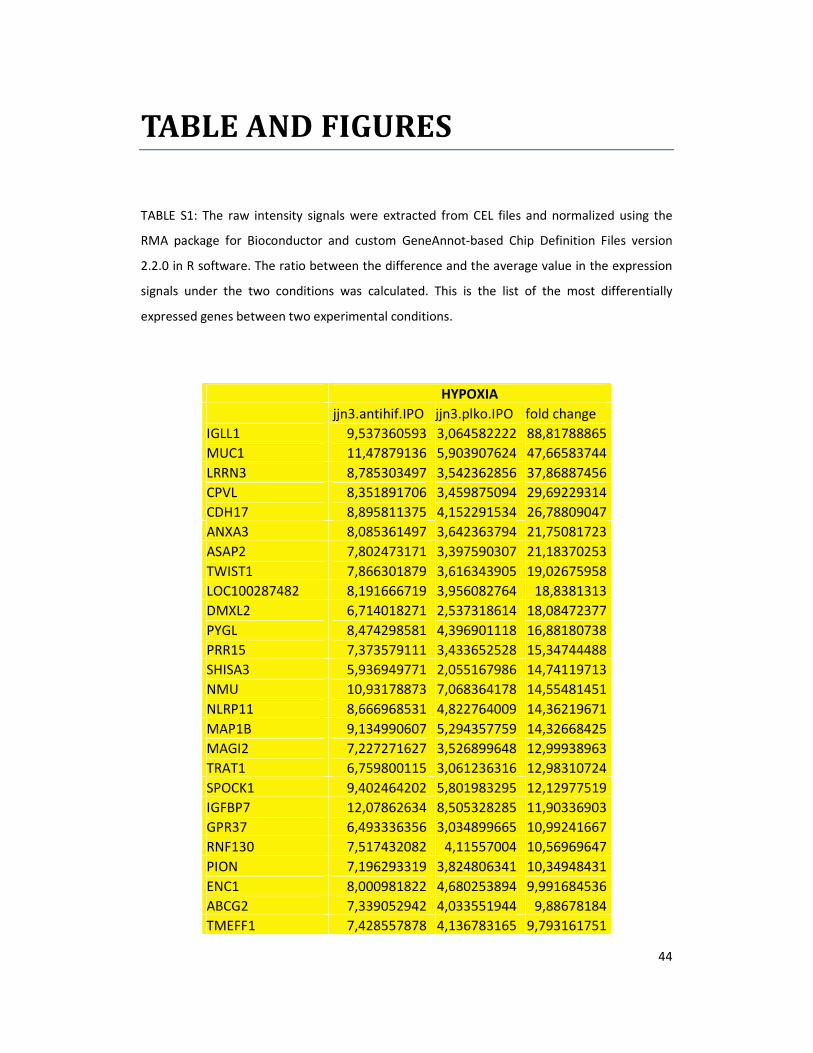
44
TABLE AND FIGURES
TABLE S1: The raw intensity signals were extracted from CEL files and normalized using the
RMA package for Bioconductor and custom GeneAnnot-based Chip Definition Files version
2.2.0 in R software. The ratio between the difference and the average value in the expression
signals under the two conditions was calculated. This is the list of the most differentially
expressed genes between two experimental conditions.
HYPOXIA
jjn3.antihif.IPO jjn3.plko.IPO fold change
IGLL1 9,537360593 3,064582222 88,81788865
MUC1 11,47879136 5,903907624 47,66583744
LRRN3 8,785303497 3,542362856 37,86887456
CPVL 8,351891706 3,459875094 29,69229314
CDH17 8,895811375 4,152291534 26,78809047
ANXA3 8,085361497 3,642363794 21,75081723
ASAP2 7,802473171 3,397590307 21,18370253
TWIST1 7,866301879 3,616343905 19,02675958
LOC100287482 8,191666719 3,956082764 18,8381313
DMXL2 6,714018271 2,537318614 18,08472377
PYGL 8,474298581 4,396901118 16,88180738
PRR15 7,373579111 3,433652528 15,34744488
SHISA3 5,936949771 2,055167986 14,74119713
NMU 10,93178873 7,068364178 14,55481451
NLRP11 8,666968531 4,822764009 14,36219671
MAP1B 9,134990607 5,294357759 14,32668425
MAGI2 7,227271627 3,526899648 12,99938963
TRAT1 6,759800115 3,061236316 12,98310724
SPOCK1 9,402464202 5,801983295 12,12977519
IGFBP7 12,07862634 8,505328285 11,90336903
GPR37 6,493336356 3,034899665 10,99241667
RNF130 7,517432082 4,11557004 10,56969647
PION 7,196293319 3,824806341 10,34948431
ENC1 8,000981822 4,680253894 9,991684536
ABCG2 7,339052942 4,033551944 9,88678184
TMEFF1 7,428557878 4,136783165 9,793161751
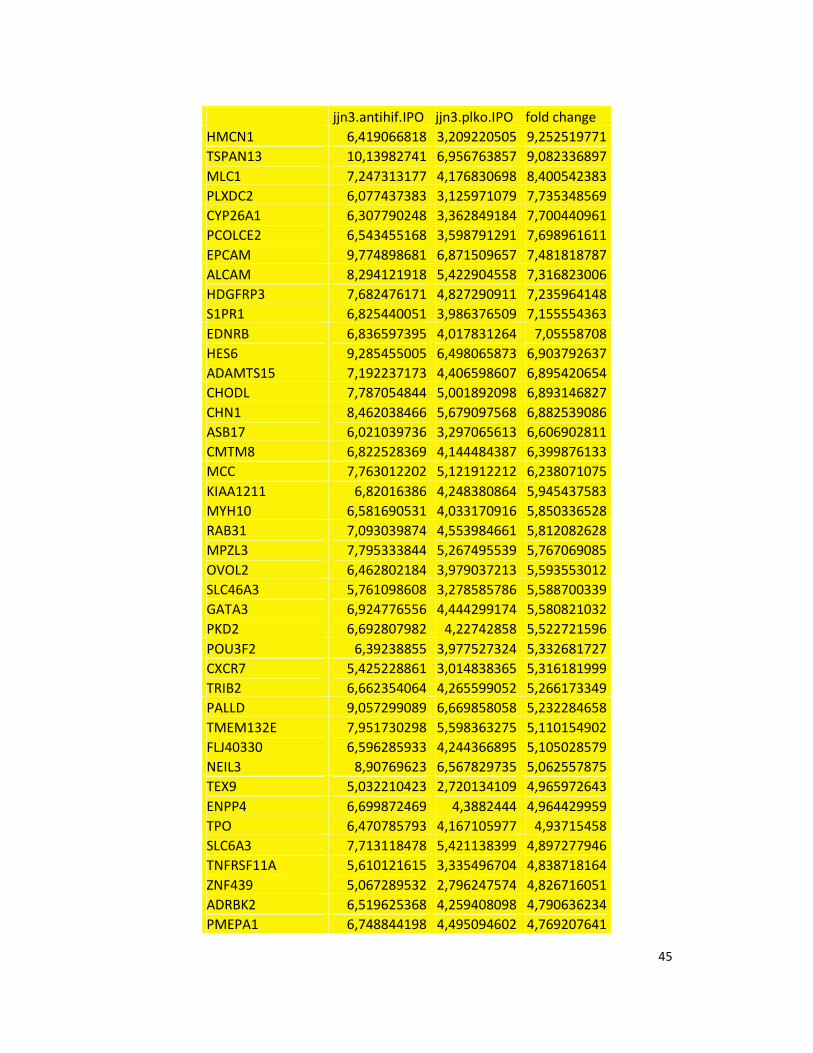
45
jjn3.antihif.IPO jjn3.plko.IPO fold change
HMCN1 6,419066818 3,209220505 9,252519771
TSPAN13 10,13982741 6,956763857 9,082336897
MLC1 7,247313177 4,176830698 8,400542383
PLXDC2 6,077437383 3,125971079 7,735348569
CYP26A1 6,307790248 3,362849184 7,700440961
PCOLCE2 6,543455168 3,598791291 7,698961611
EPCAM 9,774898681 6,871509657 7,481818787
ALCAM 8,294121918 5,422904558 7,316823006
HDGFRP3 7,682476171 4,827290911 7,235964148
S1PR1 6,825440051 3,986376509 7,155554363
EDNRB 6,836597395 4,017831264 7,05558708
HES6 9,285455005 6,498065873 6,903792637
ADAMTS15 7,192237173 4,406598607 6,895420654
CHODL 7,787054844 5,001892098 6,893146827
CHN1 8,462038466 5,679097568 6,882539086
ASB17 6,021039736 3,297065613 6,606902811
CMTM8 6,822528369 4,144484387 6,399876133
MCC 7,763012202 5,121912212 6,238071075
KIAA1211 6,82016386 4,248380864 5,945437583
MYH10 6,581690531 4,033170916 5,850336528
RAB31 7,093039874 4,553984661 5,812082628
MPZL3 7,795333844 5,267495539 5,767069085
OVOL2 6,462802184 3,979037213 5,593553012
SLC46A3 5,761098608 3,278585786 5,588700339
GATA3 6,924776556 4,444299174 5,580821032
PKD2 6,692807982 4,22742858 5,522721596
POU3F2 6,39238855 3,977527324 5,332681727
CXCR7 5,425228861 3,014838365 5,316181999
TRIB2 6,662354064 4,265599052 5,266173349
PALLD 9,057299089 6,669858058 5,232284658
TMEM132E 7,951730298 5,598363275 5,110154902
FLJ40330 6,596285933 4,244366895 5,105028579
NEIL3 8,90769623 6,567829735 5,062557875
TEX9 5,032210423 2,720134109 4,965972643
ENPP4 6,699872469 4,3882444 4,964429959
TPO 6,470785793 4,167105977 4,93715458
SLC6A3 7,713118478 5,421138399 4,897277946
TNFRSF11A 5,610121615 3,335496704 4,838718164
ZNF439 5,067289532 2,796247574 4,826716051
ADRBK2 6,519625368 4,259408098 4,790636234
PMEPA1 6,748844198 4,495094602 4,769207641
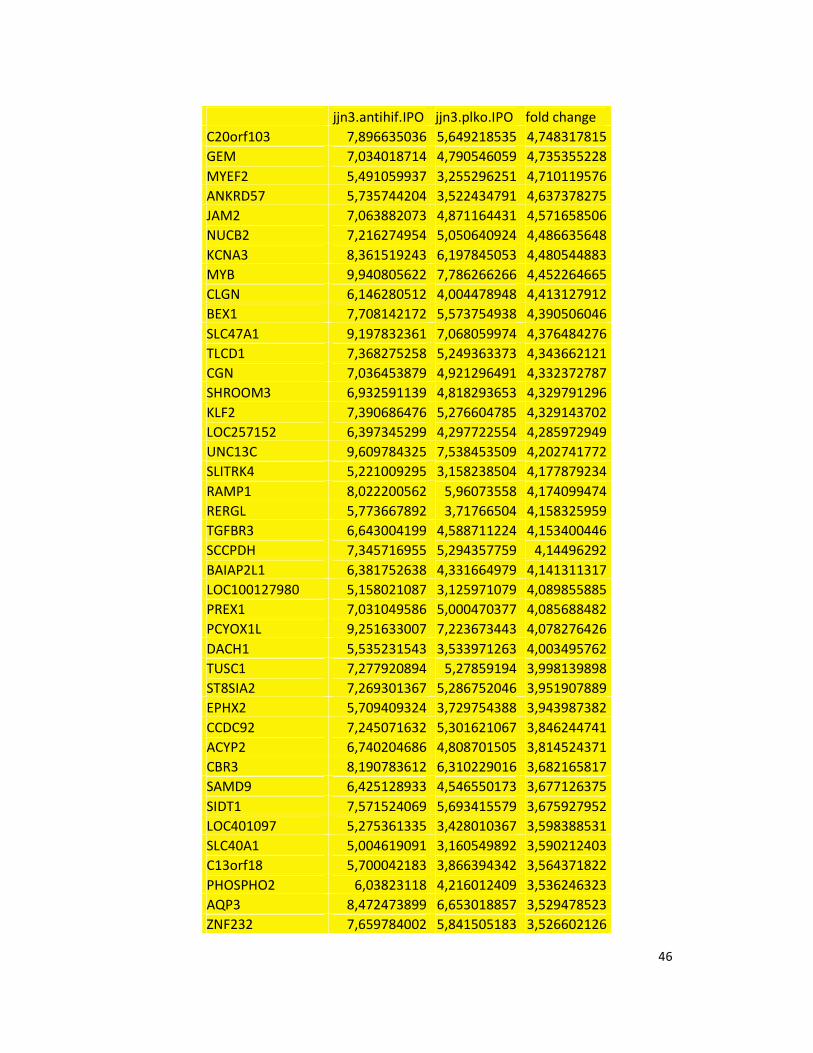
46
jjn3.antihif.IPO jjn3.plko.IPO fold change
C20orf103 7,896635036 5,649218535 4,748317815
GEM 7,034018714 4,790546059 4,735355228
MYEF2 5,491059937 3,255296251 4,710119576
ANKRD57 5,735744204 3,522434791 4,637378275
JAM2 7,063882073 4,871164431 4,571658506
NUCB2 7,216274954 5,050640924 4,486635648
KCNA3 8,361519243 6,197845053 4,480544883
MYB 9,940805622 7,786266266 4,452264665
CLGN 6,146280512 4,004478948 4,413127912
BEX1 7,708142172 5,573754938 4,390506046
SLC47A1 9,197832361 7,068059974 4,376484276
TLCD1 7,368275258 5,249363373 4,343662121
CGN 7,036453879 4,921296491 4,332372787
SHROOM3 6,932591139 4,818293653 4,329791296
KLF2 7,390686476 5,276604785 4,329143702
LOC257152 6,397345299 4,297722554 4,285972949
UNC13C 9,609784325 7,538453509 4,202741772
SLITRK4 5,221009295 3,158238504 4,177879234
RAMP1 8,022200562 5,96073558 4,174099474
RERGL 5,773667892 3,71766504 4,158325959
TGFBR3 6,643004199 4,588711224 4,153400446
SCCPDH 7,345716955 5,294357759 4,14496292
BAIAP2L1 6,381752638 4,331664979 4,141311317
LOC100127980 5,158021087 3,125971079 4,089855885
PREX1 7,031049586 5,000470377 4,085688482
PCYOX1L 9,251633007 7,223673443 4,078276426
DACH1 5,535231543 3,533971263 4,003495762
TUSC1 7,277920894 5,27859194 3,998139898
ST8SIA2 7,269301367 5,286752046 3,951907889
EPHX2 5,709409324 3,729754388 3,943987382
CCDC92 7,245071632 5,301621067 3,846244741
ACYP2 6,740204686 4,808701505 3,814524371
CBR3 8,190783612 6,310229016 3,682165817
SAMD9 6,425128933 4,546550173 3,677126375
SIDT1 7,571524069 5,693415579 3,675927952
LOC401097 5,275361335 3,428010367 3,598388531
SLC40A1 5,004619091 3,160549892 3,590212403
C13orf18 5,700042183 3,866394342 3,564371822
PHOSPHO2 6,03823118 4,216012409 3,536246323
AQP3 8,472473899 6,653018857 3,529478523
ZNF232 7,659784002 5,841505183 3,526602126
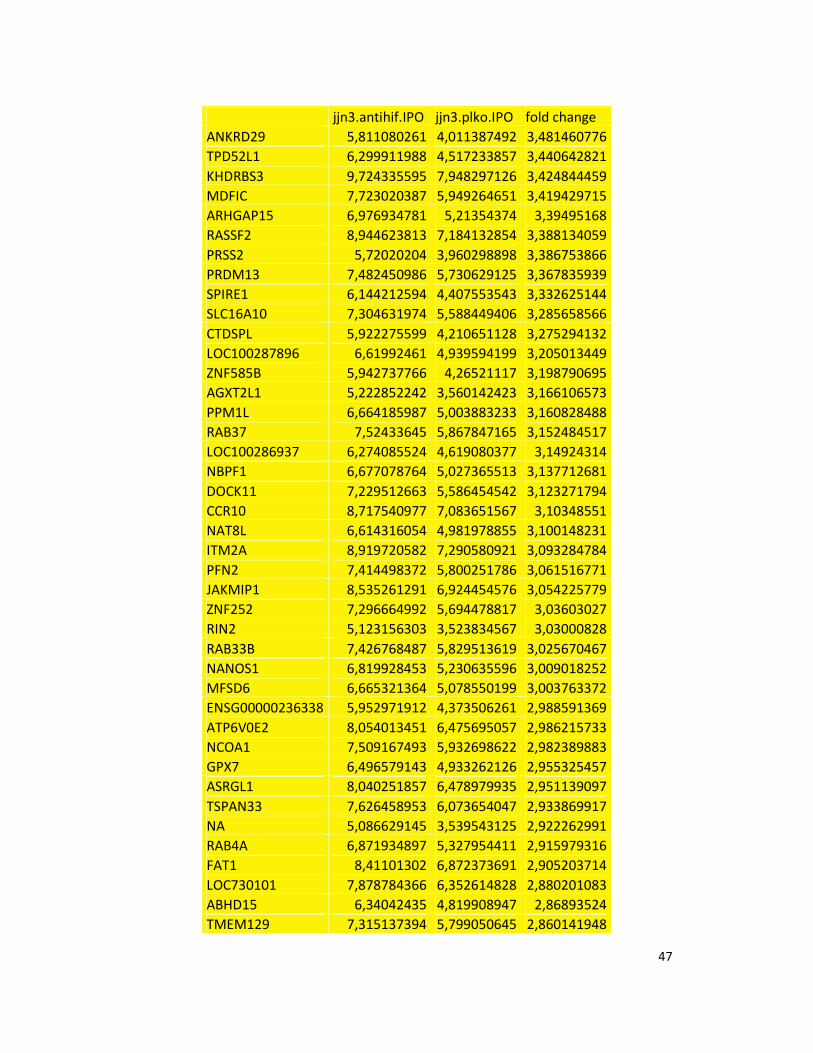
47
jjn3.antihif.IPO jjn3.plko.IPO fold change
ANKRD29 5,811080261 4,011387492 3,481460776
TPD52L1 6,299911988 4,517233857 3,440642821
KHDRBS3 9,724335595 7,948297126 3,424844459
MDFIC 7,723020387 5,949264651 3,419429715
ARHGAP15 6,976934781 5,21354374 3,39495168
RASSF2 8,944623813 7,184132854 3,388134059
PRSS2 5,72020204 3,960298898 3,386753866
PRDM13 7,482450986 5,730629125 3,367835939
SPIRE1 6,144212594 4,407553543 3,332625144
SLC16A10 7,304631974 5,588449406 3,285658566
CTDSPL 5,922275599 4,210651128 3,275294132
LOC100287896 6,61992461 4,939594199 3,205013449
ZNF585B 5,942737766 4,26521117 3,198790695
AGXT2L1 5,222852242 3,560142423 3,166106573
PPM1L 6,664185987 5,003883233 3,160828488
RAB37 7,52433645 5,867847165 3,152484517
LOC100286937 6,274085524 4,619080377 3,14924314
NBPF1 6,677078764 5,027365513 3,137712681
DOCK11 7,229512663 5,586454542 3,123271794
CCR10 8,717540977 7,083651567 3,10348551
NAT8L 6,614316054 4,981978855 3,100148231
ITM2A 8,919720582 7,290580921 3,093284784
PFN2 7,414498372 5,800251786 3,061516771
JAKMIP1 8,535261291 6,924454576 3,054225779
ZNF252 7,296664992 5,694478817 3,03603027
RIN2 5,123156303 3,523834567 3,03000828
RAB33B 7,426768487 5,829513619 3,025670467
NANOS1 6,819928453 5,230635596 3,009018252
MFSD6 6,665321364 5,078550199 3,003763372
ENSG00000236338 5,952971912 4,373506261 2,988591369
ATP6V0E2 8,054013451 6,475695057 2,986215733
NCOA1 7,509167493 5,932698622 2,982389883
GPX7 6,496579143 4,933262126 2,955325457
ASRGL1 8,040251857 6,478979935 2,951139097
TSPAN33 7,626458953 6,073654047 2,933869917
NA 5,086629145 3,539543125 2,922262991
RAB4A 6,871934897 5,327954411 2,915979316
FAT1 8,41101302 6,872373691 2,905203714
LOC730101 7,878784366 6,352614828 2,880201083
ABHD15 6,34042435 4,819908947 2,86893524
TMEM129 7,315137394 5,799050645 2,860141948
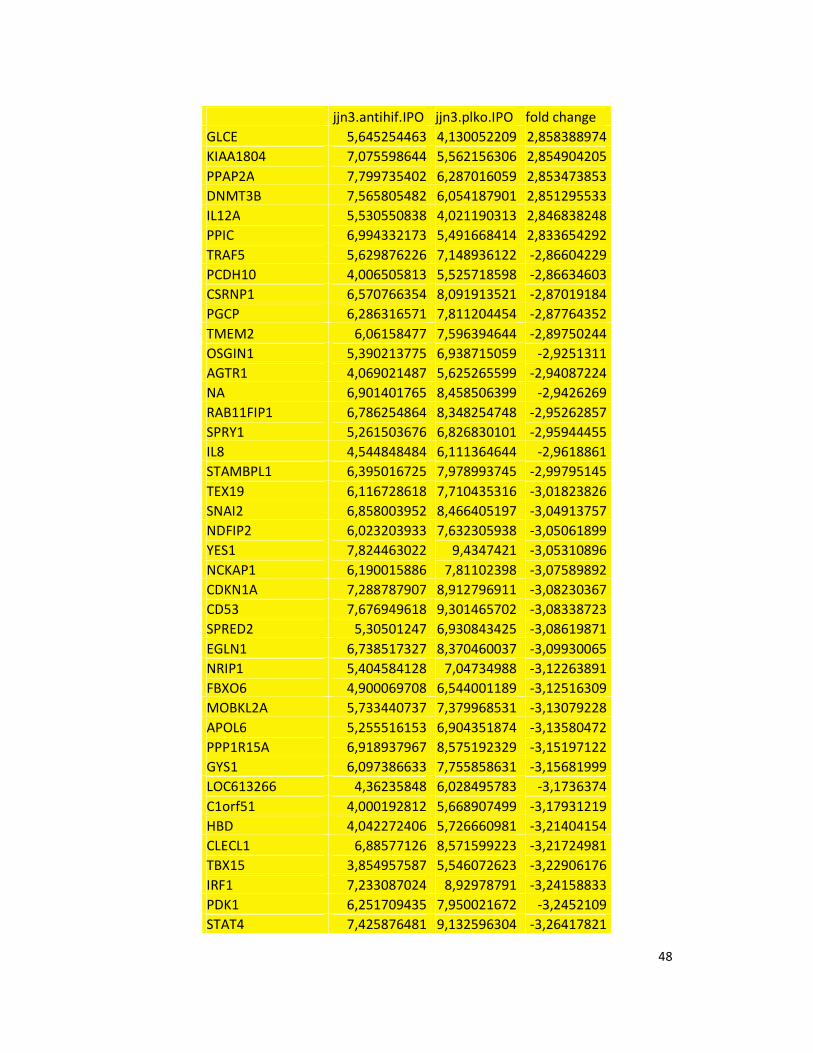
48
jjn3.antihif.IPO jjn3.plko.IPO fold change
GLCE 5,645254463 4,130052209 2,858388974
KIAA1804 7,075598644 5,562156306 2,854904205
PPAP2A 7,799735402 6,287016059 2,853473853
DNMT3B 7,565805482 6,054187901 2,851295533
IL12A 5,530550838 4,021190313 2,846838248
PPIC 6,994332173 5,491668414 2,833654292
TRAF5 5,629876226 7,148936122 -2,86604229
PCDH10 4,006505813 5,525718598 -2,86634603
CSRNP1 6,570766354 8,091913521 -2,87019184
PGCP 6,286316571 7,811204454 -2,87764352
TMEM2 6,06158477 7,596394644 -2,89750244
OSGIN1 5,390213775 6,938715059 -2,9251311
AGTR1 4,069021487 5,625265599 -2,94087224
NA 6,901401765 8,458506399 -2,9426269
RAB11FIP1 6,786254864 8,348254748 -2,95262857
SPRY1 5,261503676 6,826830101 -2,95944455
IL8 4,544848484 6,111364644 -2,9618861
STAMBPL1 6,395016725 7,978993745 -2,99795145
TEX19 6,116728618 7,710435316 -3,01823826
SNAI2 6,858003952 8,466405197 -3,04913757
NDFIP2 6,023203933 7,632305938 -3,05061899
YES1 7,824463022 9,4347421 -3,05310896
NCKAP1 6,190015886 7,81102398 -3,07589892
CDKN1A 7,288787907 8,912796911 -3,08230367
CD53 7,676949618 9,301465702 -3,08338723
SPRED2 5,30501247 6,930843425 -3,08619871
EGLN1 6,738517327 8,370460037 -3,09930065
NRIP1 5,404584128 7,04734988 -3,12263891
FBXO6 4,900069708 6,544001189 -3,12516309
MOBKL2A 5,733440737 7,379968531 -3,13079228
APOL6 5,255516153 6,904351874 -3,13580472
PPP1R15A 6,918937967 8,575192329 -3,15197122
GYS1 6,097386633 7,755858631 -3,15681999
LOC613266 4,36235848 6,028495783 -3,1736374
C1orf51 4,000192812 5,668907499 -3,17931219
HBD 4,042272406 5,726660981 -3,21404154
CLECL1 6,88577126 8,571599223 -3,21724981
TBX15 3,854957587 5,546072623 -3,22906176
IRF1 7,233087024 8,92978791 -3,24158833
PDK1 6,251709435 7,950021672 -3,2452109
STAT4 7,425876481 9,132596304 -3,26417821
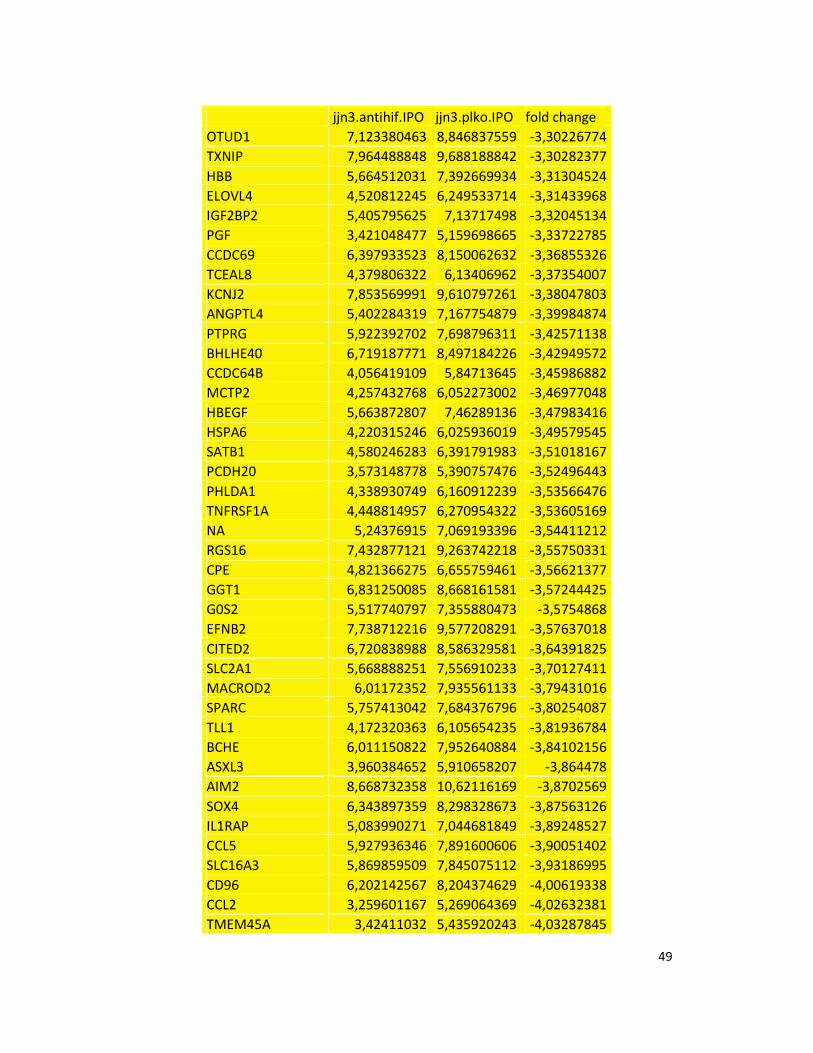
49
jjn3.antihif.IPO jjn3.plko.IPO fold change
OTUD1 7,123380463 8,846837559 -3,30226774
TXNIP 7,964488848 9,688188842 -3,30282377
HBB 5,664512031 7,392669934 -3,31304524
ELOVL4 4,520812245 6,249533714 -3,31433968
IGF2BP2 5,405795625 7,13717498 -3,32045134
PGF 3,421048477 5,159698665 -3,33722785
CCDC69 6,397933523 8,150062632 -3,36855326
TCEAL8 4,379806322 6,13406962 -3,37354007
KCNJ2 7,853569991 9,610797261 -3,38047803
ANGPTL4 5,402284319 7,167754879 -3,39984874
PTPRG 5,922392702 7,698796311 -3,42571138
BHLHE40 6,719187771 8,497184226 -3,42949572
CCDC64B 4,056419109 5,84713645 -3,45986882
MCTP2 4,257432768 6,052273002 -3,46977048
HBEGF 5,663872807 7,46289136 -3,47983416
HSPA6 4,220315246 6,025936019 -3,49579545
SATB1 4,580246283 6,391791983 -3,51018167
PCDH20 3,573148778 5,390757476 -3,52496443
PHLDA1 4,338930749 6,160912239 -3,53566476
TNFRSF1A 4,448814957 6,270954322 -3,53605169
NA 5,24376915 7,069193396 -3,54411212
RGS16 7,432877121 9,263742218 -3,55750331
CPE 4,821366275 6,655759461 -3,56621377
GGT1 6,831250085 8,668161581 -3,57244425
G0S2 5,517740797 7,355880473 -3,5754868
EFNB2 7,738712216 9,577208291 -3,57637018
CITED2 6,720838988 8,586329581 -3,64391825
SLC2A1 5,668888251 7,556910233 -3,70127411
MACROD2 6,01172352 7,935561133 -3,79431016
SPARC 5,757413042 7,684376796 -3,80254087
TLL1 4,172320363 6,105654235 -3,81936784
BCHE 6,011150822 7,952640884 -3,84102156
ASXL3 3,960384652 5,910658207 -3,864478
AIM2 8,668732358 10,62116169 -3,8702569
SOX4 6,343897359 8,298328673 -3,87563126
IL1RAP 5,083990271 7,044681849 -3,89248527
CCL5 5,927936346 7,891600606 -3,90051402
SLC16A3 5,869859509 7,845075112 -3,93186995
CD96 6,202142567 8,204374629 -4,00619338
CCL2 3,259601167 5,269064369 -4,02632381
TMEM45A 3,42411032 5,435920243 -4,03287845
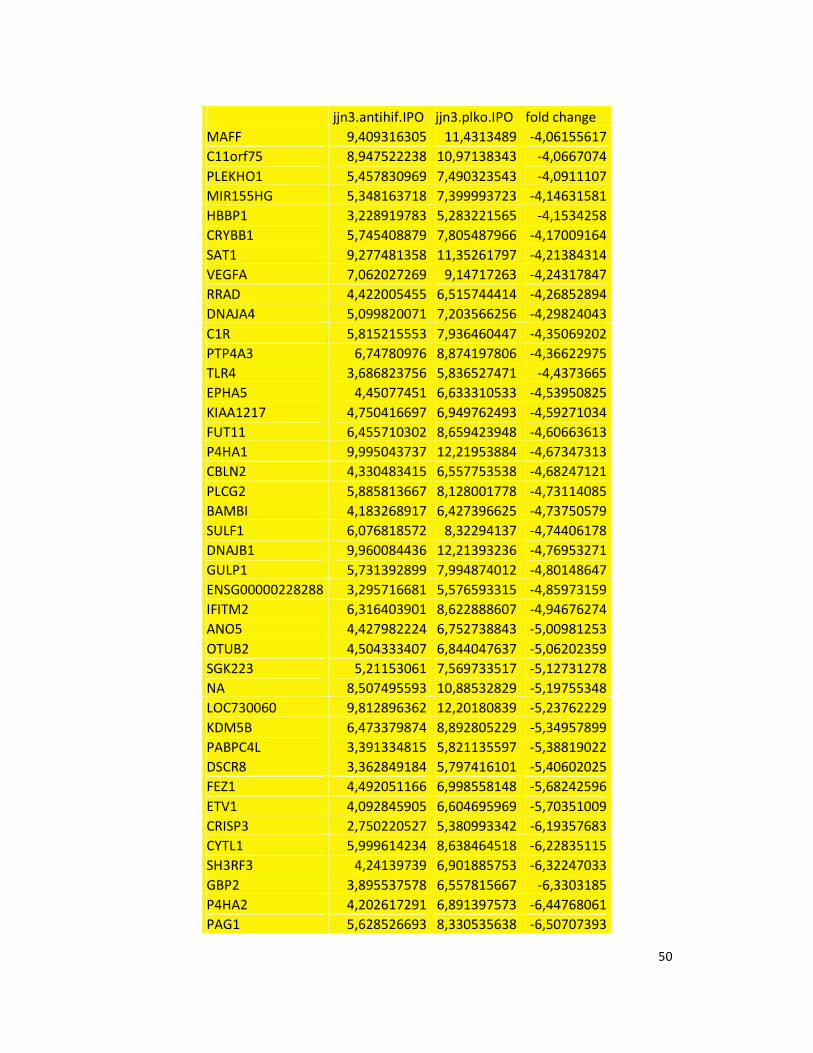
50
jjn3.antihif.IPO jjn3.plko.IPO fold change
MAFF 9,409316305 11,4313489 -4,06155617
C11orf75 8,947522238 10,97138343 -4,0667074
PLEKHO1 5,457830969 7,490323543 -4,0911107
MIR155HG 5,348163718 7,399993723 -4,14631581
HBBP1 3,228919783 5,283221565 -4,1534258
CRYBB1 5,745408879 7,805487966 -4,17009164
SAT1 9,277481358 11,35261797 -4,21384314
VEGFA 7,062027269 9,14717263 -4,24317847
RRAD 4,422005455 6,515744414 -4,26852894
DNAJA4 5,099820071 7,203566256 -4,29824043
C1R 5,815215553 7,936460447 -4,35069202
PTP4A3 6,74780976 8,874197806 -4,36622975
TLR4 3,686823756 5,836527471 -4,4373665
EPHA5 4,45077451 6,633310533 -4,53950825
KIAA1217 4,750416697 6,949762493 -4,59271034
FUT11 6,455710302 8,659423948 -4,60663613
P4HA1 9,995043737 12,21953884 -4,67347313
CBLN2 4,330483415 6,557753538 -4,68247121
PLCG2 5,885813667 8,128001778 -4,73114085
BAMBI 4,183268917 6,427396625 -4,73750579
SULF1 6,076818572 8,32294137 -4,74406178
DNAJB1 9,960084436 12,21393236 -4,76953271
GULP1 5,731392899 7,994874012 -4,80148647
ENSG00000228288 3,295716681 5,576593315 -4,85973159
IFITM2 6,316403901 8,622888607 -4,94676274
ANO5 4,427982224 6,752738843 -5,00981253
OTUB2 4,504333407 6,844047637 -5,06202359
SGK223 5,21153061 7,569733517 -5,12731278
NA 8,507495593 10,88532829 -5,19755348
LOC730060 9,812896362 12,20180839 -5,23762229
KDM5B 6,473379874 8,892805229 -5,34957899
PABPC4L 3,391334815 5,821135597 -5,38819022
DSCR8 3,362849184 5,797416101 -5,40602025
FEZ1 4,492051166 6,998558148 -5,68242596
ETV1 4,092845905 6,604695969 -5,70351009
CRISP3 2,750220527 5,380993342 -6,19357683
CYTL1 5,999614234 8,638464518 -6,22835115
SH3RF3 4,24139739 6,901885753 -6,32247033
GBP2 3,895537578 6,557815667 -6,3303185
P4HA2 4,202617291 6,891397573 -6,44768061
PAG1 5,628526693 8,330535638 -6,50707393
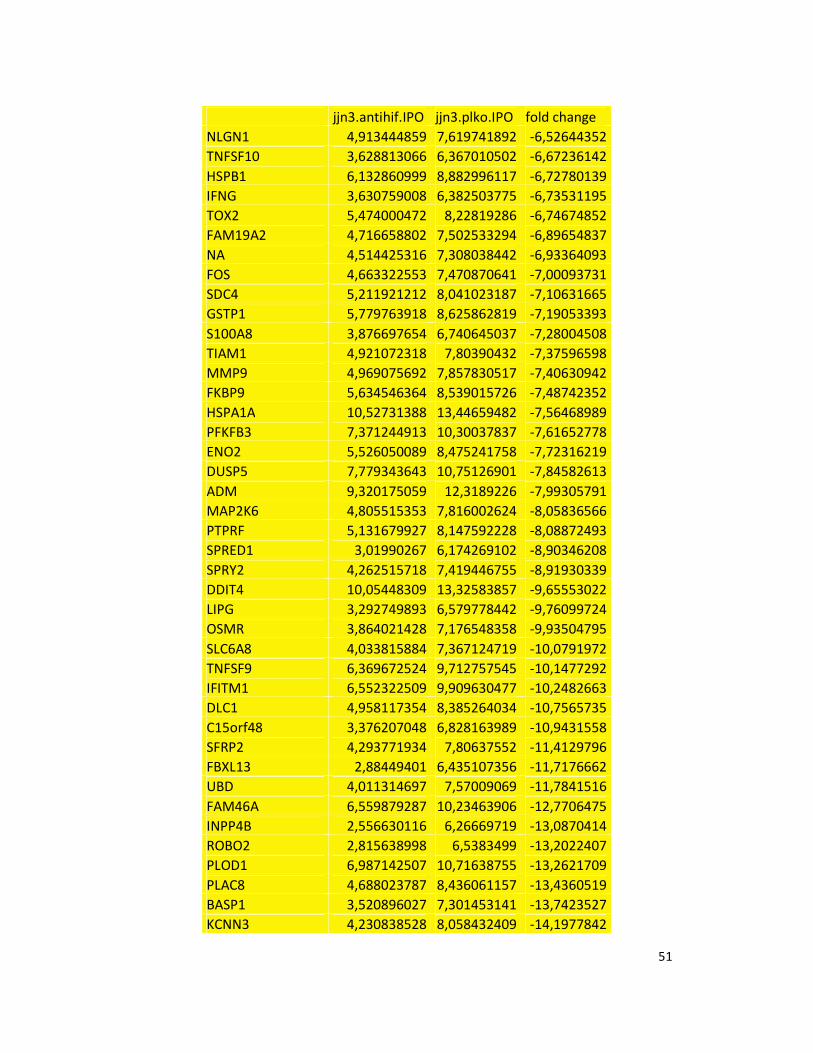
51
jjn3.antihif.IPO jjn3.plko.IPO fold change
NLGN1 4,913444859 7,619741892 -6,52644352
TNFSF10 3,628813066 6,367010502 -6,67236142
HSPB1 6,132860999 8,882996117 -6,72780139
IFNG 3,630759008 6,382503775 -6,73531195
TOX2 5,474000472 8,22819286 -6,74674852
FAM19A2 4,716658802 7,502533294 -6,89654837
NA 4,514425316 7,308038442 -6,93364093
FOS 4,663322553 7,470870641 -7,00093731
SDC4 5,211921212 8,041023187 -7,10631665
GSTP1 5,779763918 8,625862819 -7,19053393
S100A8 3,876697654 6,740645037 -7,28004508
TIAM1 4,921072318 7,80390432 -7,37596598
MMP9 4,969075692 7,857830517 -7,40630942
FKBP9 5,634546364 8,539015726 -7,48742352
HSPA1A 10,52731388 13,44659482 -7,56468989
PFKFB3 7,371244913 10,30037837 -7,61652778
ENO2 5,526050089 8,475241758 -7,72316219
DUSP5 7,779343643 10,75126901 -7,84582613
ADM 9,320175059 12,3189226 -7,99305791
MAP2K6 4,805515353 7,816002624 -8,05836566
PTPRF 5,131679927 8,147592228 -8,08872493
SPRED1 3,01990267 6,174269102 -8,90346208
SPRY2 4,262515718 7,419446755 -8,91930339
DDIT4 10,05448309 13,32583857 -9,65553022
LIPG 3,292749893 6,579778442 -9,76099724
OSMR 3,864021428 7,176548358 -9,93504795
SLC6A8 4,033815884 7,367124719 -10,0791972
TNFSF9 6,369672524 9,712757545 -10,1477292
IFITM1 6,552322509 9,909630477 -10,2482663
DLC1 4,958117354 8,385264034 -10,7565735
C15orf48 3,376207048 6,828163989 -10,9431558
SFRP2 4,293771934 7,80637552 -11,4129796
FBXL13 2,88449401 6,435107356 -11,7176662
UBD 4,011314697 7,57009069 -11,7841516
FAM46A 6,559879287 10,23463906 -12,7706475
INPP4B 2,556630116 6,26669719 -13,0870414
ROBO2 2,815638998 6,5383499 -13,2022407
PLOD1 6,987142507 10,71638755 -13,2621709
PLAC8 4,688023787 8,436061157 -13,4360519
BASP1 3,520896027 7,301453141 -13,7423527
KCNN3 4,230838528 8,058432409 -14,1977842
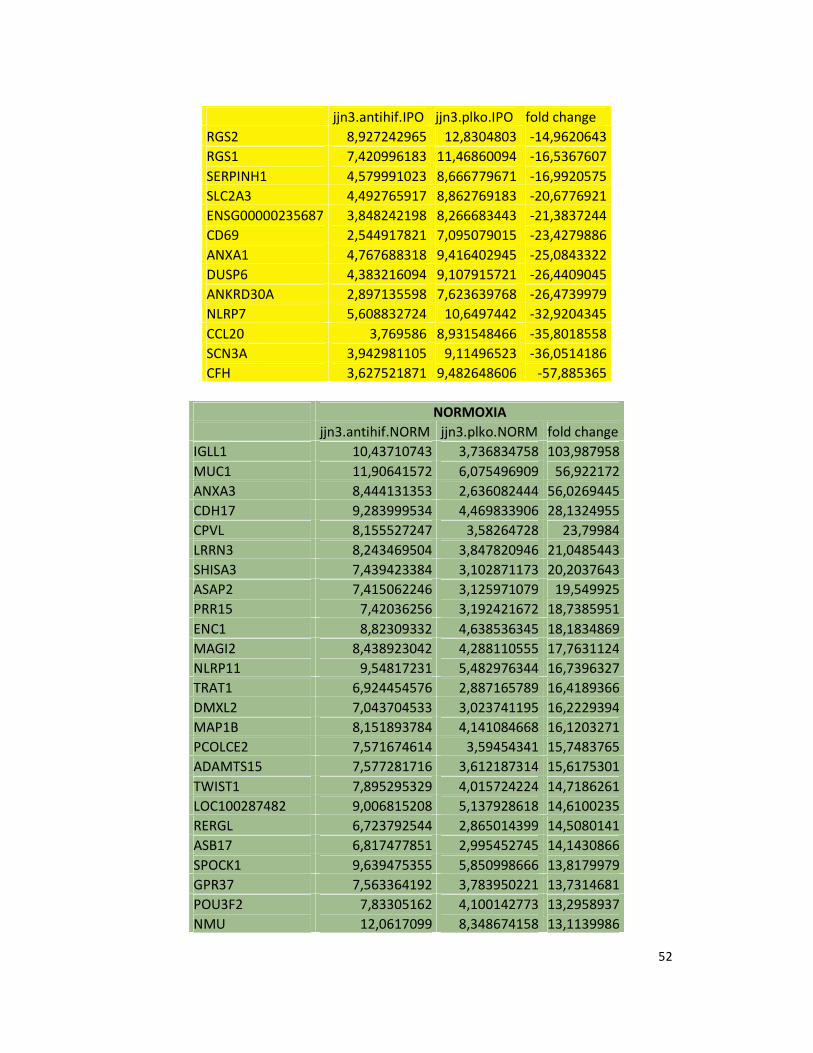
52
jjn3.antihif.IPO jjn3.plko.IPO fold change
RGS2 8,927242965 12,8304803 -14,9620643
RGS1 7,420996183 11,46860094 -16,5367607
SERPINH1 4,579991023 8,666779671 -16,9920575
SLC2A3 4,492765917 8,862769183 -20,6776921
ENSG00000235687 3,848242198 8,266683443 -21,3837244
CD69 2,544917821 7,095079015 -23,4279886
ANXA1 4,767688318 9,416402945 -25,0843322
DUSP6 4,383216094 9,107915721 -26,4409045
ANKRD30A 2,897135598 7,623639768 -26,4739979
NLRP7 5,608832724 10,6497442 -32,9204345
CCL20 3,769586 8,931548466 -35,8018558
SCN3A 3,942981105 9,11496523 -36,0514186
CFH 3,627521871 9,482648606 -57,885365
NORMOXIA
jjn3.antihif.NORM jjn3.plko.NORM fold change
IGLL1 10,43710743 3,736834758 103,987958
MUC1 11,90641572 6,075496909 56,922172
ANXA3 8,444131353 2,636082444 56,0269445
CDH17 9,283999534 4,469833906 28,1324955
CPVL 8,155527247 3,58264728 23,79984
LRRN3 8,243469504 3,847820946 21,0485443
SHISA3 7,439423384 3,102871173 20,2037643
ASAP2 7,415062246 3,125971079 19,549925
PRR15 7,42036256 3,192421672 18,7385951
ENC1 8,82309332 4,638536345 18,1834869
MAGI2 8,438923042 4,288110555 17,7631124
NLRP11 9,54817231 5,482976344 16,7396327
TRAT1 6,924454576 2,887165789 16,4189366
DMXL2 7,043704533 3,023741195 16,2229394
MAP1B 8,151893784 4,141084668 16,1203271
PCOLCE2 7,571674614 3,59454341 15,7483765
ADAMTS15 7,577281716 3,612187314 15,6175301
TWIST1 7,895295329 4,015724224 14,7186261
LOC100287482 9,006815208 5,137928618 14,6100235
RERGL 6,723792544 2,865014399 14,5080141
ASB17 6,817477851 2,995452745 14,1430866
SPOCK1 9,639475355 5,850998666 13,8179979
GPR37 7,563364192 3,783950221 13,7314681
POU3F2 7,83305162 4,100142773 13,2958937
NMU 12,0617099 8,348674158 13,1139986
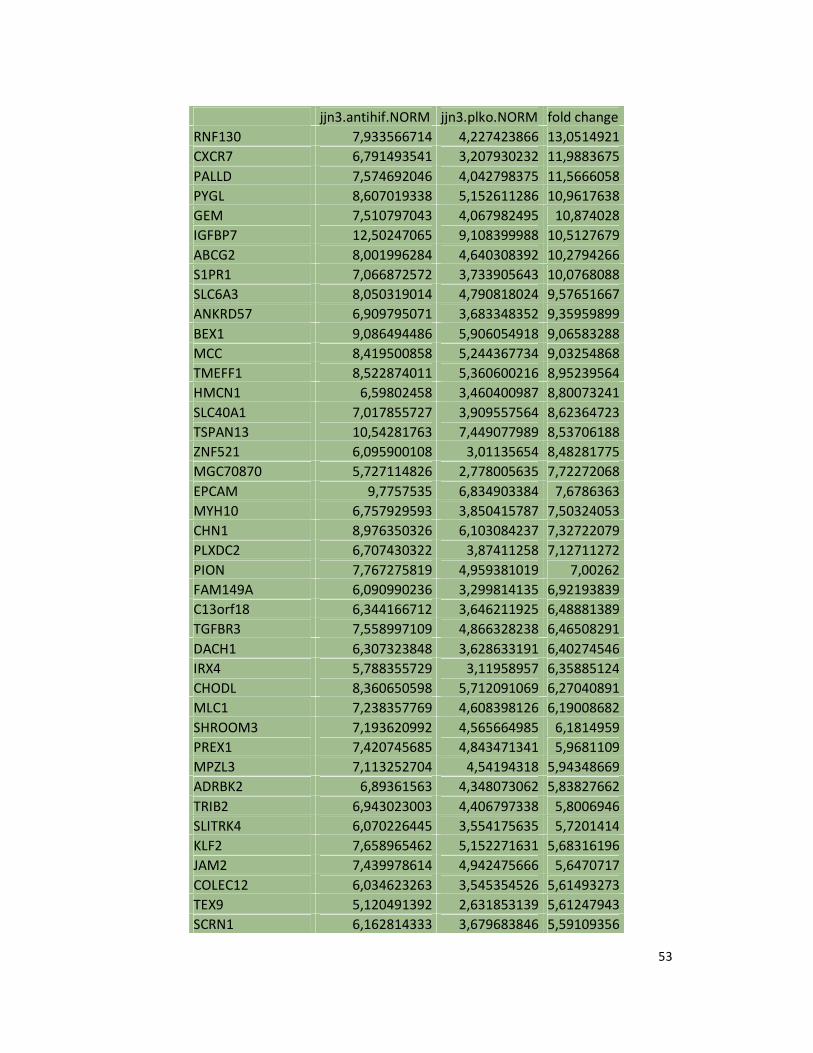
53
jjn3.antihif.NORM jjn3.plko.NORM fold change
RNF130 7,933566714 4,227423866 13,0514921
CXCR7 6,791493541 3,207930232 11,9883675
PALLD 7,574692046 4,042798375 11,5666058
PYGL 8,607019338 5,152611286 10,9617638
GEM 7,510797043 4,067982495 10,874028
IGFBP7 12,50247065 9,108399988 10,5127679
ABCG2 8,001996284 4,640308392 10,2794266
S1PR1 7,066872572 3,733905643 10,0768088
SLC6A3 8,050319014 4,790818024 9,57651667
ANKRD57 6,909795071 3,683348352 9,35959899
BEX1 9,086494486 5,906054918 9,06583288
MCC 8,419500858 5,244367734 9,03254868
TMEFF1 8,522874011 5,360600216 8,95239564
HMCN1 6,59802458 3,460400987 8,80073241
SLC40A1 7,017855727 3,909557564 8,62364723
TSPAN13 10,54281763 7,449077989 8,53706188
ZNF521 6,095900108 3,01135654 8,48281775
MGC70870 5,727114826 2,778005635 7,72272068
EPCAM 9,7757535 6,834903384 7,6786363
MYH10 6,757929593 3,850415787 7,50324053
CHN1 8,976350326 6,103084237 7,32722079
PLXDC2 6,707430322 3,87411258 7,12711272
PION 7,767275819 4,959381019 7,00262
FAM149A 6,090990236 3,299814135 6,92193839
C13orf18 6,344166712 3,646211925 6,48881389
TGFBR3 7,558997109 4,866328238 6,46508291
DACH1 6,307323848 3,628633191 6,40274546
IRX4 5,788355729 3,11958957 6,35885124
CHODL 8,360650598 5,712091069 6,27040891
MLC1 7,238357769 4,608398126 6,19008682
SHROOM3 7,193620992 4,565664985 6,1814959
PREX1 7,420745685 4,843471341 5,9681109
MPZL3 7,113252704 4,54194318 5,94348669
ADRBK2 6,89361563 4,348073062 5,83827662
TRIB2 6,943023003 4,406797338 5,8006946
SLITRK4 6,070226445 3,554175635 5,7201414
KLF2 7,658965462 5,152271631 5,68316196
JAM2 7,439978614 4,942475666 5,6470717
COLEC12 6,034623263 3,545354526 5,61493273
TEX9 5,120491392 2,631853139 5,61247943
SCRN1 6,162814333 3,679683846 5,59109356
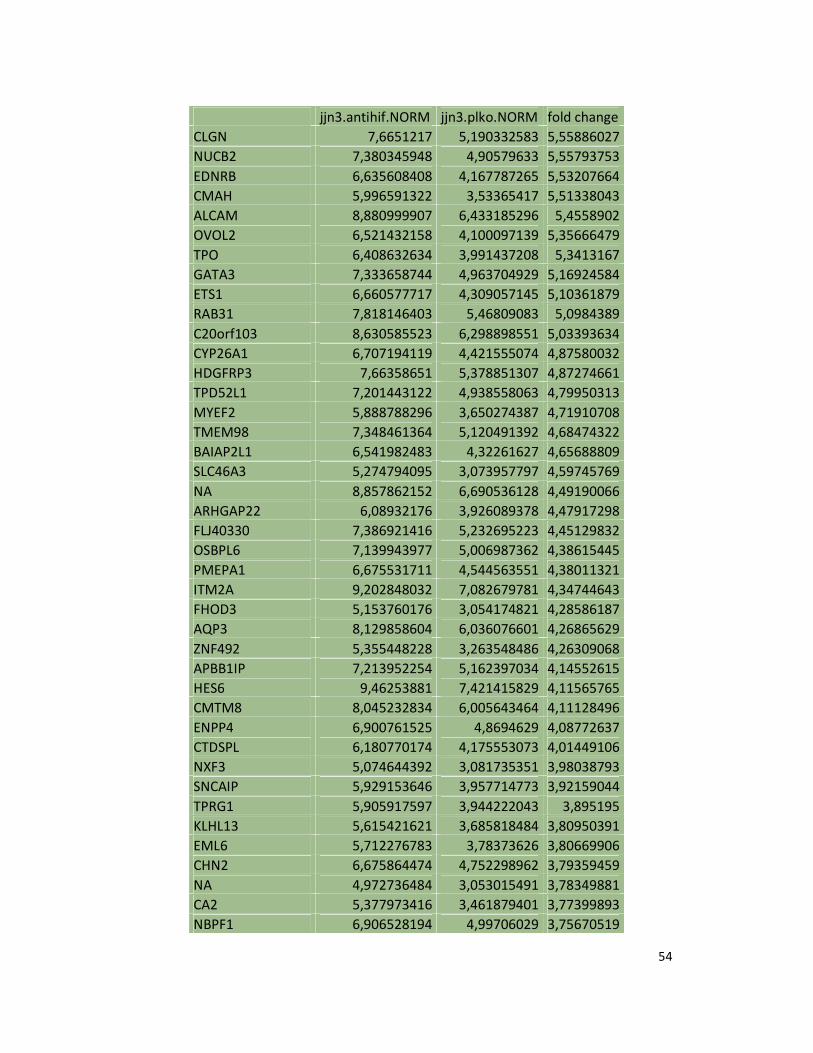
54
jjn3.antihif.NORM jjn3.plko.NORM fold change
CLGN 7,6651217 5,190332583 5,55886027
NUCB2 7,380345948 4,90579633 5,55793753
EDNRB 6,635608408 4,167787265 5,53207664
CMAH 5,996591322 3,53365417 5,51338043
ALCAM 8,880999907 6,433185296 5,4558902
OVOL2 6,521432158 4,100097139 5,35666479
TPO 6,408632634 3,991437208 5,3413167
GATA3 7,333658744 4,963704929 5,16924584
ETS1 6,660577717 4,309057145 5,10361879
RAB31 7,818146403 5,46809083 5,0984389
C20orf103 8,630585523 6,298898551 5,03393634
CYP26A1 6,707194119 4,421555074 4,87580032
HDGFRP3 7,66358651 5,378851307 4,87274661
TPD52L1 7,201443122 4,938558063 4,79950313
MYEF2 5,888788296 3,650274387 4,71910708
TMEM98 7,348461364 5,120491392 4,68474322
BAIAP2L1 6,541982483 4,32261627 4,65688809
SLC46A3 5,274794095 3,073957797 4,59745769
NA 8,857862152 6,690536128 4,49190066
ARHGAP22 6,08932176 3,926089378 4,47917298
FLJ40330 7,386921416 5,232695223 4,45129832
OSBPL6 7,139943977 5,006987362 4,38615445
PMEPA1 6,675531711 4,544563551 4,38011321
ITM2A 9,202848032 7,082679781 4,34744643
FHOD3 5,153760176 3,054174821 4,28586187
AQP3 8,129858604 6,036076601 4,26865629
ZNF492 5,355448228 3,263548486 4,26309068
APBB1IP 7,213952254 5,162397034 4,14552615
HES6 9,46253881 7,421415829 4,11565765
CMTM8 8,045232834 6,005643464 4,11128496
ENPP4 6,900761525 4,8694629 4,08772637
CTDSPL 6,180770174 4,175553073 4,01449106
NXF3 5,074644392 3,081735351 3,98038793
SNCAIP 5,929153646 3,957714773 3,92159044
TPRG1 5,905917597 3,944222043 3,895195
KLHL13 5,615421621 3,685818484 3,80950391
EML6 5,712276783 3,78373626 3,80669906
CHN2 6,675864474 4,752298962 3,79359459
NA 4,972736484 3,053015491 3,78349881
CA2 5,377973416 3,461879401 3,77399893
NBPF1 6,906528194 4,99706029 3,75670519
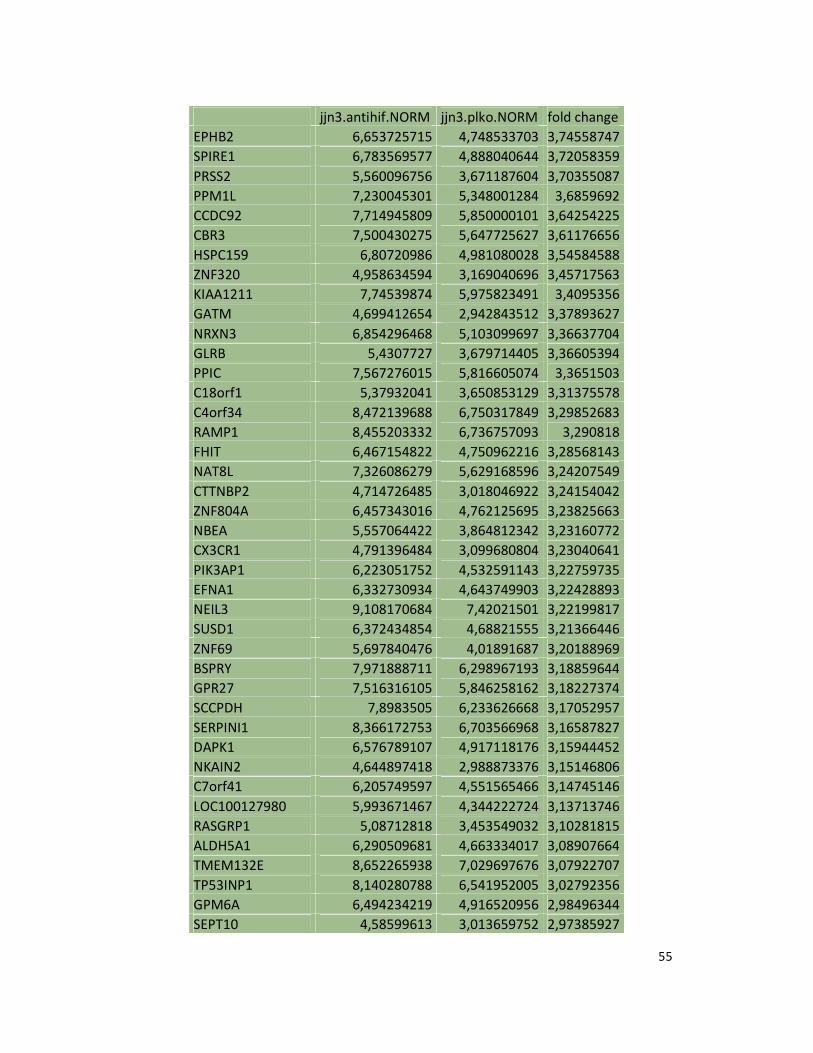
55
jjn3.antihif.NORM jjn3.plko.NORM fold change
EPHB2 6,653725715 4,748533703 3,74558747
SPIRE1 6,783569577 4,888040644 3,72058359
PRSS2 5,560096756 3,671187604 3,70355087
PPM1L 7,230045301 5,348001284 3,6859692
CCDC92 7,714945809 5,850000101 3,64254225
CBR3 7,500430275 5,647725627 3,61176656
HSPC159 6,80720986 4,981080028 3,54584588
ZNF320 4,958634594 3,169040696 3,45717563
KIAA1211 7,74539874 5,975823491 3,4095356
GATM 4,699412654 2,942843512 3,37893627
NRXN3 6,854296468 5,103099697 3,36637704
GLRB 5,4307727 3,679714405 3,36605394
PPIC 7,567276015 5,816605074 3,3651503
C18orf1 5,37932041 3,650853129 3,31375578
C4orf34 8,472139688 6,750317849 3,29852683
RAMP1 8,455203332 6,736757093 3,290818
FHIT 6,467154822 4,750962216 3,28568143
NAT8L 7,326086279 5,629168596 3,24207549
CTTNBP2 4,714726485 3,018046922 3,24154042
ZNF804A 6,457343016 4,762125695 3,23825663
NBEA 5,557064422 3,864812342 3,23160772
CX3CR1 4,791396484 3,099680804 3,23040641
PIK3AP1 6,223051752 4,532591143 3,22759735
EFNA1 6,332730934 4,643749903 3,22428893
NEIL3 9,108170684 7,42021501 3,22199817
SUSD1 6,372434854 4,68821555 3,21366446
ZNF69 5,697840476 4,01891687 3,20188969
BSPRY 7,971888711 6,298967193 3,18859644
GPR27 7,516316105 5,846258162 3,18227374
SCCPDH 7,8983505 6,233626668 3,17052957
SERPINI1 8,366172753 6,703566968 3,16587827
DAPK1 6,576789107 4,917118176 3,15944452
NKAIN2 4,644897418 2,988873376 3,15146806
C7orf41 6,205749597 4,551565466 3,14745146
LOC100127980 5,993671467 4,344222724 3,13713746
RASGRP1 5,08712818 3,453549032 3,10281815
ALDH5A1 6,290509681 4,663334017 3,08907664
TMEM132E 8,652265938 7,029697676 3,07922707
TP53INP1 8,140280788 6,541952005 3,02792356
GPM6A 6,494234219 4,916520956 2,98496344
SEPT10 4,58599613 3,013659752 2,97385927
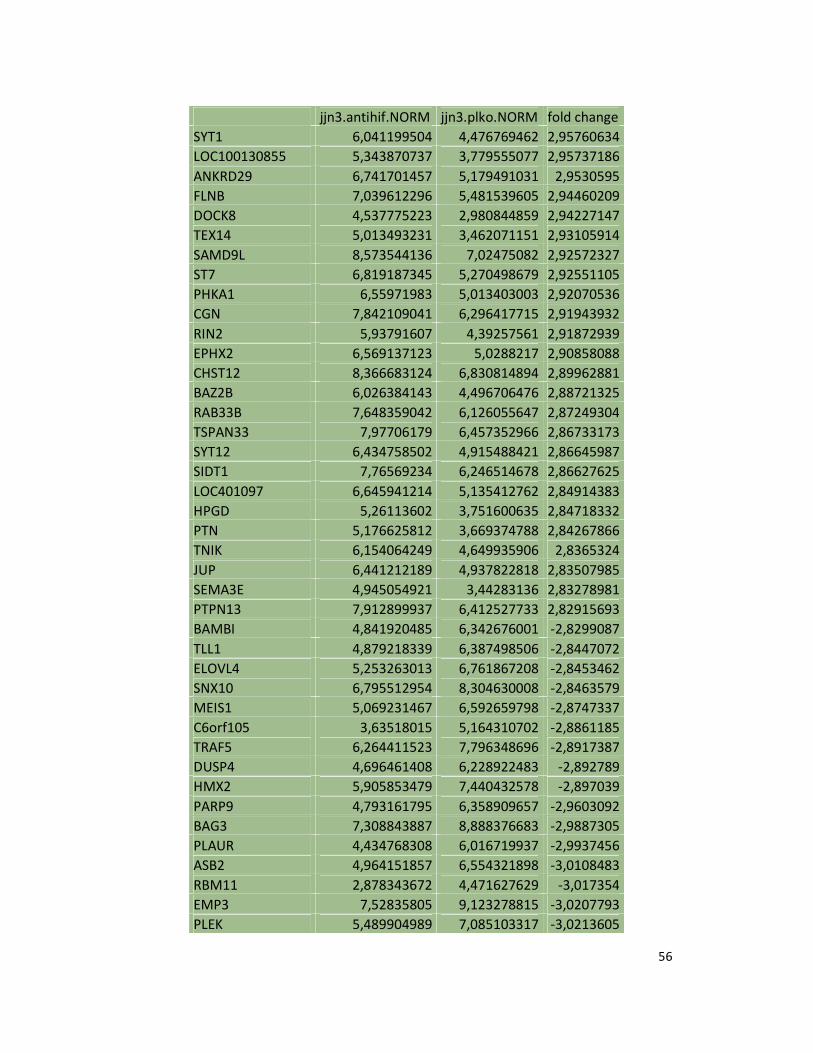
56
jjn3.antihif.NORM jjn3.plko.NORM fold change
SYT1 6,041199504 4,476769462 2,95760634
LOC100130855 5,343870737 3,779555077 2,95737186
ANKRD29 6,741701457 5,179491031 2,9530595
FLNB 7,039612296 5,481539605 2,94460209
DOCK8 4,537775223 2,980844859 2,94227147
TEX14 5,013493231 3,462071151 2,93105914
SAMD9L 8,573544136 7,02475082 2,92572327
ST7 6,819187345 5,270498679 2,92551105
PHKA1 6,55971983 5,013403003 2,92070536
CGN 7,842109041 6,296417715 2,91943932
RIN2 5,93791607 4,39257561 2,91872939
EPHX2 6,569137123 5,0288217 2,90858088
CHST12 8,366683124 6,830814894 2,89962881
BAZ2B 6,026384143 4,496706476 2,88721325
RAB33B 7,648359042 6,126055647 2,87249304
TSPAN33 7,97706179 6,457352966 2,86733173
SYT12 6,434758502 4,915488421 2,86645987
SIDT1 7,76569234 6,246514678 2,86627625
LOC401097 6,645941214 5,135412762 2,84914383
HPGD 5,26113602 3,751600635 2,84718332
PTN 5,176625812 3,669374788 2,84267866
TNIK 6,154064249 4,649935906 2,8365324
JUP 6,441212189 4,937822818 2,83507985
SEMA3E 4,945054921 3,44283136 2,83278981
PTPN13 7,912899937 6,412527733 2,82915693
BAMBI 4,841920485 6,342676001 -2,8299087
TLL1 4,879218339 6,387498506 -2,8447072
ELOVL4 5,253263013 6,761867208 -2,8453462
SNX10 6,795512954 8,304630008 -2,8463579
MEIS1 5,069231467 6,592659798 -2,8747337
C6orf105 3,63518015 5,164310702 -2,8861185
TRAF5 6,264411523 7,796348696 -2,8917387
DUSP4 4,696461408 6,228922483 -2,892789
HMX2 5,905853479 7,440432578 -2,897039
PARP9 4,793161795 6,358909657 -2,9603092
BAG3 7,308843887 8,888376683 -2,9887305
PLAUR 4,434768308 6,016719937 -2,9937456
ASB2 4,964151857 6,554321898 -3,0108483
RBM11 2,878343672 4,471627629 -3,017354
EMP3 7,52835805 9,123278815 -3,0207793
PLEK 5,489904989 7,085103317 -3,0213605
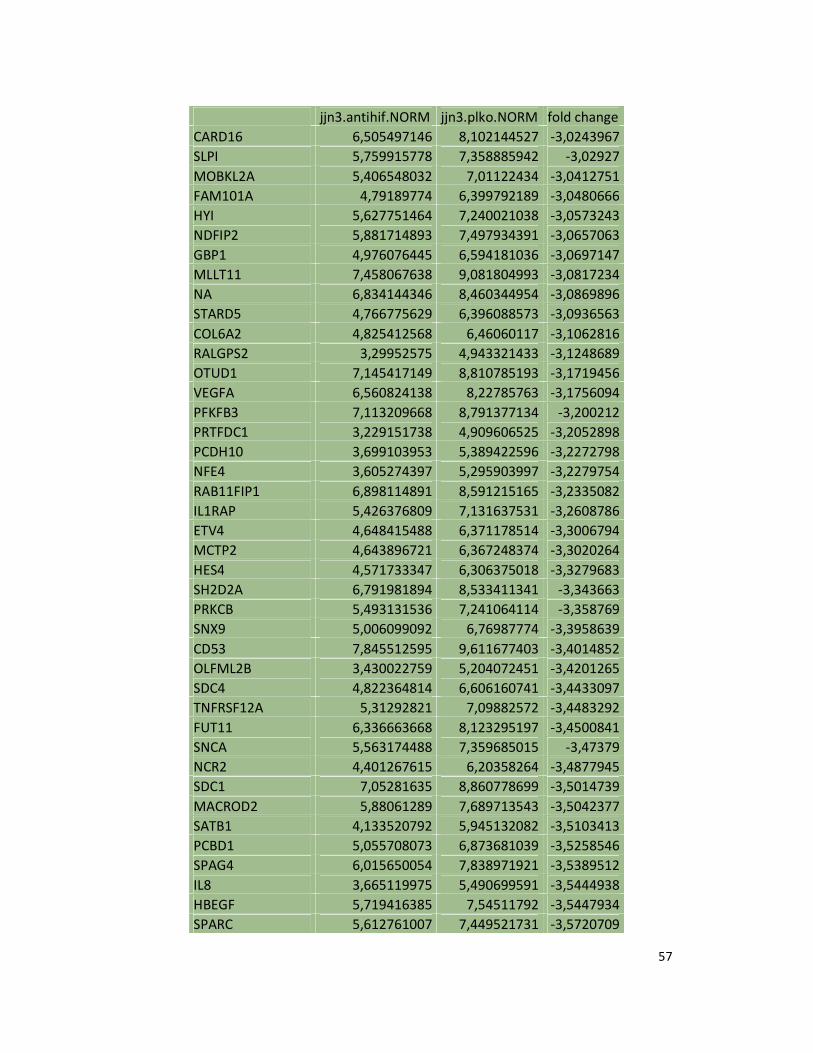
57
jjn3.antihif.NORM jjn3.plko.NORM fold change
CARD16 6,505497146 8,102144527 -3,0243967
SLPI 5,759915778 7,358885942 -3,02927
MOBKL2A 5,406548032 7,01122434 -3,0412751
FAM101A 4,79189774 6,399792189 -3,0480666
HYI 5,627751464 7,240021038 -3,0573243
NDFIP2 5,881714893 7,497934391 -3,0657063
GBP1 4,976076445 6,594181036 -3,0697147
MLLT11 7,458067638 9,081804993 -3,0817234
NA 6,834144346 8,460344954 -3,0869896
STARD5 4,766775629 6,396088573 -3,0936563
COL6A2 4,825412568 6,46060117 -3,1062816
RALGPS2 3,29952575 4,943321433 -3,1248689
OTUD1 7,145417149 8,810785193 -3,1719456
VEGFA 6,560824138 8,22785763 -3,1756094
PFKFB3 7,113209668 8,791377134 -3,200212
PRTFDC1 3,229151738 4,909606525 -3,2052898
PCDH10 3,699103953 5,389422596 -3,2272798
NFE4 3,605274397 5,295903997 -3,2279754
RAB11FIP1 6,898114891 8,591215165 -3,2335082
IL1RAP 5,426376809 7,131637531 -3,2608786
ETV4 4,648415488 6,371178514 -3,3006794
MCTP2 4,643896721 6,367248374 -3,3020264
HES4 4,571733347 6,306375018 -3,3279683
SH2D2A 6,791981894 8,533411341 -3,343663
PRKCB 5,493131536 7,241064114 -3,358769
SNX9 5,006099092 6,76987774 -3,3958639
CD53 7,845512595 9,611677403 -3,4014852
OLFML2B 3,430022759 5,204072451 -3,4201265
SDC4 4,822364814 6,606160741 -3,4433097
TNFRSF12A 5,31292821 7,09882572 -3,4483292
FUT11 6,336663668 8,123295197 -3,4500841
SNCA 5,563174488 7,359685015 -3,47379
NCR2 4,401267615 6,20358264 -3,4877945
SDC1 7,05281635 8,860778699 -3,5014739
MACROD2 5,88061289 7,689713543 -3,5042377
SATB1 4,133520792 5,945132082 -3,5103413
PCBD1 5,055708073 6,873681039 -3,5258546
SPAG4 6,015650054 7,838971921 -3,5389512
IL8 3,665119975 5,490699591 -3,5444938
HBEGF 5,719416385 7,54511792 -3,5447934
SPARC 5,612761007 7,449521731 -3,5720709
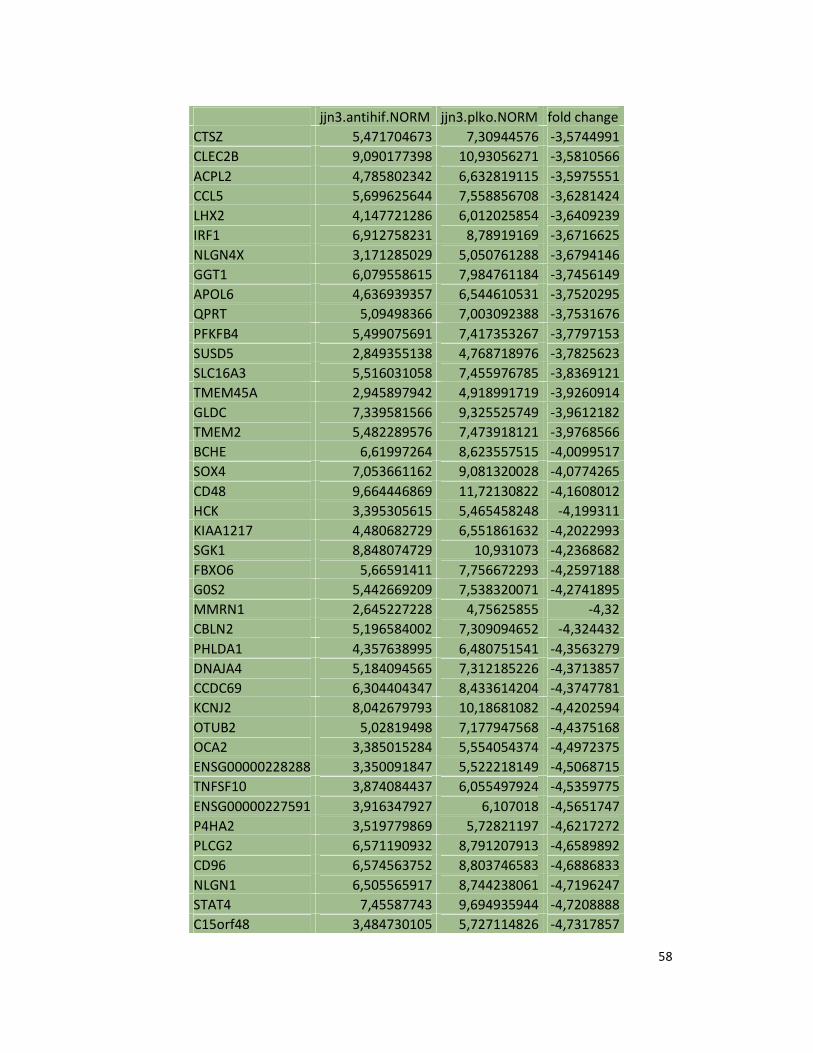
58
jjn3.antihif.NORM jjn3.plko.NORM fold change
CTSZ 5,471704673 7,30944576 -3,5744991
CLEC2B 9,090177398 10,93056271 -3,5810566
ACPL2 4,785802342 6,632819115 -3,5975551
CCL5 5,699625644 7,558856708 -3,6281424
LHX2 4,147721286 6,012025854 -3,6409239
IRF1 6,912758231 8,78919169 -3,6716625
NLGN4X 3,171285029 5,050761288 -3,6794146
GGT1 6,079558615 7,984761184 -3,7456149
APOL6 4,636939357 6,544610531 -3,7520295
QPRT 5,09498366 7,003092388 -3,7531676
PFKFB4 5,499075691 7,417353267 -3,7797153
SUSD5 2,849355138 4,768718976 -3,7825623
SLC16A3 5,516031058 7,455976785 -3,8369121
TMEM45A 2,945897942 4,918991719 -3,9260914
GLDC 7,339581566 9,325525749 -3,9612182
TMEM2 5,482289576 7,473918121 -3,9768566
BCHE 6,61997264 8,623557515 -4,0099517
SOX4 7,053661162 9,081320028 -4,0774265
CD48 9,664446869 11,72130822 -4,1608012
HCK 3,395305615 5,465458248 -4,199311
KIAA1217 4,480682729 6,551861632 -4,2022993
SGK1 8,848074729 10,931073 -4,2368682
FBXO6 5,66591411 7,756672293 -4,2597188
G0S2 5,442669209 7,538320071 -4,2741895
MMRN1 2,645227228 4,75625855 -4,32
CBLN2 5,196584002 7,309094652 -4,324432
PHLDA1 4,357638995 6,480751541 -4,3563279
DNAJA4 5,184094565 7,312185226 -4,3713857
CCDC69 6,304404347 8,433614204 -4,3747781
KCNJ2 8,042679793 10,18681082 -4,4202594
OTUB2 5,02819498 7,177947568 -4,4375168
OCA2 3,385015284 5,554054374 -4,4972375
ENSG00000228288 3,350091847 5,522218149 -4,5068715
TNFSF10 3,874084437 6,055497924 -4,5359775
ENSG00000227591 3,916347927 6,107018 -4,5651747
P4HA2 3,519779869 5,72821197 -4,6217272
PLCG2 6,571190932 8,791207913 -4,6589892
CD96 6,574563752 8,803746583 -4,6886833
NLGN1 6,505565917 8,744238061 -4,7196247
STAT4 7,45587743 9,694935944 -4,7208888
C15orf48 3,484730105 5,727114826 -4,7317857
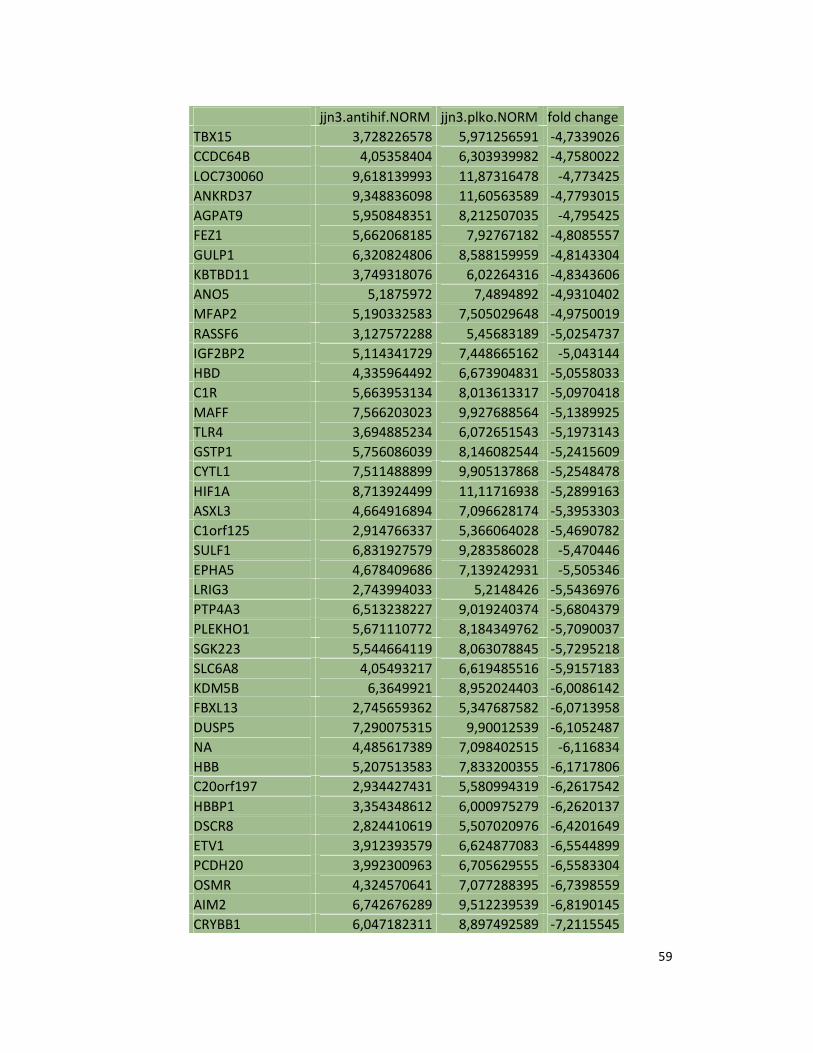
59
jjn3.antihif.NORM jjn3.plko.NORM fold change
TBX15 3,728226578 5,971256591 -4,7339026
CCDC64B 4,05358404 6,303939982 -4,7580022
LOC730060 9,618139993 11,87316478 -4,773425
ANKRD37 9,348836098 11,60563589 -4,7793015
AGPAT9 5,950848351 8,212507035 -4,795425
FEZ1 5,662068185 7,92767182 -4,8085557
GULP1 6,320824806 8,588159959 -4,8143304
KBTBD11 3,749318076 6,02264316 -4,8343606
ANO5 5,1875972 7,4894892 -4,9310402
MFAP2 5,190332583 7,505029648 -4,9750019
RASSF6 3,127572288 5,45683189 -5,0254737
IGF2BP2 5,114341729 7,448665162 -5,043144
HBD 4,335964492 6,673904831 -5,0558033
C1R 5,663953134 8,013613317 -5,0970418
MAFF 7,566203023 9,927688564 -5,1389925
TLR4 3,694885234 6,072651543 -5,1973143
GSTP1 5,756086039 8,146082544 -5,2415609
CYTL1 7,511488899 9,905137868 -5,2548478
HIF1A 8,713924499 11,11716938 -5,2899163
ASXL3 4,664916894 7,096628174 -5,3953303
C1orf125 2,914766337 5,366064028 -5,4690782
SULF1 6,831927579 9,283586028 -5,470446
EPHA5 4,678409686 7,139242931 -5,505346
LRIG3 2,743994033 5,2148426 -5,5436976
PTP4A3 6,513238227 9,019240374 -5,6804379
PLEKHO1 5,671110772 8,184349762 -5,7090037
SGK223 5,544664119 8,063078845 -5,7295218
SLC6A8 4,05493217 6,619485516 -5,9157183
KDM5B 6,3649921 8,952024403 -6,0086142
FBXL13 2,745659362 5,347687582 -6,0713958
DUSP5 7,290075315 9,90012539 -6,1052487
NA 4,485617389 7,098402515 -6,116834
HBB 5,207513583 7,833200355 -6,1717806
C20orf197 2,934427431 5,580994319 -6,2617542
HBBP1 3,354348612 6,000975279 -6,2620137
DSCR8 2,824410619 5,507020976 -6,4201649
ETV1 3,912393579 6,624877083 -6,5544899
PCDH20 3,992300963 6,705629555 -6,5583304
OSMR 4,324570641 7,077288395 -6,7398559
AIM2 6,742676289 9,512239539 -6,8190145
CRYBB1 6,047182311 8,897492589 -7,2115545
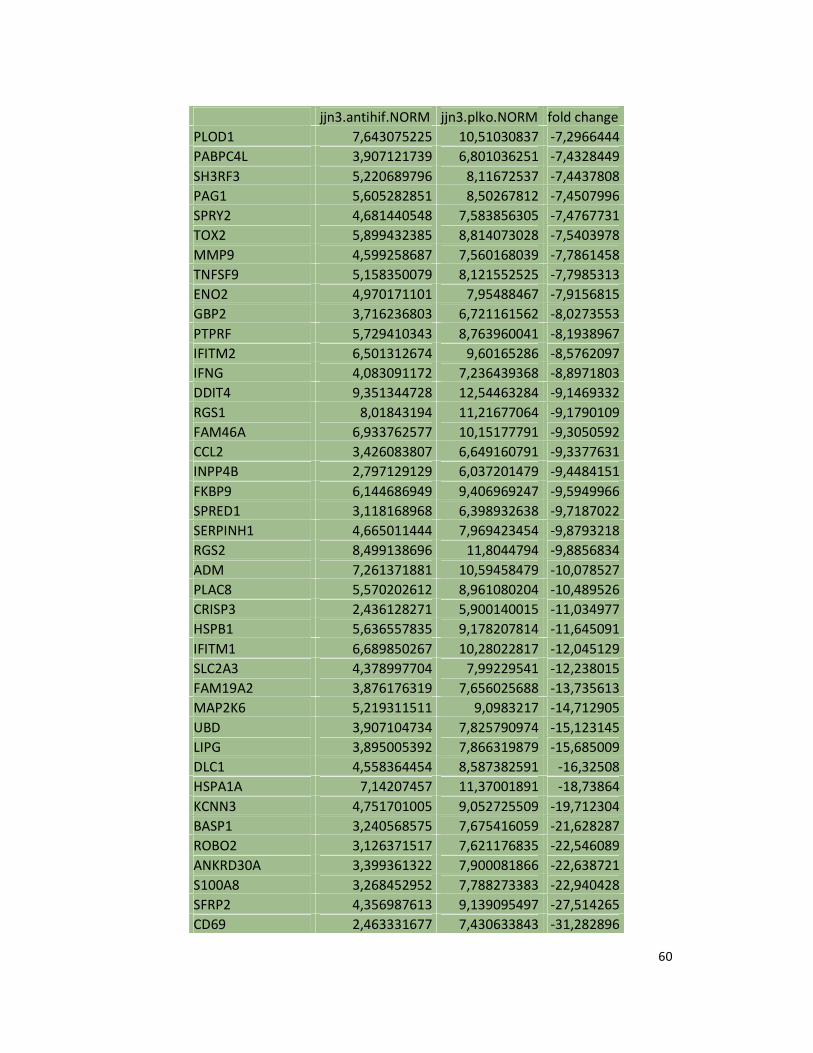
60
jjn3.antihif.NORM jjn3.plko.NORM fold change
PLOD1 7,643075225 10,51030837 -7,2966444
PABPC4L 3,907121739 6,801036251 -7,4328449
SH3RF3 5,220689796 8,11672537 -7,4437808
PAG1 5,605282851 8,50267812 -7,4507996
SPRY2 4,681440548 7,583856305 -7,4767731
TOX2 5,899432385 8,814073028 -7,5403978
MMP9 4,599258687 7,560168039 -7,7861458
TNFSF9 5,158350079 8,121552525 -7,7985313
ENO2 4,970171101 7,95488467 -7,9156815
GBP2 3,716236803 6,721161562 -8,0273553
PTPRF 5,729410343 8,763960041 -8,1938967
IFITM2 6,501312674 9,60165286 -8,5762097
IFNG 4,083091172 7,236439368 -8,8971803
DDIT4 9,351344728 12,54463284 -9,1469332
RGS1 8,01843194 11,21677064 -9,1790109
FAM46A 6,933762577 10,15177791 -9,3050592
CCL2 3,426083807 6,649160791 -9,3377631
INPP4B 2,797129129 6,037201479 -9,4484151
FKBP9 6,144686949 9,406969247 -9,5949966
SPRED1 3,118168968 6,398932638 -9,7187022
SERPINH1 4,665011444 7,969423454 -9,8793218
RGS2 8,499138696 11,8044794 -9,8856834
ADM 7,261371881 10,59458479 -10,078527
PLAC8 5,570202612 8,961080204 -10,489526
CRISP3 2,436128271 5,900140015 -11,034977
HSPB1 5,636557835 9,178207814 -11,645091
IFITM1 6,689850267 10,28022817 -12,045129
SLC2A3 4,378997704 7,99229541 -12,238015
FAM19A2 3,876176319 7,656025688 -13,735613
MAP2K6 5,219311511 9,0983217 -14,712905
UBD 3,907104734 7,825790974 -15,123145
LIPG 3,895005392 7,866319879 -15,685009
DLC1 4,558364454 8,587382591 -16,32508
HSPA1A 7,14207457 11,37001891 -18,73864
KCNN3 4,751701005 9,052725509 -19,712304
BASP1 3,240568575 7,675416059 -21,628287
ROBO2 3,126371517 7,621176835 -22,546089
ANKRD30A 3,399361322 7,900081866 -22,638721
S100A8 3,268452952 7,788273383 -22,940428
SFRP2 4,356987613 9,139095497 -27,514265
CD69 2,463331677 7,430633843 -31,282896
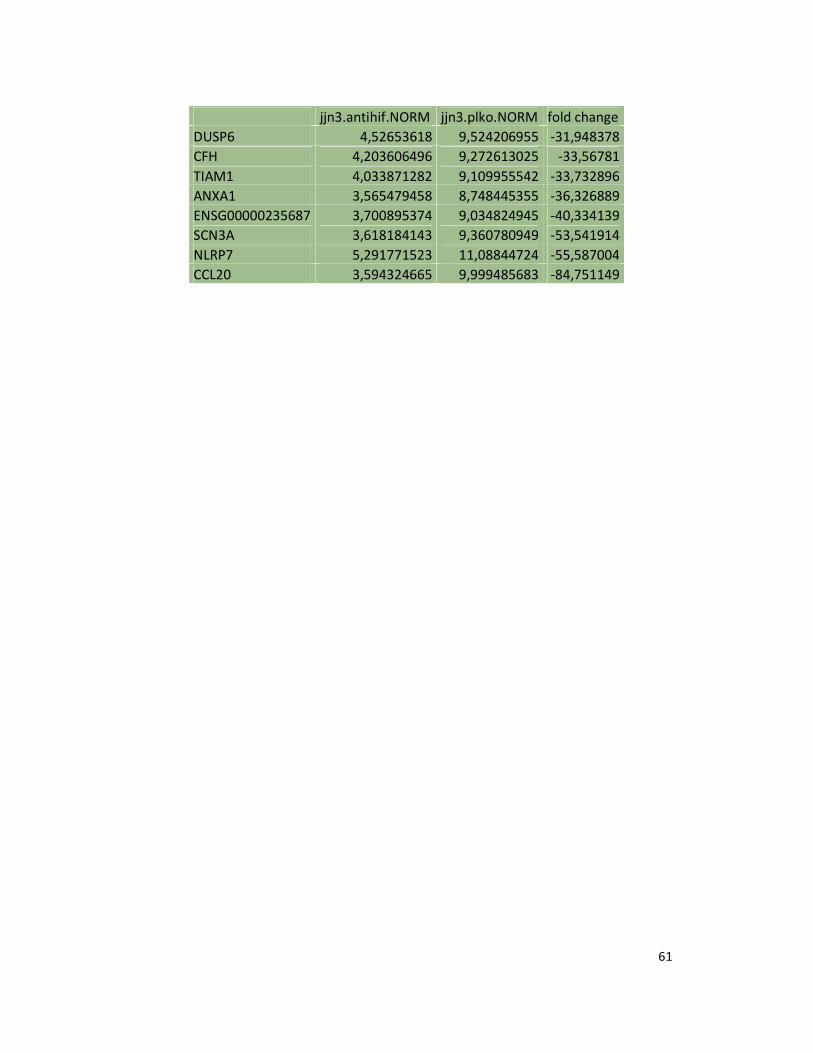
61
jjn3.antihif.NORM jjn3.plko.NORM fold change
DUSP6 4,52653618 9,524206955 -31,948378
CFH 4,203606496 9,272613025 -33,56781
TIAM1 4,033871282 9,109955542 -33,732896
ANXA1 3,565479458 8,748445355 -36,326889
ENSG00000235687 3,700895374 9,034824945 -40,334139
SCN3A 3,618184143 9,360780949 -53,541914
NLRP7 5,291771523 11,08844724 -55,587004
CCL20 3,594324665 9,999485683 -84,751149
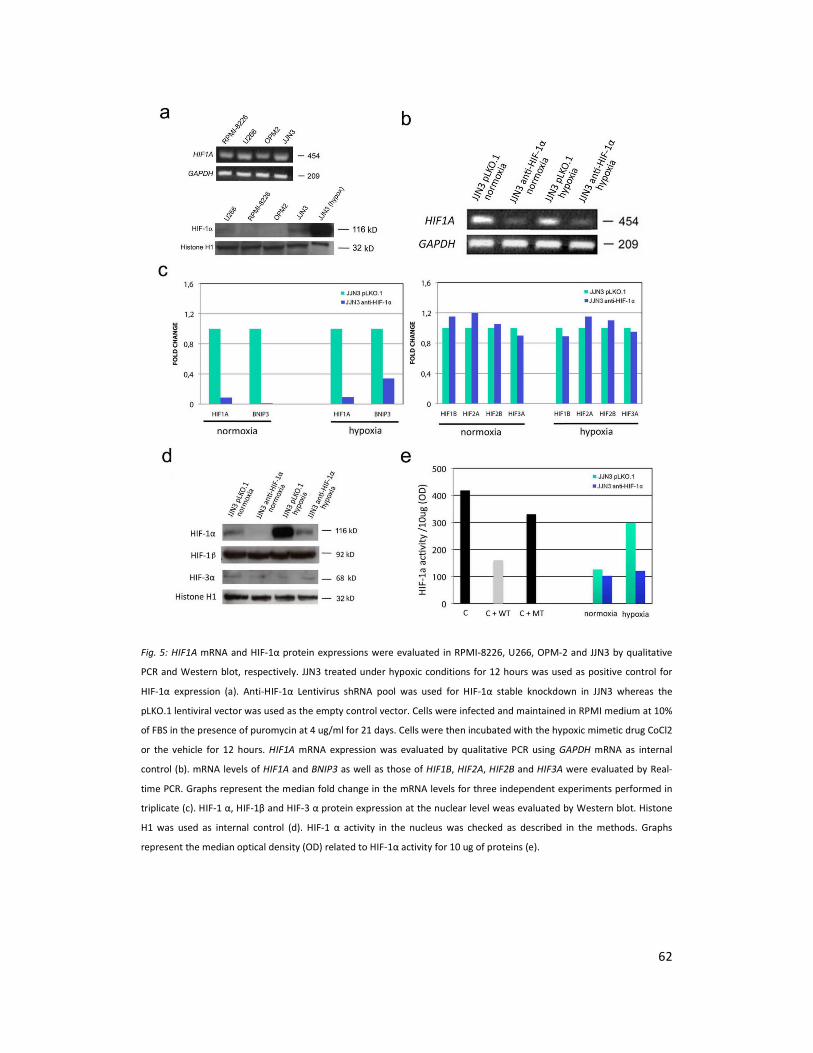
62
Fig. 5: HIF1A mRNA and HIF-1α protein expressions were evaluated in RPMI-8226, U266, OPM-2 and JJN3 by qualitative
PCR and Western blot, respectively. JJN3 treated under hypoxic conditions for 12 hours was used as positive control for
HIF-1α expression (a). Anti-HIF-1α Lentivirus shRNA pool was used for HIF-1α stable knockdown in JJN3 whereas the
pLKO.1 lentiviral vector was used as the empty control vector. Cells were infected and maintained in RPMI medium at 10%
of FBS in the presence of puromycin at 4 ug/ml for 21 days. Cells were then incubated with the hypoxic mimetic drug CoCl2
or the vehicle for 12 hours. HIF1A mRNA expression was evaluated by qualitative PCR using GAPDH mRNA as internal
control (b). mRNA levels of HIF1A and BNIP3 as well as those of HIF1B, HIF2A, HIF2B and HIF3A were evaluated by Real-
time PCR. Graphs represent the median fold change in the mRNA levels for three independent experiments performed in
triplicate (c). HIF-1 α, HIF-1β and HIF-3 α protein expression at the nuclear level weas evaluated by Western blot. Histone
H1 was used as internal control (d). HIF-1 α activity in the nucleus was checked as described in the methods. Graphs
represent the median optical density (OD) related to HIF-1α activity for 10 ug of proteins (e).
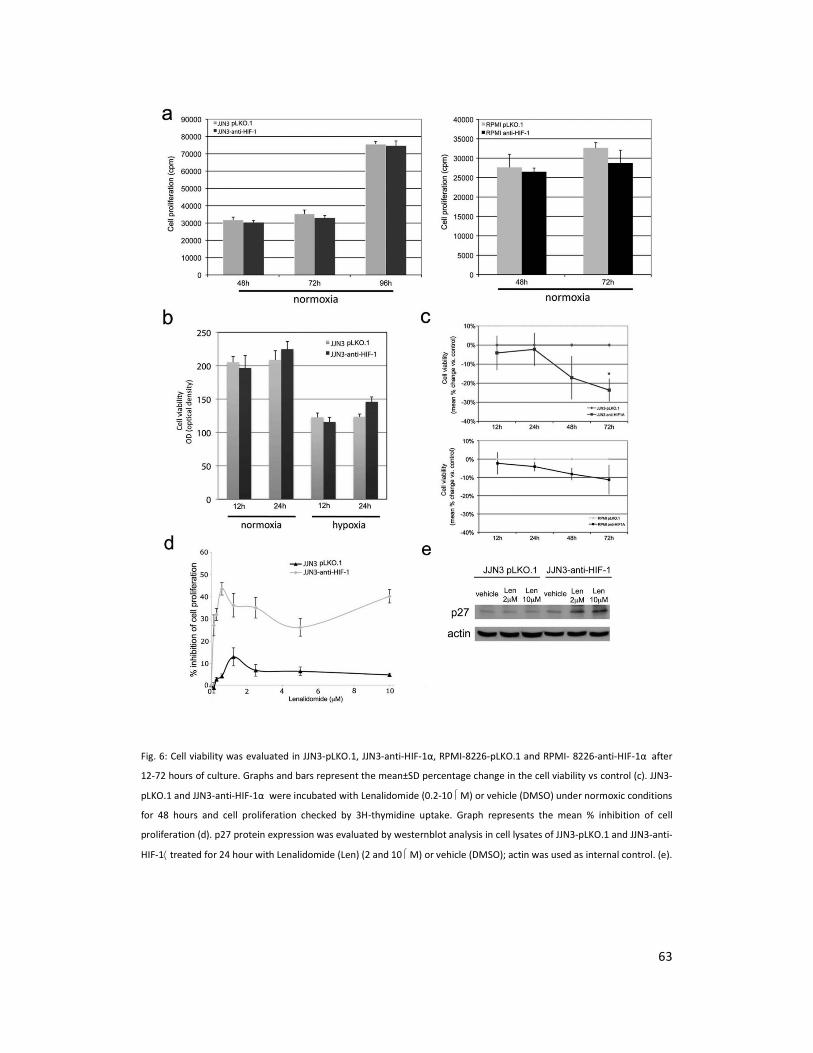
63
Fig. 6: Cell viability was evaluated in JJN3-pLKO.1, JJN3-anti-HIF-1α, RPMI-8226-pLKO.1 and RPMI- 8226-anti-HIF-1α after
12-72 hours of culture. Graphs and bars represent the mean±SD percentage change in the cell viability vs control (c). JJN3-
pLKO.1 and JJN3-anti-HIF-1α were incubated with Lenalidomide (0.2-10 M) or vehicle (DMSO) under normoxic conditions
for 48 hours and cell proliferation checked by 3H-thymidine uptake. Graph represents the mean % inhibition of cell
proliferation (d). p27 protein expression was evaluated by westernblot analysis in cell lysates of JJN3-pLKO.1 and JJN3-anti-
HIF-1⟨ treated for 24 hour with Lenalidomide (Len) (2 and 10 M) or vehicle (DMSO); actin was used as internal control. (e).
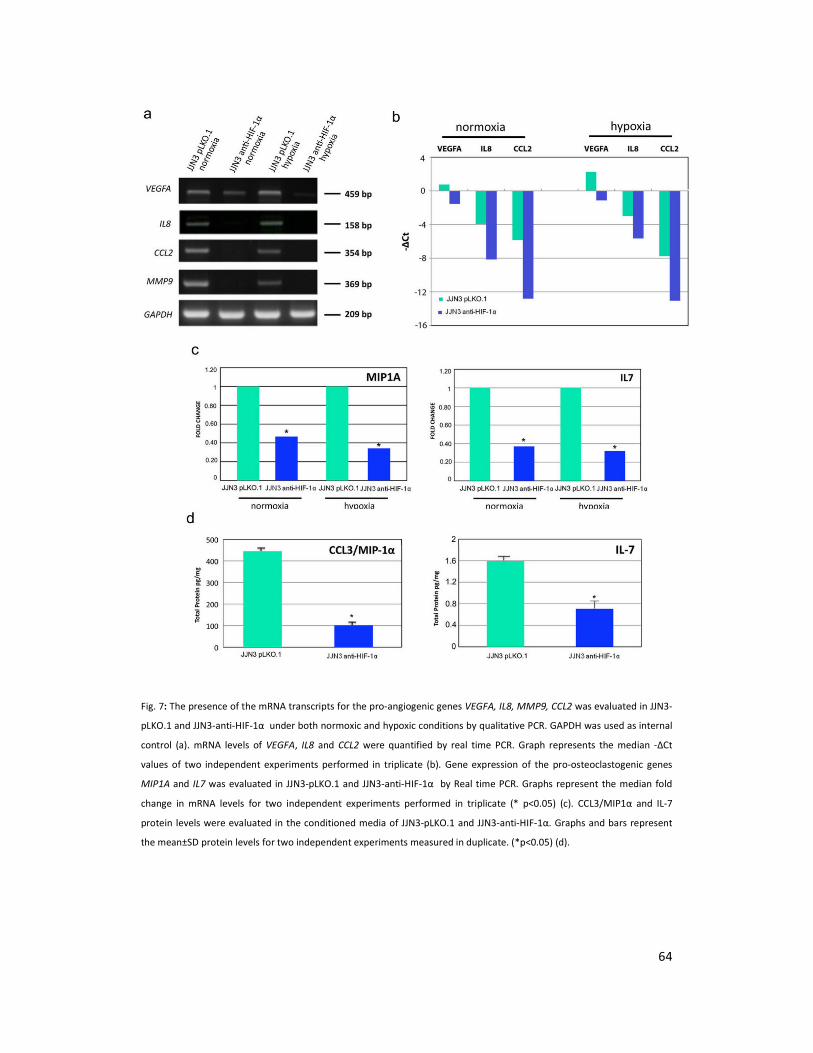
64
Fig. 7: The presence of the mRNA transcripts for the pro-angiogenic genes VEGFA, IL8, MMP9, CCL2 was evaluated in JJN3-
pLKO.1 and JJN3-anti-HIF-1α under both normoxic and hypoxic conditions by qualitative PCR. GAPDH was used as internal
control (a). mRNA levels of VEGFA, IL8 and CCL2 were quantified by real time PCR. Graph represents the median -ΔCt
values of two independent experiments performed in triplicate (b). Gene expression of the pro-osteoclastogenic genes
MIP1A and IL7 was evaluated in JJN3-pLKO.1 and JJN3-anti-HIF-1α by Real time PCR. Graphs represent the median fold
change in mRNA levels for two independent experiments performed in triplicate (* p<0.05) (c). CCL3/MIP1α and IL-7
protein levels were evaluated in the conditioned media of JJN3-pLKO.1 and JJN3-anti-HIF-1α. Graphs and bars represent
the mean±SD protein levels for two independent experiments measured in duplicate. (*p<0.05) (d).
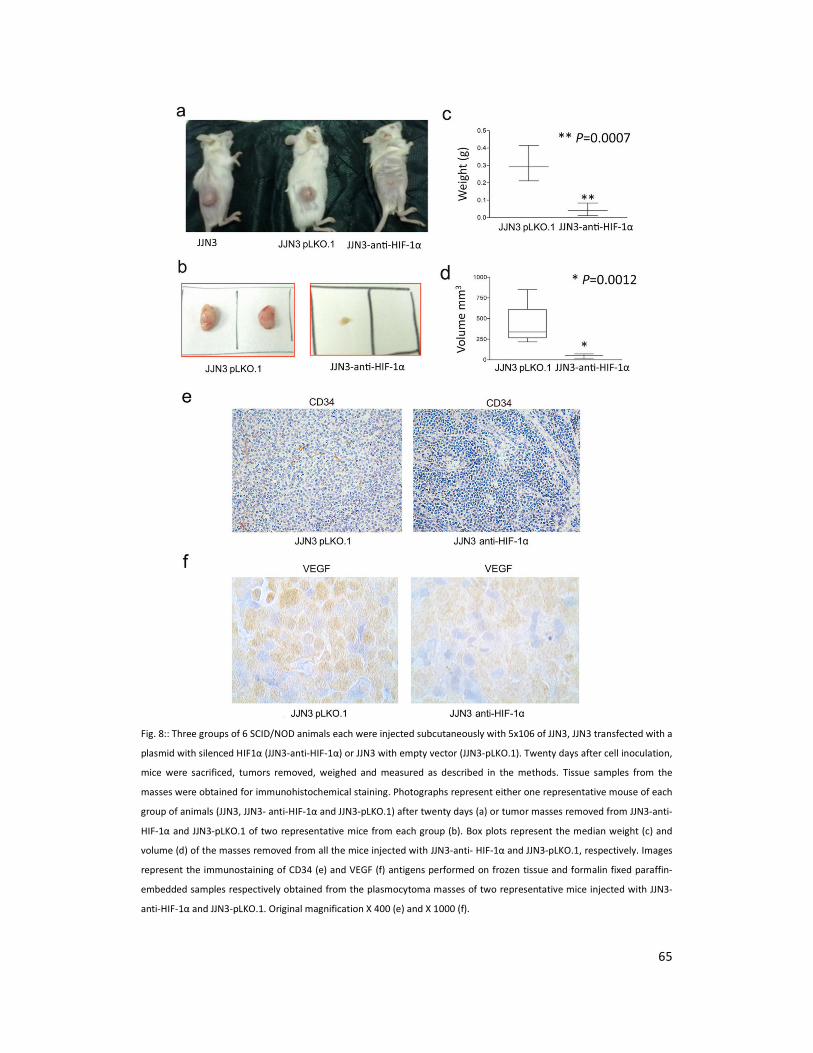
65
Fig. 8:: Three groups of 6 SCID/NOD animals each were injected subcutaneously with 5x10⁶ of JJN3, JJN3 transfected with a
plasmid with silenced HIF1α (JJN3-anti-HIF-1α) or JJN3 with empty vector (JJN3-pLKO.1). Twenty days after cell inoculation,
mice were sacrificed, tumors removed, weighed and measured as described in the methods. Tissue samples from the
masses were obtained for immunohistochemical staining. Photographs represent either one representative mouse of each
group of animals (JJN3, JJN3- anti-HIF-1α and JJN3-pLKO.1) after twenty days (a) or tumor masses removed from JJN3-anti-
HIF-1α and JJN3-pLKO.1 of two representative mice from each group (b). Box plots represent the median weight (c) and
volume (d) of the masses removed from all the mice injected with JJN3-anti- HIF-1α and JJN3-pLKO.1, respectively. Images
represent the immunostaining of CD34 (e) and VEGF (f) antigens performed on frozen tissue and formalin fixed paraffin-
embedded samples respectively obtained from the plasmocytoma masses of two representative mice injected with JJN3-
anti-HIF-1α and JJN3-pLKO.1. Original magnification X 400 (e) and X 1000 (f).
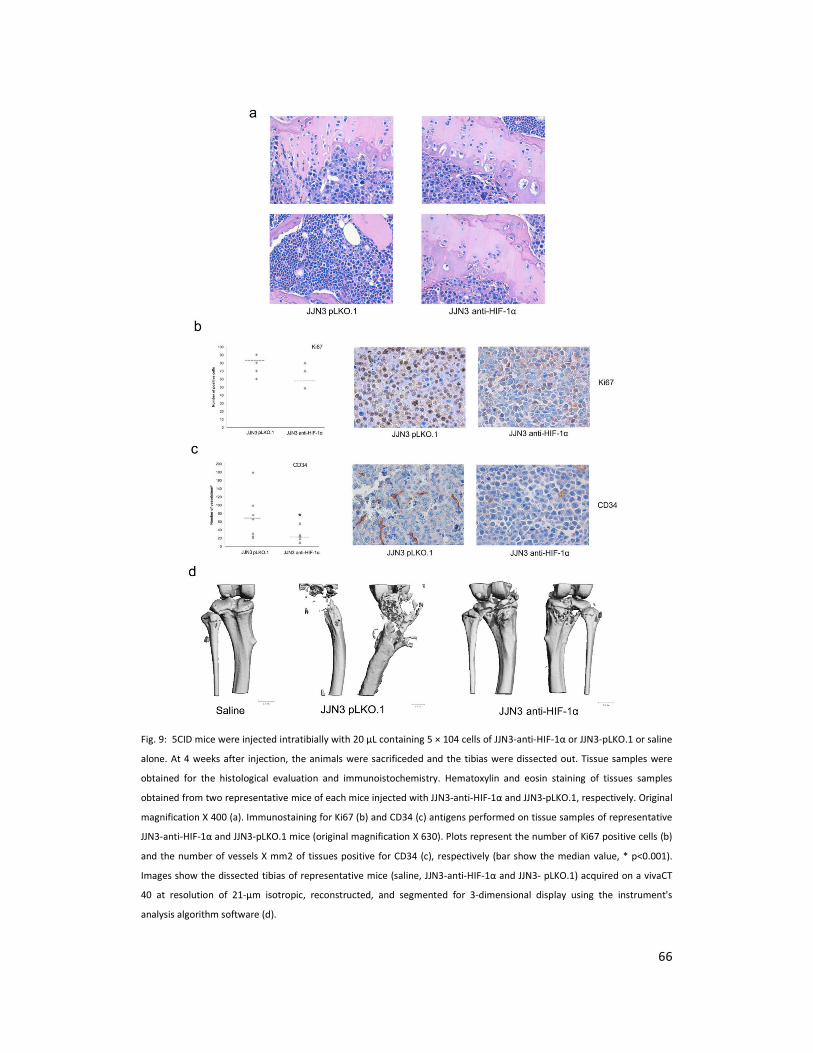
66
Fig. 9: 5CID mice were injected intratibially with 20 μL containing 5 × 10⁴ cells of JJN3-anti-HIF-1α or JJN3-pLKO.1 or saline
alone. At 4 weeks after injection, the animals were sacrificeded and the tibias were dissected out. Tissue samples were
obtained for the histological evaluation and immunoistochemistry. Hematoxylin and eosin staining of tissues samples
obtained from two representative mice of each mice injected with JJN3-anti-HIF-1α and JJN3-pLKO.1, respectively. Original
magnification X 400 (a). Immunostaining for Ki67 (b) and CD34 (c) antigens performed on tissue samples of representative
JJN3-anti-HIF-1α and JJN3-pLKO.1 mice (original magnification X 630). Plots represent the number of Ki67 positive cells (b)
and the number of vessels X mm2 of tissues positive for CD34 (c), respectively (bar show the median value, * p<0.001).
Images show the dissected tibias of representative mice (saline, JJN3-anti-HIF-1α and JJN3- pLKO.1) acquired on a vivaCT
40 at resolution of 21-μm isotropic, reconstructed, and segmented for 3-dimensional display using the instrument's
analysis algorithm software (d).

Thanks to…Thanks to…Thanks to…Thanks to…
to Prof. Nicola Giuliani that gave me the possibility to learn and
fulfill these results always supporting me,
to Gaetano for his help, suggestions and for always being willing for
the “virus things”,
to ParmAIL, Prof. Vittorio Rizzoli, Prof. Franco Aversa,
to Simona that gave me the chance to challenge myself,
to Marina, smart, cheerful friend and colleague, who was always
ready to help me in the lab and in life… without stop smiling!
to Manuela, Gabriella, Daniela, Denise, the “Lab Girls”… you rock!
to my family and my brother Matteo for always been there on my
side and support me every decision I have taken,
to all those that have collaborated in this study and everybody
that helped me these years of PhD.