Unimolecular, bimolecular and intramolecular hydrolysis ...
53
doi.org/10.26434/chemrxiv.13735084.v7 Unimolecular, bimolecular and intramolecular hydrolysis mechanisms of 4-nitrophenyl β-D-glucopyranoside Amani Alhifthi, Spencer Williams Submitted date: 12/04/2021 • Posted date: 12/04/2021 Licence: CC BY-NC-ND 4.0 Citation information: Alhifthi, Amani; Williams, Spencer (2021): Unimolecular, bimolecular and intramolecular hydrolysis mechanisms of 4-nitrophenyl β-D-glucopyranoside. ChemRxiv. Preprint. https://doi.org/10.26434/chemrxiv.13735084.v7 1,2-trans-Glycosides hydrolyze through different mechanisms at different pH values, but systematic studies are lacking. Here we report the pH-rate constant profile for the hydrolysis of 4-nitrophenyl β-D-glucoside. An inverse kinetic isotope effect of k(H 3 O + )/k(D 3 O) + = 0.65 in the acidic region indicates that the mechanism requires the formation of the conjugate acid of the substrate for the reaction to proceed, with heterolytic cleavage of the glycosidic C-O bond. Reactions in the pH-independent region exhibit general catalysis with a single proton in flight, a normal solvent isotope effect of k H /k D = 1.5, and when extrapolated to zero buffer concentration show a small solvent isotope effect k(H 2 O)/k(D 2 O) = 1.1, consistent with water attack through a dissociative mechanism. In the basic region, solvolysis in 18 O-labelled water and H 2 O/MeOH mixtures allowed detection of bimolecular hydrolysis and neighboring group participation, with a minor contribution of nucleophilic aromatic substitution. Under mildly basic conditions, a bimolecular concerted mechanism is implicated through an inverse solvent isotope effect of k(HO – )/k(DO – ) = 0.5 and a strongly negative entropy of activation (DS ‡ = –13.6 cal mol –1 K –1 ). Finally, at high pH, an inverse solvent isotope effect of k(HO – )/k(DO – ) = 0.6 indicates that the formation of 1,2-anhydrosugar is the rate determining step. File list (2) download file view on ChemRxiv manuscript_120421.docx (425.84 KiB) download file view on ChemRxiv SI_120421.docx (1.09 MiB)
Transcript of Unimolecular, bimolecular and intramolecular hydrolysis ...
doi.org/10.26434/chemrxiv.13735084.v7
Unimolecular, bimolecular and intramolecular hydrolysis mechanisms of4-nitrophenyl β-D-glucopyranosideAmani Alhifthi, Spencer Williams
Submitted date: 12/04/2021 • Posted date: 12/04/2021Licence: CC BY-NC-ND 4.0Citation information: Alhifthi, Amani; Williams, Spencer (2021): Unimolecular, bimolecular and intramolecularhydrolysis mechanisms of 4-nitrophenyl β-D-glucopyranoside. ChemRxiv. Preprint.https://doi.org/10.26434/chemrxiv.13735084.v7
1,2-trans-Glycosides hydrolyze through different mechanisms at different pH values, but systematic studiesare lacking. Here we report the pH-rate constant profile for the hydrolysis of 4-nitrophenyl β-D-glucoside. Aninverse kinetic isotope effect of k(H3O+)/k(D3O)+ = 0.65 in the acidic region indicates that the mechanismrequires the formation of the conjugate acid of the substrate for the reaction to proceed, with heterolyticcleavage of the glycosidic C-O bond. Reactions in the pH-independent region exhibit general catalysis with asingle proton in flight, a normal solvent isotope effect of kH/kD = 1.5, and when extrapolated to zero bufferconcentration show a small solvent isotope effect k(H2O)/k(D2O) = 1.1, consistent with water attack through adissociative mechanism. In the basic region, solvolysis in 18O-labelled water and H2O/MeOH mixturesallowed detection of bimolecular hydrolysis and neighboring group participation, with a minor contribution ofnucleophilic aromatic substitution. Under mildly basic conditions, a bimolecular concerted mechanism isimplicated through an inverse solvent isotope effect of k(HO–)/k(DO–) = 0.5 and a strongly negative entropy ofactivation (DS‡ = –13.6 cal mol–1 K–1). Finally, at high pH, an inverse solvent isotope effect of k(HO–)/k(DO–)= 0.6 indicates that the formation of 1,2-anhydrosugar is the rate determining step.
File list (2)
download fileview on ChemRxivmanuscript_120421.docx (425.84 KiB)
download fileview on ChemRxivSI_120421.docx (1.09 MiB)
Unimolecular, bimolecular and intramolecular hydrolysis mechanisms of 4-nitrophenyl
β-D-glucopyranoside
Amani Alhifthi and Spencer J. Williams*
School of Chemistry and Bio21 Molecular Science and Biotechnology Institute, University of
Melbourne, Parkville 3010, Victoria, Australia
Keywords: carbohydrates, neighboring group participation, solvent isotope effect, glycoside
Abstract. 1,2-trans-Glycosides hydrolyze through different mechanisms at different pH
values, but systematic studies are lacking. Here we report the pH-rate constant profile for the
hydrolysis of 4-nitrophenyl β-D-glucoside. An inverse kinetic isotope effect of k(H3O+)/
k(D3O+) = 0.65 in the acidic region indicates that the mechanism requires the formation of the
conjugate acid of the substrate for the reaction to proceed, with heterolytic cleavage of the
glycosidic C-O bond. Reactions in the pH-independent region exhibit general catalysis with a
single proton in flight, a normal solvent isotope effect of kH/kD = 1.5, and when extrapolated
to zero buffer concentration show a small solvent isotope effect k(H2O)/k(D2O) = 1.1,
consistent with water attack through a dissociative mechanism. In the basic region, solvolysis
in 18O-labelled water and H2O/MeOH mixtures allowed detection of bimolecular hydrolysis
and neighboring group participation, with a minor contribution of nucleophilic aromatic
substitution. Under mildly basic conditions, a bimolecular concerted mechanism is implicated
through an inverse solvent isotope effect of k(HO–)/k(DO–) = 0.5 and a strongly negative
entropy of activation (S‡ = –13.6 cal mol–1 K–1). Finally, at high pH, an inverse solvent
isotope effect of k(HO–)/k(DO–) = 0.5 indicates that the formation of 1,2-anhydrosugar is the
rate determining step.
1
Introduction
Carbohydrates are the most abundant polymer of biological origin on earth. Accordingly, the
mechanism of their hydrolysis is of enduring interest. As a result of the powerful charge
stabilization effects of the endocyclic oxygen on positive charge development at the anomeric
carbon, an oxocarbenium ion intermediate or oxocarbenium-ion-like transition state feature
extensively in almost all transformations at the anomeric centre.1 The lifetime of the
glucopyranosyl cation in water is short and is estimated at 1-3 ps.2, 3 As a consequence,
nucleophilic substitution reactions of hydroxylated glycosides tend to straddle the border of
SN1 and SN2 reactions. The hydrolysis (or solvolysis) of glycosides of simple (alkyl) alcohols
has been extensively studied,4 as have other simple leaving groups such as azide (glycosyl
azides),2 fluoride (glycosyl fluorides)5-7 or neutral amines (glycosyl pyridinium ions).3, 5, 8
The non-enzymatic hydrolysis reactions of aryl glycosides are less well studied,
which is surprising as these compounds are widely used substrates for the study of
glycosidases, nature's catalysts for glycoside hydrolysis. Under acid-catalyzed conditions,9
hydrolysis involves heterolysis of the glycosidic bond,10 through a specific acid catalyzed
process with an oxygen-18 kinetic isotope effect for 4-nitrophenyl β-D-(1-18O)-
glucopyranoside of k16/k18 = 1.036 ± 0.002.11 Aryl glycosides are hydrolysed more rapidly
than alkyl glycosides,10, 12 which is consistent with their better leaving group ability. Under
identical acidic conditions, phenyl -D-glucoside is hydrolyzed approximately 50-fold faster
than methyl -D-glucopyranoside; the rate ratio is about 8-fold for the -series.10 Hammett
reaction constants of = –0.006 and –0.66 have been reported for acidic hydrolysis of aryl -
and -D-glucopyranosides, respectively.13, 14
Under neutral conditions, methyl -glucopyranoside hydrolyses with a rate constant
of 4.7 × 10⁻¹⁵ s–1 at 25 ºC,15 while 2,4-dinitrophenyl -glucoside (DNPGlc) hydrolyses with a
rate constant of 5.58 × 10⁻⁶ s–1 at 37 ºC,16 showing that a highly activated 2,4-
dinitrophenoxide group confers significantly greater reactivity. The entropy of activation
(S‡) for these two processes are –24 cal mol–1 K–1 (at 25 ºC) and 33.8 cal mol–1 K–1 (at 37
ºC), respectively, suggesting that the uncatalyzed hydrolysis of methyl -glucopyranoside
involves a bimolecular process with significant participation by the nucleophile,15 while that
of DNPGlc involves a more dissociative (ionic) process, possibly involving a short-lived
oxocarbenium ion intermediate.16 Jencks reported a solvent kinetic isotope effect for the
hydrolysis of -glucopyranosyl fluoride in the pH independent region of kH/kD = 0.9.7 As this
2
value is close to unity it shows limited fractionation and, like the hydrolysis of DNPGlc, is
consistent with a dissociative mechanism for this substrate bearing a good leaving group.
Under basic conditions hydrolysis of aryl glycosides also involves cleavage of the
glycosidic bond.17 Interestingly, 4-nitrophenyl -glucoside (PNPGlc) is hydrolyzed 195-fold
faster in 0.1 N NaOH than in 0.1 N HCl (both at 65 ºC).18 The oxygen-18 kinetic isotope
effect for hydrolysis of 4-nitrophenyl β-D-(1-18O)-galactopyranoside, k16/k18 = 1.029 ± 0.002
indicates a transition state with substantial carbon-oxygen bond cleavage.11 Alkaline
solvolysis reactions exhibit sharp sensitivity to substituent effects with Hammett reaction
constants of = +2.8-4.014 and +2.48-2.513, 19 aryl - and -D-glucopyranosides, respectively.
These effects mean that while 4-nitrophenyl -D-glucopyranoside hydrolyses at
approximately the same rate as the unsubstituted phenyl analogue under acidic conditions,
under strongly basic conditions (3.9 N NaOH) it hydrolyses approximately 300,000-fold
faster than the phenyl analogue.14 Under basic conditions, phenyl -D-glucopyranoside
hydrolyses several orders of magnitude faster than phenyl -D-glucopyranoside,13, 14 and there
is compelling evidence for neighboring group participation in the basic solvolysis of aryl -
D-glucopyranosides involving a C2-oxyanion and proceeding through a 1,2-anhydro sugar.17,
19 This includes substitution with retention of anomeric configuration when using
methoxide,20 and the rate retardation induced by blocking the C2 oxygen with a methyl
group.21, 22 For the related reaction of 4-nitrophenyl -D-mannopyranoside (which shares a
1,2-trans relationship),22 the carbon-13 kinetic isotope effect (KIE) for C1 is 1.026 ± 0.006,23
which is in agreement with an SN2 reactions on glycosides,24 and the ratio of kL/kH >1
indicates a concerted rather than dissociative mechanism. The oxygen-18 KIE for the C2-
oxygen is greater than unity (1.044 ± 0.0060), implicating its direct involvement in the
reaction.23
Here we report the pH-rate constant profile of the hydrolysis of PNPGlc. We
distinguish four main mechanistic regimes and six contributing reaction mechanisms (Figure
1). By exploration of buffer and solvent isotope effects, we show that PNPGlc undergoes
specific acid catalyzed hydrolysis at low pH, and uncatalyzed hydrolysis in the pH
independent region when buffer concentration was extrapolated to zero. At high pH two main
mechanisms are observed: a bimolecular nucleophilic substitution under mildly basic
conditions, and neighbouring group participation by the C2-oxyanion via a 1,2-anhydro sugar
intermediate under strongly basic conditions.
3
OHOHO
HO
OH
OPNPOHO
HOHO
OH
OPNP
H OHOHO
HO
OH
OHOHO
HO
OH
OH
OHOHO
HO
OH
OHOHO
HO
OH
OPNPOHO
HOO
OH
OPNPOHO
HOO
O
OHOHO
O
OH
OH
OHOHO
HO
OH
OPNP
OH
H
OHOHO
HO
OH
OH
OHOHO
HO
OH
O
NO2
OHOHO
HO
OH
O
NO2
HO
HO OHOHO
HO
OH
O
a)
b)
d)
f)
1. H2O
OHOHO
HO
OH
OH
OHOHO
HO
OH
OH
protontransfer
protontransfer
2. protontransfer
H3O+
PNPOH
OH
OHOHO
HO
OHOPNP
O
H
H
OHOHO
HO
OH
OPNP
O
H
H
OHOHO
HO
OH
OH
c)
B
H AH
A
B
PNPOH
PNPO
OH
PNPO
e)
OHOHO
HO
OHOPNP
O H
OHOHO
HO
OH
OPNP OHOHO
HO
OH
OH
PNPO
OH
either:
or:
OHOHO
HO
OHOPNP
PNPO
OHOHO
HO
OHOPNP
H
O
O
OH
OH
O
Heither:
or:
O
OH
OH
OH
O
levoglucosanproton
transfer
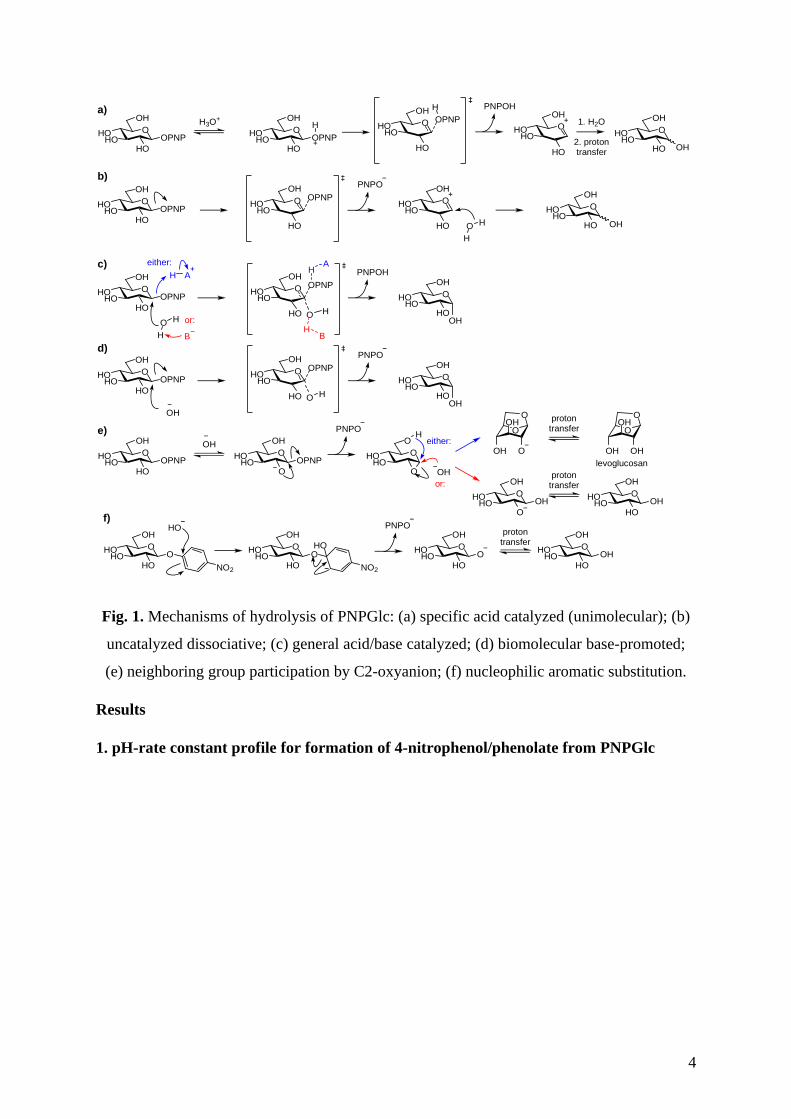
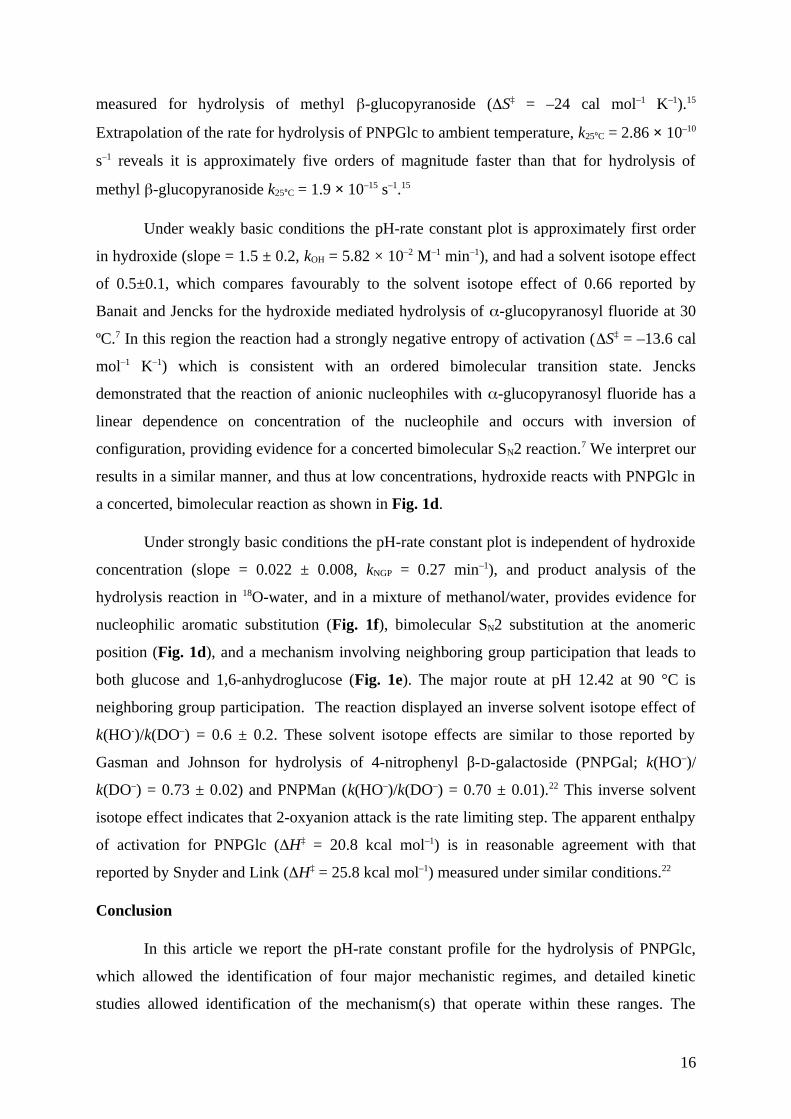
Fig. 1. Mechanisms of hydrolysis of PNPGlc: (a) specific acid catalyzed (unimolecular); (b)
uncatalyzed dissociative; (c) general acid/base catalyzed; (d) biomolecular base-promoted;
(e) neighboring group participation by C2-oxyanion; (f) nucleophilic aromatic substitution.
Results
1. pH-rate constant profile for formation of 4-nitrophenol/phenolate from PNPGlc
4
Reactions were conducted at elevated temperature, typically 90 °C, by monitoring
formation of the 4-nitrophenol/phenolate anion either in real time in a cuvette using a
spectrophotometer, or for slower reactions in sealed Wheaton vials after quenching with base.
At the extremes of pH reaction rates were too fast at 90 °C to be accurately determined. In
these cases, reactions were conducted at lower temperature and Arrhenius plots were used to
extrapolate rates to 90 °C. pH values of solutions and buffers at elevated temperature were
calculated from pH measured at 25 °C using the temperature sensitivity coefficients of the
pKa values of H2O or of buffers. Reactions were performed in 2 M NaCl solution and rates
corrected for salt effects by varying salt concentration from 0.25-2 M and extrapolating to
zero salt concentration (Tables S3, S4, S5; Fig. S3, S4). In the pH independent and weakly
basic regions rates buffer effects were measured by varying the buffer concentration from
0.25-1 M and extrapolating to zero buffer concentration (Table S6, S7; Fig. S5, S6).
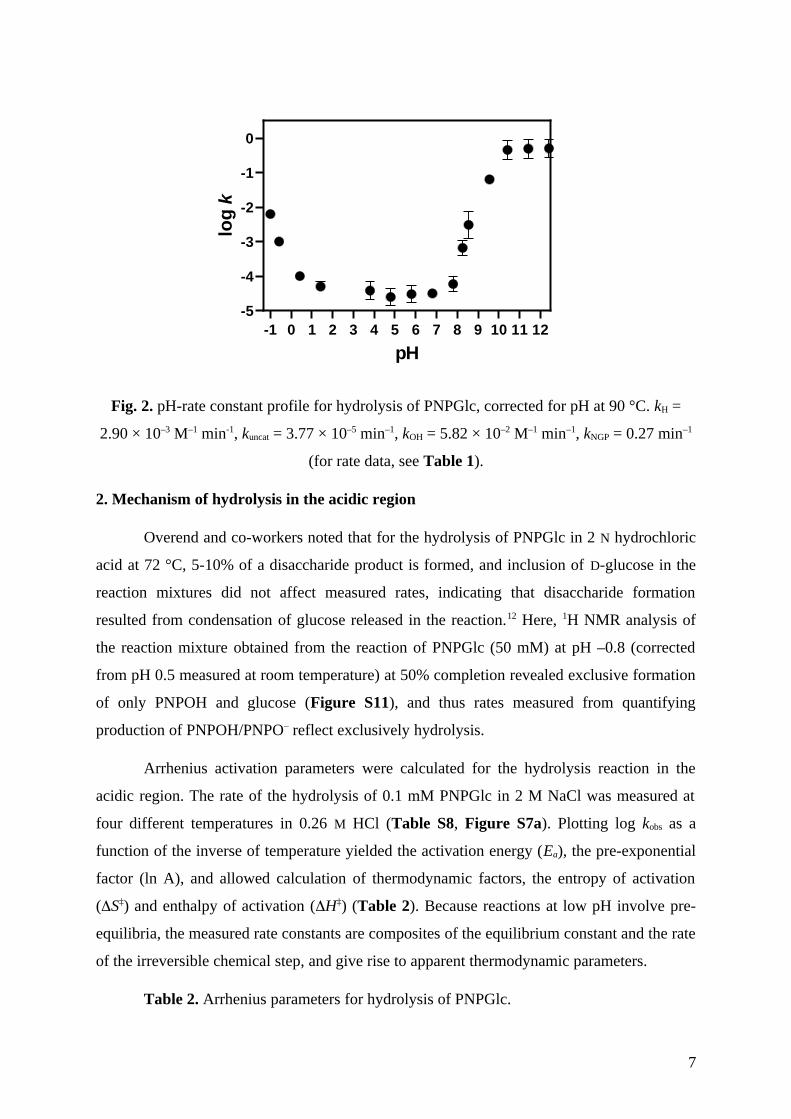
The experimentally determined pH-rate constant profile, log k versus pH, for
hydrolysis of PNPGlc at 90 °C is corrected for buffer and salt effects, and for the strongly
basic region, a minor incursion of nucleophilic aromatic substitution (Table 1, Fig. 2). The
plot reveals four distinct regions: the acidic region (pH –1 to 0), a pH-independent region (pH
1 to 7), and two basic regions (pH 8 to 10 and 10 to 12). The overall rate law is given by
equation 1:
kobs = kH[H+] + kuncat + kOH[HO–] + kNGP eq. 1
where kH is the rate constant for the specific acid catalyzed reaction, kuncat is the rate
constant for the uncatalyzed reaction, kOH is the rate constant for the bimolecular reaction
involving hydroxide, and kNGP is the rate constant for neighboring group participation by C2-
oxyanion. In each region the slope of the line of best fit corresponds to the kinetic order in
hydronium or hydroxide.25, 26
5
Table 1. Rates for the hydrolysis of PNPGlc (k) at 90 ºC, with pH corrected for 90 °C.
Observed rates (kobs) are corrected as followed. All rates are extrapolated to [salt] = 0. Rates
in the region pH 3.8-7.8 were extrapolated to [buffer] = 0. Rates in the strongly basic region
were corrected for bimolecular, and nucleophilic aromatic substitution processes (see Table
S11).
log k∆y ar2k (y x 102)
min-1
Correction
factor
kobs (y x 102)
min-1
pH
–2.20.0170.990.6300.42 b1.5–1
–30.010.990.10.42 b0.23–0.58
–40.040.990.010.42 b0.0230.42
–4.30.130.990.0050.42 b0.0111.42
–4.410.250.990.0040.25 c0.0163.8
–4.600.250.990.00250.25 c0.014.8
–4.600.250.990.00250.25 c0.01125.8
–4.60.0700.990.00310.25 c0.01246.8
–4.220.230.970.00631 d0.0067.8
–3.220.220.990.0601 d0.0658.26
–2.200.40.980.601 d0.308.55
–1.200.0510.986.001 d6.009.55
–0.340.250.98450.89 e50.6010.42
–0.300.240.98450.89 e50.6011.42
–0.300.20.94500.89 e56.1712.42
a Relative error = ∆y = (y`/y), standard error = y`. b Correction factor = salt effect. c Correction factor = buffer
effect. d No correction factor. e Correction factor = 1 – contribution of bimolecular process – contribution of
nucleophilic aromatic substitution = 1 – 0.1 – 0.01.
6
-1 0 1 2 3 4 5 6 7 8 9 10 11 12-5
-4
-3
-2
-1
0
pH
log
k
Fig. 2. pH-rate constant profile for hydrolysis of PNPGlc, corrected for pH at 90 °C. kH =
2.90 × 10⁻³ M–1 min-1, kuncat = 3.77 × 10⁻⁵ min–1, kOH = 5.82 × 10⁻² M–1 min–1, kNGP = 0.27 min–1
(for rate data, see Table 1).
2. Mechanism of hydrolysis in the acidic region
Overend and co-workers noted that for the hydrolysis of PNPGlc in 2 N hydrochloric
acid at 72 °C, 5-10% of a disaccharide product is formed, and inclusion of D-glucose in the
reaction mixtures did not affect measured rates, indicating that disaccharide formation
resulted from condensation of glucose released in the reaction.12 Here, 1H NMR analysis of
the reaction mixture obtained from the reaction of PNPGlc (50 mM) at pH –0.8 (corrected
from pH 0.5 measured at room temperature) at 50% completion revealed exclusive formation
of only PNPOH and glucose (Figure S11), and thus rates measured from quantifying
production of PNPOH/PNPO– reflect exclusively hydrolysis.
Arrhenius activation parameters were calculated for the hydrolysis reaction in the
acidic region. The rate of the hydrolysis of 0.1 mM PNPGlc in 2 M NaCl was measured at
four different temperatures in 0.26 M HCl (Table S8, Figure S7a). Plotting log kobs as a
function of the inverse of temperature yielded the activation energy (Ea), the pre-exponential
factor (ln A), and allowed calculation of thermodynamic factors, the entropy of activation
(S‡) and enthalpy of activation (H‡) (Table 2). Because reactions at low pH involve pre-
equilibria, the measured rate constants are composites of the equilibrium constant and the rate
of the irreversible chemical step, and give rise to apparent thermodynamic parameters.
Table 2. Arrhenius parameters for hydrolysis of PNPGlc.
7
pH a Ea(kcal mol–1)
ln A S‡ a
(cal mol–1 K–1)H‡
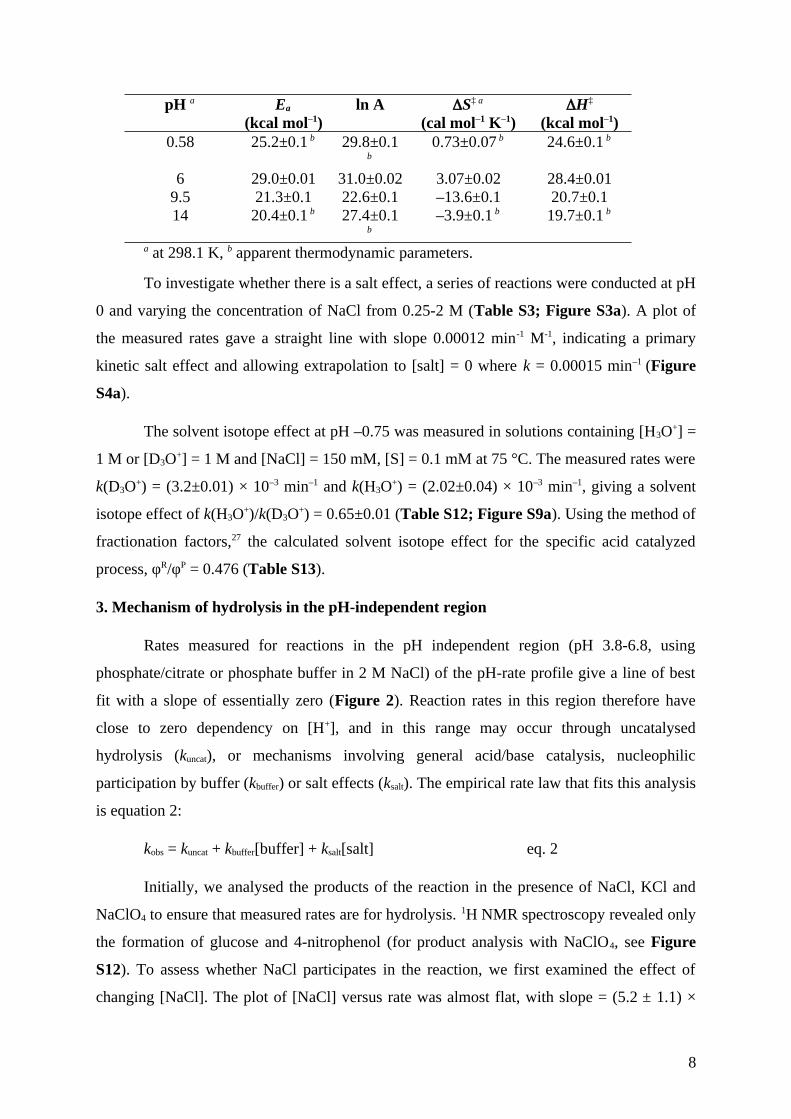
(kcal mol–1)0.58 25.2±0.1 b 29.8±0.1
b0.73±0.07 b 24.6±0.1 b
6 29.0±0.01 31.0±0.02 3.07±0.02 28.4±0.019.5 21.3±0.1 22.6±0.1 –13.6±0.1 20.7±0.114 20.4±0.1 b 27.4±0.1
b–3.9±0.1 b 19.7±0.1 b
a at 298.1 K, b apparent thermodynamic parameters.
To investigate whether there is a salt effect, a series of reactions were conducted at pH
0 and varying the concentration of NaCl from 0.25-2 M (Table S3; Figure S3a). A plot of
the measured rates gave a straight line with slope 0.00012 min-1 M-1, indicating a primary
kinetic salt effect and allowing extrapolation to [salt] = 0 where k = 0.00015 min–1 (Figure
S4a).
The solvent isotope effect at pH –0.75 was measured in solutions containing [H3O+] =
1 M or [D3O+] = 1 M and [NaCl] = 150 mM, [S] = 0.1 mM at 75 °C. The measured rates were
k(D3O+) = (3.2±0.01) × 10–3 min–1 and k(H3O+) = (2.02±0.04) × 10–3 min–1, giving a solvent
isotope effect of k(H3O+)/k(D3O+) = 0.65±0.01 (Table S12; Figure S9a). Using the method of
fractionation factors,27 the calculated solvent isotope effect for the specific acid catalyzed
process, φR/φP = 0.476 (Table S13).
3. Mechanism of hydrolysis in the pH-independent region
Rates measured for reactions in the pH independent region (pH 3.8-6.8, using
phosphate/citrate or phosphate buffer in 2 M NaCl) of the pH-rate profile give a line of best
fit with a slope of essentially zero (Figure 2). Reaction rates in this region therefore have
close to zero dependency on [H+], and in this range may occur through uncatalysed
hydrolysis (kuncat), or mechanisms involving general acid/base catalysis, nucleophilic
participation by buffer (kbuffer) or salt effects (ksalt). The empirical rate law that fits this analysis
is equation 2:
kobs = kuncat + kbuffer[buffer] + ksalt[salt] eq. 2
Initially, we analysed the products of the reaction in the presence of NaCl, KCl and
NaClO4 to ensure that measured rates are for hydrolysis. 1H NMR spectroscopy revealed only
the formation of glucose and 4-nitrophenol (for product analysis with NaClO4, see Figure
S12). To assess whether NaCl participates in the reaction, we first examined the effect of
changing [NaCl]. The plot of [NaCl] versus rate was almost flat, with slope = (5.2 ± 1.1) ×
8
10–6 M–1 min–1, indicating essentially no salt effect (Table S4, Figure S4b). Next, we
independently varied the cation (to KCl) and anion (to NaClO4) and examined the effects
upon reaction rates. At 2 M salt, the rate decreased (1.5 ± 0.2)-fold in KCl versus NaCl, and
by (2.0 ± 0.2)-fold in NaClO4, indicating limited salt participation, even at high
concentrations with slope = 0. Variation of [buffer] under conditions of pseudo constant ionic
strength, in this case with [NaCl] = 2 M at pH 3.8, gave a plot with slope kbuffer = 5.11 × 10⁻⁵
M–1 min–1 (Table S6, Figure S5d).
Collectively, the above experiments define kbuffer and ksalt, allowing calculation of the
rate constant for the uncatalyzed hydrolysis reaction (kuncat), the thermodynamic parameters
(at pH 5.8; Table S8; Fig. S7, S8; Table 2), and the solvent isotope effect. The solvent
isotope effect for the uncatalyzed reaction was measured in H2O or D2O solvent, pH = pD =
6.8, with [NaCl] = 150 mM and [buffer] = 0.005 M. The measured rates were: kuncat(D2O) =
(3.02±0.17) × 10–5 min–1 and kuncat(H2O) = (3.40±0.25) × 10–5 min–1 (Table S12; Figure S9b),
giving a solvent isotope effect of kuncat(H2O)/kuncat(D2O) = 1.1±0.1.
9
0 2000 4000 6000 80000.0
0.1
0.2
0.3
0.4
Time (min-1)
ln A
/(
A
- At)
pD 6.8
pH 6.8
0 2000 4000 6000 80000.0
0.1
0.2
0.3
0.4
Time (min-1)
ln A
/(
A
- At)
pH 6.8
pD 6.8
0.0 0.2 0.4 0.6 0.8 1.0
5×10 -5
6×10 -5
7×10 -5
8×10 -5
n
kn
a)
b)
c)
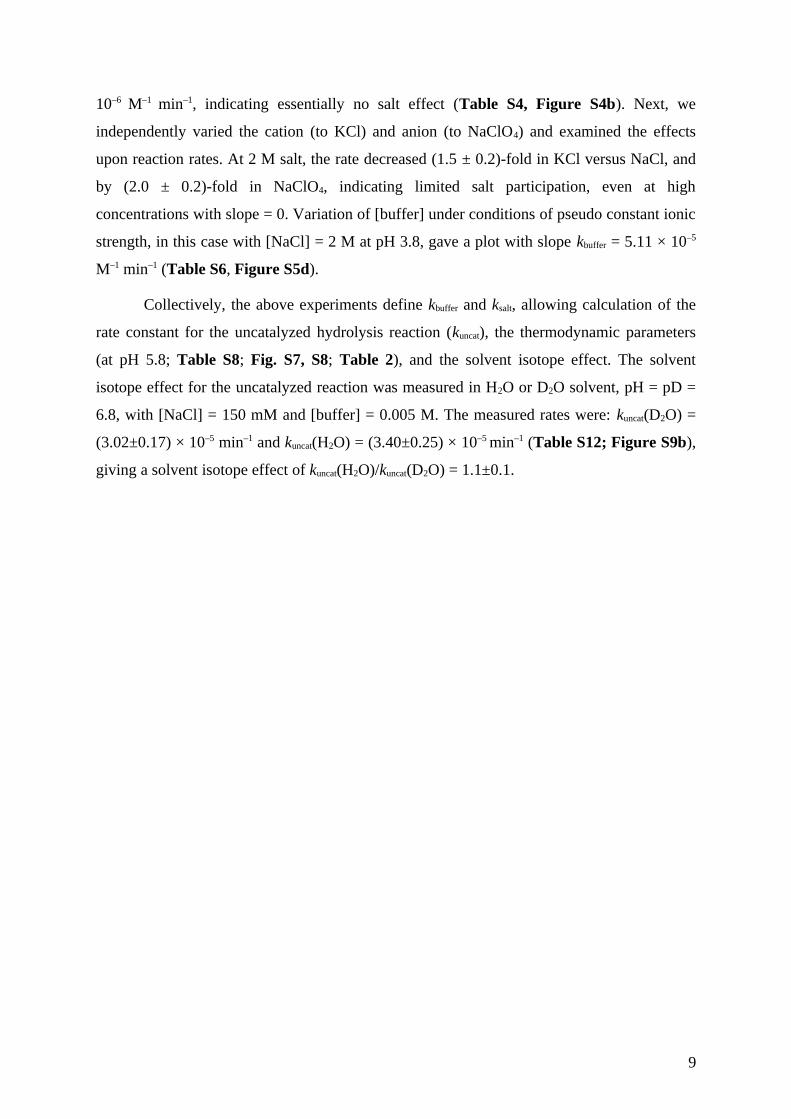
Fig. 3. Reactions in the pH independent region (pH = 6.8) at 90 ⁰C. (a) Solvent isotope effect
at [buffer] = 0.005 M. (b) Solvent isotope effect for [buffer] = 1 M. (c) Proton inventory plot
of kn as a function of D2O fraction (n) at [buffer] = 1 M, p(H,D) 6.8.
10
To study the nature of the buffer effect, we initially tested for general acid/base
catalysis by measuring a solvent isotope effect for [buffer] = 1 M in H2O and D2O at pH 3.8.
Solvent isotope effects allow detection of general acid/base catalysis by measuring the
number of protons in flight in the rate determining step. The solvent isotope effect, kH/kD =
1.5 ± 0.1, which indicates general acid/base catalysis (Table S12, Fig. S9). While this solvent
isotope effect gives evidence for general acid/base catalysis, it does not rule out nucleophilic
participation by buffer. To establish whether phosphate or citrate in the buffer participates in
the reaction, we repeated the pH 3.8 rate measurements in 1 M acetate buffer (with 2 M
NaCl) at the same pH and observed no significant difference in rates. However, this data does
not allow clear conclusions to be drawn as the pKa values for acetic acid (pKa 4.75) and citric
acid (pKa2 4.75) are similar,28 and they may engage in nucleophilic participation to similar
degrees. Attempts to detect the formation of a glycosyl acetate by NMR analysis of the
product mixture were unsuccessful, but the failure to observe this species is inconclusive for
nucleophilic participation.
11
We next sought to determine the number of protons in flight in the transition state of
the reaction in buffer in which general catalysis is implicated. The proton inventory technique
is a solvent isotope-effect experiment that gives information about the number of protons
transferred in a chemical reaction.29 Measurements are made of the solvent isotope effect in
varying mixtures of light and heavy solvent. If the proton inventory plot is linear, only one
proton is involved in the reaction, and if the proton inventory is curved, at least two protons
are involved.
The solvent isotope effect in 1 M phosphate buffer at 90 °C was kH/kD = 1.4 ± 0.09.
The inverse solvent isotope effect indicates that the protonation step is involved in the rate
determining step and the reaction at high buffer concentration proceeds with general
acid/base catalysis. Next, we measured the rate in a 20, 50 and 80% mixtures of light and
heavy water in 1 M buffer and 2 M NaCl at 90 °C (Table S14; Fig. S10). The measured rate
constants for different mixtures of isotopic solvents were plotted against the fraction of
deuterium (n) and yielded a linear plot (Fig. 3c). Because plots of low curvature can be
difficult to distinguish from linear plots, this data should be examined at the point of greatest
curvature, namely k0.5. The observed rate at k0.5 = (5.91±0.09) × 10–5 is in good agreement
with the mean(k0 and k1) = (5.98±0.08) × 10–5. Thus, these data suggest that the solvent
isotope effect arises from a single hydrogenic site in the transition state; that is, only one
proton is undergoing transfer in the rate-determining step (Fig. 1c). As the 4-nitrophenolate
leaving group can stabilize negative charge, we suggest that the proton in flight is involved in
base deprotonation of the water nucleophile.
4. Mechanism of hydrolysis in the basic region
(i) Mechanism under mildly basic conditions
1H NMR analysis of pH 7.8, 8.26 and 8.55 reaction mixtures at 50% completion
revealed only substrate, PNPOH/PNPO–, and glucose. In order to determine whether product
formation occurred through nucleophilic substitution at C1 or by nucleophilic aromatic
substitution, reactions were conducted in H218O and then analysed by mass spectrometry in
negative ion mode. This revealed the presence of PNPO– as m/z 138.02, corresponding to the16O isotopomer, with no detectable 18O-labelled product. Thus, rates measured from
quantifying production of PNPO– reflect only the bimolecular hydrolysis reaction.
To test for buffer participation, we measured rates while varying buffer concentration
under conditions of pseudo constant ionic strength, with [NaCl] = 2 M at 90 °C (Table S7;
12
Fig. S6). This gave linear plots with slope of close to zero (pH 7.8, (−¿3 ± 3) × 10–6 M–1 min–
1; pH 8.26, (3.34 ± 0.9) × 10–5 M–1 min–1; pH 8.55, (4.91 ± 0.16) × 10–4 M–1 min–1), indicating
that the rate of reaction is independent of buffer concentration across this pH range. The salt
effect in the weakly basic region was tested by measuring the reaction rate in 1 M NaCl (k =
(6.05 ± 0.03) × 10–4 min–1) and 0.25 M NaCl (k = (6.5 ± 0.03)× 10–4 min–1) at pH 8.26 at 90
°C, indicating that in the weakly basic region there is no significant salt effect (Fig. S3).
The above analysis allowed calculation of the thermodynamic parameters for the
biomolecular base-promoted hydrolysis reaction (Table S9; Fig. S7, S8; Table 2). The
solvent isotope effect for the biomolecular base-promoted hydrolysis reaction was measured
at pD = pH = 9.1 and 90 °C (Fig. S9). The measured rates were: k(DO–) = (1.77±0.16) × 10–3
min–1 and k(HO–) = (9.01±0.29) × 10–4 min–1, for a solvent isotope effect of k(HO–)/k(DO–) =
0.5 ± 0.1 (Table S12). The solvent isotope effect for the biomolecular process calculated
using solvent isotope fractionation factors is 0.476 (Table S13).
(ii) Mechanism under strongly basic conditions
At pH 12.42 and 55 °C, 1H NMR analysis of the product mixture of reactions run to
70% completion revealed PNPO–, and a complex set of peaks assigned as the base-
decomposition product of glucose and a new product with a characteristic H1 signal at 5.30
ppm in D2O that was assigned as 1,6-anhydro--D-glucopyranose (levoglucosan) (Fig. S13).
The observation of 1,6-anhydroglucose provides evidence for neighboring group participation
involving substitution of the anomeric group by the substrate 2-oxyanion, via a 1,2-anhydro
sugar (epoxide) intermediate. However, the 1,2-anhydrosugar intermediate can partition in
two ways: either by nucleophilic substitution involving intramolecular reaction with the 6-
hydroxyl group (leading to the 1,6-anhydro sugar, which is stable to base), or by reaction
with hydroxide (leading to glucose, which decomposes under the basic conditions of the
reaction).
In order to determine whether product formation occurred through nucleophilic
substitution at C1 or by nucleophilic aromatic substitution, reactions were conducted in H218O
and then analysed by mass spectrometry in negative ion mode. This revealed the presence of
PNPO– as m/z 138.02, corresponding to the 16O isotopomer, and a second peak at m/z 140.02,
corresponding to the 18O isotopomer, in a ratio of 99.1:0.89. This data demonstrate that
nucleophilic aromatic substitution contributes just under 1% of the rate observed by
quantifying production of PNPO–.
13
To investigate the partitioning of the 1,2-anhydrosugar intermediate between
intramolecular substitution and hydroxide substitution, the reaction was repeated in 1:1
MeOH/H2O with 0.5 M NaOH at 55 ⁰C (pH 12.96). 1H NMR spectroscopy revealed the
formation of a mixture of methyl -D-glucopyranoside, methyl -D-glucopyranoside and
levoglucosan in a ratio of 10:18:72 (Fig. S14). As explained earlier, levoglucosan arises
through neighboring group participation by a C2-oxyanion, which also produces methyl -D-
glucopyranoside. On the other hand, methyl -D-glucopyranoside (quantified through
integration of the anomeric CH3 group) arises exclusively by bimolecular substitution. The
pKa value of MeOH is 15.3 at 25 °C. Assuming the temperature dependence of the pKa of
MeOH is similar to that of water (pKa 13.26), for 1:1 MeOH/H2O with 0.5 M NaOH the
[MeO–] = 0.02, this allows calculation of the rate of neighboring group participation
(formation of levoglucosan and -D-glucose, which decomposes in base) by subtraction of
the rate of bimolecular substitution and nucleophilic aromatic substitution.
Reactions in this region are second order, depending on the concentration of
hydroxide and substrate.19, 22 However, under conditions of excess alkali, the reaction can be
treated as first order, dependent only upon the concentration of substrate.19 To investigate for
a salt effect, reactions were studied at 0-1.58 M NaCl (Table S5). A plot of k vs NaCl
concentration gave a line with slope close to zero showing that there is no significant salt
effect in this region and an average rate constant of k = (41.7±3.4) × 10–3 min–1 (Fig. S4).
The above data allowed calculation of the thermodynamic parameters for the
neighbouring group participation reaction (pH 12.42, Table S11; Fig. S7, S8; Table 2), and
the solvent isotope effect. Again, as for reactions at low pH, reactions at high pH involve pre-
equilibria, and the measured rate constants are composites of the equilibrium constant and the
rate of the irreversible chemical step and give rise to apparent thermodynamic parameters.
The solvent isotope effect was measured in H2O or D2O solvent at pH = pD = 13.1, with
[NaOD] = [NaOH] = 1 M and [NaCl] = 150 mM at 55 C. The measured rates were: ⁰ k(DO–)
= (1.0 ± 0.11) × 10–2 min–1 and k(HO–) = (6.0 ± 0.9) × 10–3 min–1), allowing calculation of a
solvent isotope effect of k(HO–)/k(DO–) = 0.6 ± 0.18 (Table S12; Fig. S9). This is in
agreement with the calculated solvent isotope effect (0.56) based on solvent isotope
fractionation factors for the intermolecular reaction (Table S13).
Discussion
The pH rate profile for PNPGlc hydrolysis (Fig. 2) was calculated from the pH rate
14
profile for formation of PNPOH/PNPO– by careful measurement of individual contributing
reactions and correction for their contribution to the observed rates (Table 1). The profile
gives evidence for at least 4 mechanistic regimes: at low pH, in the intermediate pH range, in
the mildly basic region, and at high pH.
In the acidic region, the pH-rate constant plot is first order in hydronium
concentration (slope = –1.21 ± 0.20, kH = 2.90 × 10⁻³ M–1 min–1) the apparent enthalpy of
activation (H‡ = 24.6 kcal mol–1) is in good agreement with the value measured by Snyder
and Link18 (H‡ = 25.5 kcal mol–1) under similar first order conditions. The solvent kinetic
isotope effect was k(H3O+)/k(D3O+) = 0.65±0.01. The inverse kinetic isotope effect indicates
that there is a greater preference for deuteration (D+) than protonation of the substrate and
that the specific acid catalysed hydrolysis of PNPGlc is a stepwise mechanism. Interpretation
of solvent KIEs is complicated by the contributions from primary effects for protons
undergoing transfer, and secondary effects, for example because of deuteration at
exchangeable positions. Using the method of fractionation factors, and assuming a specific
acid catalyzed mechanism, the calculated isotope fractionation factor φ for the hydrolysis of
PNPGlc at pD –0.41 at 75 °C was 0.48. Collectively this data is consistent with the reaction
mechanism shown in Fig. 1a, which involves a specific acid catalysed reaction in which the
substrate is converted to its conjugate acid, unimolecular fission to form the oxocarbenium
ion, followed by a rate-limiting reaction with H2O. This data is consistent with observations
made for methyl - and -glucopyranosides30 and -xylopyranosides.4
In the pH independent region (slope = –0.02 ± 0.04, kuncat = 3.77 × 10⁻⁵ min–1) there
was small solvent isotope effect k(H2O)/k(D2O) = 1.1±0.1. This compares favourably with the
solvent isotope effect of k(H2O)/k(D2O) = 0.93 measured by Banait and Jencks for the
hydrolysis of -glucopyranosyl fluoride at 30 °C in the pH independent region.7 A positive
entropy of activation of S‡ = 3.07 cal mol–1 K–1 was measured, similar to that for the acidic
region, which is again consistent with a unimolecular transition state for the hydrolysis of
PNPGlc. Together these data indicate that the uncatalysed hydrolysis of PNPGlc proceeds
through a dissociative mechanism to give short-lived glucosyl oxocarbenium ion, followed by
nucleophilic attack of water molecule. The positive entropy of activation is inconsistent with
a bimolecular process, and the observed solvent KIE is close to unity, which is consistent
with a calculated isotope fraction factor of 1 for the dissociative mechanism in Fig. 1b. The
entropy of activation (S‡ = 3.07 cal mol–1 K–1) is positive, but smaller than that measured for
the hydrolysis of DNPGlc (S‡ = 33.8 cal mol–1 K–1),16 and distinct from the negative value
15
measured for hydrolysis of methyl -glucopyranoside (S‡ = –24 cal mol–1 K–1).15
Extrapolation of the rate for hydrolysis of PNPGlc to ambient temperature, k25⁰C = 2.86 × 10⁻¹⁰
s–1 reveals it is approximately five orders of magnitude faster than that for hydrolysis of
methyl -glucopyranoside k25⁰C = 1.9 × 10⁻¹⁵ s–1.15
Under weakly basic conditions the pH-rate constant plot is approximately first order
in hydroxide (slope = 1.5 ± 0.2, kOH = 5.82 × 10⁻² M–1 min–1), and had a solvent isotope effect
of 0.5±0.1, which compares favourably to the solvent isotope effect of 0.66 reported by
Banait and Jencks for the hydroxide mediated hydrolysis of -glucopyranosyl fluoride at 30
ºC.7 In this region the reaction had a strongly negative entropy of activation (S‡ = –13.6 cal
mol–1 K–1) which is consistent with an ordered bimolecular transition state. Jencks
demonstrated that the reaction of anionic nucleophiles with -glucopyranosyl fluoride has a
linear dependence on concentration of the nucleophile and occurs with inversion of
configuration, providing evidence for a concerted bimolecular SN2 reaction.7 We interpret our
results in a similar manner, and thus at low concentrations, hydroxide reacts with PNPGlc in
a concerted, bimolecular reaction as shown in Fig. 1d.
Under strongly basic conditions the pH-rate constant plot is independent of hydroxide
concentration (slope = 0.022 ± 0.008, kNGP = 0.27 min–1), and product analysis of the
hydrolysis reaction in 18O-water, and in a mixture of methanol/water, provides evidence for
nucleophilic aromatic substitution (Fig. 1f), bimolecular SN2 substitution at the anomeric
position (Fig. 1d), and a mechanism involving neighboring group participation that leads to
both glucose and 1,6-anhydroglucose (Fig. 1e). The major route at pH 12.42 at 90 °C is
neighboring group participation. The reaction displayed an inverse solvent isotope effect of
k(HO-)/k(DO–) = 0.6 ± 0.2. These solvent isotope effects are similar to those reported by
Gasman and Johnson for hydrolysis of 4-nitrophenyl β-D-galactoside (PNPGal; k(HO–)/
k(DO–) = 0.73 ± 0.02) and PNPMan (k(HO–)/k(DO–) = 0.70 ± 0.01).22 This inverse solvent
isotope effect indicates that 2-oxyanion attack is the rate limiting step. The apparent enthalpy
of activation for PNPGlc (H‡ = 20.8 kcal mol–1) is in reasonable agreement with that
reported by Snyder and Link (H‡ = 25.8 kcal mol–1) measured under similar conditions.22
Conclusion
In this article we report the pH-rate constant profile for the hydrolysis of PNPGlc,
which allowed the identification of four major mechanistic regimes, and detailed kinetic
studies allowed identification of the mechanism(s) that operate within these ranges. The
16
present work highlights the complexity of hydrolytic reactions of aryl 1,2-trans glycosides,
which aside from the minor SNAr process are united through the stabilization of developing
positive charge at the anomeric centre at the transition state by the endocyclic ring oxygen.
The present work provides useful reference data to understand the rate enhancements
achieved by enzymes. The most significant rate enhancements occur at the pH extremes,
through specific acid or specific base catalyzed reactions. By contrast the enzymatic cleavage
catalyzed by glycosidases are general acid and/or base catalyzed. Broadly, glycosidases
operate at intermediate pH ranges and utilize general catalysis to assist substitution reactions
at the anomeric centre by water or an enzymatic nucleophile.31 However, a mechanism
involving neighboring-group participation by the 2-hydroxyl of an -mannoside (also likely
benefiting from general base catalysis) has been demonstrated for a bacterial endo-α-1,2-
mannosidase,32 which shares obvious similarities to that studied here.
Experimental
General
4-Nitrophenyl -D-glucopyranoside (PNPGlc) was synthesized as described33 and
recrystallized to purity, as assessed by 1H NMR spectroscopy. NMR spectroscopy was
conducted using 400 and 600 MHz instruments. 18O-water (Marshall Isotopes Ltd, 97%) and2H-water (Sigma Aldrich, 99.9%) were used for mechanism and kinetic studies, respectively.
Mass spectrometry was performed using electrospray ionization and an OrbiTrap instrument.
pH values of solutions and buffers at elevated temperature were calculated from pH measured
at 25 °C using the temperature sensitivity coefficients of the pKa values of H2O or of buffers,
using ΔpH = ΔpKa, and d(pKa)/dT describes the change of the pKa at an increase of
temperature by 1 °C.34 Water: pKw = 12.42;35 phosphate/citric acid, pH range 4-5 pKa = 7.20,
2.79, respectively, temperature coefficient = –0.0028/0); phosphate, pH range 6-8, pK2 =
7.20, temperature coefficient = –0.0028, and bicarbonate/carbonate, pH range 9.2-11, pKa1 =
6.35, temperature coefficient = –0.0055, pKa2 = 10.32, temperature coefficient = –0.009.
Measurement of reaction rates. A Cary3500 UV-Vis spectrophotometry was used to
monitor rates of cleavage of PNPGlc by monitoring the released 4-nitrophenol/4-
nitrophenolate anion (Fig. S1). For continuous assays, reactions were monitored at the
isosbestic point of 350 nm using an extinction coefficient (), PNP = 6.212 mM–1 cm–1. For
stopped assays, an aliquot was taken from the reaction mixture and alkalinized to pH 10 by
17
quenching with 2 M Na2CO3, then 4-nitrophenolate anion was quantified at 400 nm using PNP
= 16.14 mM–1 cm–1 (Tables S1, S2; Fig. S2). All spectrophotometric measurements were
carried out under pseudo-first order conditions with low substrate concentration (1-5 mM)
and high concentration of the relevant catalyst (H3O+, buffer, or HO–). Spectroscopic
absorbances were measured against a reference cell containing 1 M HCl or NaOH, or 2 M
Na2CO3.
Reaction rates at varying pH. Individual reactions contained 1-5 mM PNPGlc. For
reactions at pH < 4, solutions were prepared by dilution of aq HCl and contained 2 M NaCl.
In the range pH 4-11 phosphate and carbonate buffers were used, typically 1 M buffer and 2
M NaCl. In the range of pH 12-14 standardized NaOH was diluted to the final pH and
contained 2 M NaCl. Reactions were heated at 75-90 °C for 2-196 h. Reactions at pH 0 and >
11 were performed in semi-micro quartz cuvettes at < 75 °C, and changes in absorbance
monitored directly in a UV-Vis spectrophotometer at 350 nm, with rates calculated using the
Beer-Lambert law. Very slow reactions suffered from evaporation of solvent, and in these
cases, reactions were performed in tightly-sealed Wheaton vials. At various time points
aliquots were sampled and added to 2 M Na2CO3 and the absorbance of the sample was
measured directly at 400 nm. Rates were extrapolated to 90 °C using the Arrhenius
parameters determined as outlined below. After correcting for salt, buffer and any other
effects data was fit to the modified Henderson-Hasselbach equation.
Salt effects. Reactions were performed by varying concentration of NaCl from 0.25-2 M. The
data gave a straight line and extrapolation to [NaCl] = 0 allowed estimation of k0 and slope of
the rate constant. In the acidic or basic regions reactions were monitored by UV/Vis
spectroscopy.
In the pH-independent region reactions were conducted in water buffered by 0.005 M
phosphate buffer, with concentrations of NaCl varied in the range 0.25–2 M. Sub-samples
taken at different time intervals were evaporated to dryness and redissolved in D2O and
studied by 1H NMR spectroscopy. The rates were determined by monitoring the formation of
product (PNP) with time, by plotting the product integration ratio, f = nA/(nA + nB), where nA
is the integration of PNP aromatic proton, nB is the integration of the PNP-β-Glc aromatic
protons. The calculated product ratio was plotted as a function of time using k = f/t.
Buffer effects. Rates were extrapolated to zero buffer by holding the pH constant and
varying the buffer concentration. At pH values < 1.42, a plot of rate versus [buffer] gave a
18
straight line with y-intercept being the rate at zero buffer and the slope, kbuffer, the general
catalysed rate constant.
Product analysis. To assess the identity and relative proportions of products, reactions were
run to approximately 50% completion, then were evaporated to dryness. For NMR analysis,
samples were dissolved in d6-DMSO or D2O. For mass spectrometric analysis samples were
dissolved in MeOH.
Activation parameters. The Arrhenius equation was used to calculate the thermodynamic
parameters of the hydrolysis reaction. The rate of hydrolysis of 1 mM PNPGlc was measured
at 350 or 400 nm in solutions of the appropriate pH (Table 2) at 75–45 °C and 150 mM NaCl
at four different temperatures. Plotting the natural logarithm of kobs as a function of the
inverse of the temperatures gives a straight line with slope of −Ea
R and a y intercept of ln A,
and allowed calculation of the activation energy, Ea, and the pre-exponential factor in the
Arrhenius relationship, ln A (eq. 3):
ln A=ln k+Ea /R T 1 eq. 3
The activation parameters allowed calculation of the enthalpy and entropy of activation at
298.1 K, according to equations 4 and 5 derived from transition state theory:
ΔH‡ = Ea – RT eq. 4
ΔS ‡=R (ln A−ln
K B T
h ) R eq. 5
where KB is Boltzmann constant, h is Planck’s constant, T is the temperature, and R is
the ideal gas constant.
Solvent isotope effects. The solvent isotope effect in the acidic region was measured in
solutions contained [H3O+] = 1 M or [D3O+] = 1 M (prepared by 1:10 dilution of 10 M HCl
into H2O or D2O) and [NaCl] = 150 mM, with [PNPGlc] = 0.1 mM at 75 °C. Initial rates
were measured using a continuous assay at 350 nm in triplicate to either calculate standard
deviation (SD) or standard error (SR).
The solvent isotope effect in the pH independent region was measured in H2O or D2O
pH = pD = 6.8 (determined using the correction for a glass electrode of pD = pH + 0.41),
19
with [phosphate] = 0.005 M, [NaCl] = 150 mM, and [PNPGlc] = 1 mM at 90 ˚C or with
[phosphate] = 1 M, [NaCl] = 2 M. Initial rates were measured in triplicate using a stopped
assay after quenching with base.
The solvent isotope effect was measured in H2O or D2O solvent at pH = pD = 13.26,
with [NaOD] = [NaOH] = 1 M (prepared by 1:10 dilution of 10 M NaOH into H2O or D2O)
and [NaCl] = 150 mM, and [PNPGlc] = 0.1 mM at 75 ˚C. Initial rates were measured in
triplicate using a continuous assay at 400 nm.
The proton inventory experiment was conducted in the pH-independent region using
phosphate buffer made from a mixed solution of D2O and H2O, p(H,D) = 5.8 at 90 °C.
According to guidance from Rubinson36 no corrections are needed in mixed H2O-D2O buffers
for p(H,D) measurements < 8. The preparation of buffer was carried out using stock solutions
of the 1 M acidic and basic buffer components in D2O, each of which contains 2 M NaCl, and
another two stock solutions made in the same manner in H2O. Each set of stock solutions
were combined to make 1 M buffers of pD 5.8 and pH 5.8 (determined using the correction
for a glass electrode of pD = pH + 0.41) and ionic strength 2 M NaCl. Reaction solutions of a
total volume of 1 ml were obtained by mixing the appropriate amount of D2O and H2O
buffers to give samples with varying content of D2O (0, 20, 50, 80 and 100%) where the 0
and 100% samples were made using the unmixed D2O and H2O buffers. Rate data was
analysed using the linear Gross-Butler equation (eq 6):
kn
k0
=(1−n+nφ1
TS)
(1−n+nφ1GS
)
eq. 6
where kn = the rate constant at atom fractionation deuterium n, k0 = the rate
constant in pure water, and φ1TS
and φ1GS
are the fractionation factors of
the exchangeable proton in the transition and ground state.
Calculation of predicted solvent isotope effects. The solvent isotope effect was calculated
using the isotopic fractionation factor φ.27 The isotopic fractionation factor is the preference
of a hydrogen to be at any site in the solute over the solvent. Thus, in the equilibrium reaction
where the substrate is converted to its conjugate acid the equilibrium fractionation factors
20
defined by equation 7 allows the calculation of the preferred hydron site as an equilibrium
ratio.
KH
K D
=[RD ]/ [RH ]
[ ROH ]/ [ROD ]/
[PD ] /[PH ]
[ POD] /[POH ]=¿
φR
φP
¿ eq. 7
Associated Content
Supporting information
Electronic supplementary information (ESI) available. See DOI:
Kinetic measurements including rates of hydrolysis under various pH and buffer conditions,
dependencies of rates upon temperature, solvent isotope effects and proton inventory. NMR
spectra for sample reactions, Tables S1-14 and Figures S1-14 (PDF).
Author Information
Corresponding Author
Spencer J. Williams, Email: [email protected]
Notes
The authors declare no competing financial interest.
21
Acknowledgements
This work was supported by a grant from the Australian Research Council (DP180101957,
DP210100233). AA thanks Jazan University for financial support and thanks the Saudi
Arabian Cultural Mission (SACM).
References
1. Colombo, C.; Bennet, A. J., The physical organic chemistry of glycopyranosyl
transfer reactions in solution and enzyme-catalyzed. Curr. Opin. Chem. Biol. 2019, 53, 145-
157.
2. Amyes, T. L.; Jencks, W. P., Lifetimes of oxocarbenium ions in aqueous solution
from common ion inhibition of the solvolysis of α-azido ethers by added azide ion. J. Am.
Chem. Soc. 1989, 111, 7888-7900.
3. Zhu, J.; Bennet, A. J., Hydrolysis of (2-Deoxy-α-D-Glucopyranosyl)pyridinium
Salts: The 2-Deoxyglucosyl Oxocarbenium Is Not Solvent-Equilibrated in Water. J. Am.
Chem. Soc. 1998, 120, 3887-3893.
4. Indurugalla, D.; Bennet, A. J., A Kinetic Isotope Effect Study on the Hydrolysis
Reactions of Methyl Xylopyranosides and Methyl 5-Thioxylopyranosides: Oxygen versus
Sulfur Stabilization of Carbenium Ions. J. Am. Chem. Soc. 2001, 123, 10889-10898.
5. Sinnott, M. L.; Jencks, W. P., Solvolysis of D-glucopyranosyl derivatives in mixtures
of ethanol and 2,2,2-trifluoroethanol. J. Am. Chem. Soc. 1980, 102, 2026-2032.
6. Banait, N. S.; Jencks, W. P., Reactions of anionic nucleophiles with α-D-
glucopyranosyl fluoride in aqueous solution through a concerted, ANDN (SN2) mechanism. J.
Am. Chem. Soc. 1991, 113, 7951-7958.
7. Banait, N. S.; Jencks, W. P., General-acid and general-base catalysis of the cleavage
of a-D-glucopyranosyl fluoride. J. Am. Chem. Soc. 1991, 113, 7958-7963.
8. Huang, X.; Surry, C.; Hiebert, T.; Bennet, A. J., Hydrolysis of (2-Deoxy-β-D-
glucopyranosyl)pyridinium Salts. J. Am. Chem. Soc. 1995, 117, 10614-10621.
9. BeMiller, J. N., Acid-catalyzed hydrolysis of glycosides. Adv. Carbohydr. Chem.
1967, 22, 25-108.
10. Bunton, C. A.; Lewis, T. A.; Llewellyn, D. R.; Vernon, C. A., Mechanisms of
reactions in the sugar series. Part I. The acid-catalysed hydrolysis of α- and β-methyl and α-
and β-phenyl D-glucopyranosides. J. Chem. Soc. 1955, 4419-4423.
22
11. Rosenberg, S.; Kirsch, J. F., Oxygen-18 leaving group kinetic isotope effects on the
hydrolysis of nitrophenyl glycosides. 2. Lysozyme and β-glucosidase: acid and alkaline
hydrolysis. Biochemistry 1981, 20, 3196-3204.
12. Overend, W. G.; Rees, C. W.; Sequeira, J. S., 675. Reactions at position 1 of
carbohydrates. Part III. The acid-catalysed hydrolysis of glycosides. J. Chem. Soc. 1962,
3429-3440.
13. Nath, R. L.; Rydon, H. N., The influence of structure on the hydrolysis of substituted
phenyl β-d-glucosides by emulsin. Biochem. J. 1954, 57, 1-10.
14. Hall, A. N.; Hollingshead, S.; Rydon, H. N., The acid and alkaline hydrolysis of
some substituted phenyl alpha-D-glucosides. J. Chem. Soc. 1961, 4290-4295.
15. Wolfenden, R.; Lu, X.; Young, G., Spontaneous hydrolysis of glycosides. J. Am.
Chem. Soc. 1998, 120, 6814-6815.
16. Namchuk, M. N.; McCarter, J. D.; Becalski, A.; Andrews, T.; Withers, S. G., The
Role of Sugar Substituents in Glycoside Hydrolysis. J. Am. Chem. Soc. 2000, 122, 1270-
1277.
17. Ballou, C. E., Alkali-Sensitive Glycosides. Adv. Carbohydr. Chem. 1954, 9, 59-95.
18. Snyder, J. A.; Link, K. P., Acid and Alkaline Hydrolysis Rates and Heats of
Activation of Some o- and p-Nitrophenyl Glycosides1. J. Am. Chem. Soc. 1952, 74, 1883-
1884.
19. Dyfverman, A.; Lindberg, B., The Alkaline Hydrolysis of Phenyl β-Glucosides. A
Kinetic Investigation. Acta Chem. Scand. 1950, 878-884.
20. Koehler, L. H.; Hudson, C. S., Some Reactions of the 2,4,6-Tribromophenyl β-D-
Pyranosides of Glucose and Xylose. J. Am. Chem. Soc. 1950, 72, 981-983.
21. McCloskey, C. M.; Coleman, G. H., A proposed inversion mechanism for the
formation of levoglucosan from phenyl β-D-glucoside and trimethylglucosylammonium
compounds. J. Org. Chem. 1945, 10, 184-193.
22. Gasman, R. C.; Johnson, D. C., C-2 Oxyanion Participation in the Base-Catalyzed
Cleavage of p-Nitrophenyl β-D-Galactopyranoside and p-Nitrophenyl α-D-Mannopyranoside.
J. Org. Chem. 1966, 31, 1830-1838.
23. Speciale, G.; Farren-Dai, M.; Shidmoossavee, F. S.; Williams, S. J.; Bennet, A. J.,
C2-Oxyanion neighboring group participation: Transition state structure for the hydroxide-
promoted hydrolysis of 4-nitrophenyl α-D-mannopyranoside. J. Am. Chem. Soc. 2016, 138,
14012-14019.
24. Chan, J.; Sannikova, N.; Tang, A.; Bennet, A. J., Transition-State Structure for the
23
Quintessential SN2 Reaction of a Carbohydrate: Reaction of α-Glucopyranosyl Fluoride with
Azide Ion in Water. J. Am. Chem. Soc. 2014, 136, 12225-12228.
25. Alibrandi, G.; Coppolino, S.; Micali, N.; Villari, A., Variable pH kinetics: An easy
determination of pH–rate profile. J. Pharm. Sci. 2001, 90, 270-274.
26. Loudon, G. M., Mechanistic interpretation of pH-rate profiles. J. Chem. Educ. 1991,
68, 973.
27. Schowen, R. L., Mechanistic deductions from solvent isotope effects. Progress Phys.
Org. Chem. 1972, 9, 275-332.
28. Dean, J. A., Lange's Handbook of Chemistry. McGraw-Hill Inc: New York, 1999.
29. Venkatasubban, K. S.; Schowen, R. L., The proton inventory technique. CRC Crit.
Rev. Biochem. 1984, 17, 1-44.
30. Bennet, A. J.; Sinnott, M. L., Complete kinetic isotope effect description of transition
states for acid-catalyzed hydrolyses of methyl α- and β-glucopyranosides. J. Am. Chem. Soc.
1986, 108, 7287-7294.
31. Zechel, D. L.; Withers, S. G., Glycosidase mechanisms: Anatomy of a finely tuned
catalyst. Acc. Chem. Res. 2000, 33, 11-18.
32. Sobala, L. F.; Speciale, G.; Zhu, S.; Raich, L. s.; Sannikova, N.; Thompson, A. J.;
Hakki, Z.; Lu, D.; Shamsi Kazem Abadi, S.; Lewis, A. R.; Rojas-Cervellera, V.;
Bernardo-Seisdedos, G.; Zhang, Y.; Millet, O.; Jiménez-Barbero, J.; Bennet, A. J.;
Sollogoub, M.; Rovira, C.; Davies, G. J.; Williams, S. J., An Epoxide Intermediate in
Glycosidase Catalysis. ACS Cent. Sci. 2020, 6, 760-770.
33. Dess, D.; Kleine, H. P.; Weinberg, D. V.; Kaufman, R. J.; Sidhu, R. S., Phase-
Transfer Catalyzed Synthesis of Acetylated Aryl β-D-Glucopyranosides and Aryl β-D-
Galactopyranosides. Synthesis 1981, 1981, 883-885.
34. Ellis, K. J.; Morrison, J. F., Buffers of constant ionic strength for studying pH-
dependent processes. In Methods Enzymol., Purich, D. L., Ed. Academic Press: 1982; Vol.
87, pp 405-426.
35. Bandura, A. V.; Lvov, S. N., The Ionization Constant of Water over Wide Ranges of
Temperature and Density. J. Phys. Chem. Ref. Data 2005, 35, 15-30.
36. Rubinson, K. A., Practical corrections for p(H,D) measurements in mixed H2O/D2O
biological buffers. Anal. Methods 2017, 9, 2744-2750.
24
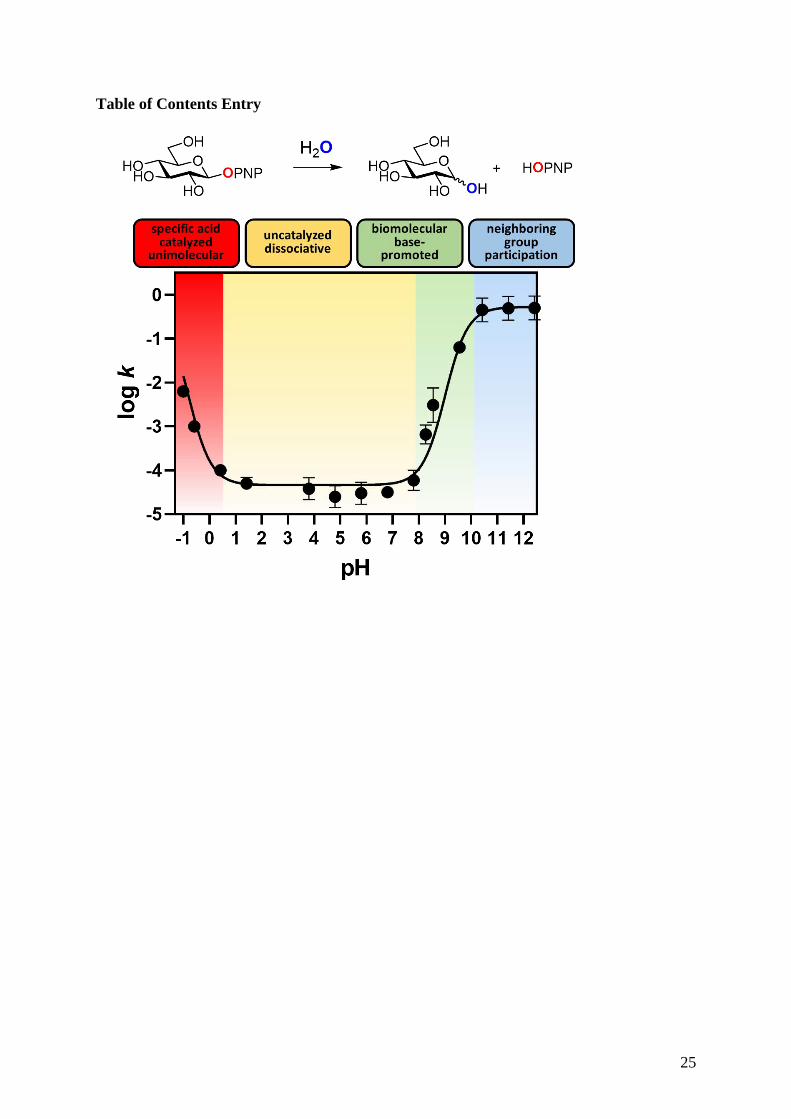
Table of Contents Entry
25

download fileview on ChemRxivmanuscript_120421.docx (425.84 KiB)
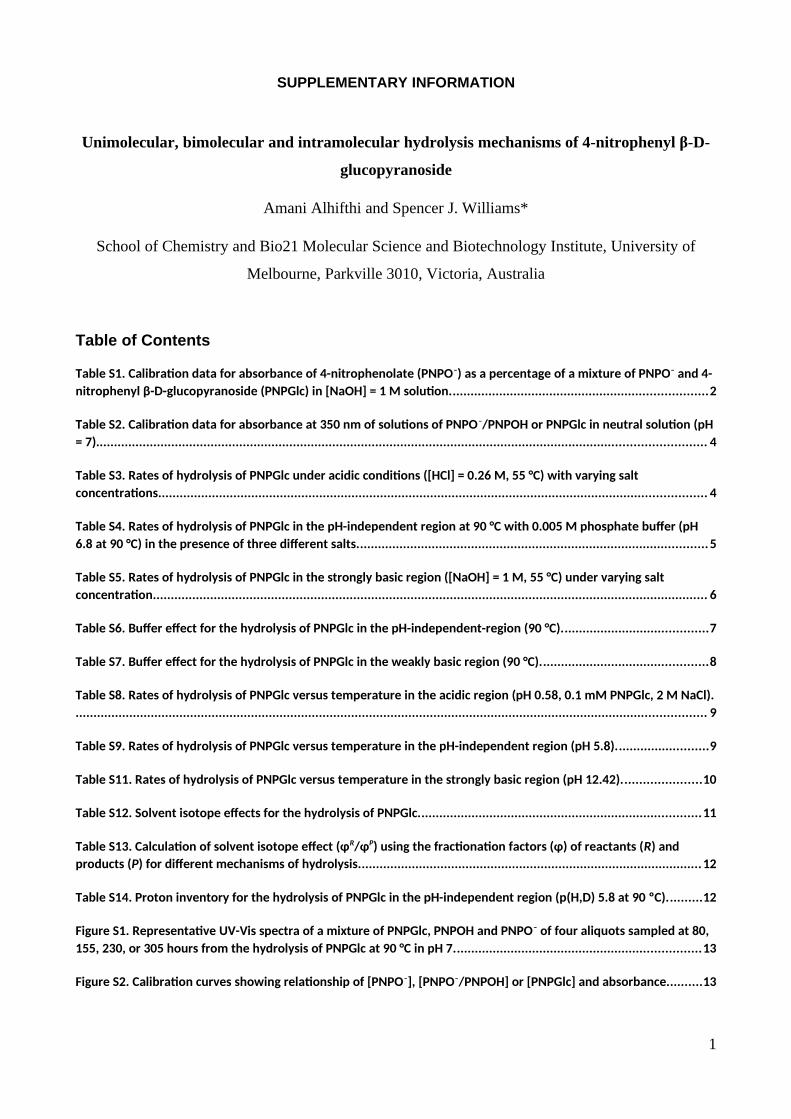
SUPPLEMENTARY INFORMATION
Unimolecular, bimolecular and intramolecular hydrolysis mechanisms of 4-nitrophenyl β-D-
glucopyranoside
Amani Alhifthi and Spencer J. Williams*
School of Chemistry and Bio21 Molecular Science and Biotechnology Institute, University of
Melbourne, Parkville 3010, Victoria, Australia
Table of Contents
Table S1. Calibration data for absorbance of 4-nitrophenolate (PNPO–) as a percentage of a mixture of PNPO– and 4-
nitrophenyl β-D-glucopyranoside (PNPGlc) in [NaOH] = 1 M solution........................................................................2
Table S2. Calibration data for absorbance at 350 nm of solutions of PNPO–/PNPOH or PNPGlc in neutral solution (pH
= 7).......................................................................................................................................................................... 4
Table S3. Rates of hydrolysis of PNPGlc under acidic conditions ([HCl] = 0.26 M, 55 °C) with varying salt
concentrations......................................................................................................................................................... 4
Table S4. Rates of hydrolysis of PNPGlc in the pH-independent region at 90 °C with 0.005 M phosphate buffer (pH
6.8 at 90 °C) in the presence of three different salts..................................................................................................5
Table S5. Rates of hydrolysis of PNPGlc in the strongly basic region ([NaOH] = 1 M, 55 °C) under varying salt
concentration........................................................................................................................................................... 6
Table S6. Buffer effect for the hydrolysis of PNPGlc in the pH-independent-region (90 °C).........................................7
Table S7. Buffer effect for the hydrolysis of PNPGlc in the weakly basic region (90 °C)...............................................8
Table S8. Rates of hydrolysis of PNPGlc versus temperature in the acidic region (pH 0.58, 0.1 mM PNPGlc, 2 M NaCl).
................................................................................................................................................................................ 9
Table S9. Rates of hydrolysis of PNPGlc versus temperature in the pH-independent region (pH 5.8)..........................9
Table S11. Rates of hydrolysis of PNPGlc versus temperature in the strongly basic region (pH 12.42)......................10
Table S12. Solvent isotope effects for the hydrolysis of PNPGlc...............................................................................11
Table S13. Calculation of solvent isotope effect (φR/φP) using the fractionation factors (φ) of reactants (R) and
products (P) for different mechanisms of hydrolysis................................................................................................12
Table S14. Proton inventory for the hydrolysis of PNPGlc in the pH-independent region (p(H,D) 5.8 at 90 ºC)..........12
Figure S1. Representative UV-Vis spectra of a mixture of PNPGlc, PNPOH and PNPO– of four aliquots sampled at 80,
155, 230, or 305 hours from the hydrolysis of PNPGlc at 90 °C in pH 7.....................................................................13
Figure S2. Calibration curves showing relationship of [PNPO–], [PNPO–/PNPOH] or [PNPGlc] and absorbance..........13
1
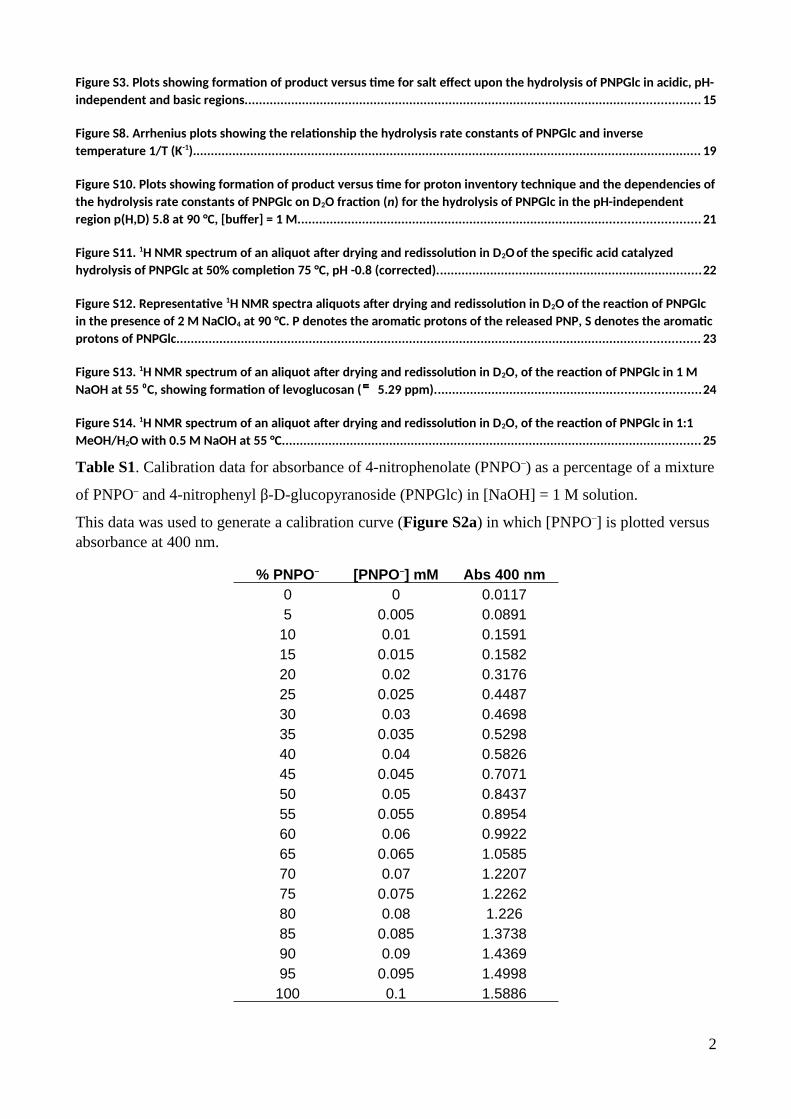
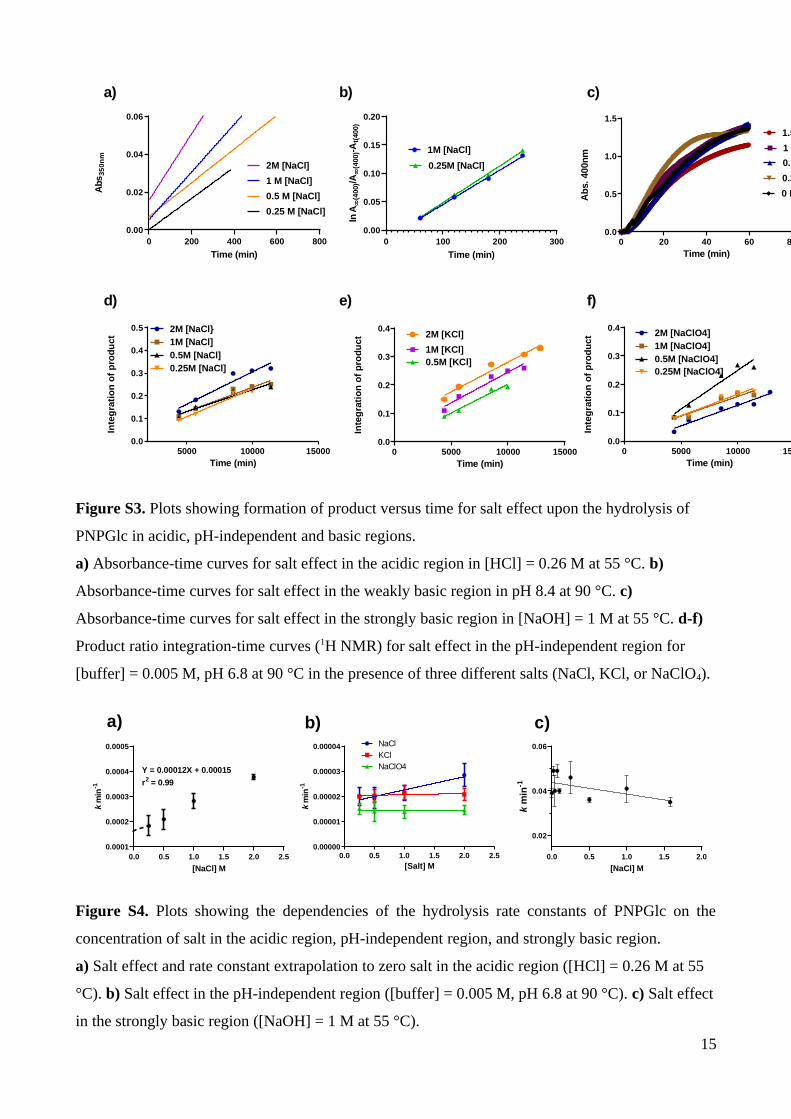
Figure S3. Plots showing formation of product versus time for salt effect upon the hydrolysis of PNPGlc in acidic, pH-
independent and basic regions............................................................................................................................... 15
Figure S8. Arrhenius plots showing the relationship the hydrolysis rate constants of PNPGlc and inverse
temperature 1/T (K-1).............................................................................................................................................. 19
Figure S10. Plots showing formation of product versus time for proton inventory technique and the dependencies of
the hydrolysis rate constants of PNPGlc on D2O fraction (n) for the hydrolysis of PNPGlc in the pH-independent
region p(H,D) 5.8 at 90 °C, [buffer] = 1 M................................................................................................................ 21
Figure S11. 1H NMR spectrum of an aliquot after drying and redissolution in D2O of the specific acid catalyzed
hydrolysis of PNPGlc at 50% completion 75 °C, pH -0.8 (corrected)..........................................................................22
Figure S12. Representative 1H NMR spectra aliquots after drying and redissolution in D2O of the reaction of PNPGlc
in the presence of 2 M NaClO4 at 90 °C. P denotes the aromatic protons of the released PNP, S denotes the aromatic
protons of PNPGlc.................................................................................................................................................. 23
Figure S13. 1H NMR spectrum of an aliquot after drying and redissolution in D2O, of the reaction of PNPGlc in 1 M
NaOH at 55 ⁰C, showing formation of levoglucosan ( 5.29 ppm). .........................................................................24
Figure S14. 1H NMR spectrum of an aliquot after drying and redissolution in D2O, of the reaction of PNPGlc in 1:1
MeOH/H2O with 0.5 M NaOH at 55 °C..................................................................................................................... 25
Table S1. Calibration data for absorbance of 4-nitrophenolate (PNPO–) as a percentage of a mixture
of PNPO– and 4-nitrophenyl β-D-glucopyranoside (PNPGlc) in [NaOH] = 1 M solution.
This data was used to generate a calibration curve (Figure S2a) in which [PNPO–] is plotted versus absorbance at 400 nm.
% PNPO– [PNPO–] mM Abs 400 nm0 0 0.01175 0.005 0.0891
10 0.01 0.159115 0.015 0.158220 0.02 0.317625 0.025 0.448730 0.03 0.469835 0.035 0.529840 0.04 0.582645 0.045 0.707150 0.05 0.843755 0.055 0.895460 0.06 0.992265 0.065 1.058570 0.07 1.220775 0.075 1.226280 0.08 1.22685 0.085 1.373890 0.09 1.436995 0.095 1.4998
100 0.1 1.5886
2

3
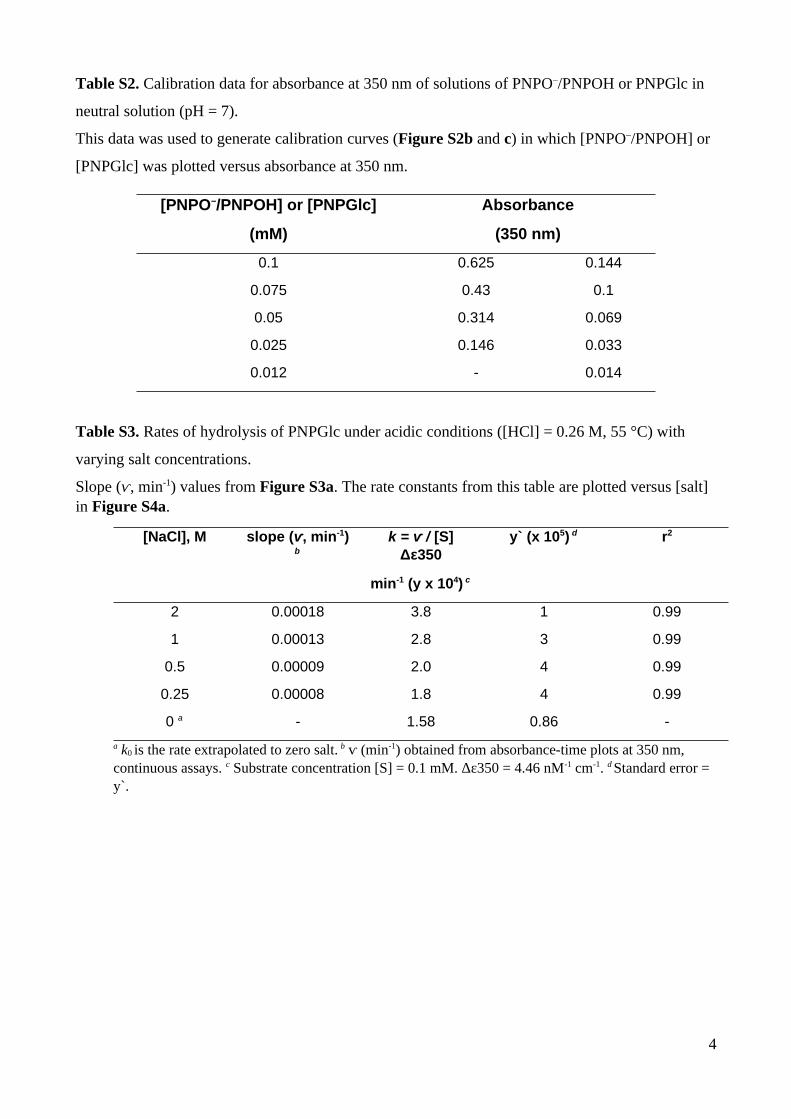
Table S2. Calibration data for absorbance at 350 nm of solutions of PNPO–/PNPOH or PNPGlc in
neutral solution (pH = 7).
This data was used to generate calibration curves (Figure S2b and c) in which [PNPO–/PNPOH] or
[PNPGlc] was plotted versus absorbance at 350 nm.
[PNPO–/PNPOH] or [PNPGlc] Absorbance
(mM) (350 nm)
0.1 0.625 0.144
0.075 0.43 0.1
0.05 0.314 0.069
0.025 0.146 0.033
0.012 - 0.014
Table S3. Rates of hydrolysis of PNPGlc under acidic conditions ([HCl] = 0.26 M, 55 °C) with
varying salt concentrations.
Slope (ⱱ, min-1) values from Figure S3a. The rate constants from this table are plotted versus [salt] in Figure S4a.
[NaCl], M slope (ⱱ, min-1)b
k = ⱱ / [S]Δε350
min-1 (y x 104) c
y` (x 105) d r2
2 0.00018 3.8 1 0.99
1 0.00013 2.8 3 0.99
0.5 0.00009 2.0 4 0.99
0.25 0.00008 1.8 4 0.99
0 a - 1.58 0.86 -
a k0 is the rate extrapolated to zero salt. b ⱱ (min-1) obtained from absorbance-time plots at 350 nm, continuous assays. c Substrate concentration [S] = 0.1 mM. Δε350 = 4.46 nM-1 cm-1. d Standard error = y`.
4
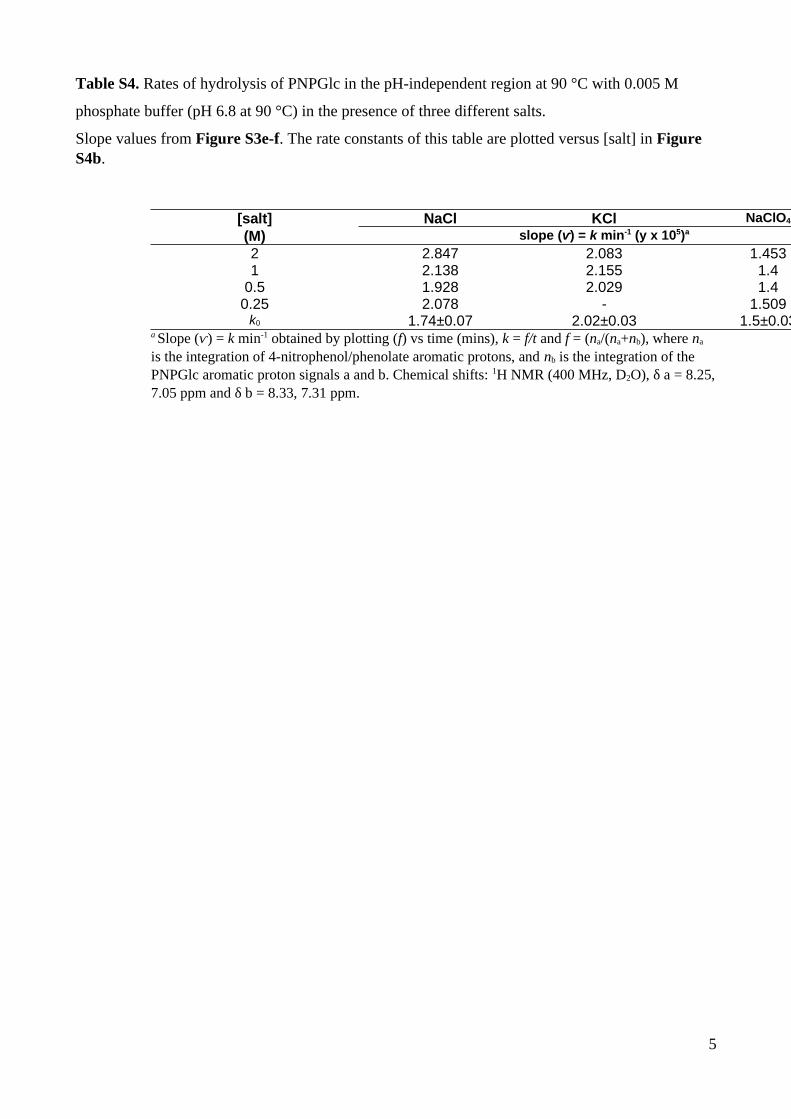
Table S4. Rates of hydrolysis of PNPGlc in the pH-independent region at 90 °C with 0.005 M
phosphate buffer (pH 6.8 at 90 °C) in the presence of three different salts.
Slope values from Figure S3e-f. The rate constants of this table are plotted versus [salt] in Figure S4b.
[salt] NaCl KCl NaClO4
(M) slope (ⱱ) = k min-1 (y x 105)a
2 2.847 2.083 1.4531 2.138 2.155 1.4
0.5 1.928 2.029 1.40.25 2.078 - 1.509k0 1.74±0.07 2.02±0.03 1.5±0.03
a Slope (ⱱ) = k min-1 obtained by plotting (f) vs time (mins), k = f/t and f = (na/(na+nb), where na is the integration of 4-nitrophenol/phenolate aromatic protons, and nb is the integration of the PNPGlc aromatic proton signals a and b. Chemical shifts: 1H NMR (400 MHz, D2O), δ a = 8.25,7.05 ppm and δ b = 8.33, 7.31 ppm.
5
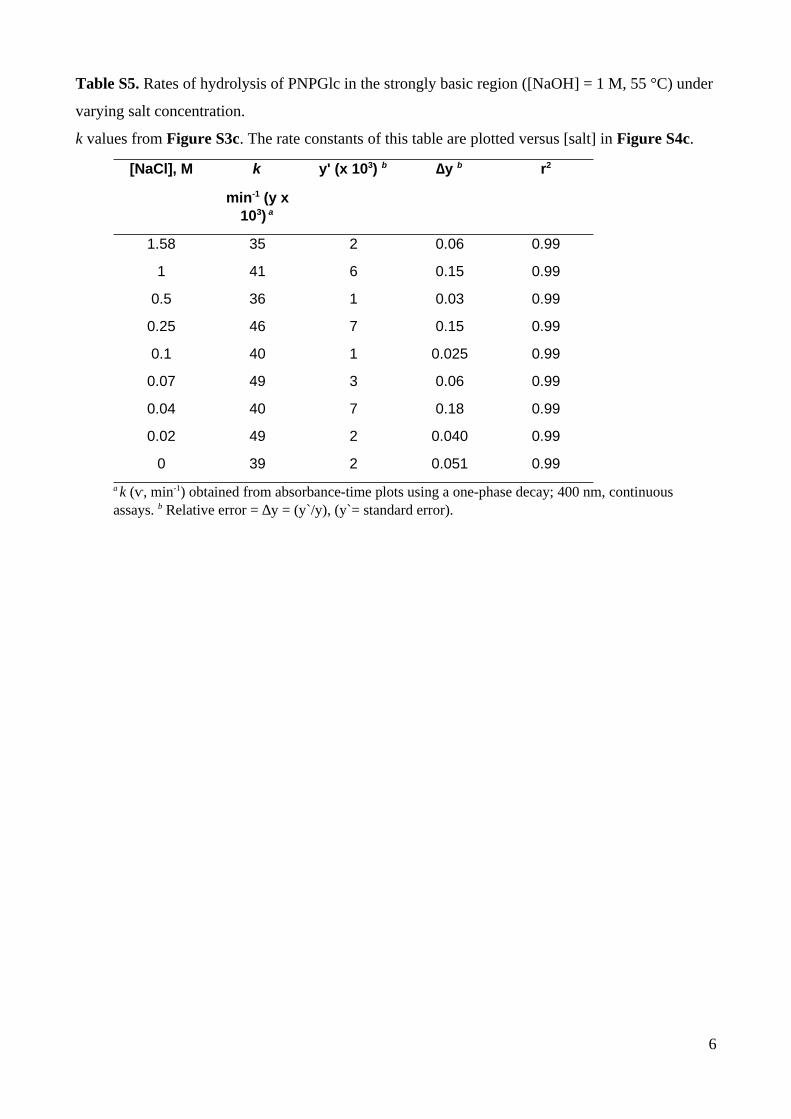
Table S5. Rates of hydrolysis of PNPGlc in the strongly basic region ([NaOH] = 1 M, 55 °C) under
varying salt concentration.
k values from Figure S3c. The rate constants of this table are plotted versus [salt] in Figure S4c.
[NaCl], M k
min-1 (y x103) a
y' (x 103) b ∆y b r2
1.58 35 2 0.06 0.99
1 41 6 0.15 0.99
0.5 36 1 0.03 0.99
0.25 46 7 0.15 0.99
0.1 40 1 0.025 0.99
0.07 49 3 0.06 0.99
0.04 40 7 0.18 0.99
0.02 49 2 0.040 0.99
0 39 2 0.051 0.99
a k (ⱱ, min-1) obtained from absorbance-time plots using a one-phase decay; 400 nm, continuous assays. b Relative error = ∆y = (y`/y), (y`= standard error).
6
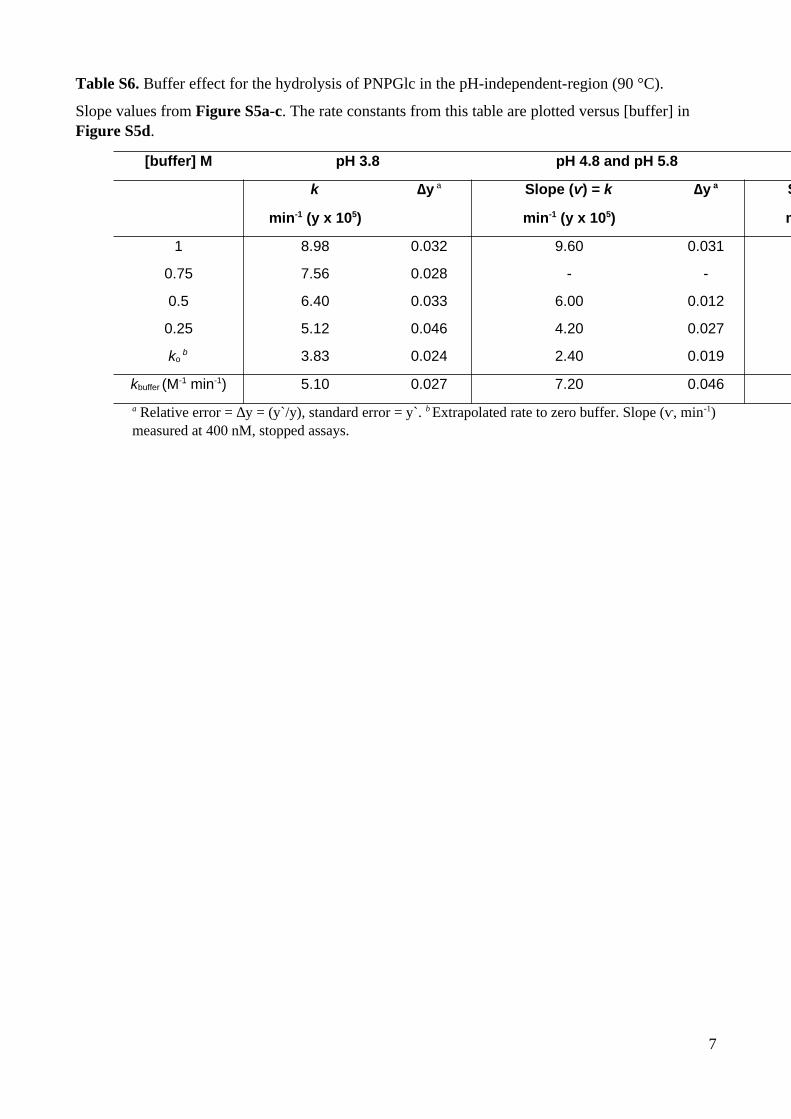
Table S6. Buffer effect for the hydrolysis of PNPGlc in the pH-independent-region (90 °C).
Slope values from Figure S5a-c. The rate constants from this table are plotted versus [buffer] in Figure S5d.
[buffer] M pH 3.8 pH 4.8 and pH 5.8
k
min-1 (y x 105)
∆y a Slope (ⱱ) = k
min-1 (y x 105)
∆y a Slope (
min
1 8.98 0.032 9.60 0.031
0.75 7.56 0.028 - -
0.5 6.40 0.033 6.00 0.012
0.25 5.12 0.046 4.20 0.027
ko b 3.83 0.024 2.40 0.019
kbuffer (M-1 min-1) 5.10 0.027 7.20 0.046
a Relative error = ∆y = (y`/y), standard error = y`. b Extrapolated rate to zero buffer. Slope (ⱱ, min-1)measured at 400 nM, stopped assays.
7
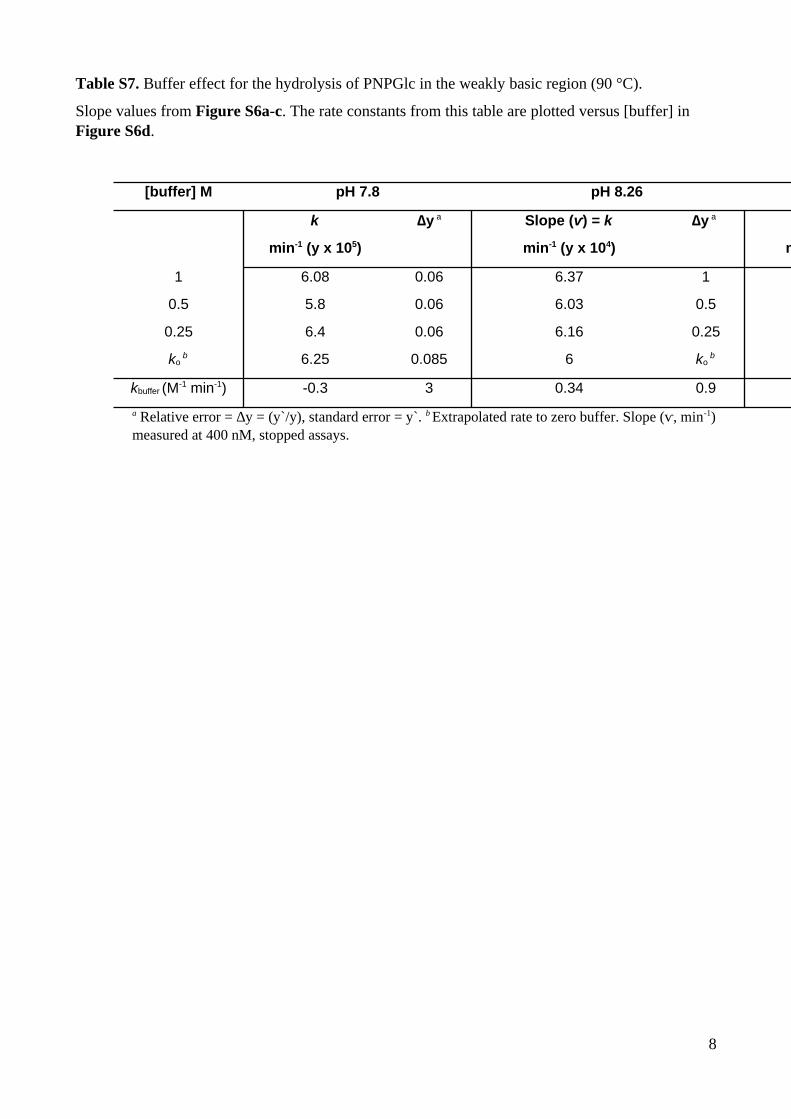
Table S7. Buffer effect for the hydrolysis of PNPGlc in the weakly basic region (90 °C).
Slope values from Figure S6a-c. The rate constants from this table are plotted versus [buffer] in Figure S6d.
[buffer] M pH 7.8 pH 8.26
k ∆y a Slope (ⱱ) = k ∆y a
min-1 (y x 105) min-1 (y x 104) min
1 6.08 0.06 6.37 1
0.5 5.8 0.06 6.03 0.5
0.25 6.4 0.06 6.16 0.25
ko b 6.25 0.085 6 ko
b
kbuffer (M-1 min-1) -0.3 3 0.34 0.9
a Relative error = ∆y = (y`/y), standard error = y`. b Extrapolated rate to zero buffer. Slope (ⱱ, min-1)measured at 400 nM, stopped assays.
8
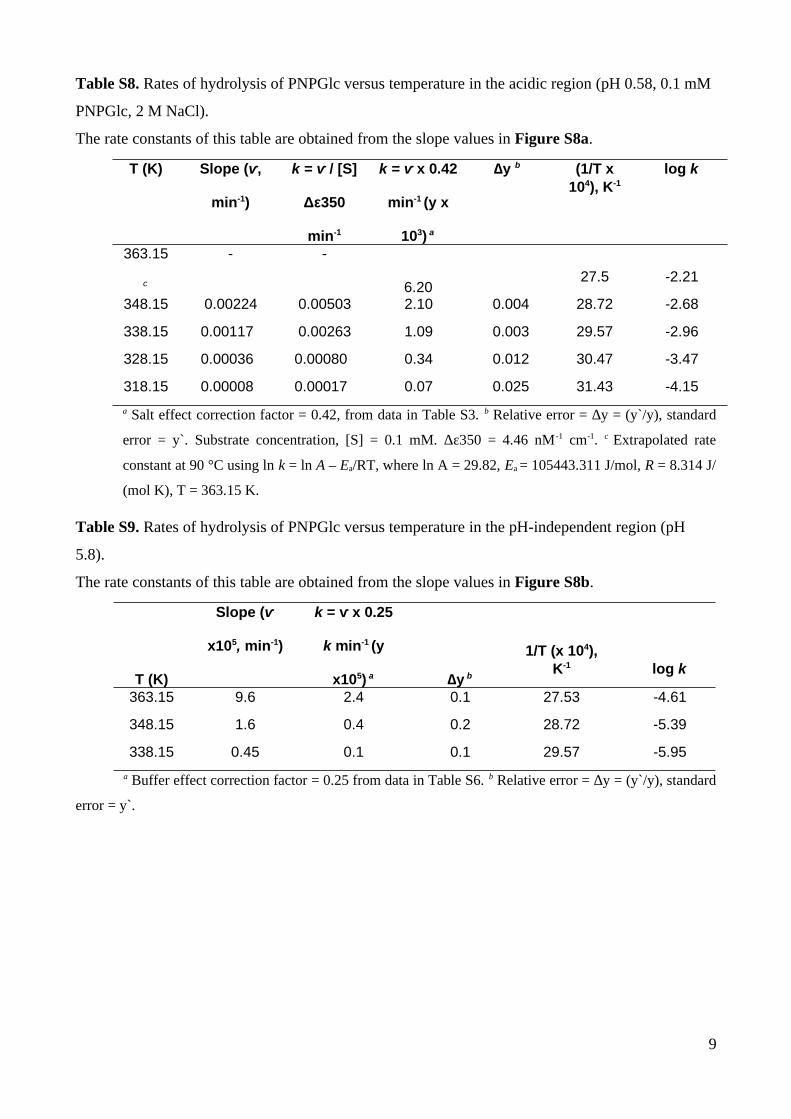
Table S8. Rates of hydrolysis of PNPGlc versus temperature in the acidic region (pH 0.58, 0.1 mM
PNPGlc, 2 M NaCl).
The rate constants of this table are obtained from the slope values in Figure S8a.
T (K) Slope (ⱱ,
min-1)
k = ⱱ / [S]
Δε350
min-1
k = ⱱ x 0.42
min-1 (y x
103) a
∆y b (1/T x104), K-1
log k
363.15
c
- -
6.2027.5 -2.21
348.15 0.00224 0.00503 2.10 0.004 28.72 -2.68
338.15 0.00117 0.00263 1.09 0.003 29.57 -2.96
328.15 0.00036 0.00080 0.34 0.012 30.47 -3.47
318.15 0.00008 0.00017 0.07 0.025 31.43 -4.15
a Salt effect correction factor = 0.42, from data in Table S3. b Relative error = ∆y = (y`/y), standard
error = y`. Substrate concentration, [S] = 0.1 mM. Δε350 = 4.46 nM -1 cm-1. c Extrapolated rate
constant at 90 °C using ln k = ln A – Ea/RT, where ln A = 29.82, Ea = 105443.311 J/mol, R = 8.314 J/
(mol K), T = 363.15 K.
Table S9. Rates of hydrolysis of PNPGlc versus temperature in the pH-independent region (pH
5.8).
The rate constants of this table are obtained from the slope values in Figure S8b.
T (K)
Slope (ⱱ
x105, min-1)
k = ⱱ x 0.25
k min-1 (y
x105) a ∆y b
1/T (x 104),K-1 log k
363.15 9.6 2.4 0.1 27.53 -4.61
348.15 1.6 0.4 0.2 28.72 -5.39
338.15 0.45 0.1 0.1 29.57 -5.95
a Buffer effect correction factor = 0.25 from data in Table S6. b Relative error = ∆y = (y`/y), standard
error = y`.
9
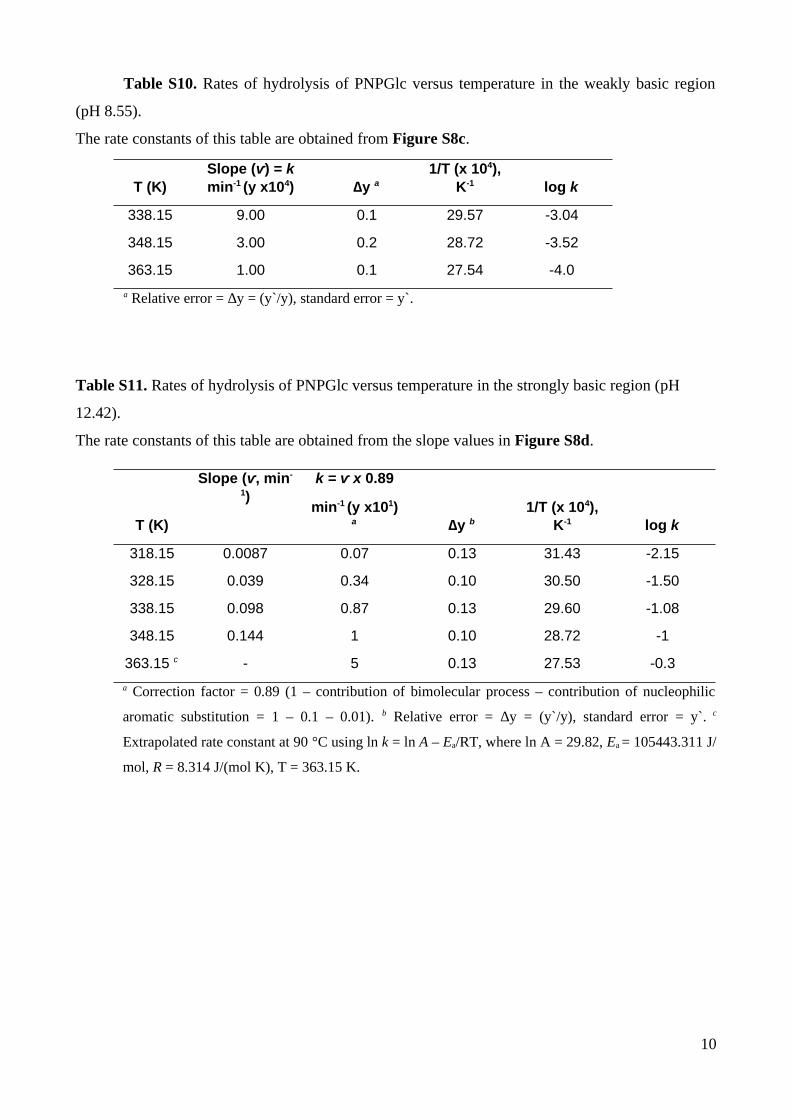
Table S10. Rates of hydrolysis of PNPGlc versus temperature in the weakly basic region
(pH 8.55).
The rate constants of this table are obtained from Figure S8c.
T (K)Slope (ⱱ) = kmin-1 (y x104) ∆y a
1/T (x 104),K-1 log k
338.15 9.00 0.1 29.57 -3.04
348.15 3.00 0.2 28.72 -3.52
363.15 1.00 0.1 27.54 -4.0
a Relative error = ∆y = (y`/y), standard error = y`.
Table S11. Rates of hydrolysis of PNPGlc versus temperature in the strongly basic region (pH
12.42).
The rate constants of this table are obtained from the slope values in Figure S8d.
T (K)
Slope (ⱱ, min-
1)k = ⱱ x 0.89
min-1 (y x101)a ∆y b
1/T (x 104),K-1 log k
318.15 0.0087 0.07 0.13 31.43 -2.15
328.15 0.039 0.34 0.10 30.50 -1.50
338.15 0.098 0.87 0.13 29.60 -1.08
348.15 0.144 1 0.10 28.72 -1
363.15 c - 5 0.13 27.53 -0.3
a Correction factor = 0.89 (1 – contribution of bimolecular process – contribution of nucleophilic
aromatic substitution = 1 – 0.1 – 0.01). b Relative error = ∆y = (y`/y), standard error = y`. c
Extrapolated rate constant at 90 °C using ln k = ln A – Ea/RT, where ln A = 29.82, Ea = 105443.311 J/
mol, R = 8.314 J/(mol K), T = 363.15 K.
10
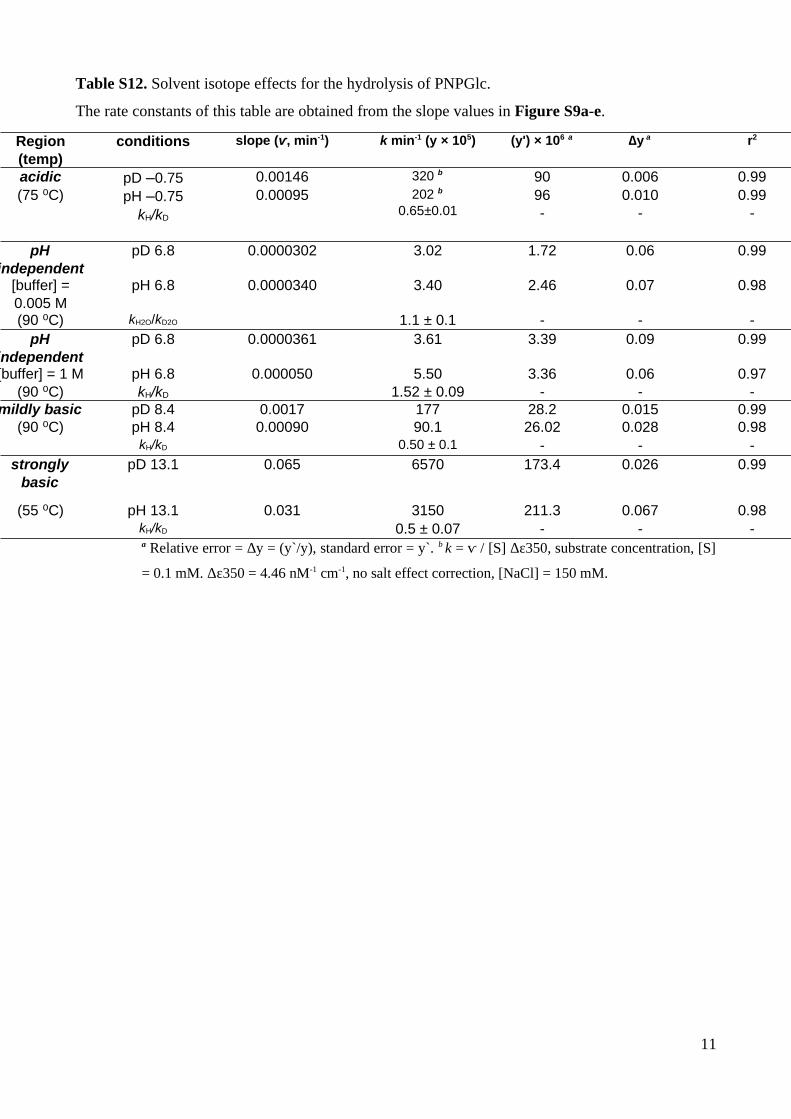
Table S12. Solvent isotope effects for the hydrolysis of PNPGlc.
The rate constants of this table are obtained from the slope values in Figure S9a-e.
Region(temp)
conditions slope (ⱱ, min-1) k min-1 (y × 105) (y') × 106 a ∆y a r2
acidic pD –0.75 0.00146 320 b 90 0.006 0.99(75 C)⁰ pH –0.75
kH/kD
0.00095 202 b
0.65±0.0196-
0.010-
0.99-
pHindependent
pD 6.8 0.0000302 3.02 1.72 0.06 0.99
[buffer] =0.005 M
pH 6.8 0.0000340 3.40 2.46 0.07 0.98
(90 C)⁰ kH2O/kD2O 1.1 ± 0.1 - - -pH
independentpD 6.8 0.0000361 3.61 3.39 0.09 0.99
[buffer] = 1 M (90 C)⁰
pH 6.8kH/kD
0.000050 5.501.52 ± 0.09
3.36-
0.06-
0.97-
mildly basic pD 8.4 0.0017 177 28.2 0.015 0.99(90 C)⁰ pH 8.4 0.00090 90.1 26.02 0.028 0.98
kH/kD 0.50 ± 0.1 - - -strongly
basicpD 13.1 0.065 6570 173.4 0.026 0.99
(55 C)⁰ pH 13.1 0.031 3150 211.3 0.067 0.98kH/kD 0.5 ± 0.07 - - -a Relative error = ∆y = (y`/y), standard error = y`. b k = ⱱ / [S] Δε350, substrate concentration, [S]
= 0.1 mM. Δε350 = 4.46 nM-1 cm-1, no salt effect correction, [NaCl] = 150 mM.
11
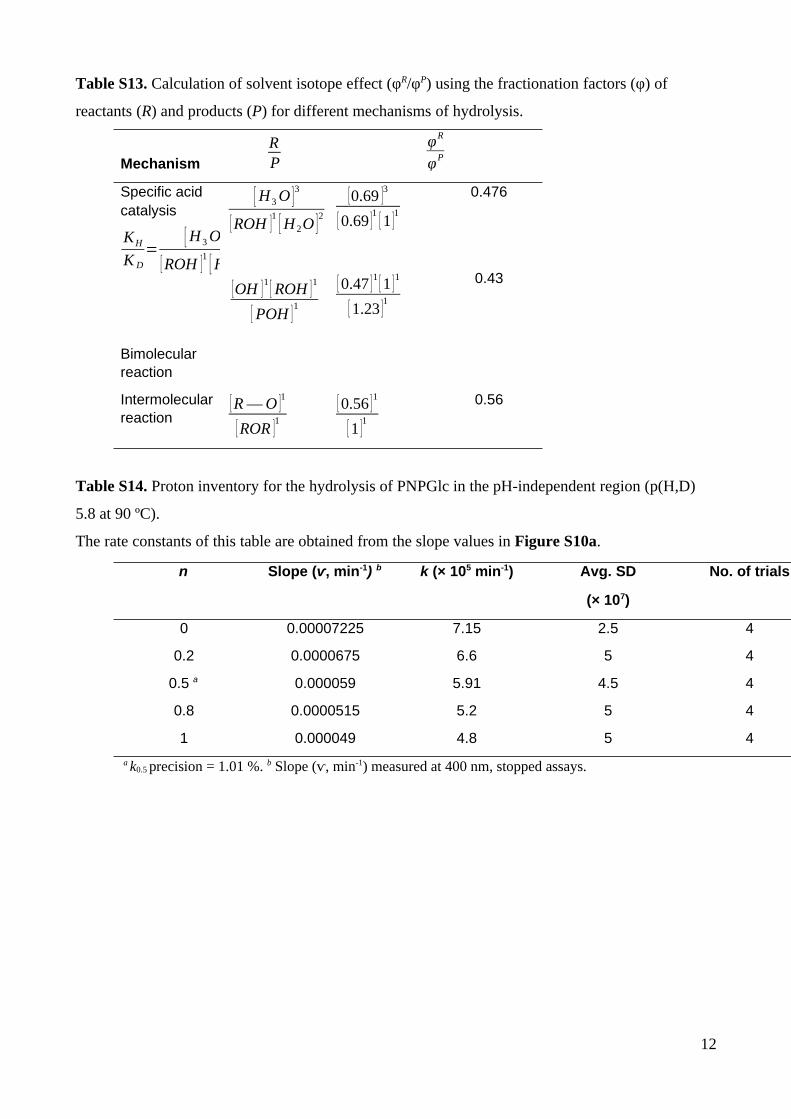
Table S13. Calculation of solvent isotope effect (φR/φP) using the fractionation factors (φ) of
reactants (R) and products (P) for different mechanisms of hydrolysis.
Mechanism
RP
φR
φP
Specific acid catalysis
KH
K D
=[ H 3 O ]
3
[ ROH ]1
[ H 2O ]2
Bimolecular reaction
[ H3 O ]3
[ ROH ]1
[ H 2O ]2
[OH ]1
[ ROH ]1
[ POH ]1
[0.69 ]3
[ 0.69 ]1
[ 1 ]1
[ 0.47 ]1
[ 1 ]1
[ 1.23 ]1
0.476
0.43
Intermolecularreaction
[ R ― O ]1
[ ROR ]1
[ 0.56 ]1
[ 1 ]1
0.56
Table S14. Proton inventory for the hydrolysis of PNPGlc in the pH-independent region (p(H,D)
5.8 at 90 ºC).
The rate constants of this table are obtained from the slope values in Figure S10a.
n Slope (ⱱ, min-1) b k (× 105 min-1) Avg. SD
(× 107)
No. of trials
0 0.00007225 7.15 2.5 4
0.2 0.0000675 6.6 5 4
0.5 a 0.000059 5.91 4.5 4
0.8 0.0000515 5.2 5 4
1 0.000049 4.8 5 4
a k0.5 precision = 1.01 %. b Slope (ⱱ, min-1) measured at 400 nm, stopped assays.
12
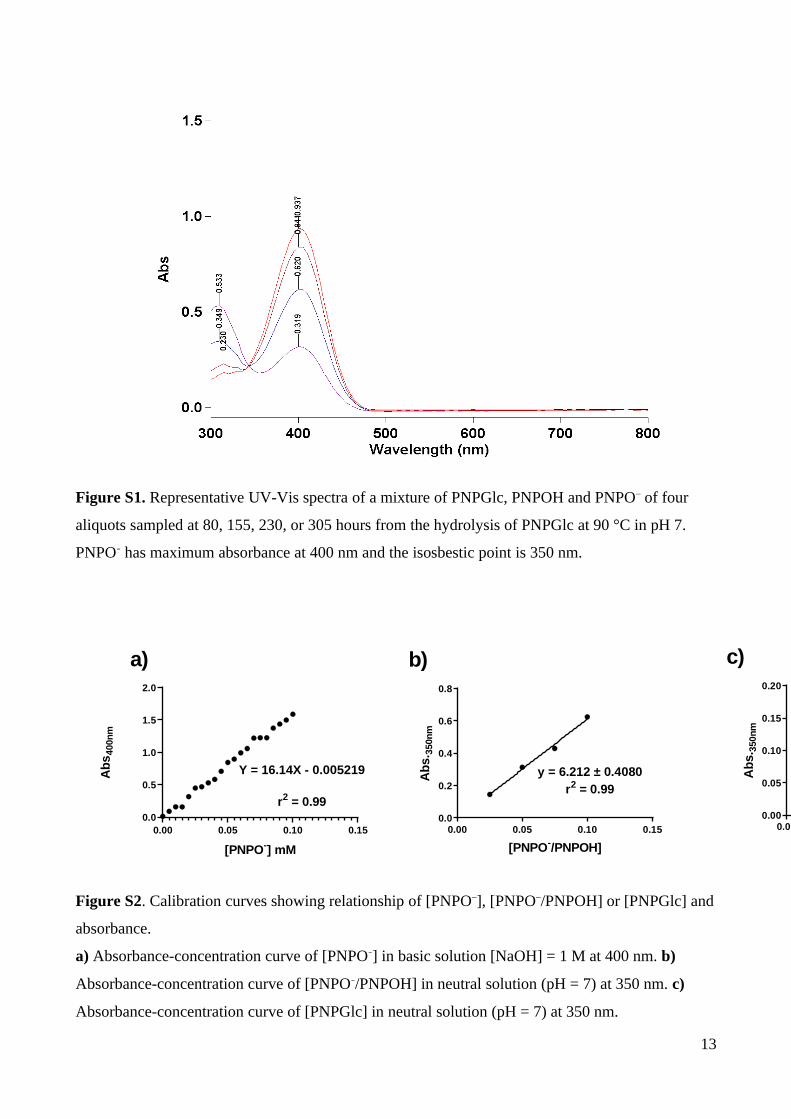
Figure S1. Representative UV-Vis spectra of a mixture of PNPGlc, PNPOH and PNPO– of four
aliquots sampled at 80, 155, 230, or 305 hours from the hydrolysis of PNPGlc at 90 °C in pH 7.
PNPO– has maximum absorbance at 400 nm and the isosbestic point is 350 nm.
0.00 0.05 0.10 0.150.0
0.5
1.0
1.5
2.0
[PNPO-] mM
Ab
s40
0nm
Y = 16.14X - 0.005219
r2 = 0.99
0.00 0.05 0.10 0.150.0
0.2
0.4
0.6
0.8
y = 6.212 ± 0.4080r2 = 0.99
[PNPO-/PNPOH]
Ab
s.35
0nm
0.00 0.05 0.10 0.150.00
0.05
0.10
0.15
0.20
y =1.448 ± 0.04595
r2 = 0.99
[PNPGlc] mM
Ab
s.35
0nm
a) b) c)
Figure S2. Calibration curves showing relationship of [PNPO–], [PNPO–/PNPOH] or [PNPGlc] and
absorbance.
a) Absorbance-concentration curve of [PNPO–] in basic solution [NaOH] = 1 M at 400 nm. b)
Absorbance-concentration curve of [PNPO–/PNPOH] in neutral solution (pH = 7) at 350 nm. c)
Absorbance-concentration curve of [PNPGlc] in neutral solution (pH = 7) at 350 nm.
13

14
0 200 400 600 8000.00
0.02
0.04
0.06
Time (min)
Abs
350
nm
0.25 M [NaCl]
0.5 M [NaCl]
1 M [NaCl]
2M [NaCl]
0 20 40 60 800.0
0.5
1.0
1.5
1.58 M [NaCl]
1 M [NaCl]
0.5 M [NaCl]
0.25 M [NaCl]
0 M [NaCl]
Time (min)
Ab
s. 4
00n
m
0 100 200 3000.00
0.05
0.10
0.15
0.20
Time (min)
ln A
(4
00)/A
(4
00)-A
t(40
0)
1M [NaCl]
0.25M [NaCl]
5000 10000 150000.0
0.1
0.2
0.3
0.4
0.5 2M [NaCl}1M [NaCl]0.5M [NaCl]0.25M [NaCl]
Time (min)
Inte
gra
tio
n o
f p
rod
uct
0 5000 10000 150000.0
0.1
0.2
0.3
0.4
1M [KCl]0.5M [KCl]
Time (min)
Inte
gra
tio
n o
f p
rod
uct
2M [KCl]
0 5000 10000 150000.0
0.1
0.2
0.3
0.42M [NaClO4]1M [NaClO4]0.5M [NaClO4]0.25M [NaClO4]
Time (min)
Inte
gra
tio
n o
f p
rod
uct
a) b) c)
d) e) f)
Figure S3. Plots showing formation of product versus time for salt effect upon the hydrolysis of
PNPGlc in acidic, pH-independent and basic regions.
a) Absorbance-time curves for salt effect in the acidic region in [HCl] = 0.26 M at 55 °C. b)
Absorbance-time curves for salt effect in the weakly basic region in pH 8.4 at 90 °C. c)
Absorbance-time curves for salt effect in the strongly basic region in [NaOH] = 1 M at 55 °C. d-f)
Product ratio integration-time curves (1H NMR) for salt effect in the pH-independent region for
[buffer] = 0.005 M, pH 6.8 at 90 °C in the presence of three different salts (NaCl, KCl, or NaClO4).
0.0 0.5 1.0 1.5 2.0 2.50.0001
0.0002
0.0003
0.0004
0.0005
[NaCl] M
k m
in-1
Y = 0.00012X + 0.00015
r2 = 0.99
0.0 0.5 1.0 1.5 2.0 2.50.00000
0.00001
0.00002
0.00003
0.00004 NaClKClNaClO4
[Salt] M
k m
in-1
0.0 0.5 1.0 1.5 2.0
0.02
0.04
0.06
[NaCl] M
km
in-1
a) b) c)
Figure S4. Plots showing the dependencies of the hydrolysis rate constants of PNPGlc on the
concentration of salt in the acidic region, pH-independent region, and strongly basic region.
a) Salt effect and rate constant extrapolation to zero salt in the acidic region ([HCl] = 0.26 M at 55
°C). b) Salt effect in the pH-independent region ([buffer] = 0.005 M, pH 6.8 at 90 °C). c) Salt effect
in the strongly basic region ([NaOH] = 1 M at 55 °C).
15
0 2000 4000 6000 80000.0
0.2
0.4
0.6
0.8
Time (min-1)
ln A
(4
00)/(
A(4
00)
- A(4
00)
t) 1M
0.75M
0.25M
0.5M
0 2000 4000 6000 80000.0
0.2
0.4
0.6
0.8
Time (min-1)
ln A
(4
00)/(
A(4
00)
- A(4
00)
t) 1M
0.5M
0.25M
0 2000 4000 6000 80000.0
0.2
0.4
0.6
Time (min-1)
ln A
(4
00)/(
A(4
00)
- A(4
00)
t) 1M
0.75M
0.5M
0.25M
a) b) c)
0.0 0.2 0.4 0.6 0.8 1.00.00000
0.00002
0.00004
0.00006
0.00008
0.00010
[buffer] M
k m
in-1
pH 3.8
pH 4.8
pH 6.8
d)
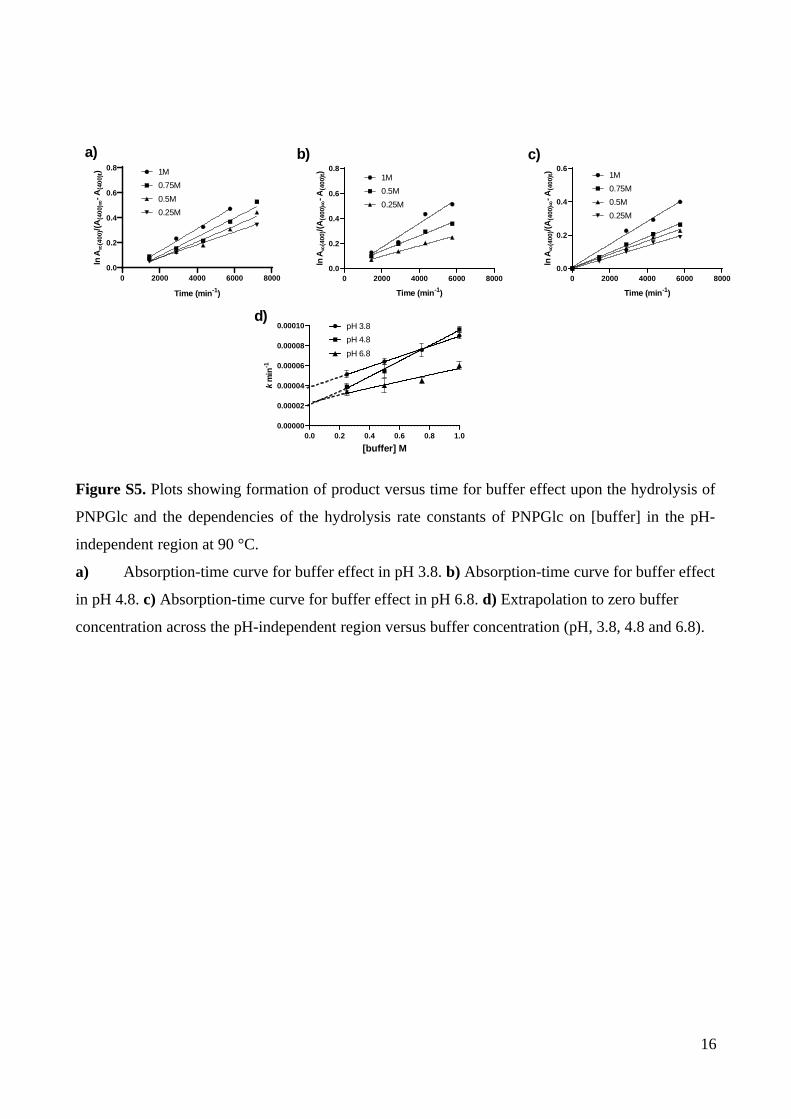
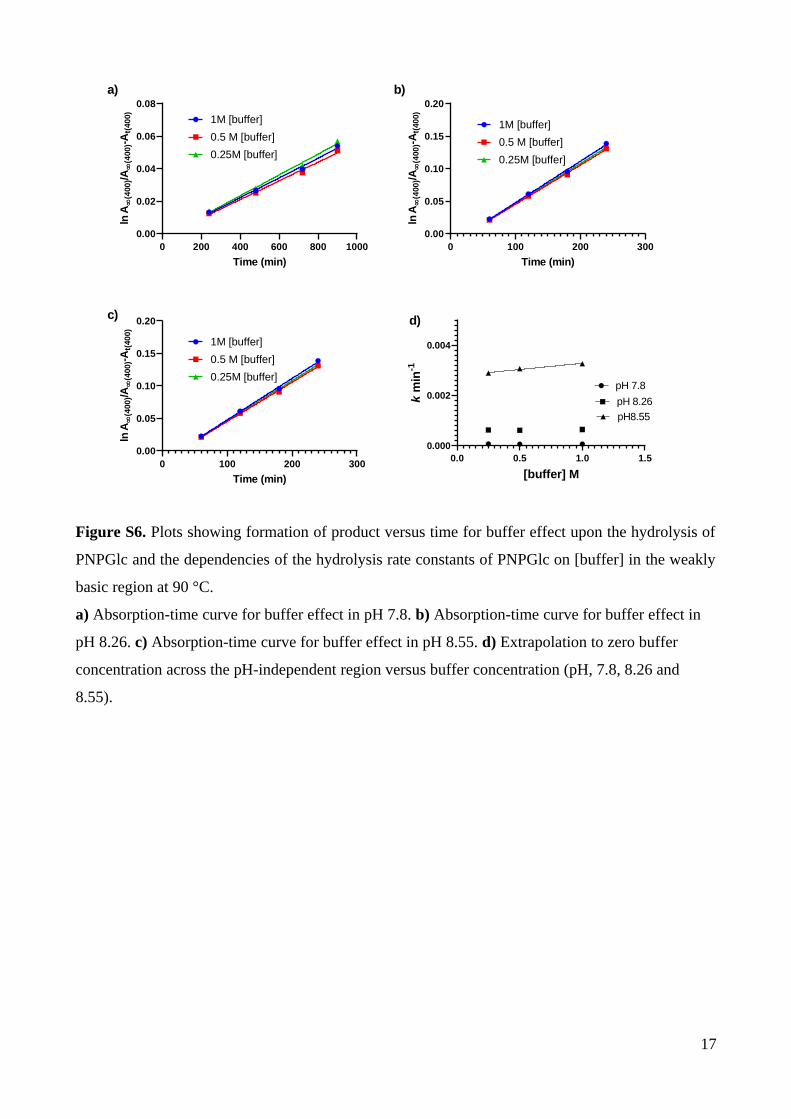
Figure S5. Plots showing formation of product versus time for buffer effect upon the hydrolysis of
PNPGlc and the dependencies of the hydrolysis rate constants of PNPGlc on [buffer] in the pH-
independent region at 90 °C.
a) Absorption-time curve for buffer effect in pH 3.8. b) Absorption-time curve for buffer effect
in pH 4.8. c) Absorption-time curve for buffer effect in pH 6.8. d) Extrapolation to zero buffer
concentration across the pH-independent region versus buffer concentration (pH, 3.8, 4.8 and 6.8).
16
0 200 400 600 800 10000.00
0.02
0.04
0.06
0.08
Time (min)
ln A
(4
00)/A
(4
00)-A
t(40
0) 1M [buffer]
0.5 M [buffer]
0.25M [buffer]
0 100 200 3000.00
0.05
0.10
0.15
0.20
Time (min)
ln A
(4
00)/A
(4
00)-A
t(40
0)
1M [buffer]
0.5 M [buffer]
0.25M [buffer]
0 100 200 3000.00
0.05
0.10
0.15
0.20
Time (min)
ln A
(4
00)/A
(4
00)-A
t(40
0)
1M [buffer]
0.5 M [buffer]
0.25M [buffer]
0.0 0.5 1.0 1.50.000
0.002
0.004
[buffer] M
km
in-1
pH 7.8
pH 8.26
pH8.55
a) b)
c) d)
Figure S6. Plots showing formation of product versus time for buffer effect upon the hydrolysis of
PNPGlc and the dependencies of the hydrolysis rate constants of PNPGlc on [buffer] in the weakly
basic region at 90 °C.
a) Absorption-time curve for buffer effect in pH 7.8. b) Absorption-time curve for buffer effect in
pH 8.26. c) Absorption-time curve for buffer effect in pH 8.55. d) Extrapolation to zero buffer
concentration across the pH-independent region versus buffer concentration (pH, 7.8, 8.26 and
8.55).
17
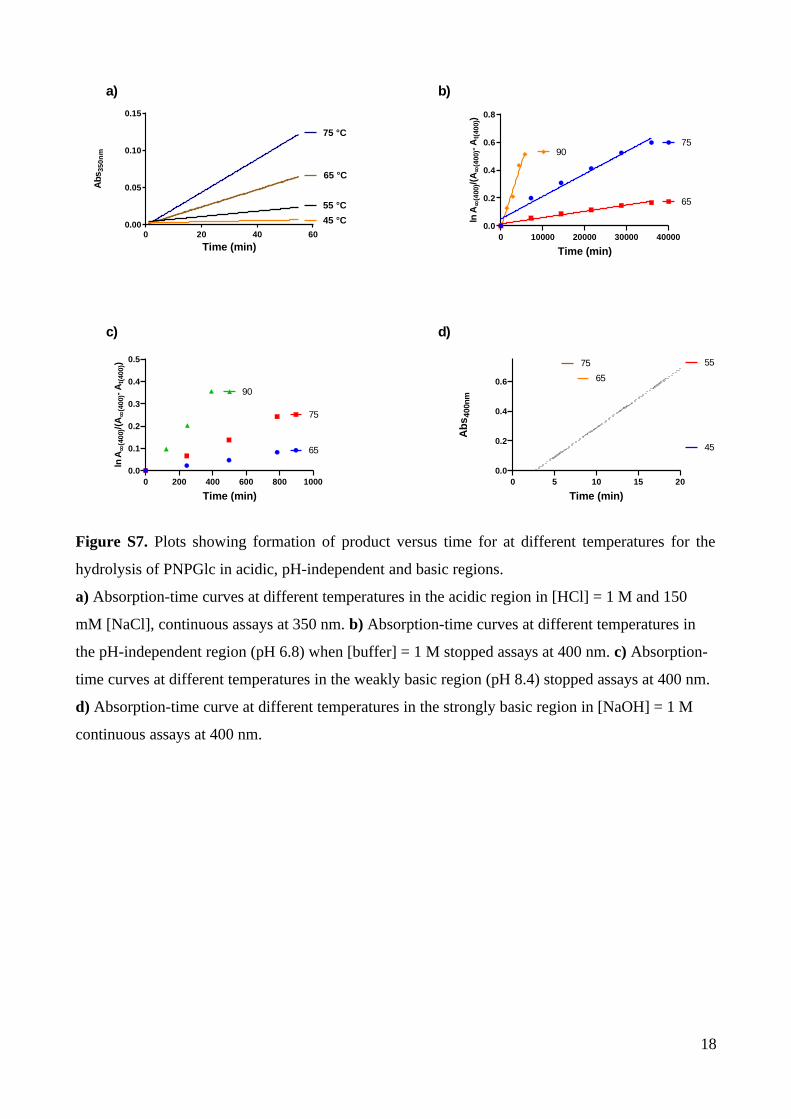
0 20 40 600.00
0.05
0.10
0.15
75 °C
65 °C
55 °C
45 °C
Time (min)
Abs
35
0n
m
0 10000 20000 30000 400000.0
0.2
0.4
0.6
0.8
Time (min)
ln A
(4
00)/(
A
(400
)- A
t(40
0))
75
65
90
0 200 400 600 800 10000.0
0.1
0.2
0.3
0.4
0.5
Time (min)
ln A
(4
00)/(
A
(400
)- A
t(40
0))
65
75
90
0 5 10 15 200.0
0.2
0.4
0.6
Time (min)
Ab
s40
0nm
45
65
75 55
a) b)
c) d)
Figure S7. Plots showing formation of product versus time for at different temperatures for the
hydrolysis of PNPGlc in acidic, pH-independent and basic regions.
a) Absorption-time curves at different temperatures in the acidic region in [HCl] = 1 M and 150
mM [NaCl], continuous assays at 350 nm. b) Absorption-time curves at different temperatures in
the pH-independent region (pH 6.8) when [buffer] = 1 M stopped assays at 400 nm. c) Absorption-
time curves at different temperatures in the weakly basic region (pH 8.4) stopped assays at 400 nm.
d) Absorption-time curve at different temperatures in the strongly basic region in [NaOH] = 1 M
continuous assays at 400 nm.
18
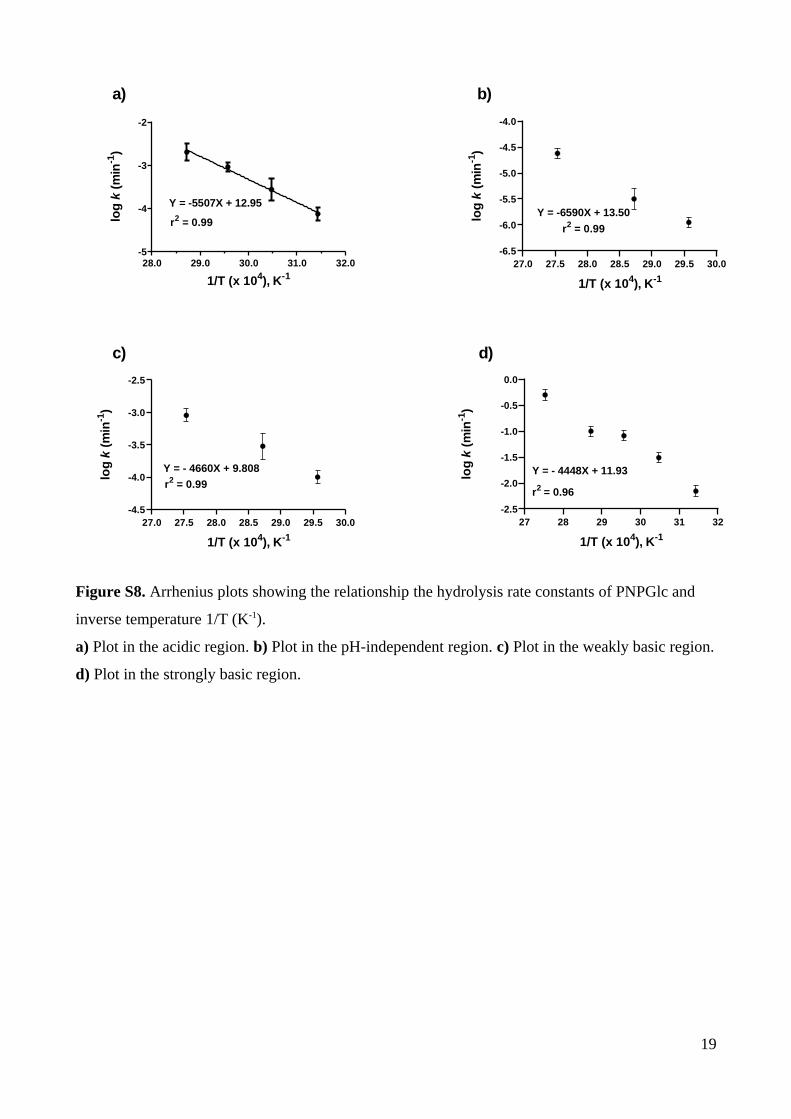
28.0 29.0 30.0 31.0 32.0-5
-4
-3
-2
1/T (x 104), K-1
log
k (
min
-1)
Y = -5507X + 12.95
r2 = 0.99
27.0 27.5 28.0 28.5 29.0 29.5 30.0-6.5
-6.0
-5.5
-5.0
-4.5
-4.0
1/T (x 104), K-1
log
k (
min
-1)
Y = -6590X + 13.50
r2 = 0.99
27.0 27.5 28.0 28.5 29.0 29.5 30.0-4.5
-4.0
-3.5
-3.0
-2.5
1/T (x 104), K-1
log
k (
min
-1)
Y = - 4660X + 9.808
r2 = 0.99
27 28 29 30 31 32-2.5
-2.0
-1.5
-1.0
-0.5
0.0
1/T (x 104), K-1
log
k(m
in-1
)
r2 = 0.96
Y = - 4448X + 11.93
a) b)
c) d)
Figure S8. Arrhenius plots showing the relationship the hydrolysis rate constants of PNPGlc and
inverse temperature 1/T (K-1).
a) Plot in the acidic region. b) Plot in the pH-independent region. c) Plot in the weakly basic region.
d) Plot in the strongly basic region.
19
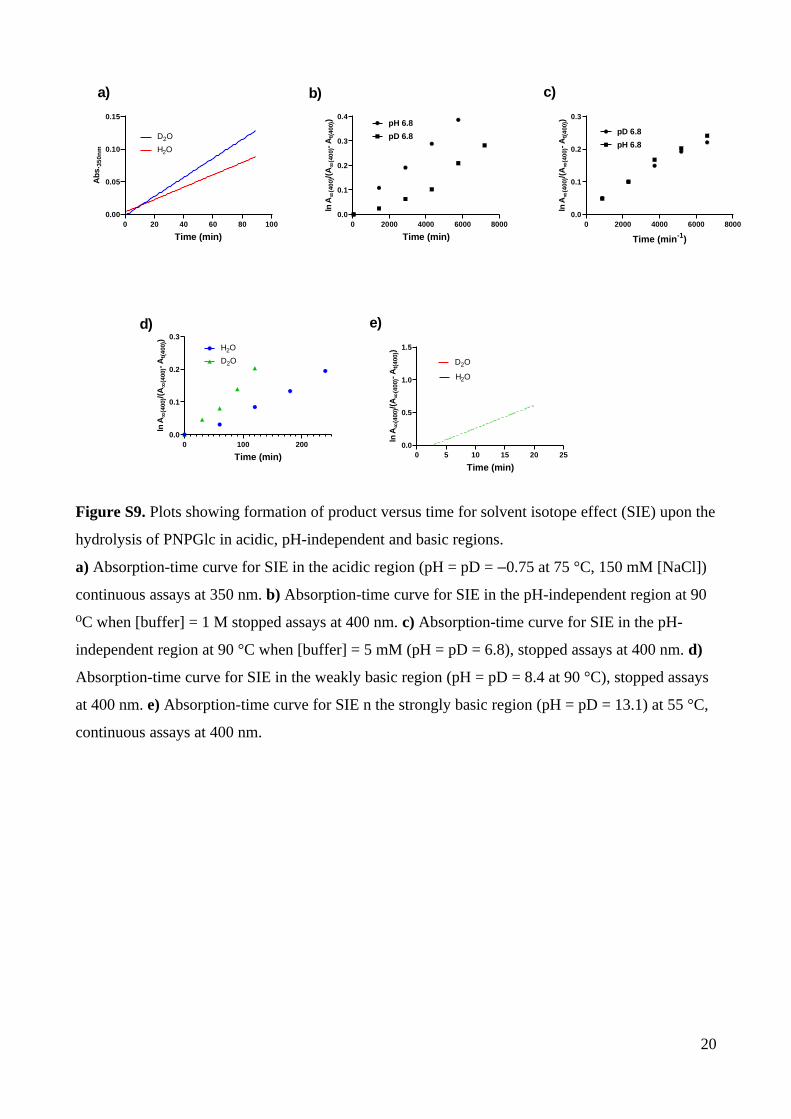
0 20 40 60 80 1000.00
0.05
0.10
0.15
Time (min)
Ab
s.3
50
nm
D2O
H2O
0 2000 4000 6000 80000.0
0.1
0.2
0.3
0.4
Time (min)
ln A
(4
00)
/(A
(4
00)
- At(
400)
) pH 6.8
pD 6.8
0 2000 4000 6000 80000.0
0.1
0.2
0.3
Time (min-1)
ln A
(4
00)/(
A
(400
)- A
t(4
00))
pD 6.8
pH 6.8
0 100 2000.0
0.1
0.2
0.3
Time (min)
ln A
(4
00)/(
A
(400
)- A
t(4
00))
H2O
D2O
0 5 10 15 20 250.0
0.5
1.0
1.5
Time (min)
ln A
(4
00)/(
A
(400
)- A
t(4
00))
H2O
D2O
a) b) c)
d) e)
Figure S9. Plots showing formation of product versus time for solvent isotope effect (SIE) upon the
hydrolysis of PNPGlc in acidic, pH-independent and basic regions.
a) Absorption-time curve for SIE in the acidic region (pH = pD = –0.75 at 75 °C, 150 mM [NaCl])
continuous assays at 350 nm. b) Absorption-time curve for SIE in the pH-independent region at 90
C when [buffer] = 1 M stopped assays at 400 nm. ⁰ c) Absorption-time curve for SIE in the pH-
independent region at 90 °C when [buffer] = 5 mM (pH = pD = 6.8), stopped assays at 400 nm. d)
Absorption-time curve for SIE in the weakly basic region (pH = pD = 8.4 at 90 °C), stopped assays
at 400 nm. e) Absorption-time curve for SIE n the strongly basic region (pH = pD = 13.1) at 55 °C,
continuous assays at 400 nm.
20
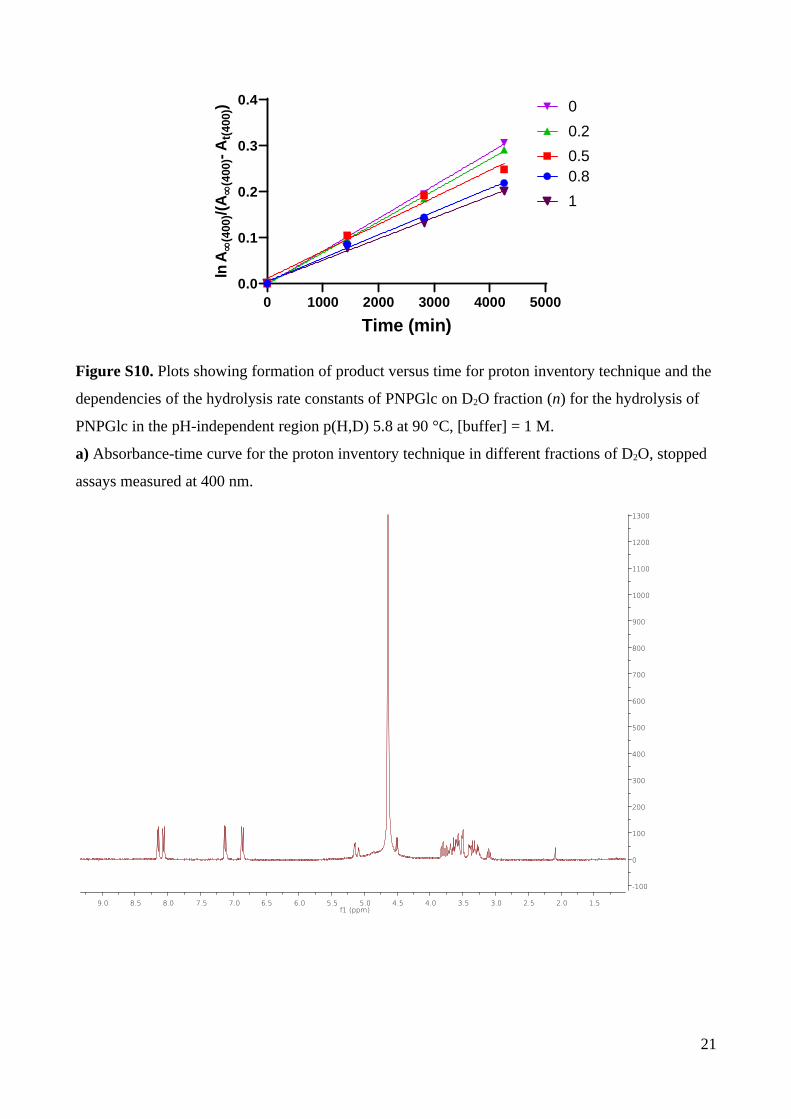
0 1000 2000 3000 4000 50000.0
0.1
0.2
0.3
0.4
Time (min)
ln A
(4
00)/(
A
(400
)- A
t(40
0))
0.80.5
0
1
0.2
Figure S10. Plots showing formation of product versus time for proton inventory technique and the
dependencies of the hydrolysis rate constants of PNPGlc on D2O fraction (n) for the hydrolysis of
PNPGlc in the pH-independent region p(H,D) 5.8 at 90 °C, [buffer] = 1 M.
a) Absorbance-time curve for the proton inventory technique in different fractions of D2O, stopped
assays measured at 400 nm.
1.52.02.53.03.54.04.55.05.56.06.57.07.58.08.59.0f1 (ppm)
-100
0
100
200
300
400
500
600
700
800
900
1000
1100
1200
1300
21
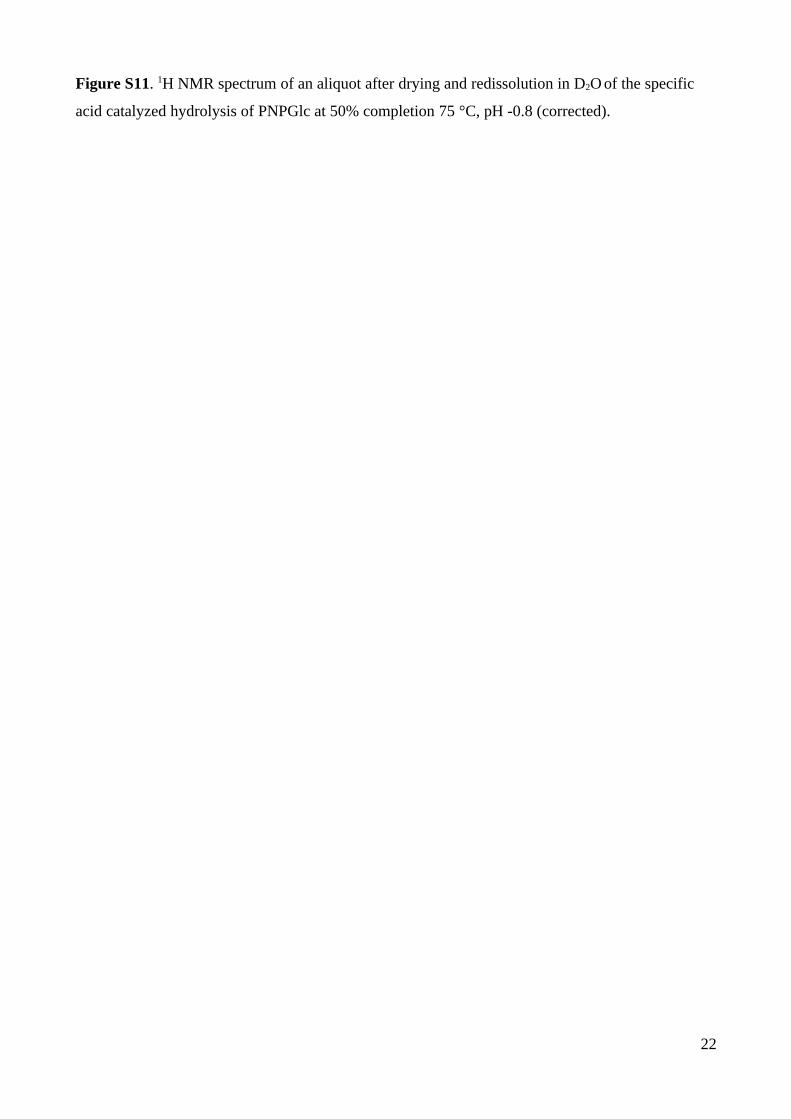
Figure S11. 1H NMR spectrum of an aliquot after drying and redissolution in D2O of the specific
acid catalyzed hydrolysis of PNPGlc at 50% completion 75 °C, pH -0.8 (corrected).
22
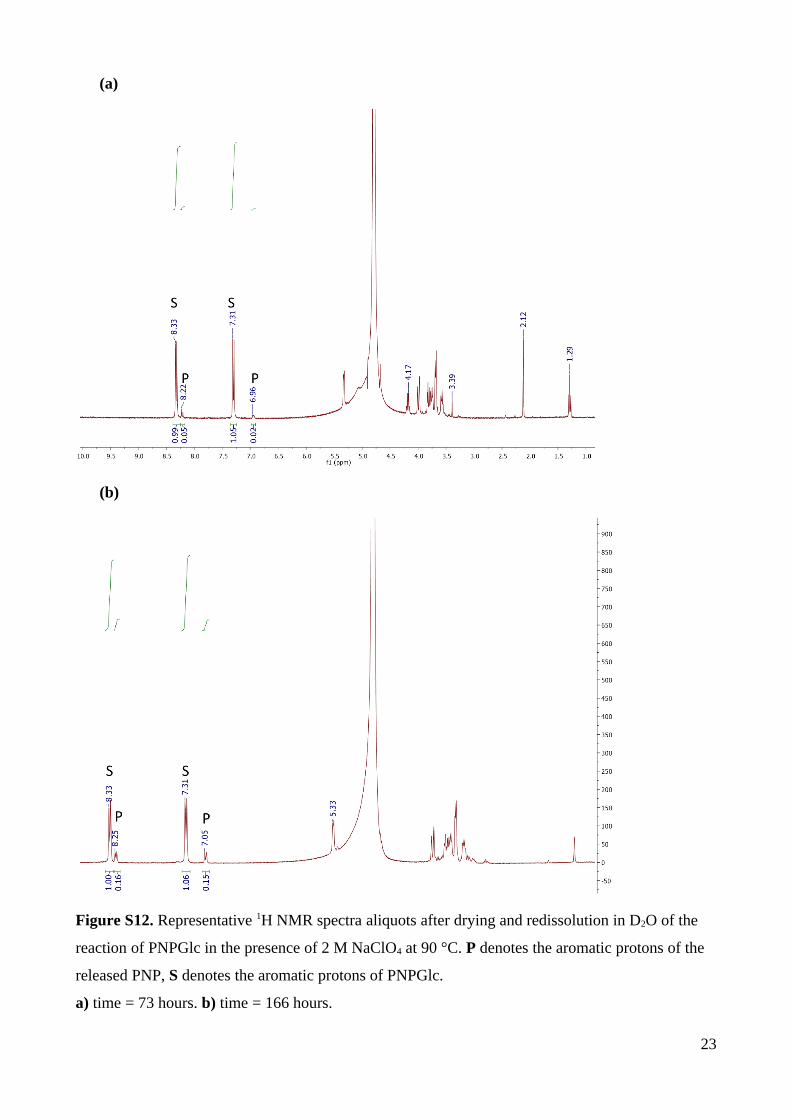
(a)
(b)
Figure S12. Representative 1H NMR spectra aliquots after drying and redissolution in D2O of the
reaction of PNPGlc in the presence of 2 M NaClO4 at 90 °C. P denotes the aromatic protons of the
released PNP, S denotes the aromatic protons of PNPGlc.
a) time = 73 hours. b) time = 166 hours.
23
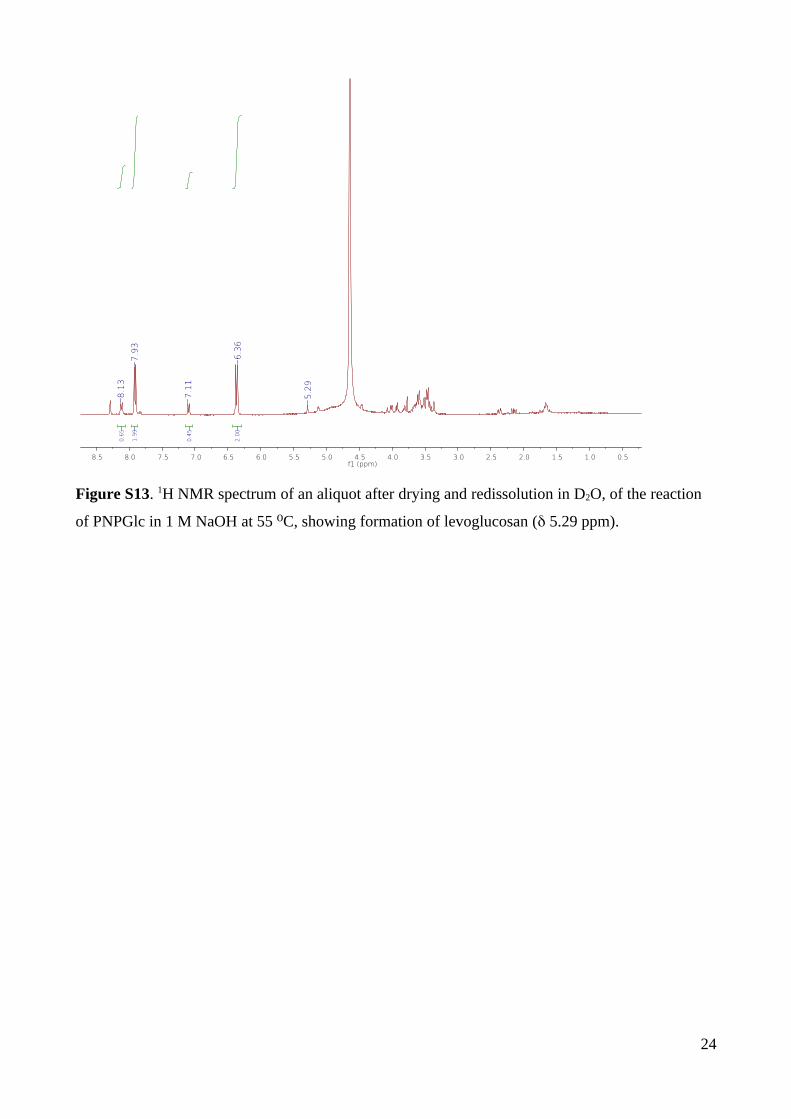
0.51.01.52.02.53.03.54.04.55.05.56.06.57.07.58.08.5f1 (ppm)
2.0
0
0.4
5
1.9
9
0.6
5
6.3
6
7.9
3
8.1
3
7.1
1
5.2
9
Figure S13. 1H NMR spectrum of an aliquot after drying and redissolution in D2O, of the reaction
of PNPGlc in 1 M NaOH at 55 C⁰ , showing formation of levoglucosan ( 5.29 ppm).
24
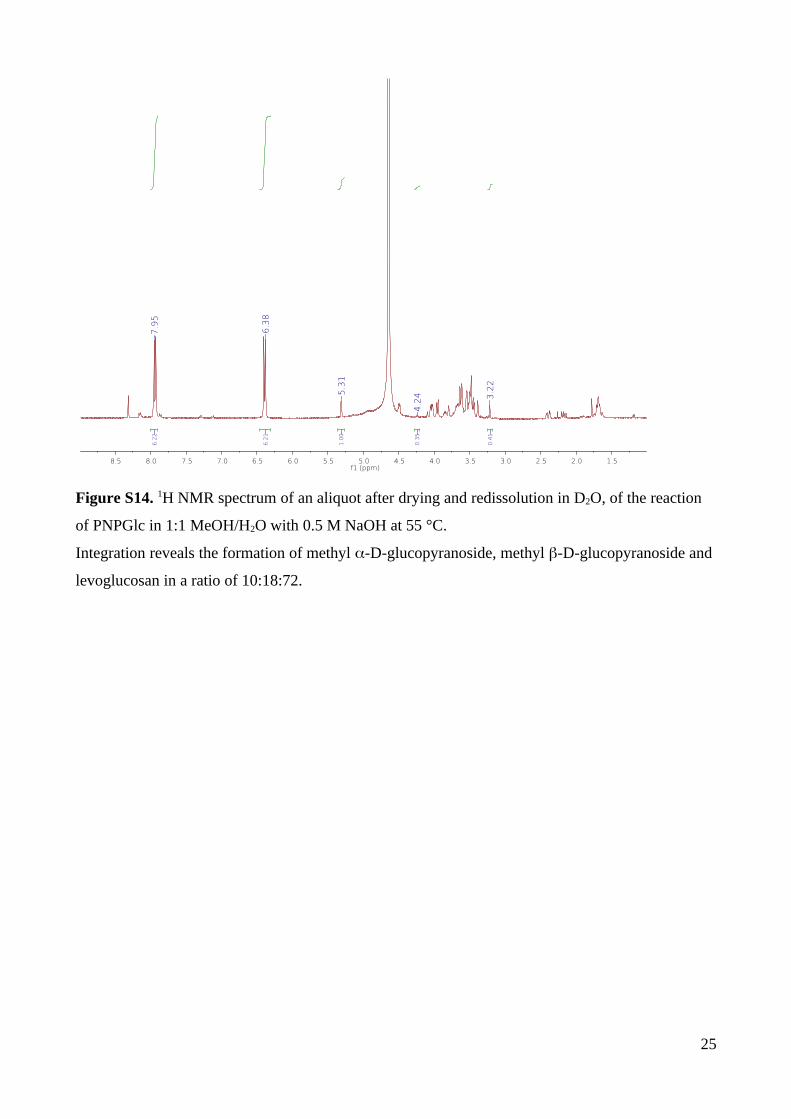
1.52.02.53.03.54.04.55.05.56.06.57.07.58.08.5f1 (ppm)
0.4
1
0.3
5
1.0
0
6.2
1
6.2
2
6.3
8
7.9
5
5.3
1
3.2
2
4.2
4
Figure S14. 1H NMR spectrum of an aliquot after drying and redissolution in D2O, of the reaction
of PNPGlc in 1:1 MeOH/H2O with 0.5 M NaOH at 55 °C.
Integration reveals the formation of methyl -D-glucopyranoside, methyl -D-glucopyranoside and
levoglucosan in a ratio of 10:18:72.
25

download fileview on ChemRxivSI_120421.docx (1.09 MiB)